1. Introduction
In drylands, due to crop growth disorders caused by drought and high temperatures, a significant portion of the food supply is dependent on imports. In such regions, stabilizing self-sufficient crop cultivation is a critical issue. For this purpose, cultivation plans must be formulated based on crop yield predictions. Rainfall is the most important data for predicting crop yields in cultivation planning. However, the infrastructure for measuring rainfall in the Sub-Saharan Africa region is not adequately developed.
On the other hand, the spread of the Internet and smartphones has been advancing in recent years, even in such regions. Farmers can record rainfall using mobile applications, and by collecting and analyzing this data via the Internet, it becomes possible to predict crop yields. Thus, a crop cultivation support system [
1] has been developed that collects rainfall recorded by farmers using homemade PET bottle rain gauges and other necessary information for crop cultivation in the cloud. By analyzing the collected data and obtaining yield predictions, the system provides farmers with appropriate timing and amounts for sowing and fertilization. There is an advantage in that it can be used without expensive IoT (Internet of Things) sensors, as long as there is an existing internet connection and a smartphone.
The crop cultivation support system allows smartphone users to receive crop yield predictions based on the data they have recorded themselves. Suppose the data obtained from this system can be provided to general agricultural workers other than smartphone users. In that case, it is believed that even regions without the Internet and smartphones can benefit from this system.
Therefore, this paper proposes providing general agricultural workers who are not using the crop cultivation support system with information based on the aggregated data obtained from the system in map format. However, the data from the crop cultivation support system contains detailed information about the agricultural worker’s fields, making it challenging to publish as is. Additionally, since the locations of the fields where data is recorded are few and scattered, the accuracy of the data becomes insufficient in regions with different weather conditions where rainfall patterns vary even slightly.
To solve these issues, we propose a visualization method that corrects the Global Satellite Mapping of Precipitation (GSMaP: Global Satellite Mapping of Precipitation) [
2], developed using multiple precipitation-observing satellites and geostationary meteorological satellites, with actual measurements obtained from the crop cultivation support system [
1].
When using GSMaP, it is necessary to note that the estimated rainfall amounts derived from satellite images may have errors compared to the rainfall amounts observed on the ground. Since errors in rainfall amounts also affect the estimated yield, the errors in rainfall data cannot be ignored in this visualization. Therefore, it is also necessary to investigate how much the rainfall error affects the estimated yield.
In this paper, as a preliminary step to implementing the visualization function, we compare the errors between estimated and actual values at two locations in Sudan and South Africa to verify their accuracy.
2. Related Work
Accurate rainfall measurement is essential for monitoring abnormal weather conditions and predicting natural disasters caused by rainfall. In recent years, satellite rainfall observation technology has rapidly developed, which can measure rainfall over vast areas. This technology is expected to contribute to understanding rainfall in regions with insufficient meteorological observation networks. One of the representative satellite datasets is GSMaP. For many years, the accuracy of GSMaP has been validated under various locations and conditions.
For example, in [
3], an investigation of the error characteristics of GSMaP_MVK, 3B42, CMORPH, PERSIANN, and NRL was conducted in the continental United States. It was found that GSMaP_MVK significantly overestimates vital convective phenomena in summer and underestimates rainfall in winter.
In [
4], six datasets, GSMaP, CMORPH, 3B42, PERSIANN, NRL, and 3B42RT, were compared, and it was found that GSMaP’s accuracy decreases for light and heavy rainfall during warm periods.
In [
5], a comparison was made between observed rainfall in the Himalayan region of Nepal and the satellite-based rainfall data GSMaP_MVK+. It was found that the prediction accuracy decreases with increasing altitude. In [
6], validation was conducted for Colombia, which has complex terrain. It was found that rainfall is overestimated in drylands and the false alarm rate is higher compared to humid regions.
The meteorological observation infrastructure in the Sub-Saharan Africa region, which is the target area of our research, is not well-developed. As a result, accurate rainfall measurement is difficult, and obtaining actual measured values for comparison with GSMaP is challenging. In this study, we attempt to validate accuracy in such regions by using data manually entered by agricultural workers in the target area.
3. The Crop Cultivation Support System
3.1. Abstract
In drylands, areas rely heavily on food imports due to crop growth problems caused by dryness and high temperatures. In such regions, stable and self-sufficient crop cultivation is a critical issue, and to achieve this, appropriate cultivation plans must be formulated and implemented. Experienced and skilled farmers can formulate their own cultivation plans, but inexperienced farmers need support in planning crop cultivation.
Formulating cultivation plans requires various types of information, but the most important factor is predicting crop yields, so we will develop and operate a system to achieve this. Subsequently, a system has been proposed to support the formulation of cultivation plans by presenting the predicted yields to farmers [
1].
3.2. Recording Rainfall
In predicting crop yields, the most important factor is soil moisture content, which is derived from rainfall. However, in the Sub-Saharan Africa region, which is the target area for this system, the infrastructure needed to record rainfall is difficult to establish. Additionally, rain clouds form sporadically in drylands, so areas surrounding recorded rainfall points only sometimes receive rain. Thus, to improve the accuracy of yield predictions in drylands, measuring the actual rainfall in each field and obtaining high-precision data is essential.
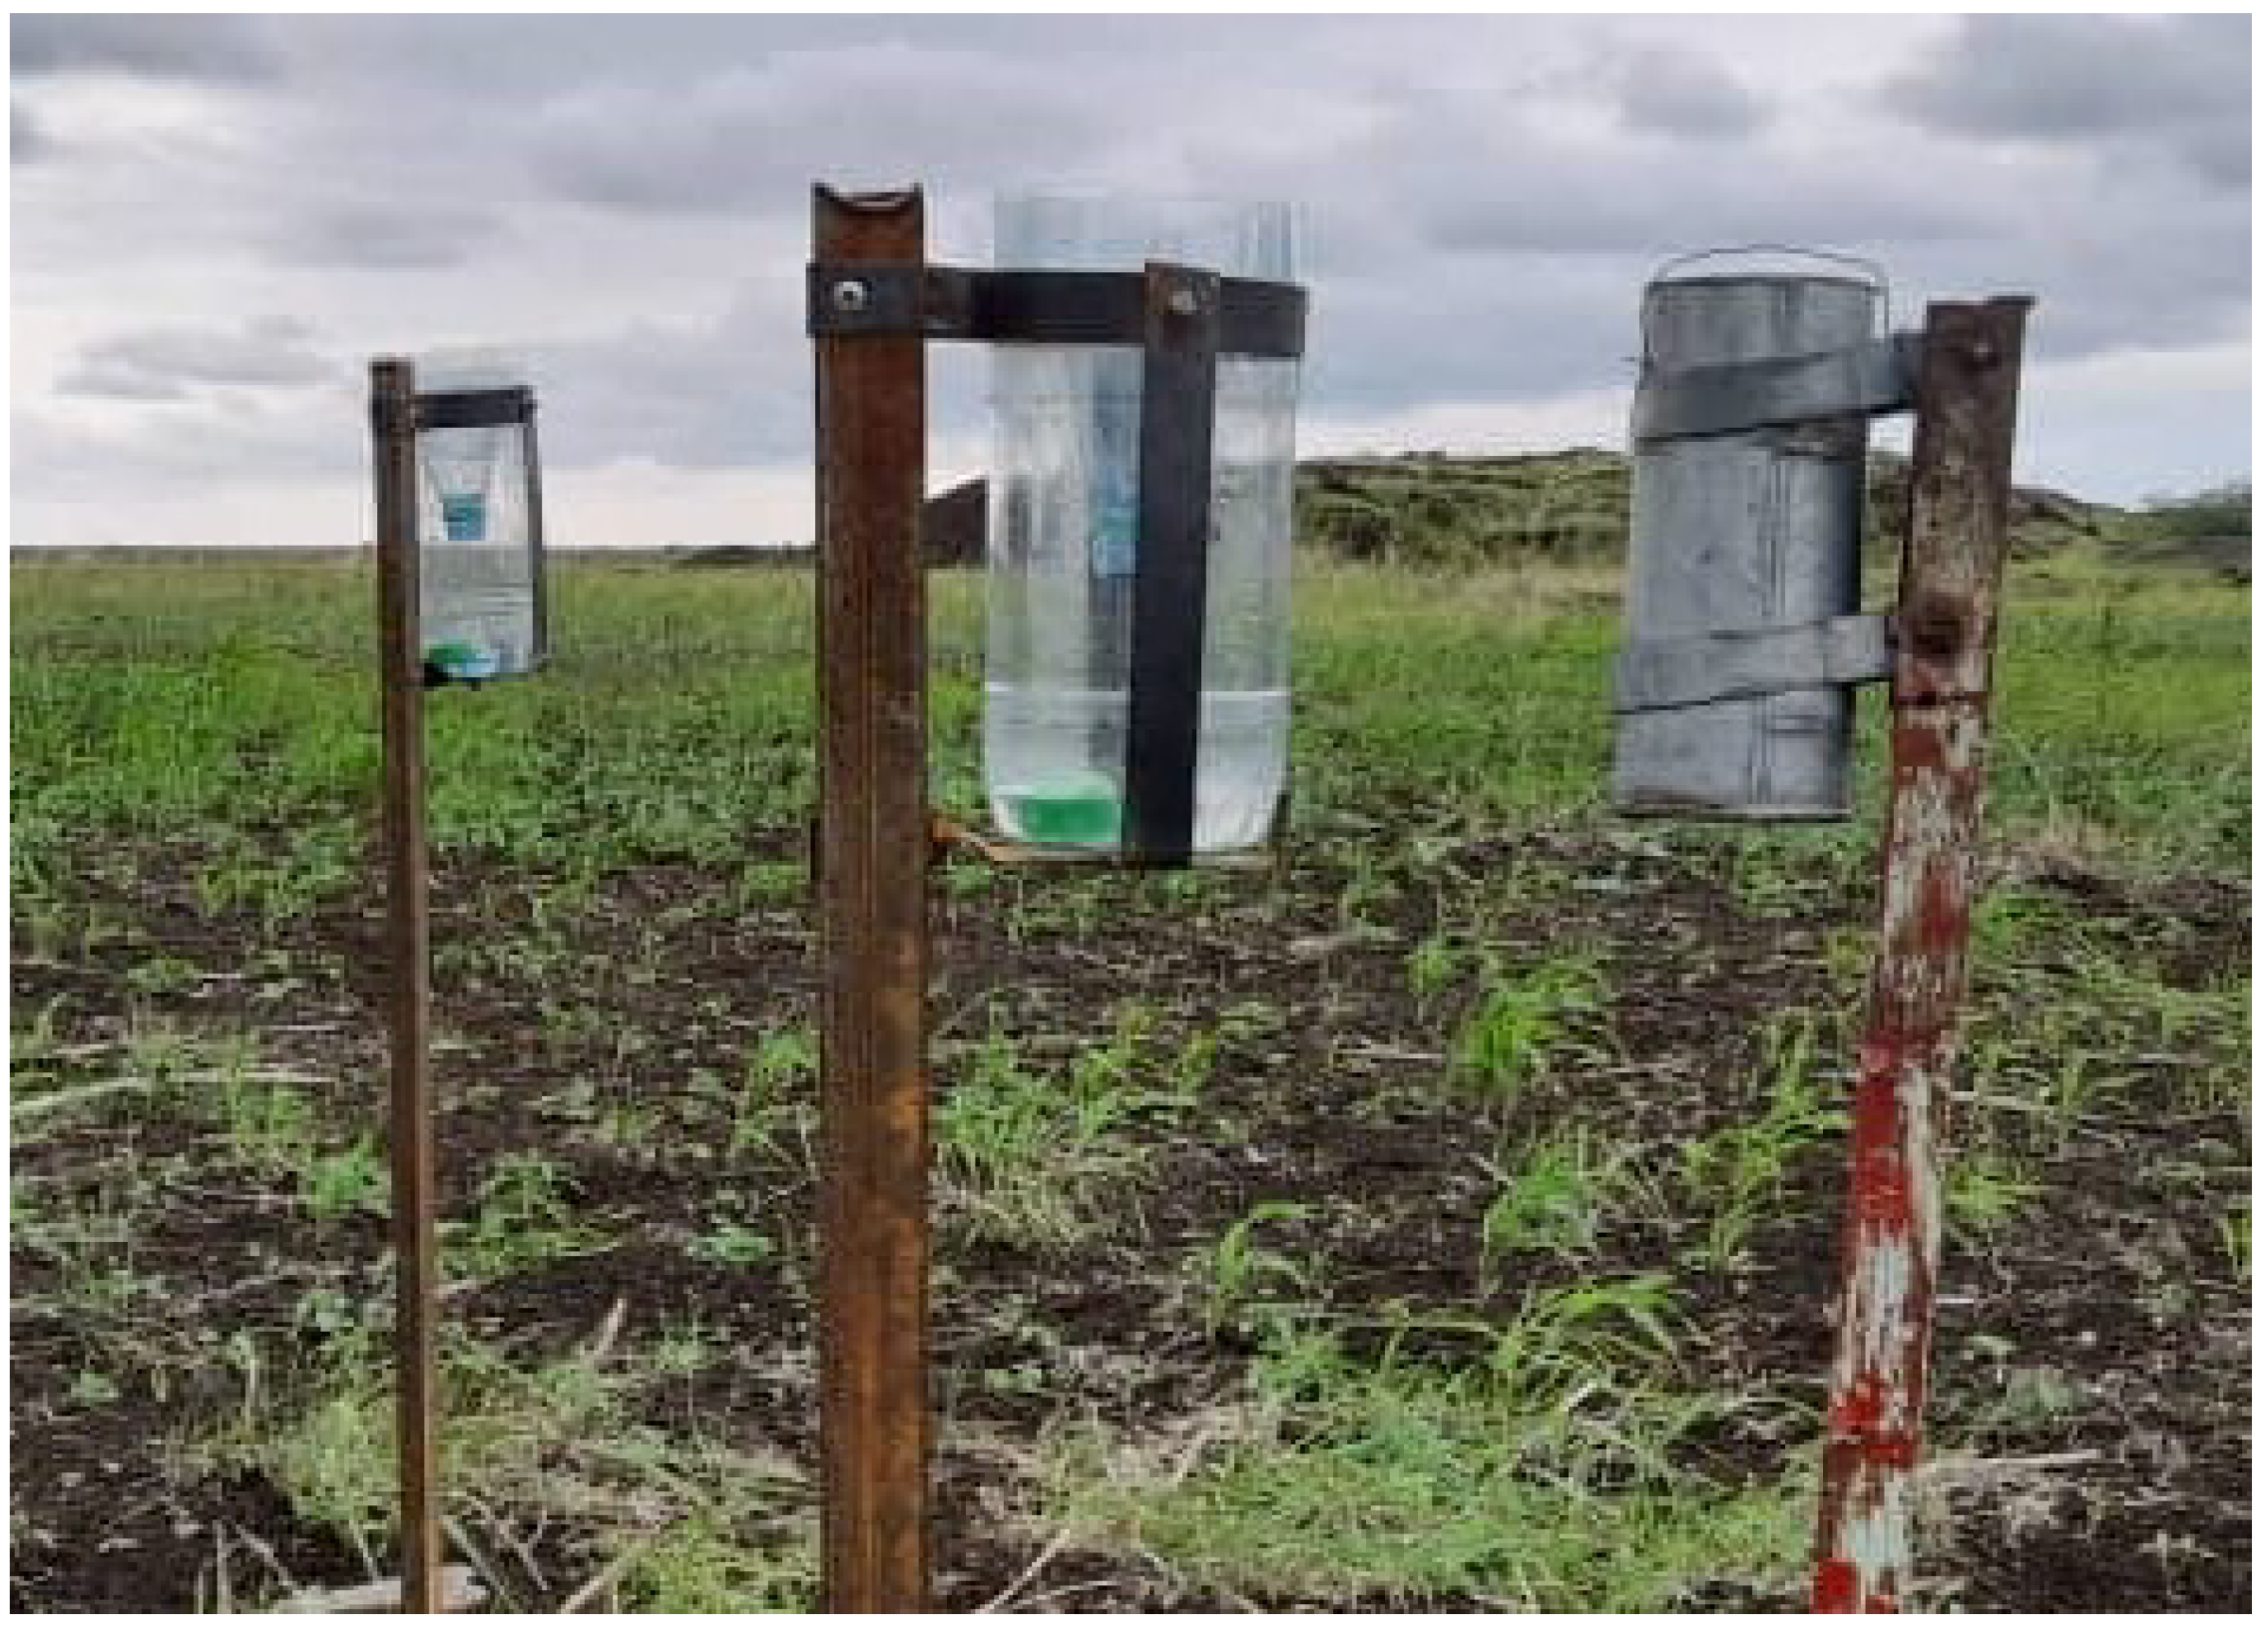
In the proposed system, farmers create handmade rain gauges using materials such as plastic bottles (
Figure 1). They then input the measured rainfall into a mobile application, which collects the location information and rainfall data from the fields where the rain gauges are installed and stores it on a cloud server. Handmade rain gauges are used because, in regions like the target area, where rainfall measurement infrastructure is not well-developed, farmers do not necessarily possess devices such as soil moisture sensors, which are expensive and difficult to obtain.
3.3. Using Smartphones
In recent years, the increase in smartphone penetration rates has been reported worldwide [
7], and the deployment of the Internet has also progressed. This is also true for the drylands of Sub-Saharan Africa [
8].
Hence, even in the system’s target regions, smartphones can be used to collect and record the data necessary for crop yield predictions and present the results of the predictions.
3.4. System Architecture
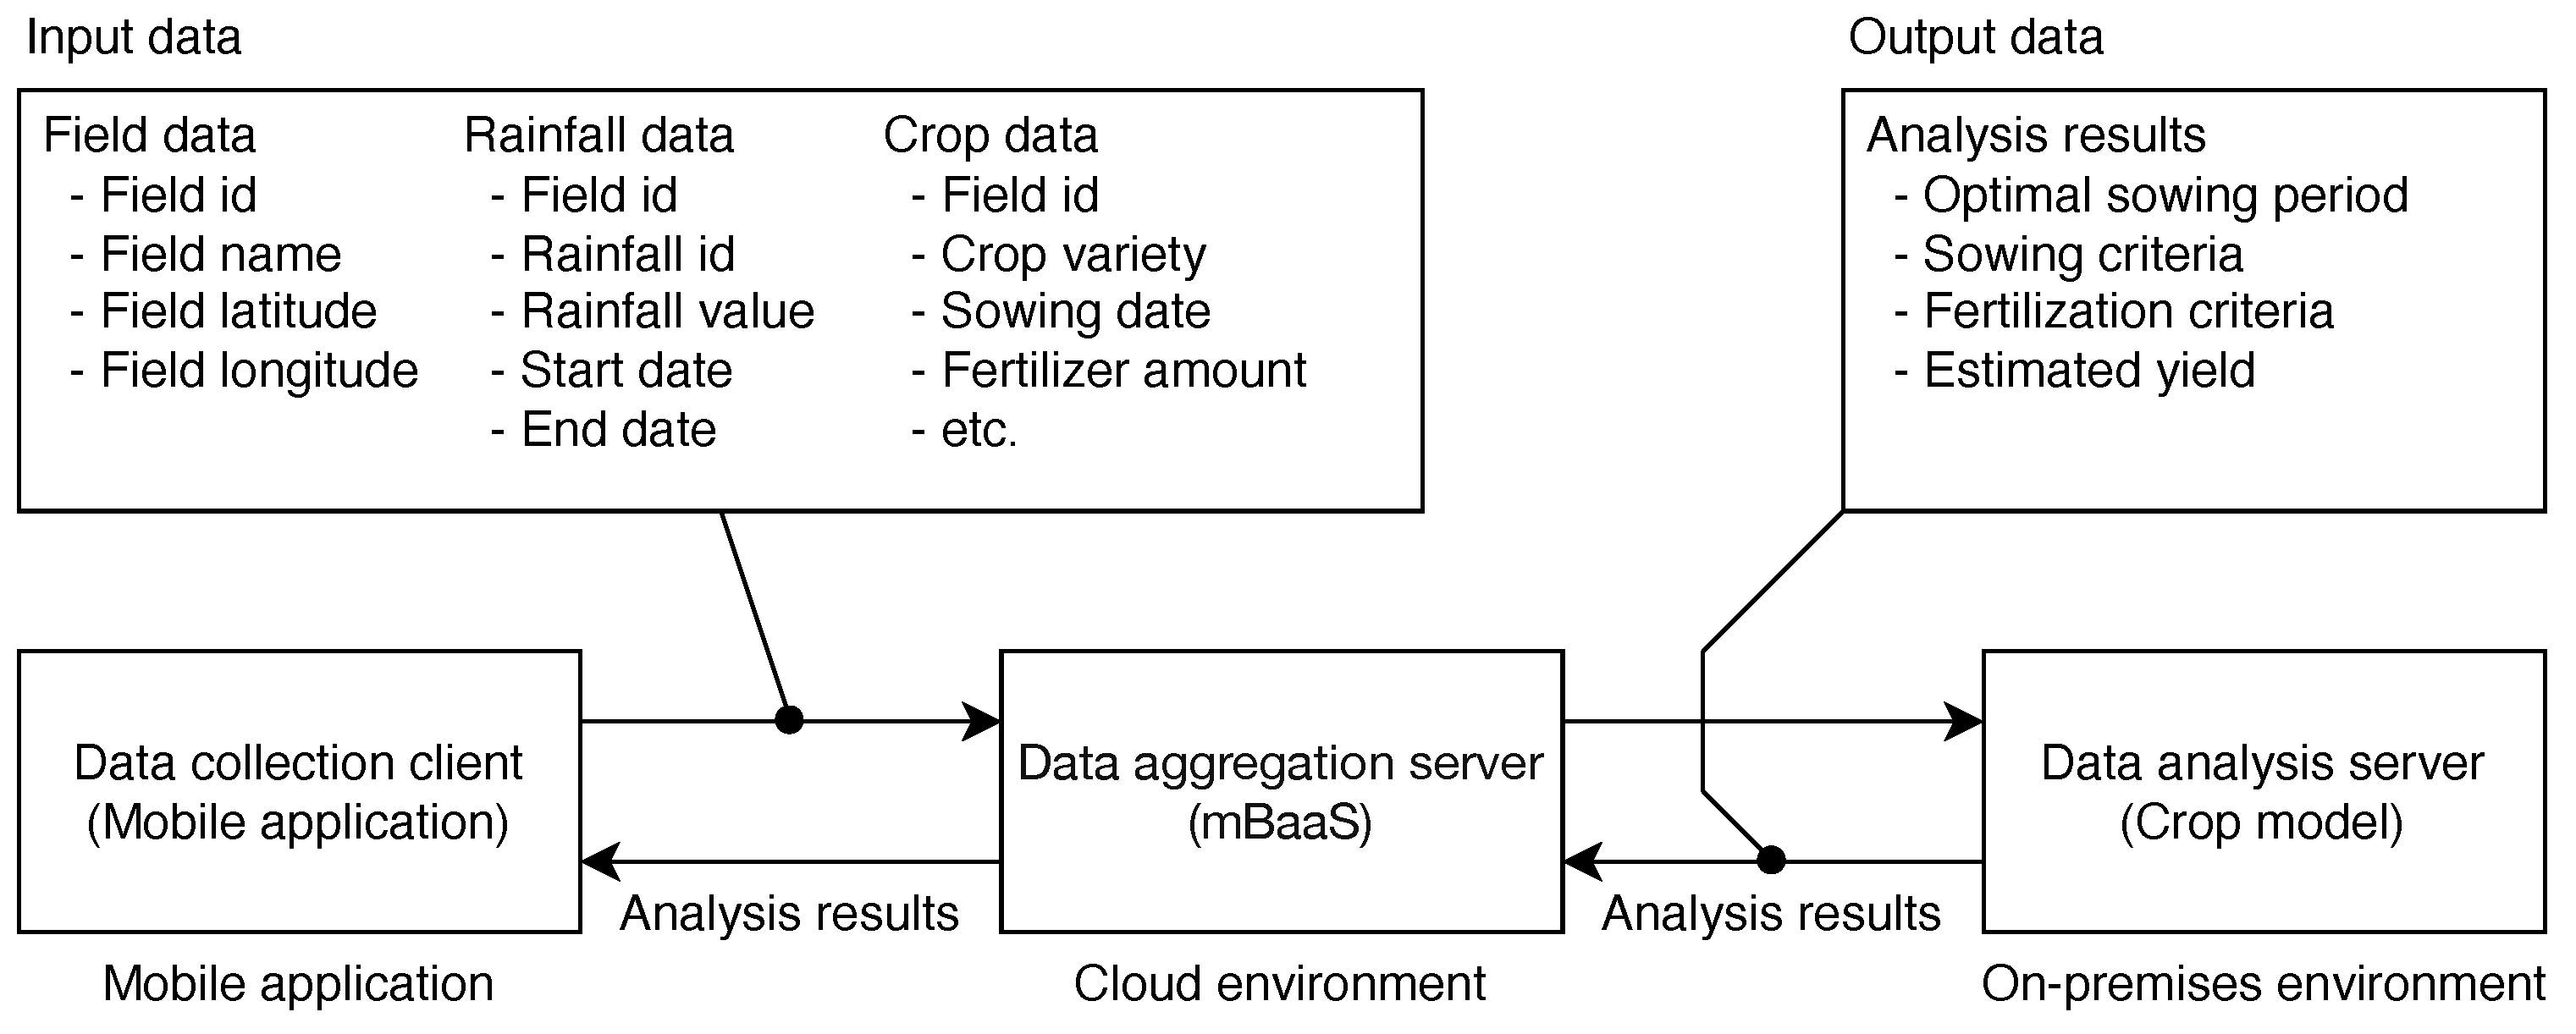
In the proposed system, crop yield predictions are made through simulations using a crop model [
9]. The input data for the crop model includes meteorological data (such as solar radiation, rainfall, temperature, and humidity), soil data (such as soil type and bulk density), seeding rate, and fertilization amount. Among these, rainfall, seeding rate, and fertilization amount are collected using a mobile application. On the other hand, the output data includes appropriate seeding times, seeding rates, fertilization amounts, and estimated yields.
Input data for the crop model is collected via a mobile application. Simulations using the crop model are then conducted to analyze the expected crop yields, and the analysis results are presented to the farmers (
Figure 2).
By following the above process to predict estimated yields, it is expected that even inexperienced farmers will find it easier to formulate crop cultivation plans. Additionally, if it is possible to know early that the yield will be lower than expected, it will be possible to revise the cultivation plan accordingly, which can help address food shortages.
4. Visualization of Rainfalls Using Actual Measurements and Its Issues
The purpose of this system is to support farmers in drylands. Upon practical implementation, one of the objectives is to provide useful information for crop cultivation to general farmers who need to use the system using the collected data. The most essential factors in drylands agriculture are the amount of rainfall and the onset of the rainy season, which are determined based on it. Visualizing and providing this information based on the data collected by this system will help farmers determine the timing of sowing, making it effective as crop cultivation support.
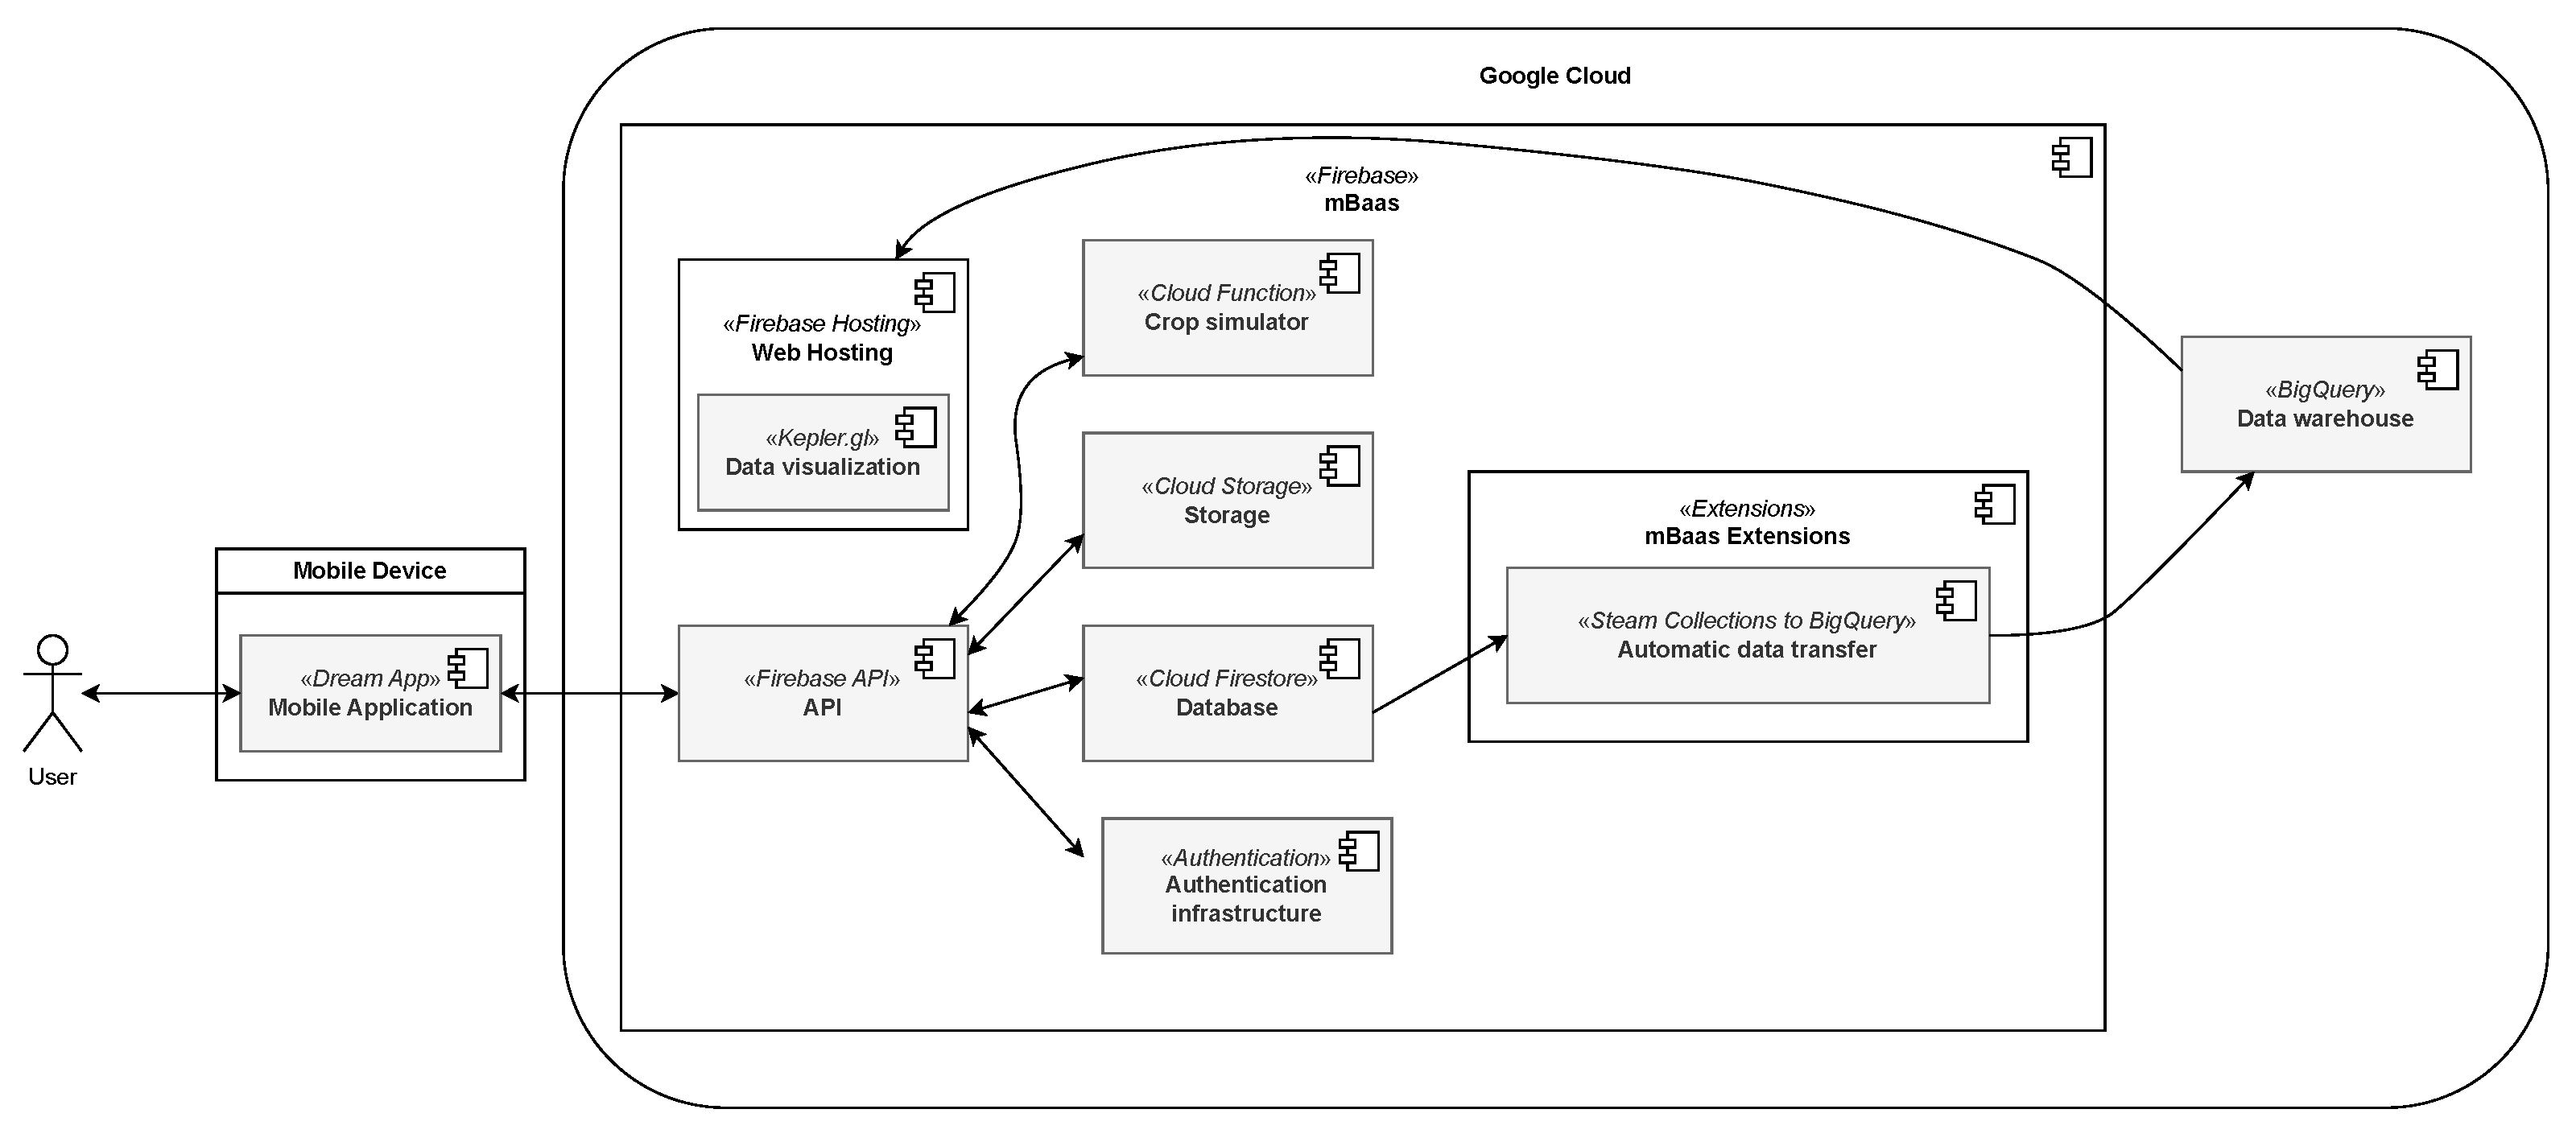
As shown in
Figure 3 and
Figure 4, the rainfall data entered by users of this system through the mobile application is accumulated in Firebase Cloud Firestore, which is used as the database [
10]. The accumulated data is aggregated using Google Cloud BigQuery [
11] and visualized using kepler.gl [
12], a Web GIS designed for geospatial data analysis.
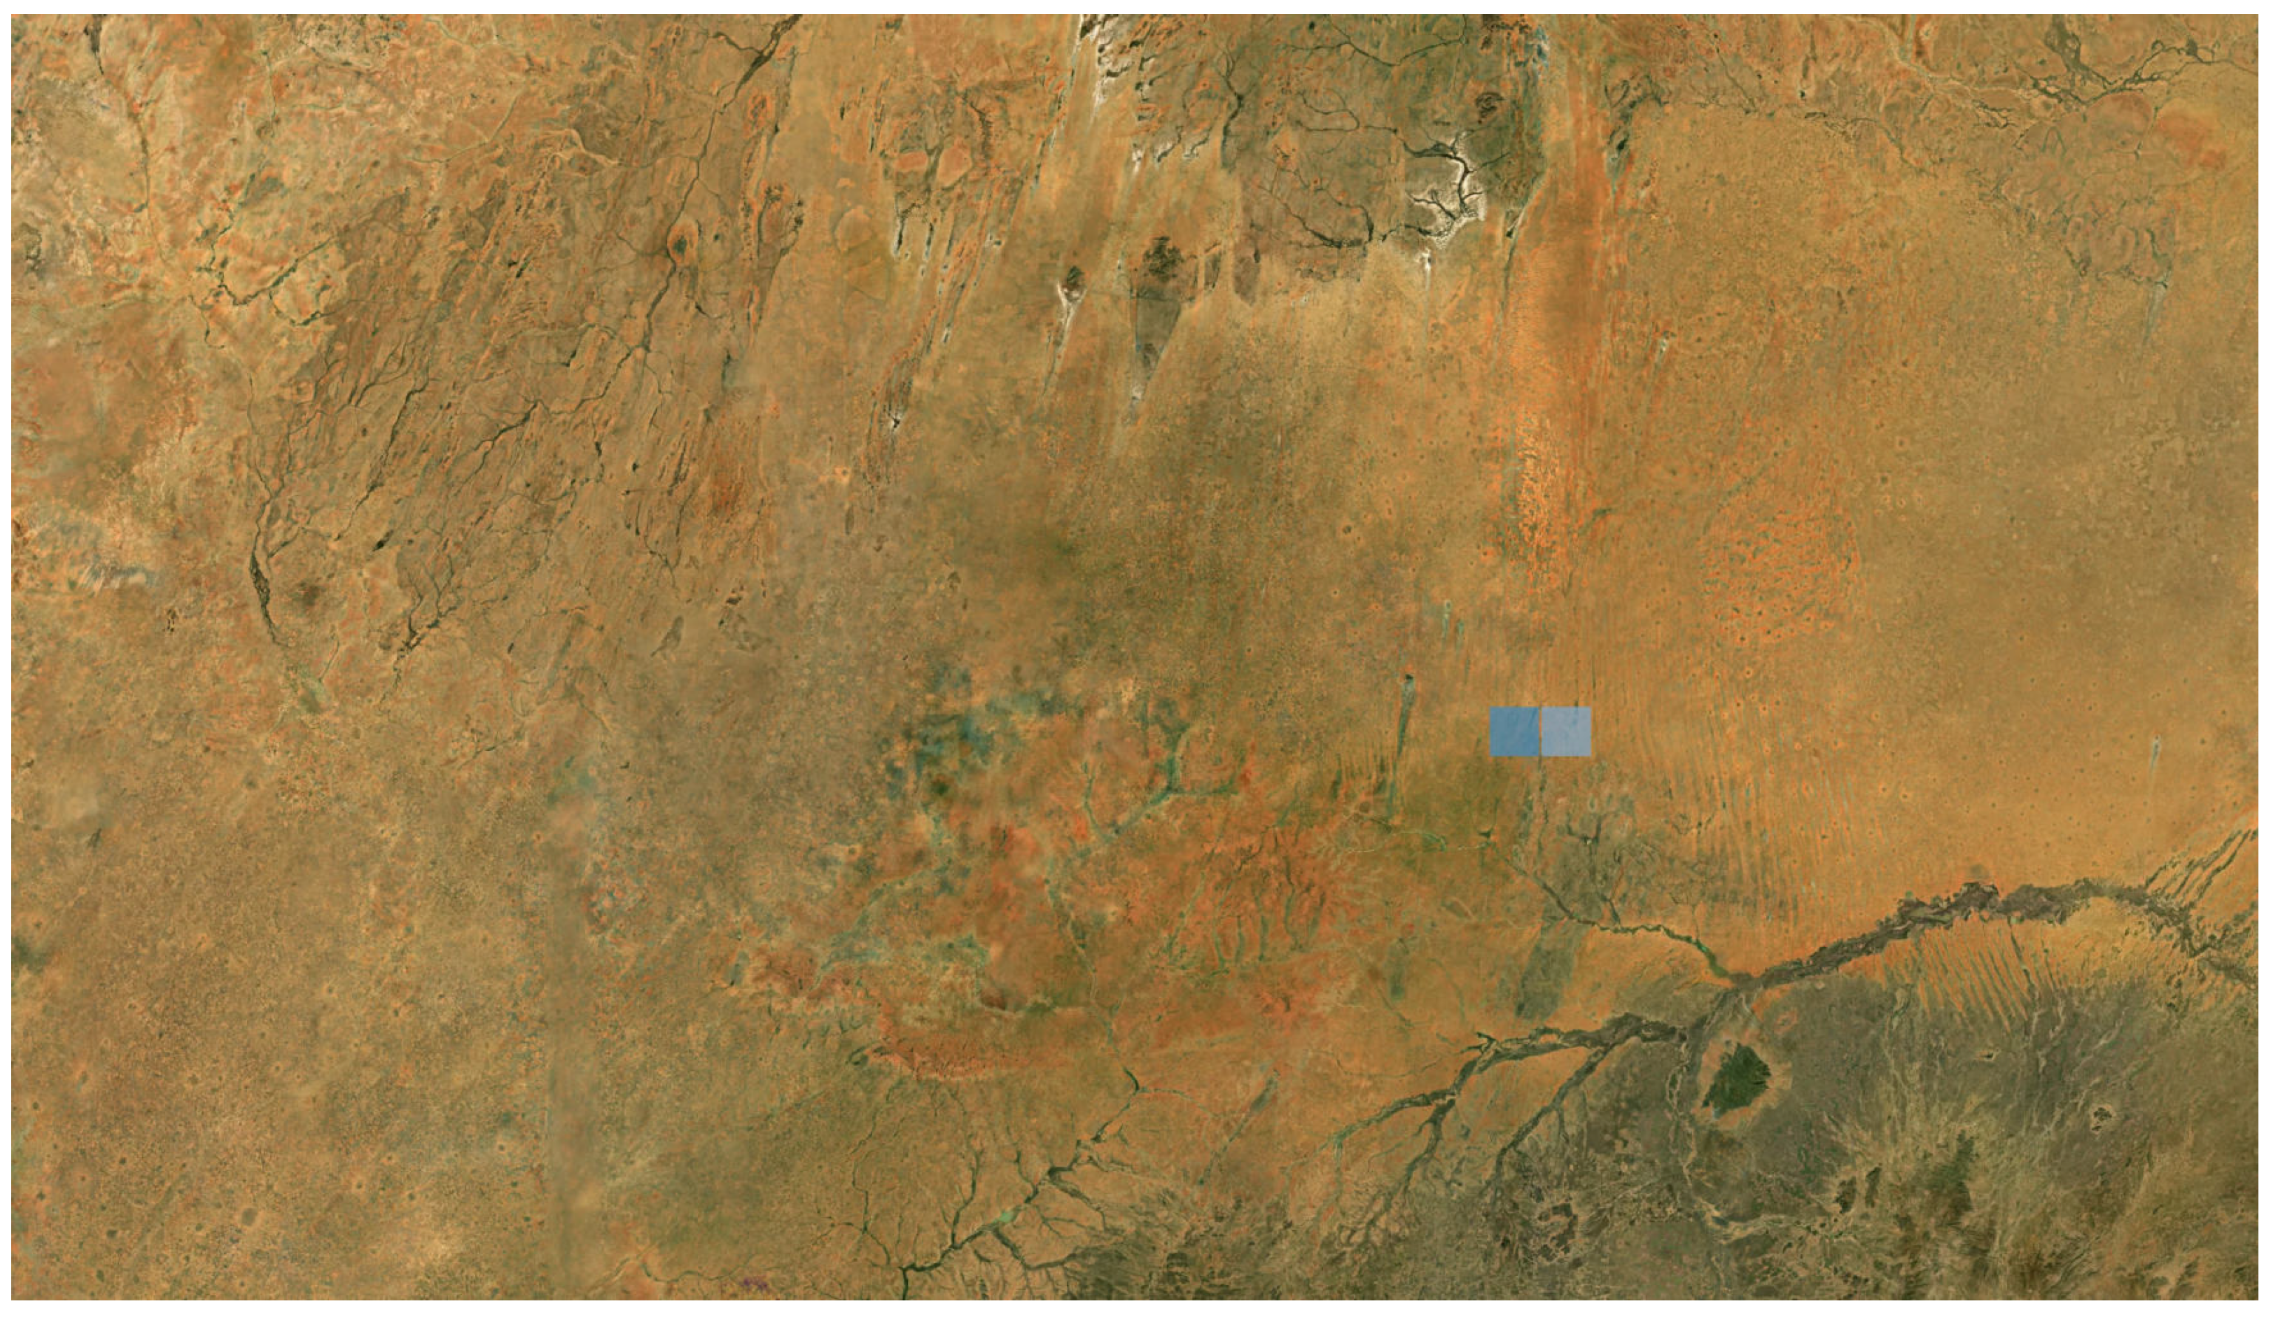
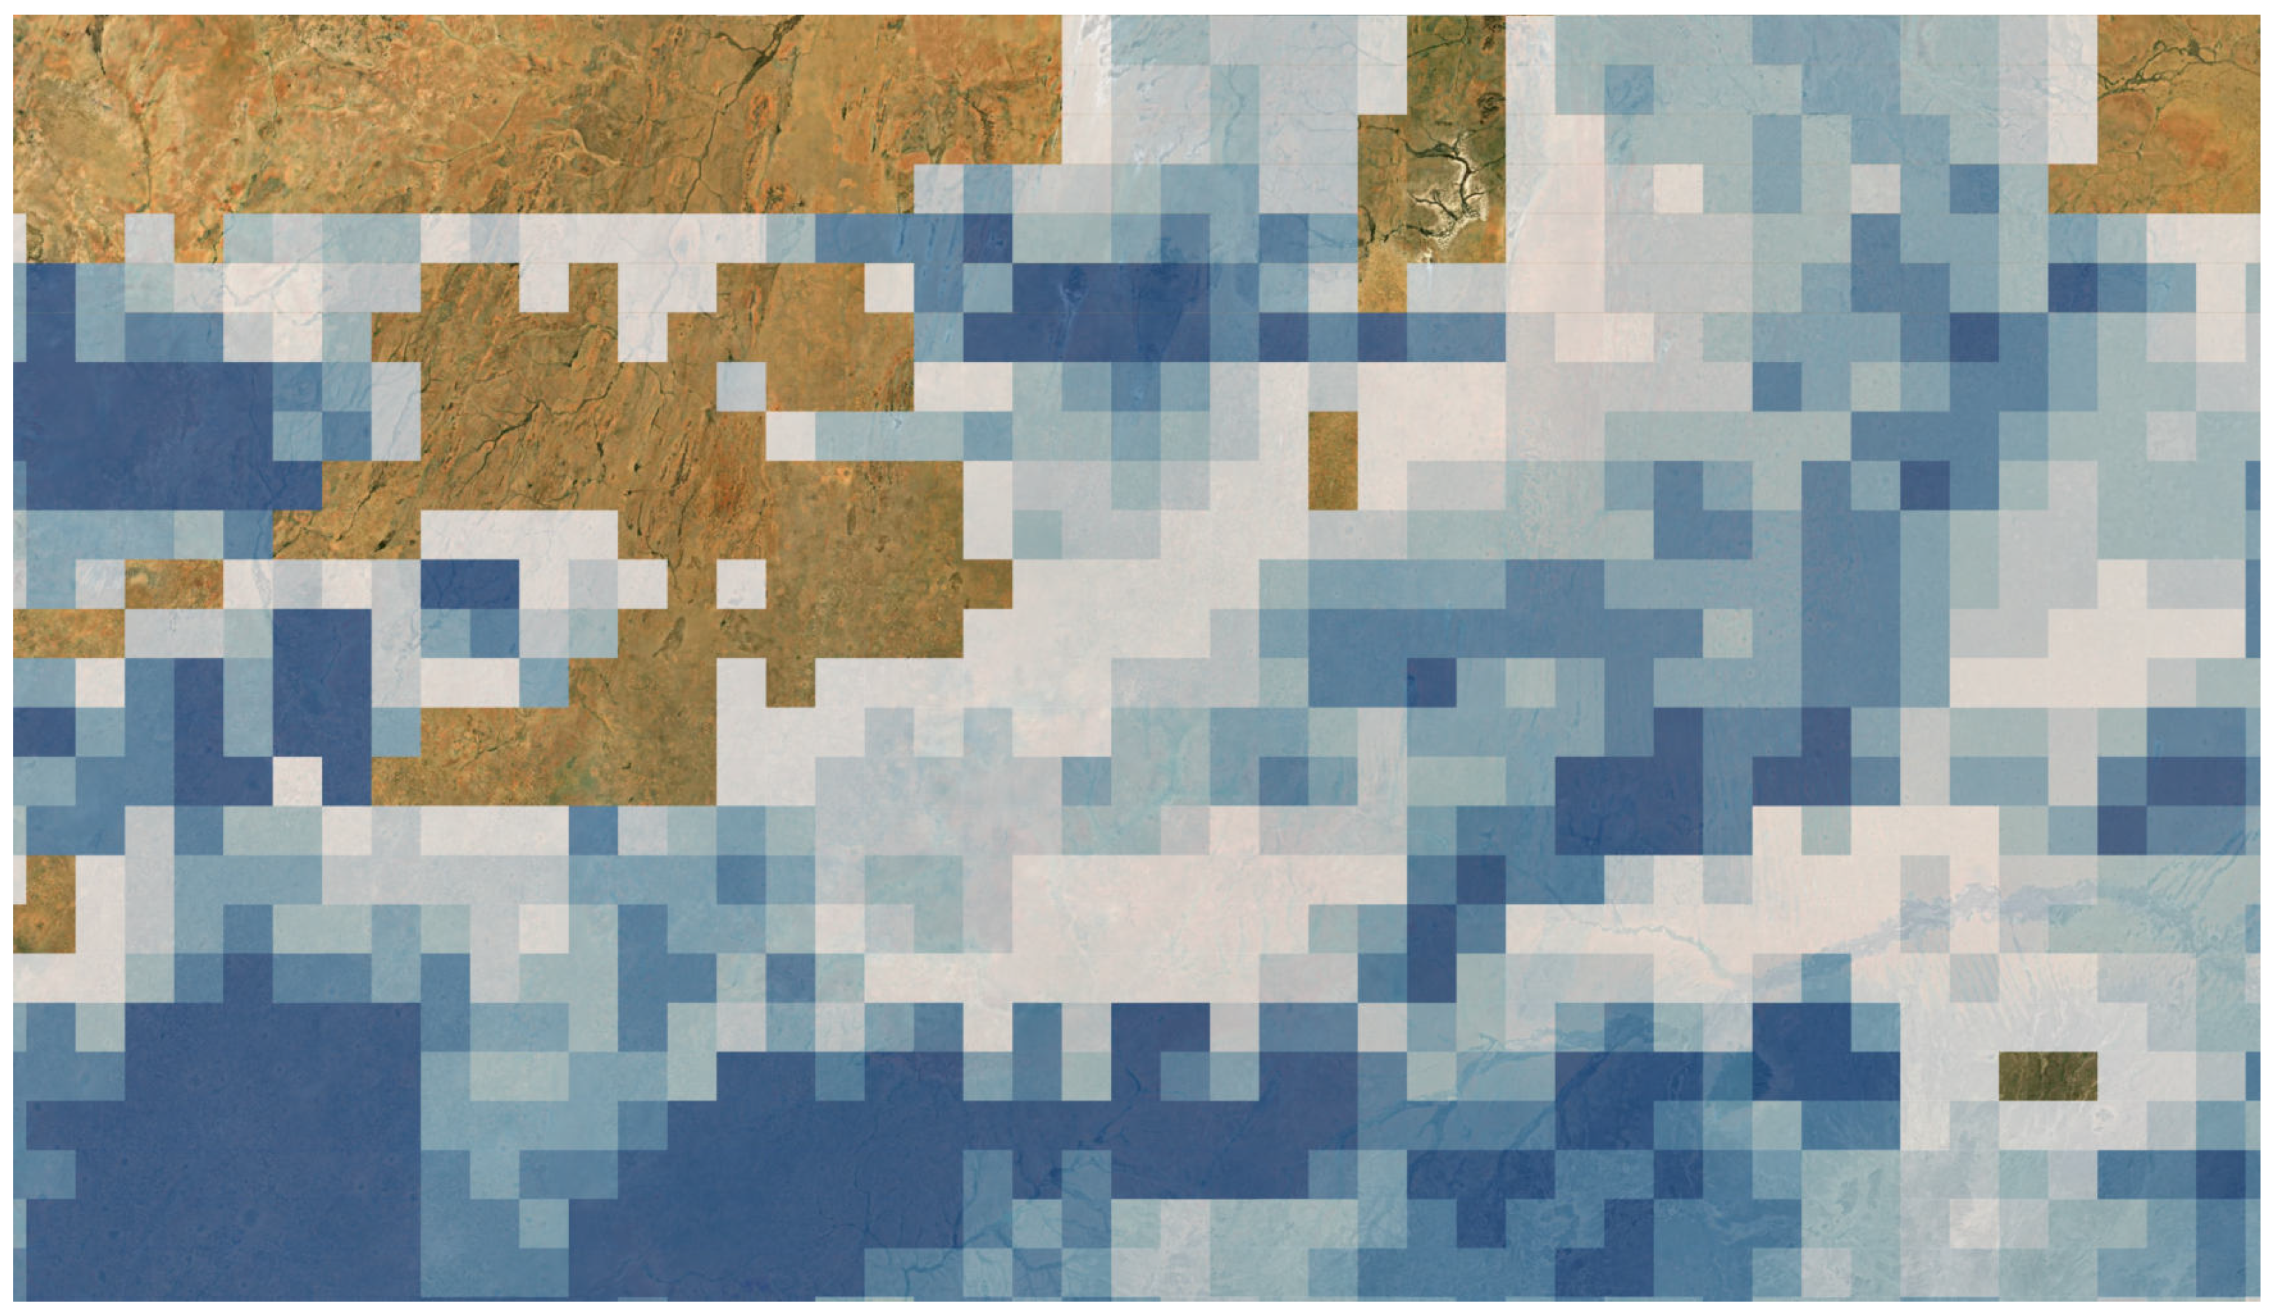
Figure 4 shows the visualization using the actual measured values accumulated in the system. Since the visualization is based on the data entered by farmers, the presence or absence of data collection depends on the users of this system, resulting in the accumulated data being sparse, as shown in the figure. Additionally, due to the characteristic of sparse rain cloud formation in drylands, the adjacent grid to a colored grid does not necessarily experience the same rainfall. This creates a problem where it is difficult to determine whether it is not raining or if there is no data.
4.1. Estimated Values and Observed Values
4.1.1. Data to Use
The details of the locations of the data used in this study are shown in
Table 1 and
Table 2. For the estimated rainfall, we used the latest version of GSMaP, and GSMaP_MVK (v8), provided by JAXA, which was corrected using the CPC Unified Gauge-Based Analysis of Global Daily Precipitation dataset provided by NOAA CPC. For observed values, we used data obtained from weather stations provided by the South African Agricultural Research Council, as well as measurements taken by farmers using handmade rain gauges installed in the fields, which were manually entered into a mobile application.
4.1.2. GSMaP
The Global Satellite Mapping of Precipitation (GSMaP) is a precipitation data map developed under the Global Precipitation Measurement (GPM) project, led by the Japan Aerospace Exploration Agency (JAXA) and the National Aeronautics and Space Administration (NASA). It combines radar data from the GPM core satellite with observations from multiple precipitation-monitoring satellites and geostationary meteorological satellites [
13,
14,
15,
16].
Various data formats are provided to suit different purposes, including the real-time version (GSMaP_NOW) updated immediately after observation, the near real-time version (GSMaP_NRT) updated four hours after observation, and the gauge-corrected version (GSMaP_Gauge) updated three days after observation for higher accuracy.
When visualizing the estimated values from GSMaP in the same way as the actual measurements, it appears as shown in
Figure 5.
4.2. About Errors
4.2.1. How to Measure Accuracy
For the calculation of errors, we use three common evaluation metrics for continuous values: mean error (Error, Equation (
1)), root mean square error (RMSE, Equation (
2)), and coefficient of determination (
, Equation (
3)).
represents the actual measurements in
, and
represents the estimated rainfall from GSMaP in
.
i denotes the day, and
n represents the number of samples.
Additionally, to evaluate the rainfall detection capability of GSMaP, we use a contingency table indicating the presence or absence of rainfall, as shown in the table. In
Table 3, TP indicates cases where rainfall was accurately predicted, FP indicates cases where rainfall was predicted but did not occur (false positive), FN indicates cases where rainfall was not predicted but did occur (false negative), and TN indicates cases where no rainfall was correctly predicted. Using the results from this table, the Probability of Detection (POD) and the False Alarm Ratio (FAR) are calculated using Equation (
4) and Equation (
5), respectively. Here, POD indicates how accurately the estimated values from GSMaP can detect actual rainfall, while FAR indicates the proportion of cases where GSMaP detected rainfall when it did not actually occur.
4.2.2. Rainfall Accuracy
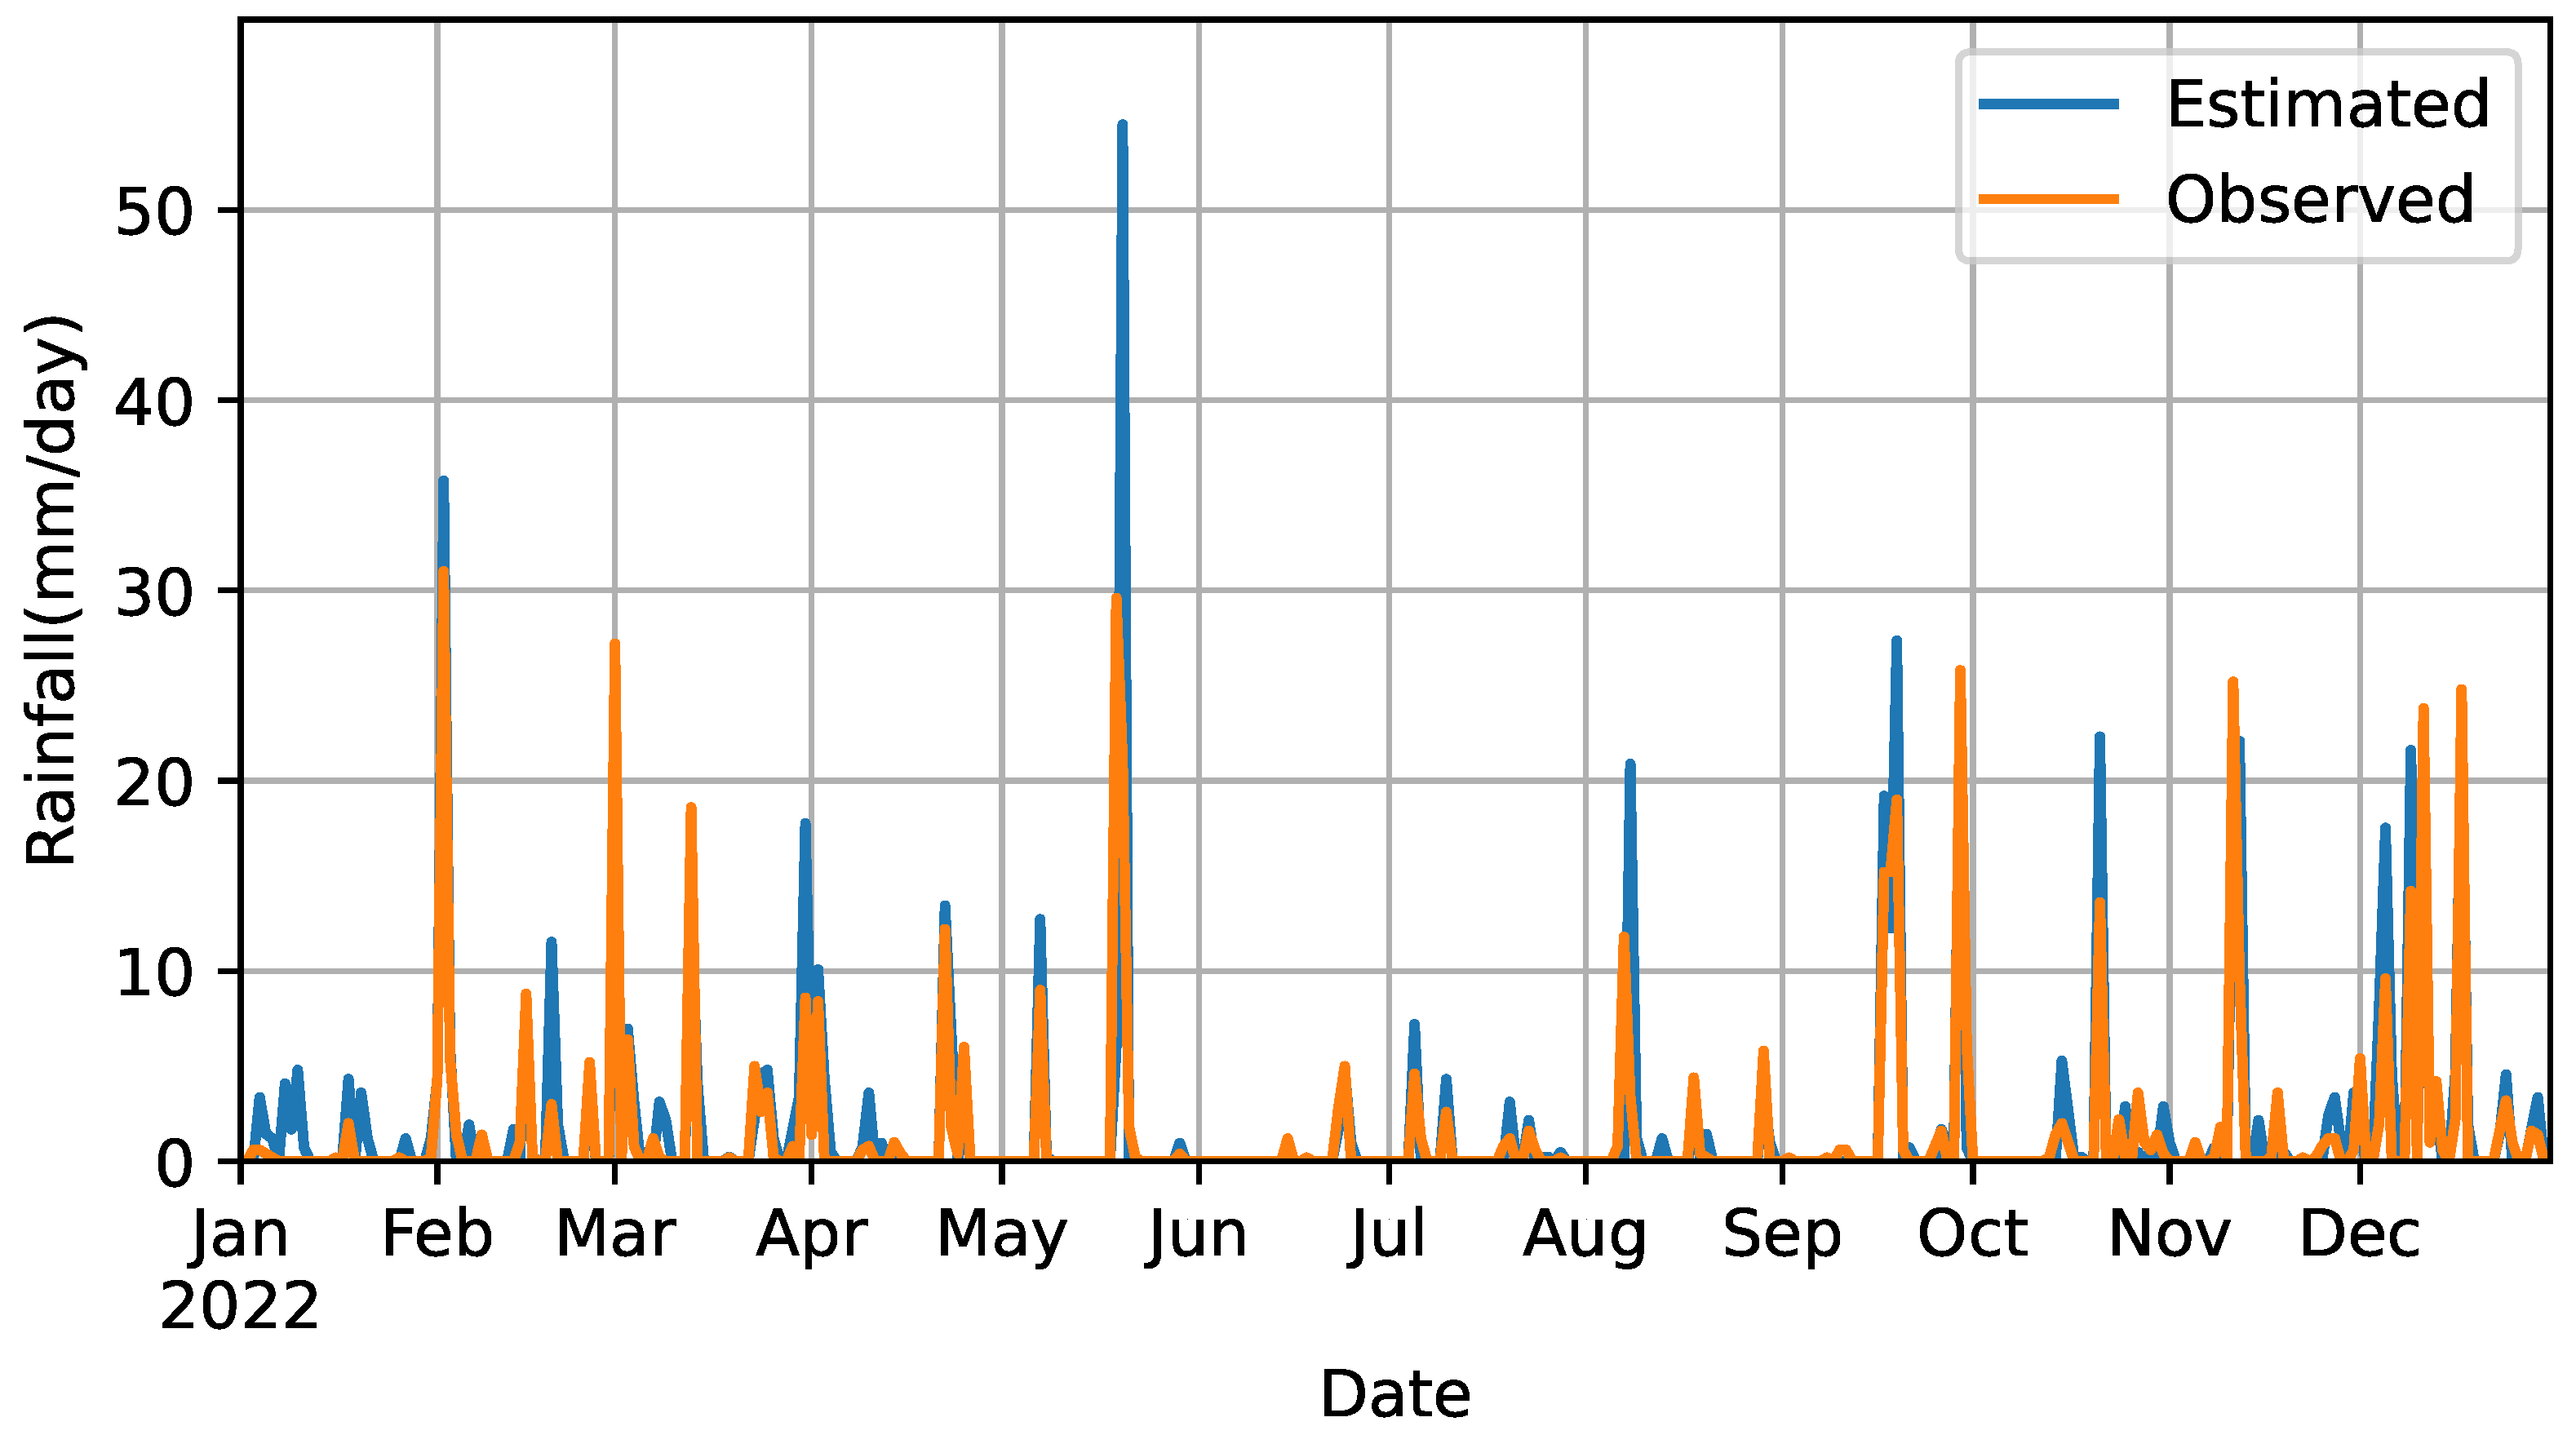
The estimated and observed rainfall in South Africa are shown in
Figure 6, and the estimated and observed rainfall in Sudan are shown in
Figure 7. Additionally, the calculation results are shown in
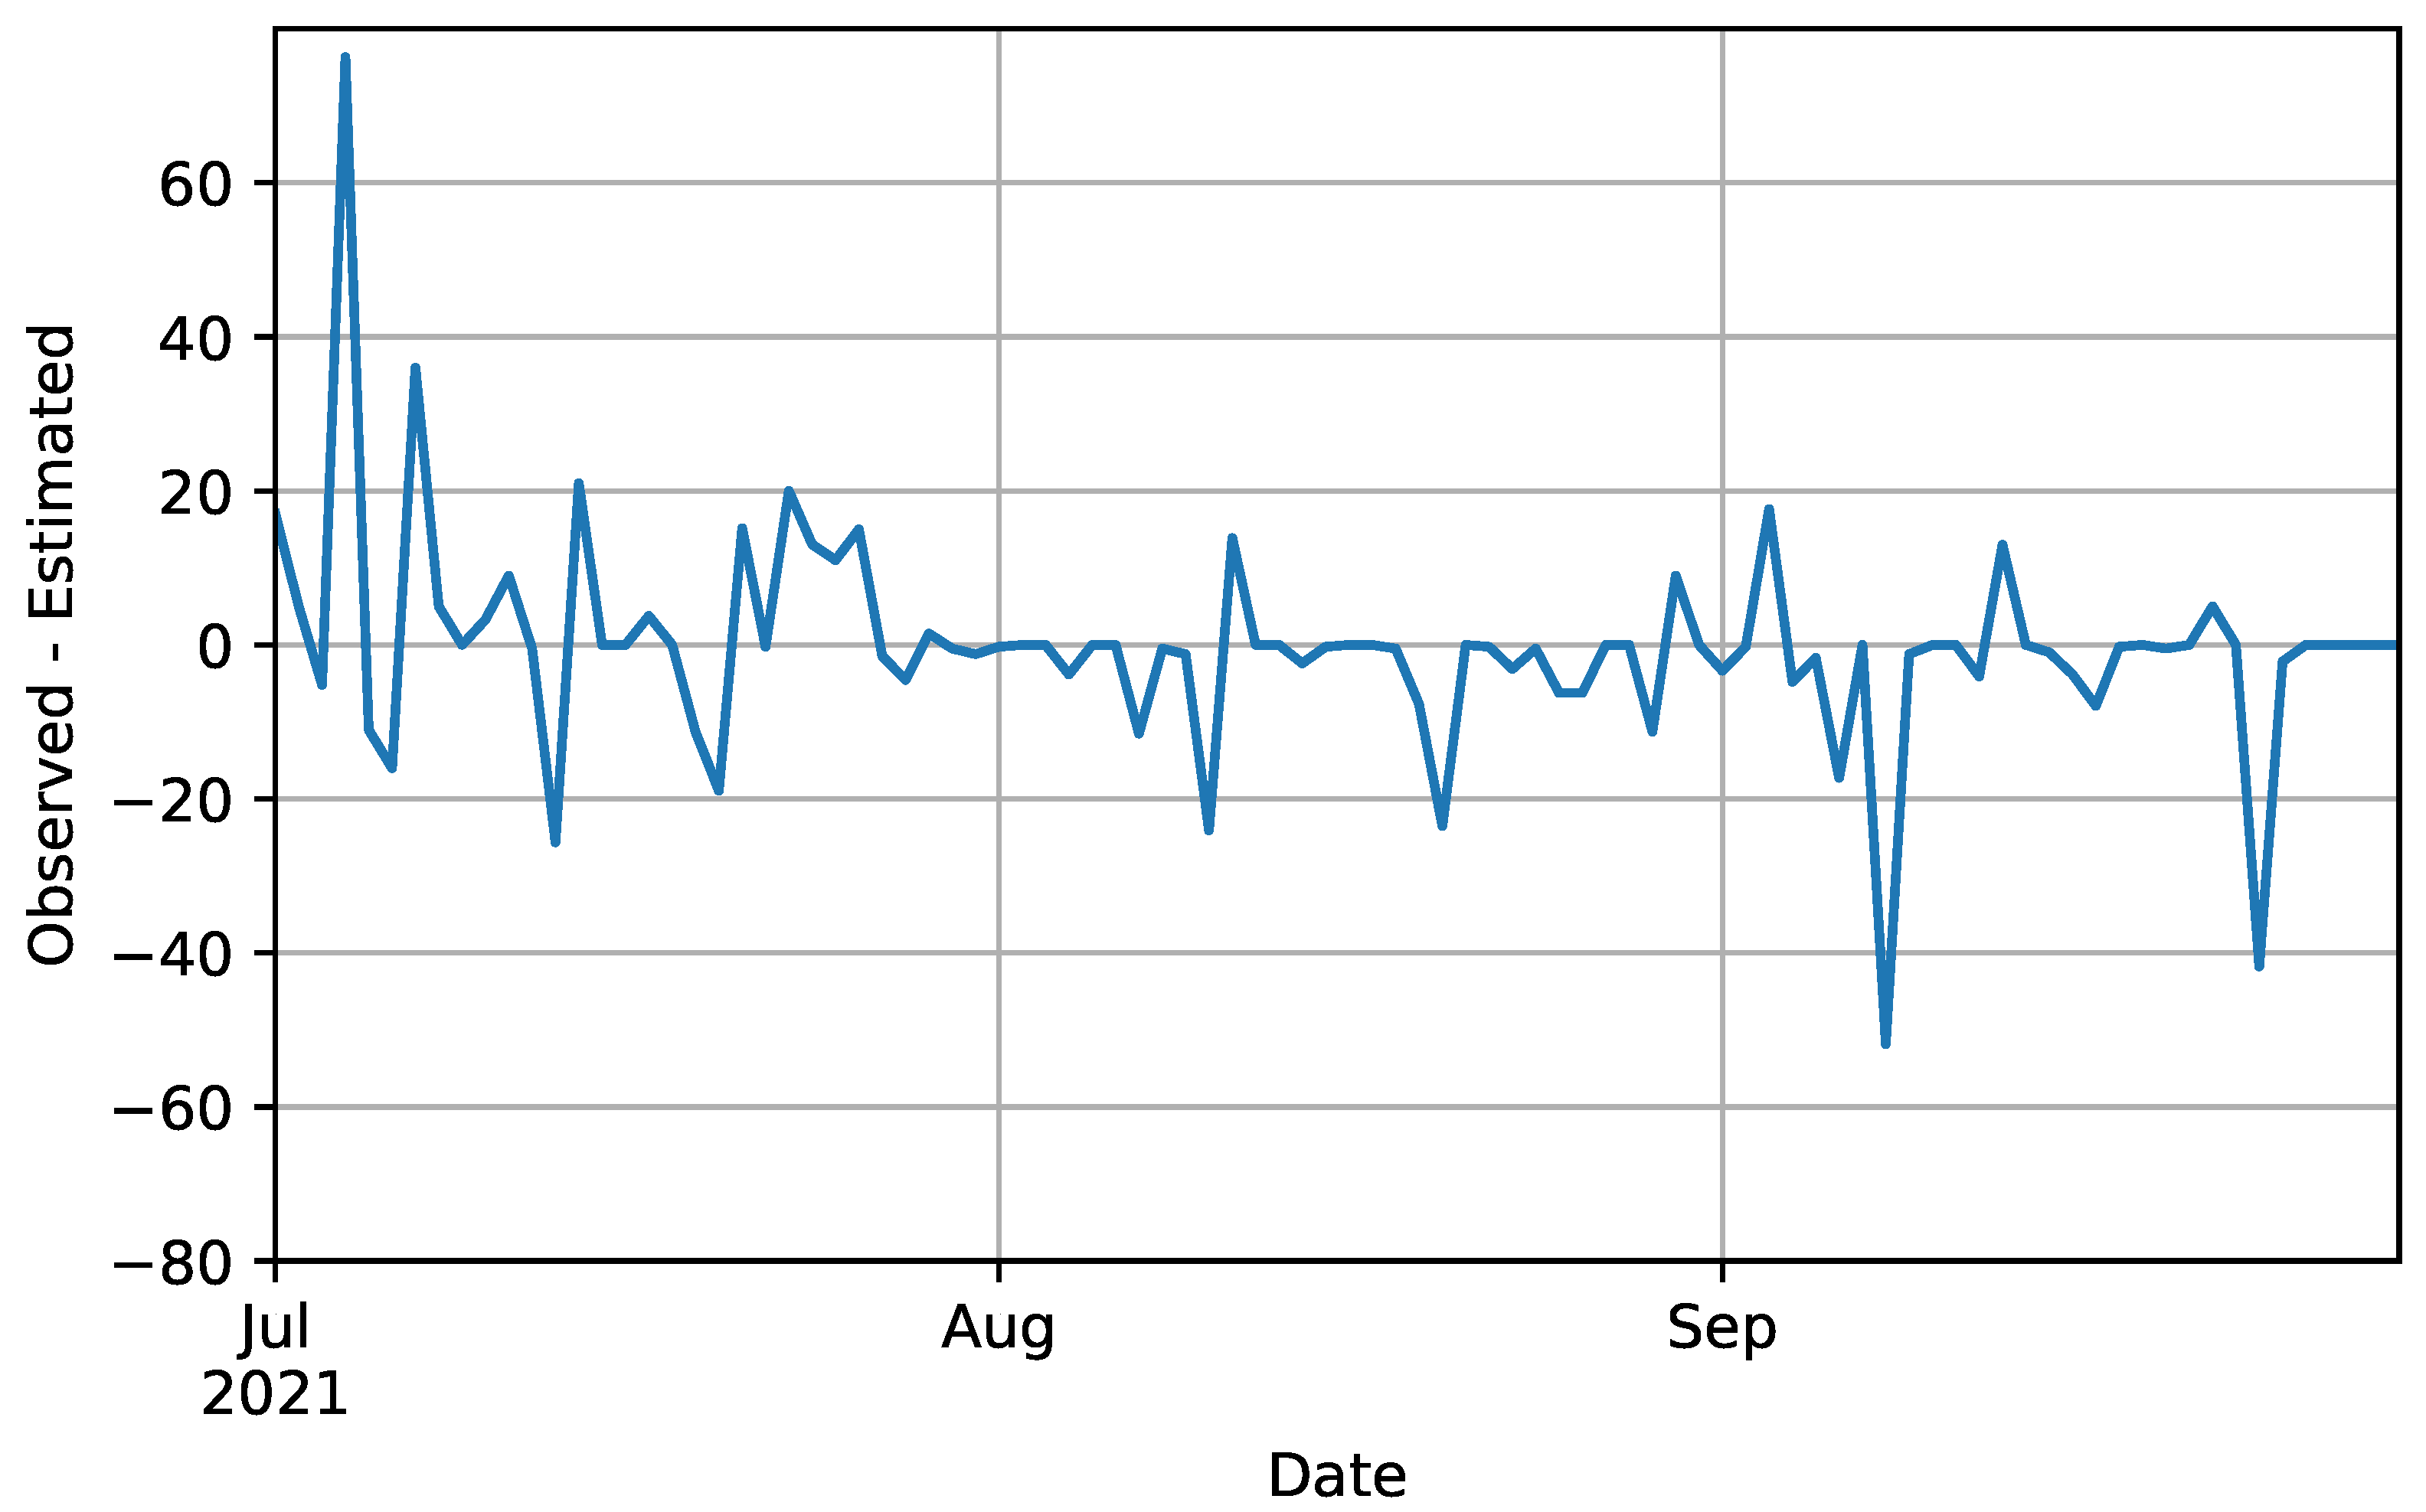
Table 4, the error for South Africa is shown in
Figure 8, and the error for Sudan is shown in
Figure 9.
From the table, it can be seen that the error is small and the accuracy is high for South Africa, while the error is large for Sudan. Focusing on the coefficient of determination, the value for Sudan is −0.64. Since the coefficient of determination is negative, it is possible that there is a problem with either the estimated or measured values. Both of the two countries used data from weather stations in South Africa and data manually input by farmers in Sudan as measured values to correct the GSMaP estimates, respectively. Therefore, errors due to human factors caused by manual input are possible. Additionally, it is evident that both South Africa and Sudan are underestimated.
The POD and FAR for South Africa were 0.71 and 0.30, respectively. While this indicates a good detection rate and an acceptable false alarm rate, the aim of this study is to provide farmers with highly accurate rainfall information, which requires high reliability. Hence, it is ideal to have a POD of 0.8 or higher and an FAR of 0.2 or lower. To achieve this, we aim to make corrections and strive for higher accuracy.
On the other hand, in Sudan, the POD and FAR were 0.56 and 0.71, respectively. The POD value of 0.56 is not considered high, and the FAR value of 0.71 indicates a very high false alarm rate. Currently, this information is unreliable for users, and there is room for improvement. However, it should be noted that unlike South Africa, where weather station data was used for actual measurements, the actual measurement data for Sudan was manually entered by agricultural workers. Thus, it is necessary to verify the reliability of the manually entered data and aim to improve accuracy.
Additionally, from
Figure 8 and
Figure 9, it is visually evident that the error is particularly large on days with heavy rainfall. This indicates that there is room for correction in this aspect as well.
4.3. Effect on Estimated Yield
To determine the extent to which rainfall errors affect crop yields, crop simulators were used to obtain estimated yields for one of the target sites in the Republic of South Africa (
Table 1). All values are the same except for rainfall.
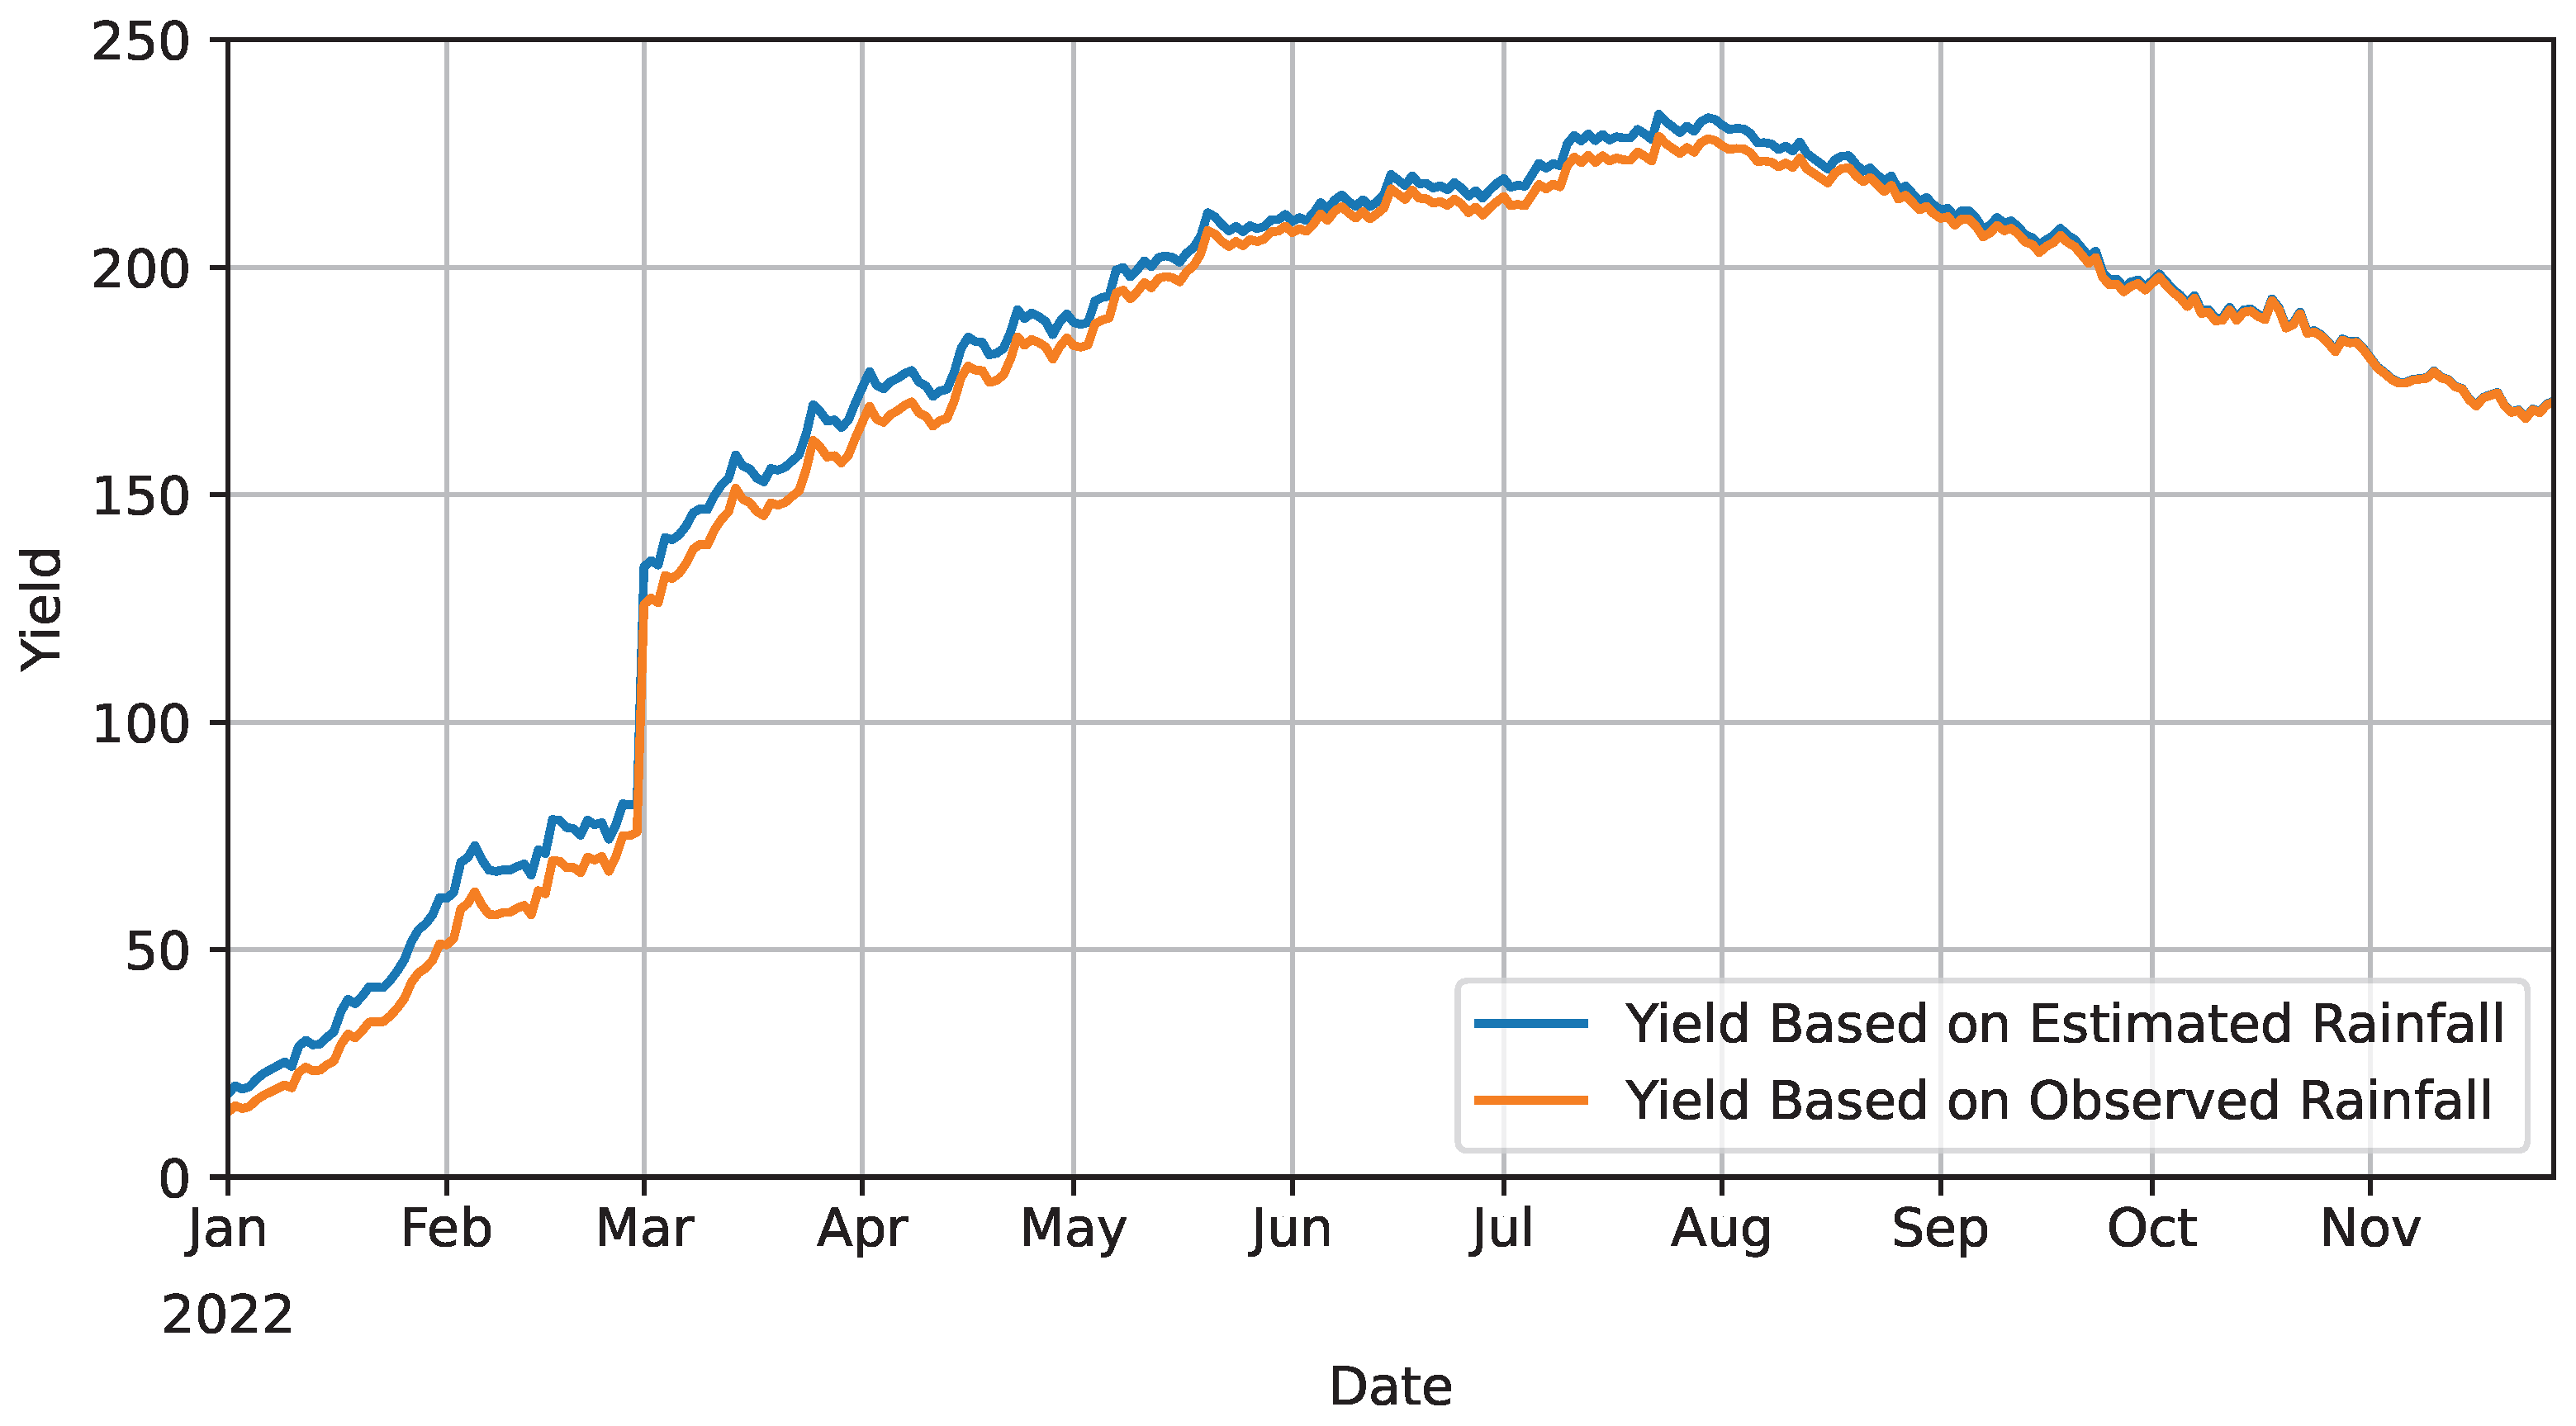
The results are shown graphically in
Figure 10. The mean error, root mean square error, and coefficient of determination are calculated along with the rainfall error, and the results are shown in
Table 5. It can be seen that the errors are larger than the South African parameters in
Table 4.
Figure 10 shows that the estimated yields are generally higher than the measured yields, and the errors are particularly pronounced from January to May. These results indicate that even a small error in rainfall can have a large impact on the estimated yield, and that the dry season (October to April), when soil moisture is lower, is more likely to be affected than the rainy season (May to September).
5. Consideration
Based on the accuracy measurements, the errors between GSMaP and actual measurements in Sudan and South Africa have become clear. It was found that GSMaP is highly accurate in locations with many weather stations, whereas its accuracy decreases in locations without weather stations.
For South Africa, compared to the data obtained from weather stations, the overall results can be considered highly accurate. However, the error is significant on days with heavy rainfall. Hence, it is necessary to focus on and correct for days with a certain amount of rainfall or more. Additionally, for Sudan, where actual measurements were taken using handmade rain gauges and manually entered data, further verification is necessary. It is also essential to collect more data to compare errors.
Therefore, the visualization system will be based on the visualized GSMaP data, allowing farmers to freely switch to and display the visualized actual measurements. Subsequently, the goal is to complete the visualization system by providing visualizations of the corrected estimates using actual measurements.
6. Conclusions
In this study, as a preliminary step in developing visualization functions using data from a crop cultivation support system, we verified the accuracy of GSMaP at two locations in drylands, South Africa and Sudan, using several statistical indicators such as mean error, root mean square error, coefficient of determination, probability of detection, and false alarm ratio. The results showed that the accuracy was high in areas with weather stations and low in areas without them. In particular, improving the coefficient of determination, which was calculated to be low after accounting for errors due to anthropogenic factors, proved to be a challenge, especially in Sudan where farmers input data manually.
In the future, we will increase the sample data for further verification and continue to explore methods for correcting errors. Subsequently, the goal is to complete the visualization system by providing visualizations of the corrected estimates using observed values.
Author Contributions
Conceptualization, M.H., T.K. and M.T.; methodology, M.H.; software, Y.I. and M.H.; validation, Y.I. and M.H.; formal analysis, Y.I. and M.H.; investigation, Y.I.; resources, M.H., T.K. and M.T.; data curation, M.H. and M.T.; writing—original draft preparation, Y.I.; writing—review and editing, M.H., T.K. and M.T.; visualization, Y.I.; supervision, M.H., T.K. and M.T.; project administration, M.H., T.K. and M.T. All authors have read and agreed to the published version of the manuscript.
Funding
This research received no external funding.
Institutional Review Board Statement
Not applicable.
Informed Consent Statement
Not applicable.
Data Availability Statement
Restrictions apply to the availability of these data. The satellite Global Satellite Mapping of Precipitation (GSMaP) data ware obtained from Japan Aerospace Exploration Agency (JAXA) and are available on
https://sharaku.eorc.jaxa.jp/GSMaP/(accessed on: 11 November 2024) with the permission of Japan Aerospace Exploration Agency (JAXA). The observational data in South Africa were obtained from South African Agricultural Research Council and are available from the authors with the permission of South African Agricultural Research Council. The observational data in Sudan were obtained from Arid Land Research Center of Tottori University and are available from the authors with the permission of Arid Land Research Center of Tottori University.
Acknowledgments
The satellite Global Satellite Mapping of Precipitation (GSMaP) data used in this presentation was provided by Japan Aerospace Exploration Agency (JAXA). Additionally, the observational data was provided by the South African Agricultural Research Council for South Africa and by the Arid Land Research Center of Tottori University for Sudan.
Conflicts of Interest
The authors declare no conflicts of interest.
References
- Yoneda, N.; Higashino, M.; Kawamura, T.; Tsubo, M. Development of Crop Cultivation Support Application for Farmers Based on Crop Yield Prediction in Drylands. In Proceedings of the 2023 IEEE International Conference on High Performance Computing & Communications, Data Science & Systems, Smart City & Dependability in Sensor, Cloud & Big Data Systems & Application (HPCC/DSS/SmartCity/DependSys), Melbourne, Australia, 17–21 December 2023; pp. 898–905. [Google Scholar] [CrossRef]
- Kubota, T.; Aonashi, K.; Ushio, T.; Shige, S.; Takayabu, Y.N.; Kachi, M.; Arai, Y.; Tashima, T.; Masaki, T.; Kawamoto, N.; et al. Global Satellite Mapping of Precipitation (GSMaP) Products in the GPM Era. In Satellite Precipitation Measurement: Volume 1; Springer International Publishing: Berlin/Heidelberg, Germany, 2020; pp. 355–373. [Google Scholar] [CrossRef]
- Tian, Y.; Peters-Lidard, C.D.; Adler, R.F.; Kubota, T.; Ushio, T. Evaluation of GSMaP precipitation estimates over the contiguous United States. J. Hydrometeorol. 2010, 11, 566–574. [Google Scholar] [CrossRef]
- Kubota, T.; Ushio, T.; Shige, S.; Kida, S.; Kachi, M.; Okamoto, K. Verification of High-Resolution Satellite-Based Rainfall Estimates around Japan Using a Gauge-Calibrated Ground-Radar Dataset. J. Meteorol. Soc. Jpn. Ser. II 2009, 87A, 203–222. [Google Scholar] [CrossRef]
- Shrestha, M.; Takara, K.; Kubota, T.; Bajracharya, S. Verification of GSMaP Rainfall Estimates over the Central Himalayas. J. Jpn. Soc. Civ. Eng. Ser. B1 (Hydraul. Eng.) 2011, 67, I_37–I_42. [Google Scholar] [CrossRef] [PubMed]
- Dinku, T.; Ruiz, F.; Connor, S.J.; Ceccato, P. Validation and intercomparison of satellite rainfall estimates over Colombia. J. Appl. Meteorol. Climatol. 2010, 49, 1004–1014. [Google Scholar] [CrossRef]
- Laricchia, F. Global Smartphone Penetration Rate as Share of Population from 2016 to 2023. Available online: https://www.statista.com/statistics/203734/global-smartphone-penetration-per-capita-since-2005/ (accessed on 11 November 2024).
- Pew Research Center. Internet Connectivity Seen as Having Positive Impact on Life in Sub-Saharan Africa; Technical report; Pew Research Center: Washington, DC, USA, 2018. [Google Scholar]
- Tsubo, M.; Walker, S.; Ogindo, H. A simulation model of cereal–legume intercropping systems for semi-arid regions: I. Model development. Field Crops Res. 2005, 93, 10–22. [Google Scholar] [CrossRef]
- Google LLC. Firebase Cloud Firestore. Available online: https://firebase.google.com/docs/firestore (accessed on 11 November 2024).
- Google LLC. Google Cloud BigQuery. Available online: https://cloud.google.com/bigquery (accessed on 11 November 2024).
- Uber Technologies, Inc. kepler.gl. Available online: https://kepler.gl/ (accessed on 11 November 2024).
- Kubota, T.; Shige, S.; Hashizume, H.; Aonashi, K.; Takahashi, N.; Seto, S.; Hirose, M.; Takayabu, Y.N.; Ushio, T.; Nakagawa, K.; et al. Global Precipitation Map Using Satellite-Borne Microwave Radiometers by the GSMaP Project: Production and Validation. IEEE Trans. Geosci. Remote Sens. 2007, 45, 2259–2275. [Google Scholar] [CrossRef]
- Aonashi, K.; Awaka, J.; Hirose, M.; Kozu, T.; Kubota, T.; Liu, G.; Shige, S.; Kida, S.; Seto, S.; Takahashi, N.; et al. GSMaP Passive Microwave Precipitation Retrieval Algorithm: Algorithm Description and Validation. J. Meteorol. Soc. Jpn. Ser. II 2009, 87A, 119–136. [Google Scholar] [CrossRef]
- Ushio, T.; Sasashige, K.; Kubota, T.; Shige, S.; Okamoto, K.; Aonashi, K.; Inoue, T.; Takahashi, N.; Iguchi, T.; Kachi, M.; et al. A Kalman Filter Approach to the Global Satellite Mapping of Precipitation (GSMaP) from Combined Passive Microwave and Infrared Radiometric Data. J. Meteorol. Soc. Jpn. Ser. II 2009, 87A, 137–151. [Google Scholar] [CrossRef]
- Mega, T.; Ushio, T.; Takahiro, M.; Kubota, T.; Kachi, M.; Oki, R. Gauge-Adjusted Global Satellite Mapping of Precipitation. IEEE Trans. Geosci. Remote Sens. 2019, 57, 1928–1935. [Google Scholar] [CrossRef]
| Disclaimer/Publisher’s Note: The statements, opinions and data contained in all publications are solely those of the individual author(s) and contributor(s) and not of MDPI and/or the editor(s). MDPI and/or the editor(s) disclaim responsibility for any injury to people or property resulting from any ideas, methods, instructions or products referred to in the content. |
© 2025 by the authors. Licensee MDPI, Basel, Switzerland. This article is an open access article distributed under the terms and conditions of the Creative Commons Attribution (CC BY) license (https://creativecommons.org/licenses/by/4.0/).
