Abstract
Voice pathology diagnosis is essential for the timely detection and management of voice disorders, which can significantly impact an individual’s quality of life. This study employed logistic regression to evaluate the predictive power of variables that include age, severity, loudness, breathiness, pitch, roughness, strain, and gender on a binary diagnosis outcome (Yes/No). The analysis was performed on the Perceptual Voice Qualities Database (PVQD), a comprehensive dataset containing voice samples with perceptual ratings. Two widely used voice quality assessment tools, CAPE-V (Consensus Auditory-Perceptual Evaluation of Voice) and GRBAS (Grade, Roughness, Breathiness, Asthenia, Strain), were employed to annotate voice qualities, ensuring systematic and clinically relevant perceptual evaluations. The model revealed that age (odds ratio: 1.033, p < 0.001), loudness (odds ratio: 1.071, p = 0.005), and gender (male) (odds ratio: 1.904, p = 0.043) were statistically significant predictors of voice pathology. In contrast, severity and voice quality-related features like breathiness, pitch, roughness, and strain did not show statistical significance, suggesting their limited predictive contributions within this model. While the results provide valuable insights, the study underscores notable limitations of logistic regression. The model assumes a linear relationship between the independent variables and the log odds of the outcome, which restricts its ability to capture complex, non-linear patterns within the data. Additionally, logistic regression does not inherently account for interactions between predictors or feature dependencies, potentially limiting its performance in more intricate datasets. Furthermore, a fixed classification threshold (0.5) may lead to misclassification, particularly in datasets with imbalanced classes or skewed predictor distributions. These findings highlight that although logistic regression serves as a useful tool for identifying significant predictors, its results are dataset-dependent and cannot be generalized across diverse populations. Future research should validate these findings using heterogeneous datasets and employ advanced machine learning techniques to address the limitations of logistic regression. Integrating non-linear models or feature interaction analyses may enhance diagnostic accuracy, ensuring more reliable and robust voice pathology predictions.
1. Introduction
An array of vocal cord disorders afflicts the general population around the world, impacting individual health and lifestyle dynamics. Thus, early and systematic detection significantly contributes to potential effective treatment in vocal cord disorders [1]. Such detection methods, including automated systems, are key in diagnosing, treating, and tracking voice disorders, aiding physicians to treat patients in a timely manner while also identifying those who need hospitalization.
Acoustic reading analysis and in-depth research on automated systems have made significant growth possible in automated detection for vocal disorders. As communication is essential in determining a person’s physical and mental status, recognizing their voice pathology is crucial to healthcare applications specific to the patient [2].
Modern techniques, including indirect laryngoscopy, video laryngoscopy, stroboscope light, and the professional’s ear, can help identify problems with the larynx and vocal folds on an individual level, thus facilitating a qualitative evaluation of these structures. Moreover, medical professionals utilize the Grade, Roughness, Breathiness, Asthenia, Strain (GRBAS) and the Consensus Auditory-Perceptual Evaluation of Voice (CAPE-V) scales to evaluate speech [3].
The most perceived in the category of voice disorders are structural disorders. Physical abnormalities or strenuous damage to the vocal folds and other laryngeal structures result in such structural voice disorders [4]. These disorders can significantly impact voice production limiting the ability to speak. However, with technological advancements, a multitude of tools are being developed to discern a normal voice from a pathological one using acoustical analysis [5].
Subjective auditory-perceptual evaluations have moved to instrumental and AI-based methods to form a more established voice pathology assessment. Use of instrumental techniques like video stroboscopy for vocal fold movement visualization, aerodynamic evaluations for measuring subglottic pressure and airflow, and acoustic analysis for assessing jitter, shimmer, and HNR has significantly improved diagnostic accuracy [6,7]. Combining machine learning and artificial intelligence facilitates predictive analytics and automated classification of vocal and speech disorders, thus enhancing treatment and identification of these disorders with an increased evidence-based approach, resulting in more reliable clinical outcomes.
Logistic regression is a widely used statistical technique for binary classification [8,9,10], making it an appropriate choice for predicting the presence of voice pathology. Pertaining to its simplicity, interpretability, and ability to provide insights into predictor significance, logistic regression is a preferred initial approach for voice pathology diagnosis. This study applied logistic regression to evaluate the relationship between various predictors, including age, severity, loudness, gender, and voice quality features, with the probability of diagnosis employing the PVQD dataset.
Logistic regression (LR) is utilized as the primary classification model for predicting voice pathology using perceptual voice quality ratings from the Consensus Auditory-Perceptual Evaluation of Voice (CAPE-V) scale. CAPE-V provides quantitative assessments of vocal qualities such as roughness, breathiness, strain, pitch, and loudness, which serve as predictor variables in the logistic regression model. The dependent variable is binary, which checks the presence or absence of voice pathology, making LR an appropriate statistical tool for evaluating the relationship between voice quality measures and pathology diagnosis.
The findings from the following study indicated that certain features significantly predicted voice pathology, while others did not meaningfully contribute to the model. Despite its usefulness, logistic regression has inherent limitations, including its assumption of linearity and challenges in capturing complex relationships between variables. The model’s sensitivity to outliers and the potential for overfitting or underfitting further impacts its predictive reliability. These constraints highlight the necessity for broader validation and the exploration of more advanced machine learning techniques to enhance diagnostic accuracy and generalizability.
2. Literature Review
Annually, around 8% to 10% of individuals are affected by voice pathologies, which is directly proportional to the amount of strain they exert on the voice. As a result, professionals using voice continuously at work, such as teachers, are affected more. Such incidence exceeds 28% [11,12,13] and reaches up to 58% [14]. Even so, the number of people being treated for voice disorders remains low.
To improve the treatment of these pathologies, several Automatic Voice Disorder Detection (AVDD) systems have been proposed. They aim to detect these issues and facilitate their treatment. In recent years, the design of AVDD systems, such as the acoustic features, has been studied. Acoustic features have been looked at to represent the audio, with some of them being Mel-Frequency Cepstral Coefficients (MFCCs) [15,16,17], Linear Predictive Cepstral Coefficients (LPCCs) [18], and glottal source features.
The range of statistical classifiers used includes logistic regression for binary classification tasks, Gaussian Mixture Models (GMMs), and Support Vector Machines (SVMs) [6]. Classifiers based on Deep Neural Network (DNN) architectures, such as Convolutional Neural Networks (CNNs) [8] and Long Short-Term Memory (LSTM) networks [7], have also successfully established their efficiency in voice-related studies. To extract features from audio information, self-supervised (SS) learning representations have been employed recently [9]. The effectiveness of these representations lies in the ability of SS representation learning to expose underlying relationships in data. As classifiers, they use architectures such as Multi-Layer Perceptrons (MLPs) and Class Token Transformer (CT Transformer) designs based on a Multihead Self-Attention (MSA) [10]. A drawback is that these representations require large amounts of audio data for training. The availability and variability of pathological voice data are limited, and constraints have been imposed on the progress of these systems, with the result being that several current studies focus on generating new synthetic data.
The contribution made by machine learning algorithms to the field of voice pathology has helped achieve commendable progress in the classification and detection of voice disorders Emerging powerful tools for medical diagnostics—deep learning and machine learning—could enable an individual to identify pathological conditions non-invasively and accurately from the analyses of human voice. Notable works that use deep learning models on mobile healthcare frameworks have been conducted to identify voice pathology. An example would be the system developed by Alhussein et al. to detect voice pathology using CNN architectures like VGG-16 and CaffeNet using transfer learning techniques. The system they developed was tested on the Saarbrucken voice disorder database, producing an overall classification accuracy of 97.5%. Its exceptional performance clearly demonstrated the potential deep learning has in real-time, mobile-oriented healthcare applications [19].
Another instance is where Mittal et al. came up with a deep learning-based architecture that features decision-level fusion with non-parametric learners for classifying voice pathologies. The model performed considerably better than traditional machine learning approaches, detecting voice pathologies with a classification accuracy of 99.14%. This has several important implications for deep learning with the aim of enhancing the robustness and accuracy of systems designed for voice pathology detection [20].
Ghoniem et al. proposed a hybrid diagnostic system where deep CNNs are integrated with GAs to optimize the classification process. This not only increased the classification performance by 5.4% over standard CNNs but yielded a total accuracy of 99.37%, thus proving the potential of hybrid AI models in voice pathology diagnostics [21].
Another important contribution is made by Miliaresi et al. They propose a deep learning architecture module in voice signal and medical metadata processing to classify voice disorders. Their module, which reached a 64.4% accuracy classification, provided evidence to the potential of combining several data modalities to improve diagnostic performance. This approach is critical in addressing the challenges posed by limited training data, a common issue in medical applications [22].
The electroglottographic signals have also been integrated into the deep learning models of voice pathology classification. The multimodal system developed by Miliaresi et al. utilizes such signals besides conventional audio descriptors and medical data. The incorporation greatly improved this system’s classification ability, reaching the state-of-the-art accuracy of 89.3%, with the reason being that such a type of multimodal approach is very important for the reflection of the highly complex nature of voice disorders and in improving the accuracy of diagnosis [23].
Similar is the research conducted by Wang et al., which demonstrated the potential of DNNs regarding the classification of voice signals of patients with glottic neoplasms versus those with benign voice disorders. This research, having a testing accuracy of 86.11%, reflects the appropriateness of DNNs within medical diagnosis, especially in the early stage detection of certain voice pathologies [24].
Ksibi et al. developed a two-level classifier model that categorizes first the gender of the voice and then decides whether it is healthy or pathological. This approach focuses on the vowel/a/taken from the Saarbruecken Voice Database and obtained 88.84% accuracy; thus, this forms a promising direction toward a more accurate early diagnosis of voice pathologies [25]. Chen and Chen developed an automatic diagnosis method using a DNN for detecting pathological voices. In this, the DNN model outperformed Support Vector Machines and random forests to achieve an accuracy of 98.6%, thus showing the effectiveness of deep learning in this application [26].
Oropharyngeal dysphagia (OD) impacts health and quality of life to a great extent, with aspiration being a key concern, typically assessed using gold-standard tools like FEES and VFSS. A study by Heijnen et al. employed penalized logistic regression to predict aspiration in OD patients using self-evaluation questionnaires (e.g., SWAL-QOL, DHI, EAT-10) and oral intake status, achieving excellent model performance with an AUC of 0.92. These findings suggest that non-invasive assessments combined with logistic regression can provide an accurate alternative for predicting aspiration in situations where instrumental evaluations are unavailable [27].
A retrospective study by Huwyler et al. evaluated compliance with speech therapy for voice disorders among English- and non-English-speaking patients using logistic regression models. Results indicated that non-English-speaking patients had significantly lower compliance (63% vs. 74%, p = 0.0011), with interpreter needs, younger age, and lower income being associated with higher noncompliance (aOR 1.56, 95% CI 1.11–2.18). The study highlights that interventions like in-person interpreters or multilingual speech therapists may mitigate barriers to therapy compliance for non-English-speaking populations [28].
Parkinson’s disease (PD) is often associated with hypokinetic dysarthria (HD), and a study by D. Kovac et al. aimed to identify acoustic features for language-independent diagnosis. Using logistic regression, the study achieved 72–73% classification accuracy in single-language models, which dropped to 67% in multilingual models, highlighting the challenge of cross-language generalization. Prosodic features, interword pause frequency in particular, were identified as significant predictors, suggesting their potential for automatic and language-independent PD diagnosis [29].
Wahengbam et al. proposed a deep learning architecture for the multiclass classification of voice pathologies by utilizing a “group decision analogy” technique. Their model performed a maximum overall classification accuracy of 97.7%, while some pathologies like hypokinetic dysphonia and reflux laryngitis gave 100% classification [30].
According to Seok et al., a review of the current trends in AI-based research on voice pathology explicated the progress made both in binary and multi-classification tasks. They discussed some challenges and limitations of applying AI in clinical settings, including the need for large datasets and embedding continuous speech analysis, capable of enhancing diagnostic accuracy further [31]. Applications of ML have shown promising success in the domain of voice pathology detection [32].
This study proposes to explore the insights and challenges in the use of logistic regression in voice pathology detection.
The objectives of this study are as follows:
- 1.
- Evaluate the effectiveness of logistic regression in voice pathology detection by analyzing its predictive performance on the Perceptual Voice Qualities Database (PVQD) using CAPE-V scale ratings.
- 2.
- Identify significant predictors of voice pathology and assess their statistical influence through odds ratios and p-values in the logistic regression model.
- 3.
- Analyze the limitations and challenges of logistic regression in handling non-linear relationships, feature interactions, and dataset variability and propose potential improvements through advanced machine learning techniques.
The enhancement in accuracy and robustness revealed by these reviews point to revolutionizing voice pathology diagnostics using these technologies. Although it remains that the challenges with data limitations, model interpretability, and clinical implementation still persist, future research on how these challenges can be met to actually realize the full potential of AI in this domain might suggest a total solution.
3. Materials and Methods
Perceptual Voice Qualities DatabasePVQD
The PVQD database comprises 296 audio files, including sustained vowels (/a/, /i/) and English sentence recordings [33]. To evaluate voice quality, it employs two perceptual assessment tools, CAPE-V and GRBAS. CAPE-V uses a visual analog scale to detect subtle variations in traits like breathiness, roughness, and severity. At the same time, GRBAS offers a quicker, categorical scoring system to assess overall dysphonia and features like strain. Together, these tools provide accurate annotations, enabling the correlation of acoustic features with perceptual voice qualities.
Table 1 shows the PVQD dataset, which is categorized by age and pathology, including 9 samples from individuals under 18, 116 from the 18–40 age group, and 171 from those over 40. Among them, 161 samples are pathological, primarily from individuals over 40 (124 samples). There are 21 samples with undefined pathology, 89 classified as normal (mostly from the 18–40 age group), and 25 samples where pathology was not predicted. This categorization aids in analyzing voice quality variations across age and pathology.

Table 1.
Detailed description of PVQD dataset.
Table 2 gives a statistical summary of voice features. In Table 3, the detailed description of the dataset includes perceptual ratings of voice quality across six parameters: severity, breathiness, loudness, pitch, roughness, and strain. All parameters have complete data (296 valid entries and no missing values), ensuring robustness for statistical analysis. The mean scores suggest that severity (29.36) is the most prominent perceptual feature, followed by strain (21.09), roughness (20.70), and breathiness (19.78), indicating these attributes are commonly observed in the sample.
Table 2.
Statistical summary of voice features.
Table 3.
Summary of voice parameters.
The wide range of scores (e.g., severity: 0.33 to 98.67) and substantial standard deviations (e.g., severity: 25.14) indicate significant variability in voice characteristics across participants, reflective of a diverse population with varying voice disorders. Lower minimum scores and the presence of extreme maximum values suggest the inclusion of both mild and severe cases of dysphonia.
The high standard errors of the mean across parameters (ranging from 1.07 to 1.46) underscore the need for cautious interpretation of population-level generalizations. This variability projects the importance of further investigation into the interplay between these perceptual features to understand the multidimensional nature of voice disorders better.
Such insights can inform predictive modeling efforts, where understanding the distributions and variability of these features is critical for feature selection and classifier performance in diagnosing voice pathologies. Table 4 and Table 5 include the frequencies of diagnosis and gender in the dataset.
Table 4.
Frequencies for gender.
Table 5.
Frequencies for diagnosis.
The PVQD dataset analysis shows higher mean values for severity (36.33 vs. 17.39), breathiness (25.20 vs. 10.48), loudness (25.69 vs. 6.69), pitch (21.99 vs. 6.62), roughness (25.03 vs. 13.28), and strain (26.51 vs. 11.80) in pathological compared to non-pathological samples. Pathological samples also exhibit greater variability and higher maximum values across all features, reflecting more severe voice impairments. These differences underscore the relevance of these acoustic features in distinguishing healthy from pathological voices for diagnostic purposes.
The boxplots in Figure 1 illustrate the distribution of six perceptual voice quality features—severity, breathiness, loudness, pitch, roughness, and strain—across two diagnostic groups (Yes: pathological, No: non-pathological). For all features, pathological samples exhibit higher median values and a broader interquartile range than non-pathological samples, indicating more significant variability and severity of impairment. Outliers are more prevalent in the pathological group, particularly in severity, breathiness, and pitch, reflecting extreme deviations in voice quality associated with voice disorders. In contrast, non-pathological samples show relatively lower values with minimal dispersion, suggesting consistency and milder voice characteristics. These results highlight the significant role of these features in differentiating between healthy and pathological voices, reinforcing their diagnostic relevance in clinical and computational analyses.
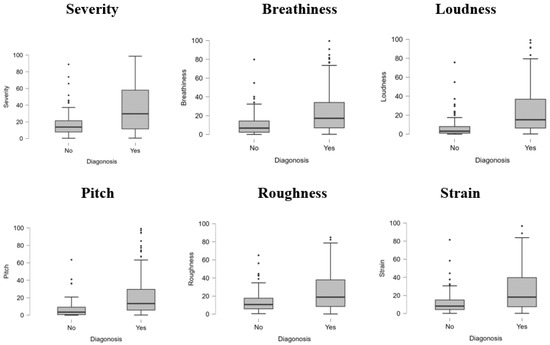
Figure 1.
Boxplot for diagnosis.
Table 6 summarizes the performance of two models (: null model, : fitted model) for predicting diagnosis using logistic regression. The deviance measures the models’ goodness of fit, where the lower deviance in (289.574) compared to (389.544) indicates a better fit. The Akaike Information Criterion (AIC) and Bayesian Information Criterion (BIC), which penalize model complexity, are lower for (AIC = 307.574, BIC = 340.787), further supporting the improved performance of the fitted model. The likelihood ratio test () demonstrates significant improvement () in , confirming its superiority over the null model.
Table 6.
Model summary—diagnosis.
The goodness-of-fit metrics include several pseudo- measures: McFadden’s (0.257), Nagelkerke’s (0.392), Tjur’s (0.308), and Cox and Snell’s (0.287). McFadden’s indicates that the model explains 25.7% of the variation, a reasonable value for logistic regression. Nagelkerke’s adjusts for maximum scaling, showing a higher explained variance (39.2%). Tjur’s , reflecting the mean difference in predicted probabilities between groups, is 30.8%, and Cox and Snell’s demonstrates moderate model performance at 28.7%. These combined metrics indicate a robust logistic regression model with significant predictive capacity for diagnosis. Table 7 shows the estimated coefficients, standard errors, odds ratios, and Wald test statistics for a logistic regression model predicting voice pathology based on demographic and voice quality characteristics.
Table 7.
Logistic regression coefficients for voice pathology prediction.
4. Logistic Regression Model
The logistic regression model predicts the probability of an event (e.g., diagnosis = “Yes”) based on a set of independent predictor variables :
where
- is the probability of the diagnosis being “Yes” (presence of pathology).
- e is Euler’s number ().
- is the intercept term of the model.
- are the regression coefficients for each predictor variable.
- represent the predictor variables (e.g., acoustic features like severity, breathiness, pitch, roughness, strain, and loudness).
Log-Odds (Linear Form)
The model is first expressed in terms of the log-odds (logit function):
5. Results and Discussion
The logistic regression analysis of the dataset provided insights into the influence of age, gender, loudness, and severity on the probability of voice pathology diagnosis. Figure 2 shows the results that indicate that age exhibited a positive linear relationship with the likelihood of diagnosis, with older individuals being at higher risk (Figure 2, top-left). This aligns with the general understanding that aging is a risk factor for many voice disorders due to degenerative changes in the vocal folds. Nevertheless, this pattern may not generalize to datasets focusing on pediatric populations or those with specific non-age-related pathologies.
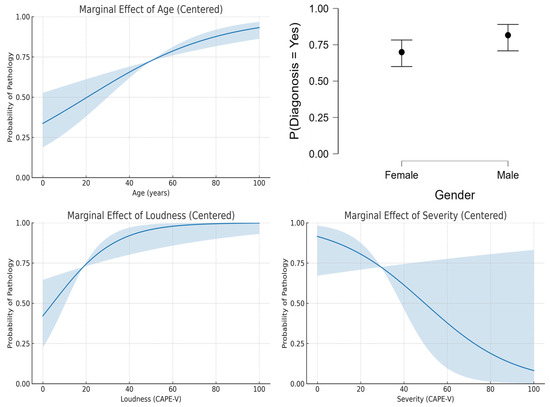
Figure 2.
Predicted features.
Gender appeared to have a minimal impact on diagnosis probabilities, as shown by the nearly identical values for men and women (Figure 2, top-right). This suggests that the dataset used in this study lacks significant gender bias in the prevalence of voice disorders. However, other datasets may reveal variations due to known differences in the anatomy and physiology of male and female vocal folds, as well as the prevalence of gender-specific disorders. Also, the relationship between loudness and diagnosis (Figure 2, bottom-left) might vary depending on the specific disorder studied, as certain conditions, such as vocal fatigue, are closely associated with changes in loudness levels.
It was interesting to note that the results showed a decreasing trend in diagnosis probability with increasing severity scores (Figure 2, bottom-right), counterintuitive to clinical expectations. This trend may reflect a limitation in the dataset or the logistic regression model’s assumptions, as severity typically correlates positively with the likelihood of pathology.
Figure 3 and Figure 4 give the ROC curve and confusion matrix. This observation emphasizes the importance of evaluating model assumptions and feature relationships carefully when applying logistic regression. These findings also suggest that while logistic regression provides valuable insights, its linear assumption may not capture complex, non-linear relationships in some datasets.
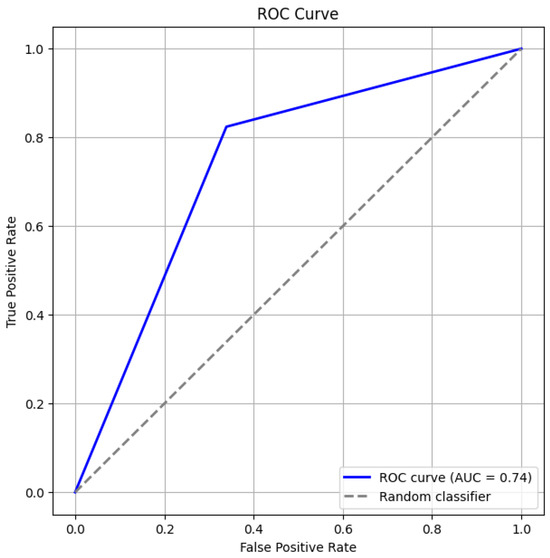
Figure 3.
ROC Curve.
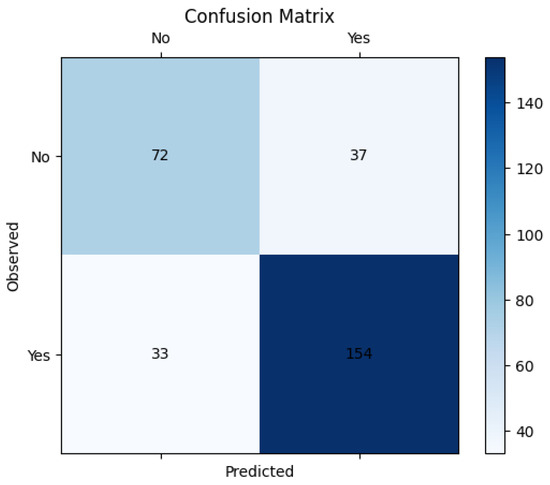
Figure 4.
Confusion matrix.
Performance Matrices
In Figure 5, the performance metrics are used to assess the performance of classification models, particularly in machine learning applications. Sensitivity, specificity, precision, and F1-score help to evaluate how well a model distinguishes between different classes, ensuring accurate predictions and minimizing errors in decision-making. The high sensitivity (82.4%) indicates that the model effectively detects pathological cases, minimizing false negatives. However, the lower specificity (66.1%) suggests that some non-pathological cases were misclassified, leading to false positives. The precision (80.7%) demonstrates that most of the predicted pathological cases were indeed correct. The F1-score (81.5%), as a harmonic mean of precision and recall, reflects a balanced model performance.
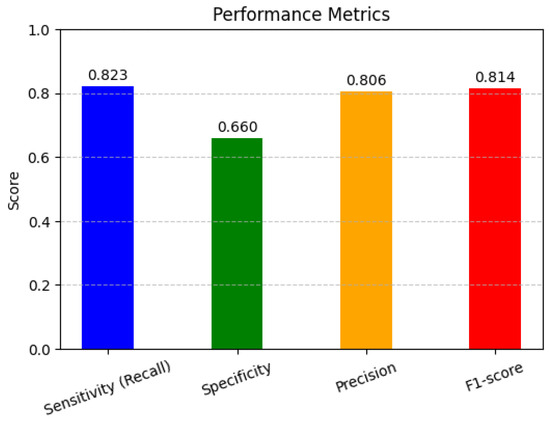
Figure 5.
Performance matrices.
- 1.
- Sensitivity (Recall) (True Positive Rate)Sensitivity measures how well the model identifies actual positive cases.
- 2.
- Specificity (True Negative Rate)Specificity measures how well the model identifies actual negative cases.
- 3.
- Precision (Positive Predictive Value)Precision measures how many predicted positives are actually positive.
- 4.
- F1-Score (Harmonic Mean of Precision and Recall)
6. Conclusions
This study demonstrates the utility of logistic regression in predicting voice pathology using the Perceptual Voice Qualities Database (PVQD), which integrates perceptual voice assessments through the CAPE-V and GRBAS tools. The analysis identified age, loudness, and gender as significant predictors of voice pathology, while features such as severity, breathiness, pitch, roughness, and strain did not contribute significantly to the model’s performance. These findings underscore the importance of demographic variables and specific voice quality measures in diagnosing voice disorders. However, the limitations of logistic regression, including its linear assumptions and inability to capture complex interactions or non-linear relationships, highlight the need for more robust analytical approaches when working with intricate datasets like PVQD. Future research should focus on validating these findings across larger and more diverse datasets to improve generalizability. Incorporating advanced machine learning techniques, such as non-linear models and interaction analyses, can aid in overcoming the limitations of logistic regression by capturing complex patterns and dependencies between features. It is to be added that the integration of acoustic features with perceptual ratings may enhance predictive accuracy, providing a more comprehensive understanding of voice pathology. Developing hybrid models that combine clinical knowledge with machine learning could further improve diagnostic precision, ultimately supporting clinicians in timely and reliable voice disorder assessments.
Author Contributions
Conceptualization, D.M.O. and S.A.P.; methodology, D.M.O.; software, D.M.O.; validation, D.M.O. and S.A.P.; formal analysis, D.M.O.; investigation, D.M.O.; resources, D.M.O.; data curation, D.M.O. and S.A.P.; writing—original draft preparation, D.M.O.; writing—review and editing, D.M.O. and S.A.P.; visualization, D.M.O.; supervision, S.A.P.; project administration, S.A.P. All authors have read and agreed to the published version of the manuscript.
Funding
This research received no external funding.
Institutional Review Board Statement
Not applicable.
Informed Consent Statement
Not applicable.
Data Availability Statement
Data are available in this manuscript.
Conflicts of Interest
The authors declare no conflicts of interest.
References
- Zhang, Y.; Querney, J.; Subramani, Y.; Naismith, K.; Singh, P.; Fochesato, L.A.; Fatima, N.; Wood, N.; Malthaner, R.; Nagappa, M. Biobeat Monitor Utilization in Various Healthcare Settings: A Systematic Review. Digit. Health 2025, 1, 20552076251324012. [Google Scholar] [CrossRef] [PubMed]
- Preciado-Lopez, J.; Pérez-Fernández, C.P.; Calzada-Uriondo, M.; Preciado-Ruiz, P. Epidemiological Study of Voice Disorders Among Teaching Professionals of La Rioja, Spain. J. Voice 2008, 22, 489–508. [Google Scholar] [CrossRef]
- Godall, G.; Gassull, C.; Amador, M. Epidemiological Voice Health Map of the Teaching Population of Granollers (Barcelona) Developed from the EVES Questionnaire and the VHI. Logop. Phoniatr. Vocology 2015, 40, 171–178. [Google Scholar] [CrossRef]
- Ubillos, S.; Centeno, J.; Ibanez, J.; Iraurgi, I. Protective and Risk Factors Associated with Voice Strain among Teachers in Castile and Leon, Spain: Recommendations for Voice Training. J. Voice 2015, 29, 261.e1–261.e12. [Google Scholar] [CrossRef]
- Ali, Z.; Alsulaiman, M.; Muhammad, G.; Elamvazuthi, I.; Mesallam, T.A. Vocal Fold Disorder Detection Based on Continuous Speech by Using MFCC and GMM. In Proceedings of the 7th IEEE GCC Conference and Exhibition (GCC), Doha, Qatar, 17–20 November 2013; pp. 292–297. [Google Scholar]
- Godino-Llorente, I.; Aguilera-Navarro, S.; Gomez-Vilda, P. LPC, LPCC and MFCC Parameterization Applied to the Detection of Voice Impairments. In Proceedings of the Sixth International Conference on Spoken Language Processing, ICSLP 2000/INTERSPEECH 2000, Beijing, China, 16–20 October 2000. [Google Scholar]
- AL-Dhief, T.F.; Latiff, N.M.A.; Baki, M.M.; Malik, N.N.N.A.; Sabri, N.; Albadr, M.A. Voice Pathology Detection Using Support Vector Machine Based on Different Number of Voice Signals. In Proceedings of the 26th IEEE Asia-Pacific Conference on Communications (APCC), Kuala Lumpur, Malaysia, 11–13 October 2021; pp. 1–6. [Google Scholar]
- Narendra, N.; Alku, P. Glottal Source Information for Pathological Voice Detection. IEEE Access 2020, 8, 67745–67755. [Google Scholar] [CrossRef]
- Mohammed, M.A.; Abdulkareem, K.H.; Mostafa, S.A.; Khanapi Abd Ghani, M.S.; Maashi, B.; Garcia-Zapirain, B.; Oleagordia, I.; Alhakami, H.; AL-Dhief, F.T. Voice Pathology Detection, Classification Using Convolutional Neural Network Model. Appl. Sci. 2020, 10, 3723. [Google Scholar] [CrossRef]
- Ribas, D.; Pastor, M.A.; Miguel, A.; Martínez, D.; Ortega, A.; Lleida, E. Automatic Voice Disorder Detection Using Self-Supervised Representations. IEEE Access 2023, 11, 14915–14927. [Google Scholar] [CrossRef]
- Dosovitskiy, A.; Beyer, L.; Kolesnikov, A.; Weissenborn, D.; Zhai, X.; Unterthiner, T.; Dehghani, M.; Minderer, M.; Heigold, G.; Gelly, S.; et al. An Image is Worth 16x16 Words: Transformers for Image Recognition at Scale. arXiv 2020, arXiv:2010.11929. [Google Scholar]
- Heijnen, B.J.; Böhringer, S.; Speyer, R. Prediction of Aspiration in Dysphagia Using Logistic Regression: Oral Intake and Self-Evaluation. Eur. Arch. Otorhinolaryngol. 2020, 277, 197–205. [Google Scholar] [CrossRef]
- Huwyler, C.; Merchant, M.; Jiang, N. Disparities in Speech Therapy for Voice Disorders Between English- and Non-English-Speaking Patients. Laryngoscope 2021, 131, E2298–E2302. [Google Scholar] [CrossRef] [PubMed]
- Kovac, D.; Mikulic, I.; Stojsih, D.; Sen, M.; Bubanja, D.; Munteanu, F.; Petrovic, N.; Zivkovic, J. Multilingual Analysis of Speech and Voice Disorders in Patients with Parkinson’s Disease. In Proceedings of the 44th International Conference on Telecommunications and Signal Processing (TSP), Brno, Czech Republic, 26–28 July 2021; pp. 273–277. [Google Scholar] [CrossRef]
- Albadr, M.A.A.; Asiri, M.M.; Zakariah, M.; Hakami, A.; Gheraibia, Y. Fast Learning Network Algorithm for Voice Pathology Detection and Classification. Multimed. Tools Appl. 2024, 83, 1615–1630. [Google Scholar] [CrossRef]
- Ur Rehman, M.; Shafique, A.; Azhar, Q.-U.-A.; Jamal, S.S.; Gheraibia, Y.; Usman, A.B. Voice Disorder Detection Using Machine Learning Algorithms: An Application in Speech and Language Pathology. Eng. Appl. Artif. Intell. 2024, 133, 108047. [Google Scholar] [CrossRef]
- Payten, C.L.; Weir, K.A.; Madill, C.J. Investigating Current Clinical Practice in Assessment and Diagnosis of Voice Disorders: A Cross-Sectional Multidisciplinary Global Web Survey. Int. J. Lang. Commun. Disord. 2024, 59, 2786–2805. [Google Scholar] [CrossRef] [PubMed]
- Abdulmajeed, N.Q.; Al-Khateeb, B.; Mohammed, M.A. A Review on Voice Pathology: Taxonomy, Diagnosis, Medical Procedures and Detection Techniques, Open Challenges, Limitations, and Recommendations for Future Directions. J. Intell. Syst. 2022, 31, 855–875. [Google Scholar] [CrossRef]
- Alhussein, M.A.; Muhammad, G. Voice Pathology Detection Using Deep Learning on Mobile Healthcare Framework. IEEE Access 2018, 6, 41034–41041. [Google Scholar] [CrossRef]
- Mittal, V.; Sharma, R. Deep Learning Approach for Voice Pathology Detection and Classification. Int. J. Health Inf. Syst. Inform. 2021, 16, 1–30. [Google Scholar] [CrossRef]
- Ghoniem, R.M. Deep Genetic Algorithm-Based Voice Pathology Diagnostic System. In Lecture Notes in Computer Science; Springer: Cham, Switzerland, 2019; pp. 220–233. [Google Scholar]
- Miliaresi, A.; Pikrakis, G. A Modular Deep Learning Architecture for Voice Pathology Classification. IEEE Access 2023, 11, 80465–80478. [Google Scholar] [CrossRef]
- Miliaresi, A.; Pikrakis, G.; Poutos, K. A Deep Multimodal Voice Pathology Classifier with Electroglottographic Signal Processing Capabilities. In Proceedings of the 7th International Conference on Frontiers of Signal Processing (ICFSP), Paris, France, 7–9 September 2022; pp. 109–113. [Google Scholar] [CrossRef]
- Wang, C.-T.; Chuang, Z.-Y.; Hung, C.-H.; Tsao, Y.; Fang, S.-H. Detection of Glottic Neoplasm Based on Voice Signals Using Deep Neural Networks. IEEE Sens. Lett. 2022, 6, 6000604. [Google Scholar] [CrossRef]
- Ksibi, N.; Hakami, A.; Alturki, N.; Asiri, M.M.; Zakariah, M.; Ayadi, M. Voice Pathology Detection Using a Two-Level Classifier Based on Combined CNN-RNN Architecture. Sustainability 2023, 15, 43204. [Google Scholar] [CrossRef]
- Chen, L.; Chen, J. Deep Neural Network for Automatic Classification of Pathological Voice Signals. J. Voice 2022, 36, e25–e35. [Google Scholar] [CrossRef]
- Fang, S.-H.; Lin, S.-H.; Liu, C.-M.; Lin, J.-L.; Tsai, S.-S.; Yang, M.-S.; Yen, J.-T.; Wang, C.-T.; Lin, W.-L. Detection of Pathological Voice Using Cepstrum Vectors: A Deep Learning Approach. J. Voice 2019, 33, 155.e1–155.e9. [Google Scholar] [CrossRef] [PubMed]
- AL-Dhief, F.T.; Latiff, N.M.A.; Baki, M.M.; Malik, N.N.N.A.; Sabri, N.; Albadr, M.A. Voice Pathology Detection and Classification by Adopting Online Sequential Extreme Learning Machine. IEEE Access 2021, 9, 77293–77306. [Google Scholar] [CrossRef]
- Javanmardi, F.; Kadiri, S.R.; Kodali, M.; Alku, P. Comparing 1-Dimensional and 2-Dimensional Spectral Feature Representations in Voice Pathology Detection Using Machine Learning and Deep Learning Classifiers. In Proceedings of the Interspeech 2022, Incheon, Republic of Korea, 18–22 September 2022; pp. 2173–2177. [Google Scholar] [CrossRef]
- Heider, C.A.; Álvarez, M.L.; Fuentes-López, E.; González, C.A.; León, N.I.; Verástegui, D.C.; Badía, P.I.; Napolitano, C.A. Prevalence of Voice Disorders in Healthcare Workers in the Universal Masking COVID-19 Era. Laryngoscope 2021, 131, E1227–E1233. [Google Scholar] [CrossRef]
- Nacci, A. Reflux Symptom Index (RSI) and Singing Voice Handicap Index (SVHI) in Singing Students: A Pilot Study. J. Voice 2022, 36, 288.e25. [Google Scholar] [CrossRef]
- Pasternak, K.; Thibeault, S.L. Factors Affecting Initiation of Voice Therapy for Paradoxical Vocal Fold Motion Disorder. J. Voice 2020, 34, 559–566. [Google Scholar] [CrossRef] [PubMed]
- Walden, P. Perceptual Voice Qualities Database (PVQD): Database Characteristics. J. Voice 2022, 36, 875.e15–875.e23. [Google Scholar] [CrossRef] [PubMed]


Disclaimer/Publisher’s Note: The statements, opinions and data contained in all publications are solely those of the individual author(s) and contributor(s) and not of MDPI and/or the editor(s). MDPI and/or the editor(s) disclaim responsibility for any injury to people or property resulting from any ideas, methods, instructions or products referred to in the content. |
© 2025 by the authors. Licensee MDPI, Basel, Switzerland. This article is an open access article distributed under the terms and conditions of the Creative Commons Attribution (CC BY) license (https://creativecommons.org/licenses/by/4.0/).