Proceeding Paper

Sentiment Analysis of Air Pollution in Jakarta Using the Bidirectional Encoder Representations from Transformers (BERT) Method †

Information System, Nusa Putra University, Sukabumi 43155, Indonesia
*
Author to whom correspondence should be addressed.
Presented at the 7th International Global Conference Series on ICT Integration in Technical Education & Smart Society, Aizuwakamatsu City, Japan, 20–26 January 2025.
Eng. Proc. 2025, 107(1), 131; https://doi.org/10.3390/engproc2025107131
Published: 20 October 2025

Abstract

Air pollution represents a critical environmental challenge in Jakarta, significantly affecting public health and overall quality of life. This study aims to examine public sentiment regarding air pollution in Jakarta through the application of the Bidirectional Encoder Representations from Transformers (BERT) methodology. The selection of this method is based on its proficiency in comprehending contextual nuances within textual data, thereby facilitating a more precise sentiment analysis. The data utilized in this research is sourced from social media platforms, particularly Twitter, which serves as a vibrant and informative repository of public opinion. The findings of the analysis indicate a predominance of negative sentiments concerning air pollution, influenced by various factors such as governmental policies and prevailing environmental conditions. This research aspires to enhance understanding of public perceptions related to air pollution and contribute to more informed decision-making in environmental policy formulation.

1. Introduction

As the capital city of Indonesia, Jakarta faces significant challenges related to air pollution. Data from the DKI Jakarta Environment Agency reveals that the air quality in Jakarta frequently falls into the unhealthy category, with the Air Pollution Standard Index (ISPU) often exceeding the specified threshold [1]. In recent years, air pollution has become a pressing concern, particularly due to the increasing number of motorized vehicles and uncontrolled industrial activities. According to a report from the Ministry of Environment and Forestry, emissions from the transportation sector account for more than 70% of total pollutant emissions in Jakarta [2]. Additionally, the concentrations of PM2.5 in Jakarta currently reach 9.1 times the World Health Organization’s annual air quality guideline value, highlighting the seriousness of this issue and its impact on public health [3].
This phenomenon not only impacts individuals’ physical health but also diminishes the overall quality of life. Research has demonstrated that air pollution is linked to a range of health issues, including respiratory and cardiovascular diseases, as well as an increased risk of premature mortality [4]. Furthermore, air pollution adversely affects work productivity and the quality of education, which can ultimately impede economic development in Jakarta. In this regard, it is crucial to comprehend how the public reacts to air pollution concerns through social media, which has emerged as a significant platform for disseminating information and expressing opinions.
Sentiment analysis serves as an effective approach for assessing individuals’ perspectives on specific issues. By employing machine learning algorithms such as BERT, researchers can analyze textual data from social media to uncover emerging sentiment patterns. The BERT methodology, developed by Google, offers the advantage of comprehending the contextual meaning of words within sentences, thereby yielding more accurate analytical results compared to traditional methods [5,6]. This research aims to investigate how residents of Jakarta articulate their sentiments regarding air pollution and the various factors that influence these sentiments.
The primary data source for this study is Twitter, a platform extensively utilized by the public to convey their opinions and experiences related to air pollution issues. Twitter possesses distinctive characteristics that allow users to share information in a concise format, facilitating the rapid collection of substantial amounts of data. Prior research indicates that sentiment analysis conducted on Twitter can effectively reflect public opinion [7,8]. Consequently, this study will leverage data from Twitter to analyze public sentiment regarding air pollution in Jakarta.
Given this context, this research aims to enhance the understanding of the dynamics of public sentiment regarding air pollution in Jakarta. The findings from this analysis are anticipated to serve as a valuable reference for policymakers in developing more effective strategies to address air pollution challenges and improve the quality of life for the community. Additionally, this study is expected to lay the groundwork for future research in the fields of sentiment analysis and environmental studies, while also offering deeper insights into the relationship between society and critical environmental issues.
Twitter is one of the social media platforms that has gained high popularity among internet users due to its simple and easy-to-use interface [9,10]. Users have the freedom to express their opinions freely on this platform.
In prior research concerning sentiment analysis, Kurniawan et al. discovered that the Bidirectional Encoder Representations from Transformers (BERT) achieved accuracies of 69%, 55%, and 55% at two different time points while utilizing the same hyperparameters, specifically a batch size of 16 and 5 epochs. The test results indicated that the number of epochs yields satisfactory outcomes [11]. Furthermore, the accuracy obtained when employing BERT is influenced by the imbalance within the dataset. Notably, despite the smaller size of balanced datasets compared to unbalanced ones, the accuracy for balanced datasets is 62% higher [12,13].
With reference to this context, the research to be carried out by the author will use deep learning methods using the BERT (Bidirectional Encoder Representations from Transformers) language model to analyze public sentiment through comments on Twitter related to air pollution news in DKI Jakarta. The sentiments will be grouped into two categories, namely negative and positive.

2. Materials and Methods

The proposed method in analyzing sentiment towards air pollution in Jakarta using the Bidirectional Encoder Representations from Transformers method consists of several steps as shown in Figure 1.
The flowchart presented above outlines the process of sentiment analysis, which commences with the collection of data from Twitter regarding air pollution in Jakarta. The data acquired through web scraping is compiled to form a dataset. This dataset is subsequently divided into individual sentences and annotated with either negative or positive labels. Following this, the annotated dataset undergoes a preprocessing phase. Dataset preprocessing is essential for transforming initially unstructured data into a more organized format, involving several steps such as case folding, data cleaning, tokenization, removal of stop words, stemming, and normalization of non-standard language. Once the dataset has completed these processes, it is utilized to train the BERT model for classification into two categories: negative and positive. The results of this classification are then evaluated to assess their performance.

2.1. Data Collection

Data for this study was gathered by scraping Twitter comments from various discussions concerning air pollution in Jakarta. The data collection was conducted using the Tweet Harvest tool, resulting in a total of 2453 comments, which were subsequently stored in a (.csv) format. At this stage, the data collection process has been completed successfully, achieving a 100% collection rate of the targeted comments.
Public discussion regarding Jakarta’s air pollution can be seen in Twitter comments (Figure 2).

2.2. Labelling

Labelling is performed with the aim of categorizing comments into negative or positive categories, by giving a value as a marker. Positive sentiment comments are given a value of 1 and negative will be given a value of 0. This labelling process is carried out by a team of three annotators. The labelling example is in Table 1 and Table 2.
Table 2 shows an example of sample comment data containing positive and negative values.

2.3. BERT Input Representation

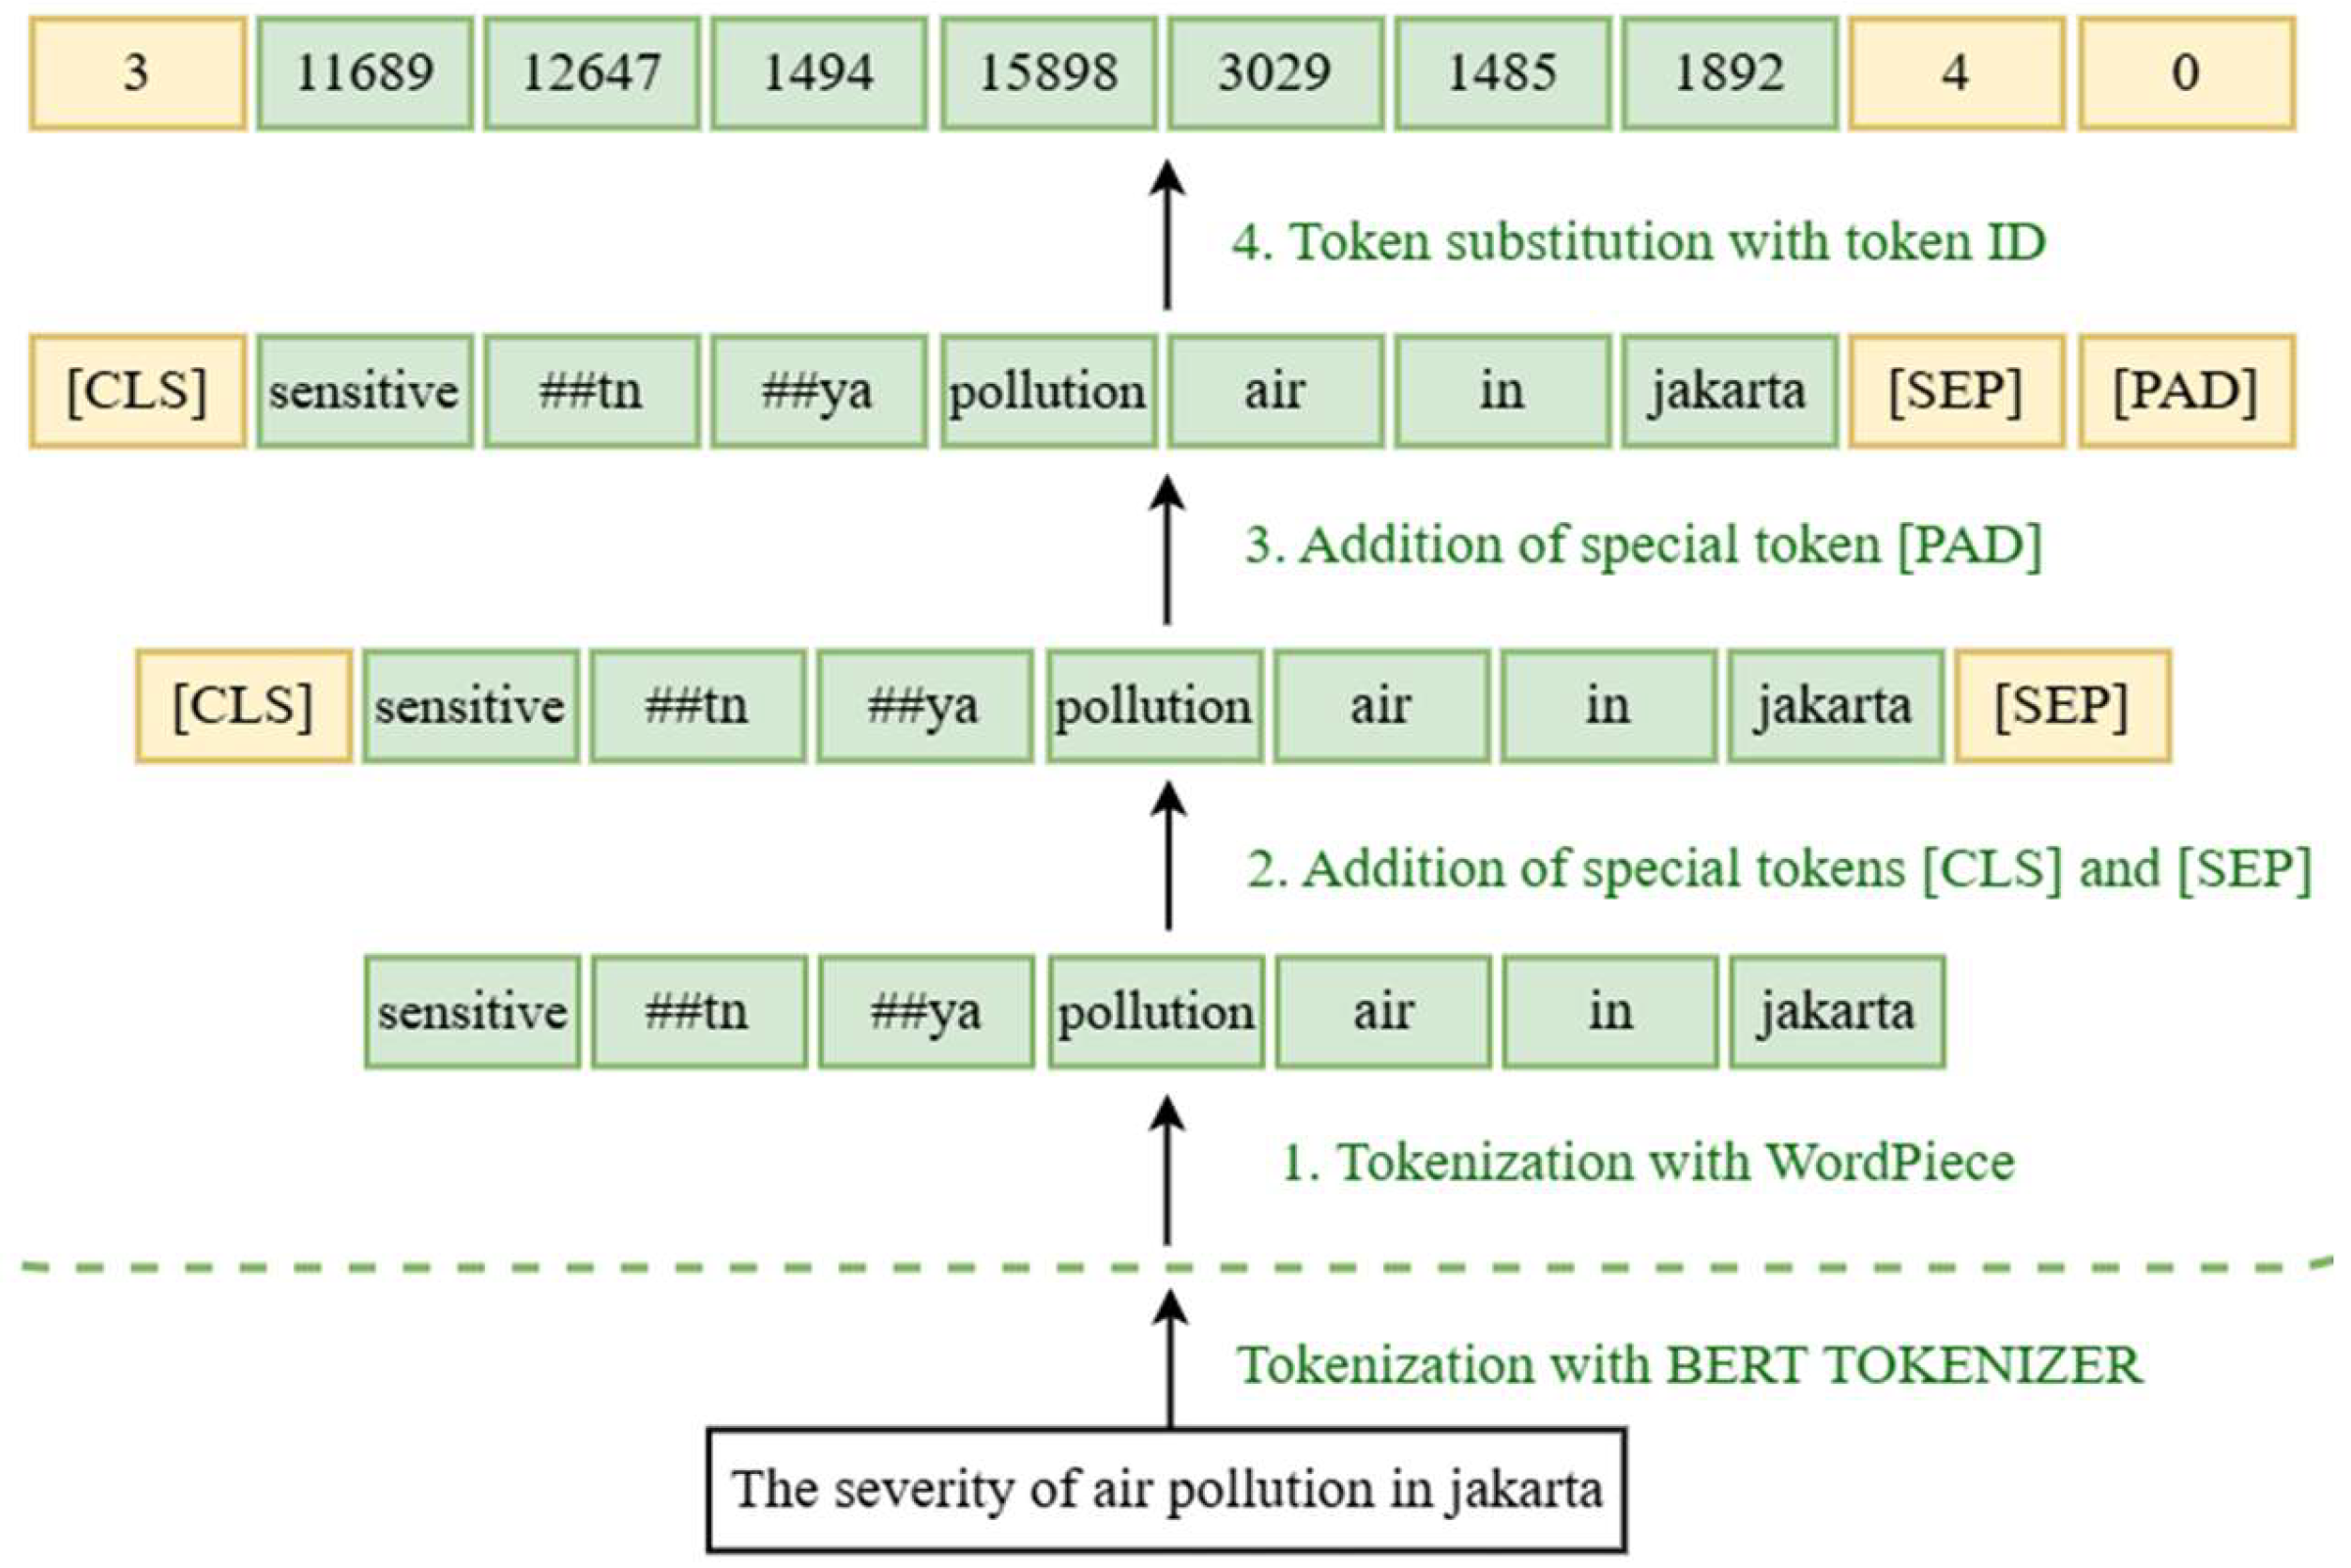
Before BERT is trained with a dataset, the dataset must be preprocessed or adjusted to an input representation that can be accepted by BERT. Therefore, the process of preparing sentences into input representations in BERT is carried out by a tokeniser, through several steps. The first step converts the tokenised sentence into words and sub-words using WordPiece. In tokenising into a word, the tokeniser checks that each word in the sentence is in the vocabulary. If there is data that is not in the vocabulary, then the word will be broken down into sub-words that are most likely to appear in the vocabulary. If the tokeniser does not find any sub-words in the vocabulary, the word will be broken down per character. However, if all words are converted into sub-words or individual characters, overload may occur. To handle this, words that do not exist in the vocabulary are replaced with [UNK] or unknown tokens. However, if all words are converted into such tokens, a lot of information will be lost. Therefore, BERT breaks the words into sub-words by adding the ## symbol. This approach is taken by BERT with two objectives, firstly, to speed up processing and reduce the number of parameters to be trained, and secondly, to overcome the out-of-vocabulary problem.
For example, in the input sentence “the density of air pollution in Jakarta”, every word in the sentence will be checked in the vocabulary, examining if there is a word that is not in the vocabulary. For example, the word “concentrated” is not in the vocabulary. Thus, the word “pekatnya” becomes a sub-word “pekat” and “##nya” where the first token often appears in the vocabulary while the second token begins with ## to indicate that the token is a suffix that follows another sub-word.
Furthermore, each sentence in BERT is given special tokens, namely [CLS] placed at the beginning of the sentence and [SEP] at the end of the sentence. The [CLS] token serves as an indicator of the beginning of a sentence and also as a sentiment representation during sentiment classification. Meanwhile, the [SEP] token is used to separate one sentence from the next. Sentences that have been given these special tokens will become token embeddings in the analysis process by the BERT model. After that, each sentence is adjusted to a predetermined maximum length by reducing or padding using a special token [PAD]. This process is performed so that all sentences have a uniform length, making it easier to process data, especially when used in models that require a consistent input size.
Next, each sentence is matched with a unique number or ID according to the vocabulary, and the unique number is stored as an ID token. These unique numbers or IDs are obtained during the model training process, where each word, sub-word, and character in the vocabulary has its own unique ID or number. These IDs are obtained based on the word indices in the vocabulary, which are organized based on their occurrence. Words and sub-words must be converted into IDs because the pre-trained BERT model can only understand the IDs of tokens. The overall result of the process of converting sentences into BERT input representation can be seen in Figure 3.
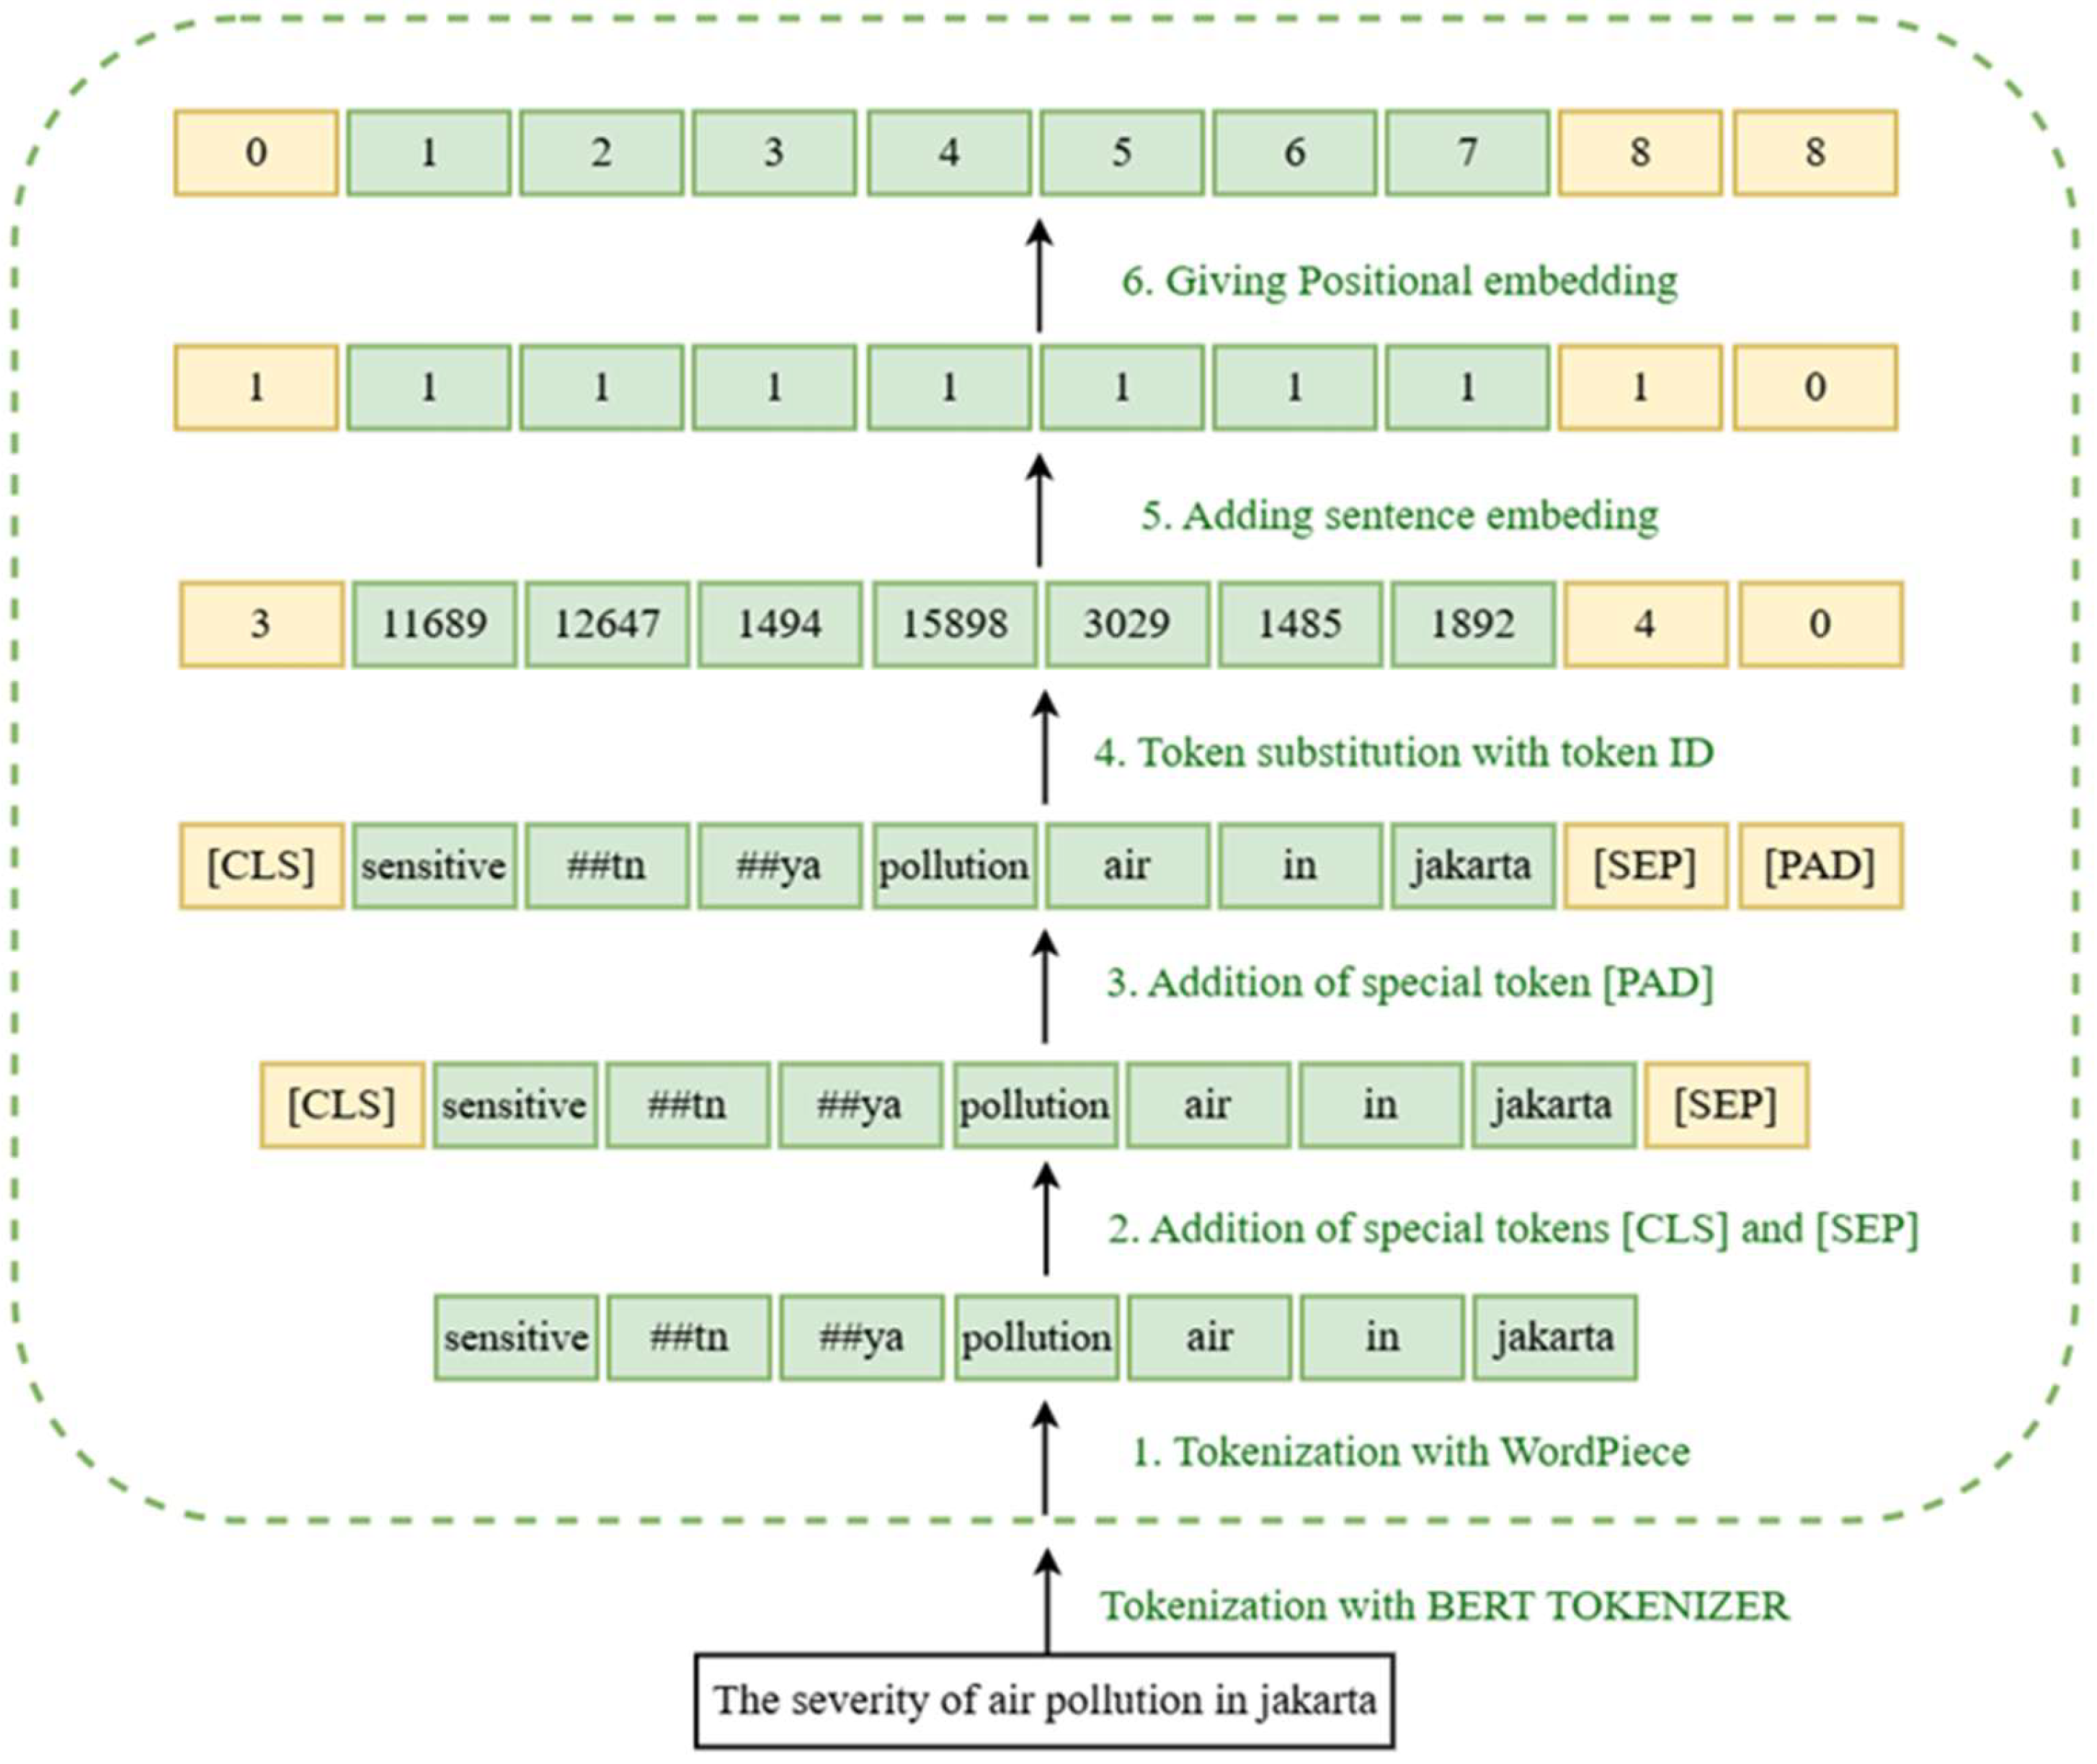
At this stage, sentence embedding is assigned to each sentence to distinguish between the first sentence, second sentence, or padding. This process usually involves assigning value 1 to the first sentence and value 0 to the token padding. The tokeniser can identify the first sentence and the padding token through the [SEP] token, which serves as a separator between two sentences in the text.
As shown in Figure 4, each token is given an embedding according to the sentence order.
The positional embedding stage is illustrated in Figure 5.
The input representation entered into BERT can be seen in Figure 6.

2.4. BERT Model Training

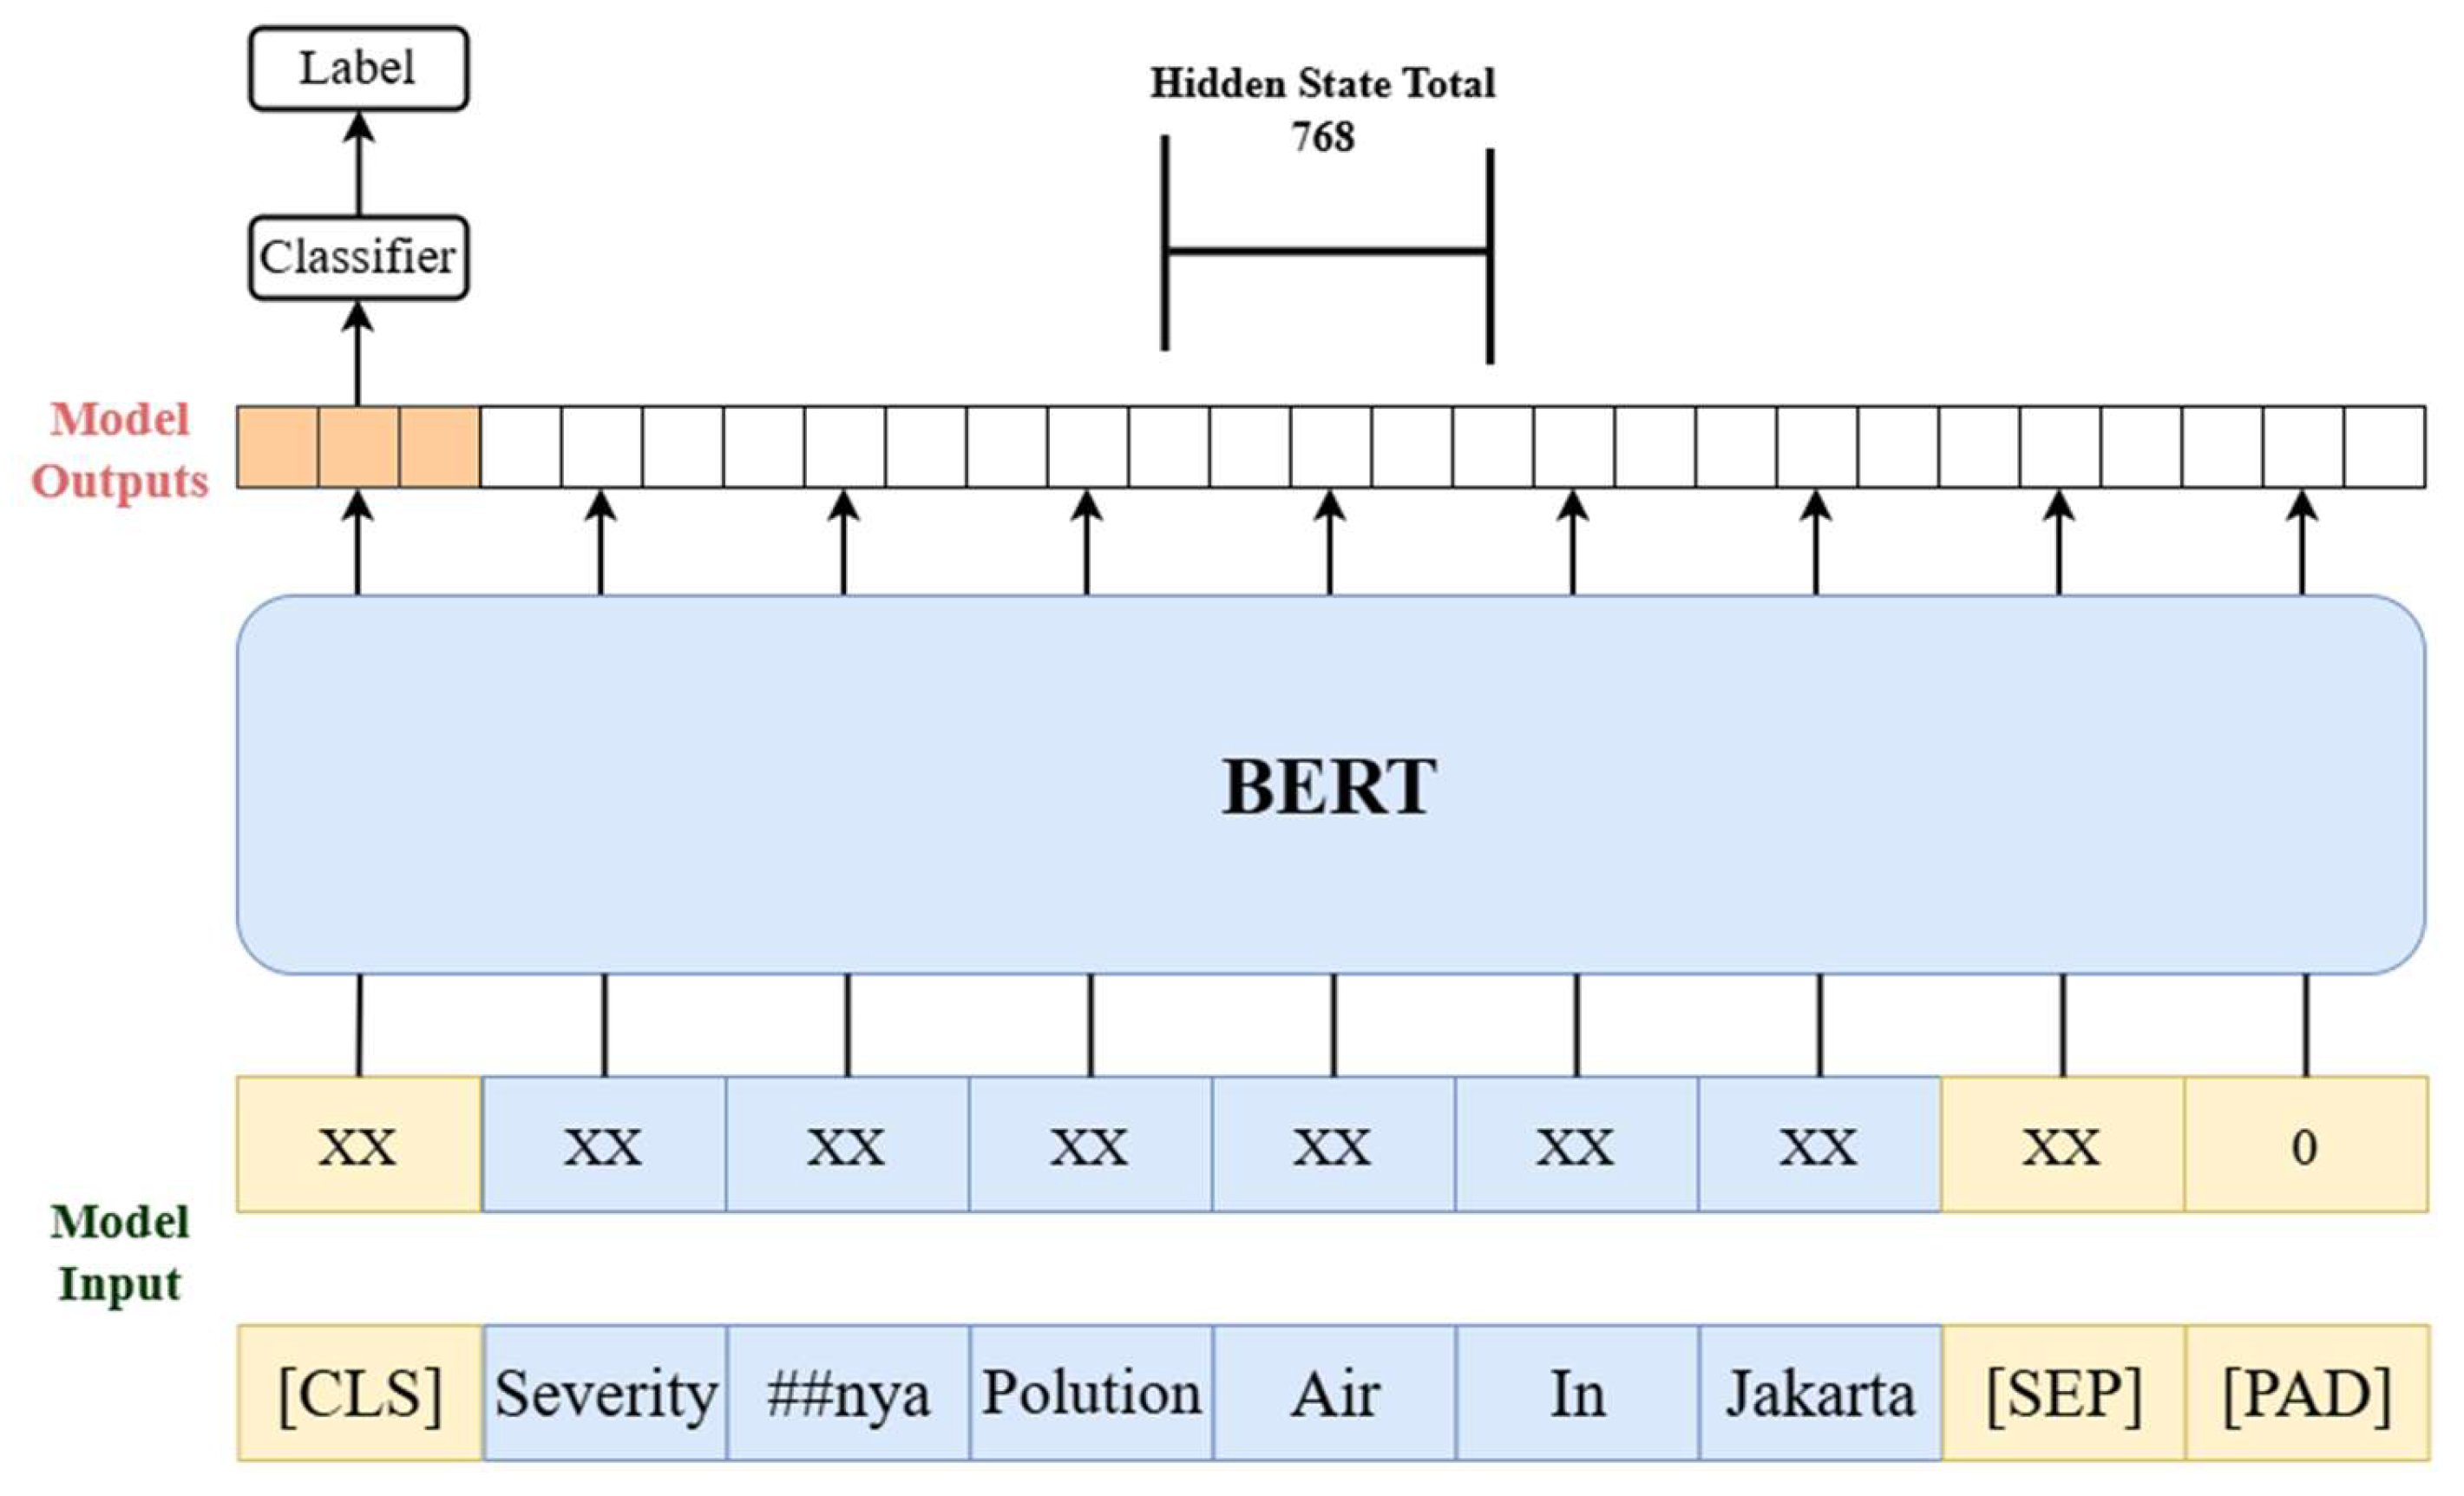
In this research, the model employed is IndoBERTweet-base-uncased, necessitating the repetition of the process seven times to correspond with the number of encoders in the IndoBERTweet-base-uncased model. Upon traversing the entire encoder layer, each token at every position generates an output represented as a vector of a specific size. The hidden size in the BERT-BASE model is 768, as illustrated in the accompanying figure. During the sentiment analysis process, the output of interest is derived from the first position, specifically the [CLS] token. The resulting vector from the [CLS] token is subsequently utilized as input for the classification component, which is tasked with determining the sentiment of the text or sentence, as depicted in Figure 7.

2.5. Testing

The model used for classification is measured by counting the number of correctly predicted classes (true positives), the number of predictions that do not belong to that class and are true (true negatives), and those that are false (false positives or false negatives).
The metric value can be calculated from the confusion matrix with the following equation (Table 3). The precision, recall, and F score metrics are used to measure sentiment calcification in predicting positive, negative, and neutral classes.
Accuracy is defined as all predicted states being correct against all predicted states. Precision is the accuracy of the system to classify data by counting the number of positive true states against all positive states. Recall is the system’s relevance to classify data in counting the number of true positive conditions against all original positives. F score describes the average alignment between precision and recall.

3. Results and Discussion

Figure 8 shows the output of the result of checking the amount of labelling. It can be seen that the dataset formed is unbalanced data, where negative sentiment is more in number than positive sentiment.
In this process, the sentence is separated into words and sub-words which are then given special tokens with the BERT tokeniser library. Figure 9 shows the results of tokenisation.
In this process, the training data is fine-tuned using the following hyperparameters by taking some recommendations for BERT: batch size = 16; epoch: 10; learning rate: 2 × 10⁻⁵. Figure 10 shows the training loss and validation loss graphs of the training model.
The graph shows that the validation loss value is still below the training loss, indicating that the model is not overfitting.
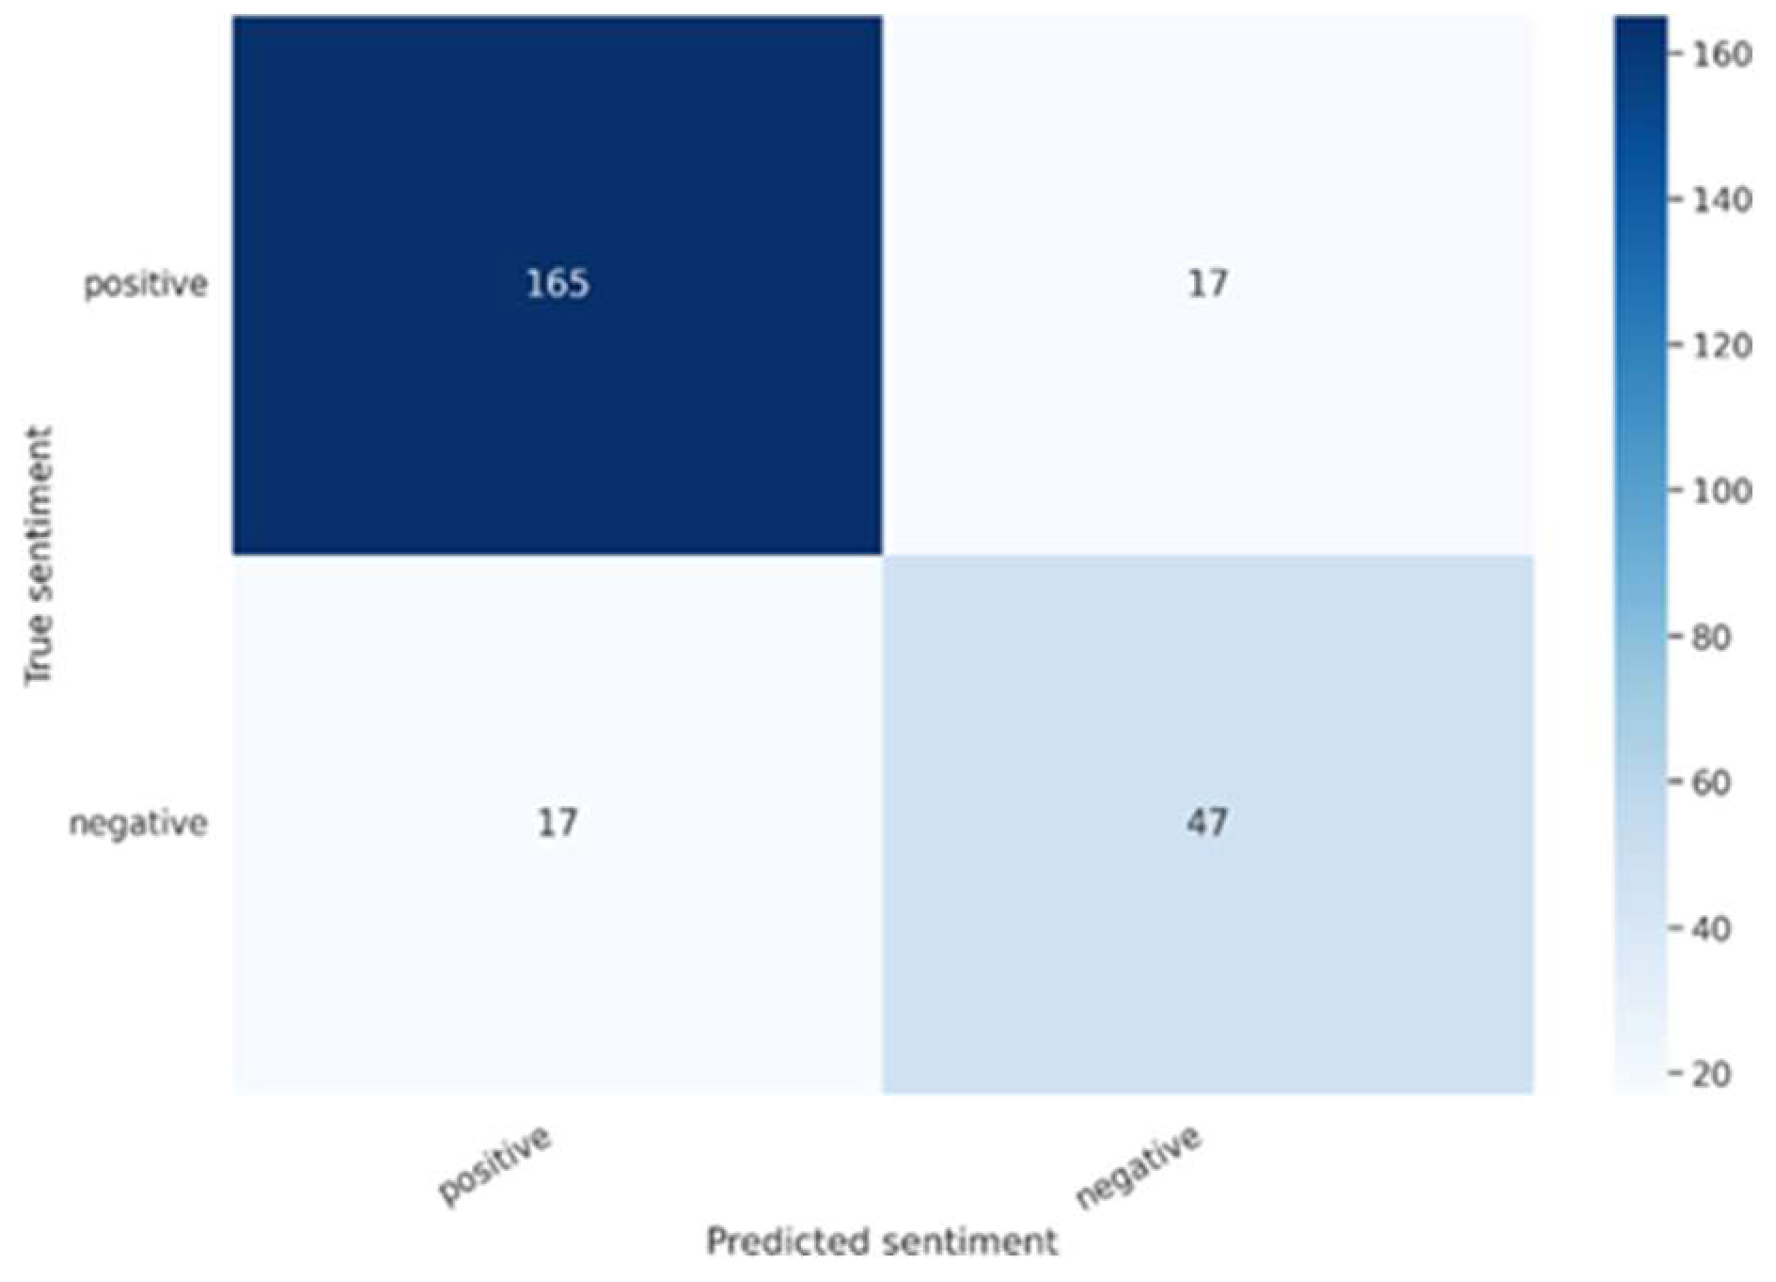
Figure 11 shows the confusion matrix obtained from evaluating the model on the test dataset.
The results of the calculation of accuracy, precision, recall, and F score values are as follows:
A c c u r a c y = T P   +   T N T P   +   F P   +   F N   +   T N = 165 + 47 165 + 17 + 17 + 47 = 0.8617
P r e c i s i o n = T P T P + F P = 165 165 + 17 = 0.9065
R e c a l l = T P T P + F P = 165 165 + 17 = 0.9065
Based on these results, it can be concluded that the results of sentiment analysis with air pollution datasets in Jakarta obtain good accuracy of 86%, precision 90%, recall 90% and F score 90%. It can be seen that Indobert is very good at sentiment analysis.

4. Conclusions

The results of the sentiment analysis concerning air pollution on Twitter, conducted using the BERT method, yield several key findings, including the following:
  • This research has good accuracy, recall, precision, and F score values so it is good to use in a sentiment analysis system.
  • This research produces sentiment values and produces good accuracy values with 86%, precision 90%, recall 90% and F score 90%.

Author Contributions

Conceptualization, S.A.A.; methodology, M.S. and S.S.; software, F.A. and S.S.; validation, M.M. and C.I.; formal analysis, C.I.; investigation, C.I.; resources, S.S.; data curation, S.S.; writing—original draft preparation, M.M.; visualization, C.I.; supervision, C.I.; project administration, M.M. All authors have read and agreed to the published version of the manuscript.

Funding

This research received no external funding.

Institutional Review Board Statement

Not applicable.

Informed Consent Statement

Not applicable.

Data Availability Statement

The data supporting the findings of this study are available from the corresponding author upon reasonable request.

Conflicts of Interest

The authors declare no conflict of interest.

References

  1. Febriansyah, I.; Fikry, M.; Yusra. Sentiment Analysis on Twitter of Anies Baswedan as a 2024 Presidential Candidate Using the K-Nearest Neighbor Method. G-Tech J. Teknologi Terapan 2023, 7, 1061–1070. [Google Scholar] [CrossRef]
  2. Chandradev, V.; Suarjaya, I.M.A.D.; Bayupati, I.P.A. Hotel Review Sentiment Analysis Using BERT Deep Learning Method. J. Buana Inform. 2023, 14, 107–116. (In Indonesian) [Google Scholar] [CrossRef]
  3. Ati, G.R.; Prasetyaningrum, P.T. Analysis of Community Sentiment Towards Free Nutrition Meal Programs on Twitter Using Naïve Bayes, Support Vector Machine, K-Nearest Neighbors, and Ensemble Methods. J. Inf. Syst. Informatics 2025, 7, 1443–1460. [Google Scholar] [CrossRef]
  4. Purwanto, D.D.; Honggara, E.S. Classification of Air Pollution Standard Index Calculation Results with Gaussian Naive Bayes (Case Study: ISPU DKI Jakarta 2020). J. Intell. Syst. Comput. 2022, 4, 102–108. (In Indonesian) [Google Scholar] [CrossRef]
  5. Kurniawan, B.; Aldino, A.A.; Isnain, A.R. Sentiment analysis of the Electronic System Operator Policy (PSE) Using the Bidirectional Encoder Representations from Transformers (BERT) Algorithm. J. Teknol. Dan Sist. Inf. 2022, 3, 98–106. (In Indonesian) [Google Scholar]
  6. Saputra, N.; Nurbagja, K.; Turiyan. Sentiment analysis of presidential candidates Anies Baswedan and Ganjar Pranowo using Naive Bayes method. J. Sisfotek Glob. 2022, 12, 114–119. [Google Scholar] [CrossRef]
  7. Solihin, F.; Awaliyah, S.; Shofa, A.M.A. Utilisation of Twitter as a media for information dissemination by the Communication and Informatics Office. JPIPS 2021, 13, 52–58. (In Indonesian) [Google Scholar]
  8. Umri, S.S.A.; Firdaus, M.S.; Primajaya, A. Analysis and Comparison of Classification Algorithms in the Air Pollution Index in DKI Jakarta. JIKO (J. Inform. Dan Komput.) 2021, 4, 98–104. [Google Scholar] [CrossRef]
  9. Wicaksono, D.W.; Hartono, B. Sentiment analysis on Twitter towards Jakarta air quality using the NBC method. ELKOM 2024, 17, 103–110. (In Indonesian) [Google Scholar]
  10. Atmaja, R.M.R.W.P.K.; Yustanti, W. Sentiment analysis of customer review of Ruang Guru application with BERT method (Bidirectional Encoder Representations from Transformers). J. Emerg. Inf. Syst. Bus. Intell. 2021, 2, 55–62. (In Indonesian) [Google Scholar]
  11. Munikar, M.; Shakya, S.; Shrestha, A. Fine-grained sentiment classification using BERT. arXiv 2019, arXiv:1910.03474. [Google Scholar] [CrossRef]
  12. Fahriyani, S.; Harmaningsih, D.; Yunarti, S. The use of Twitter social media for disaster mitigation in Indonesia. J. IKRA-ITH Hum. 2020, 4, 56–65. (In Indonesian) [Google Scholar]
  13. Pramono, J.S.; Nuraini; Djamaluddin, J.; Hijriyati, Y.; Yusriati. The Effect of Air Pollution on the Health of Urban Residents (Case Study in Jakarta). Miracle Get J. 2025, 2, 34–43. [Google Scholar] [CrossRef]
Figure 1. Flowchart of research methodology.
Engproc 107 00131 g001
Figure 2. Twitter comments about air pollution in Jakarta.
Engproc 107 00131 g002
Figure 3. Tokenisation with BERT tokeniser.
Engproc 107 00131 g003
Figure 4. Sentence embedding stage.
Engproc 107 00131 g004
Figure 5. Positional embedding stage.
Engproc 107 00131 g005
Figure 6. BERT input representation.
Engproc 107 00131 g006
Figure 7. Illustration of classification process using BERT.
Engproc 107 00131 g007
Figure 8. The result of checking the number of labelling.
Engproc 107 00131 g008
Figure 9. Results of tokenisation sample.
Engproc 107 00131 g009
Figure 10. Training loss (grey line) and validation loss (blue line) training model.
Engproc 107 00131 g010
Figure 11. Confusion matrix.
Engproc 107 00131 g011
Table 1. Label guidelines.
SentimentExplanation
1Comments containing solutions and hopes regarding air pollution in Jakarta.
0Comments that express a negative view of air pollution in Jakarta and could potentially have an adverse impact on readers or the public detailing concerns or criticisms of the air pollution situation.
Table 2. Label samples.
SentimentComment
1in Jakarta. This tree planting effort is the right step in overcoming air pollution problems, because trees act as carbon dioxide absorbers and oxygen producers. In addition, tree planting also has aesthetic value and can beautify the surrounding area.
0It’s useless to exercise outdoors if Jakarta’s air is still heavily polluted!
0Finally a breath of fresh air, in Jakarta it’s pollution.
1It’s good to make more green open spaces in Jakarta, just in case air pollution can also be reduced.
0In Jakarta, I met air pollution. In Palembang, I found haze due to forest and land fires:) So sad, I expected to see blue clouds and clean air but I didn’t:)
1Hundreds of water mist devices have been installed in buildings in South Jakarta, West Jakarta and East Jakarta to tackle air pollution.
Table 3. Confusion matrix.
A c c u r a c y = T P + T N + T N e t T P + F P + T N + F N + T n e t + F n e t
P r e c i s i o n = T P T P + F P
R e c a l l = T P T P + F N + F n e t
F   S c o r e = 2 × P r e c i s i o n × R e c a l l P r e c i s i o n + R e c a l l
Disclaimer/Publisher’s Note: The statements, opinions and data contained in all publications are solely those of the individual author(s) and contributor(s) and not of MDPI and/or the editor(s). MDPI and/or the editor(s) disclaim responsibility for any injury to people or property resulting from any ideas, methods, instructions or products referred to in the content.