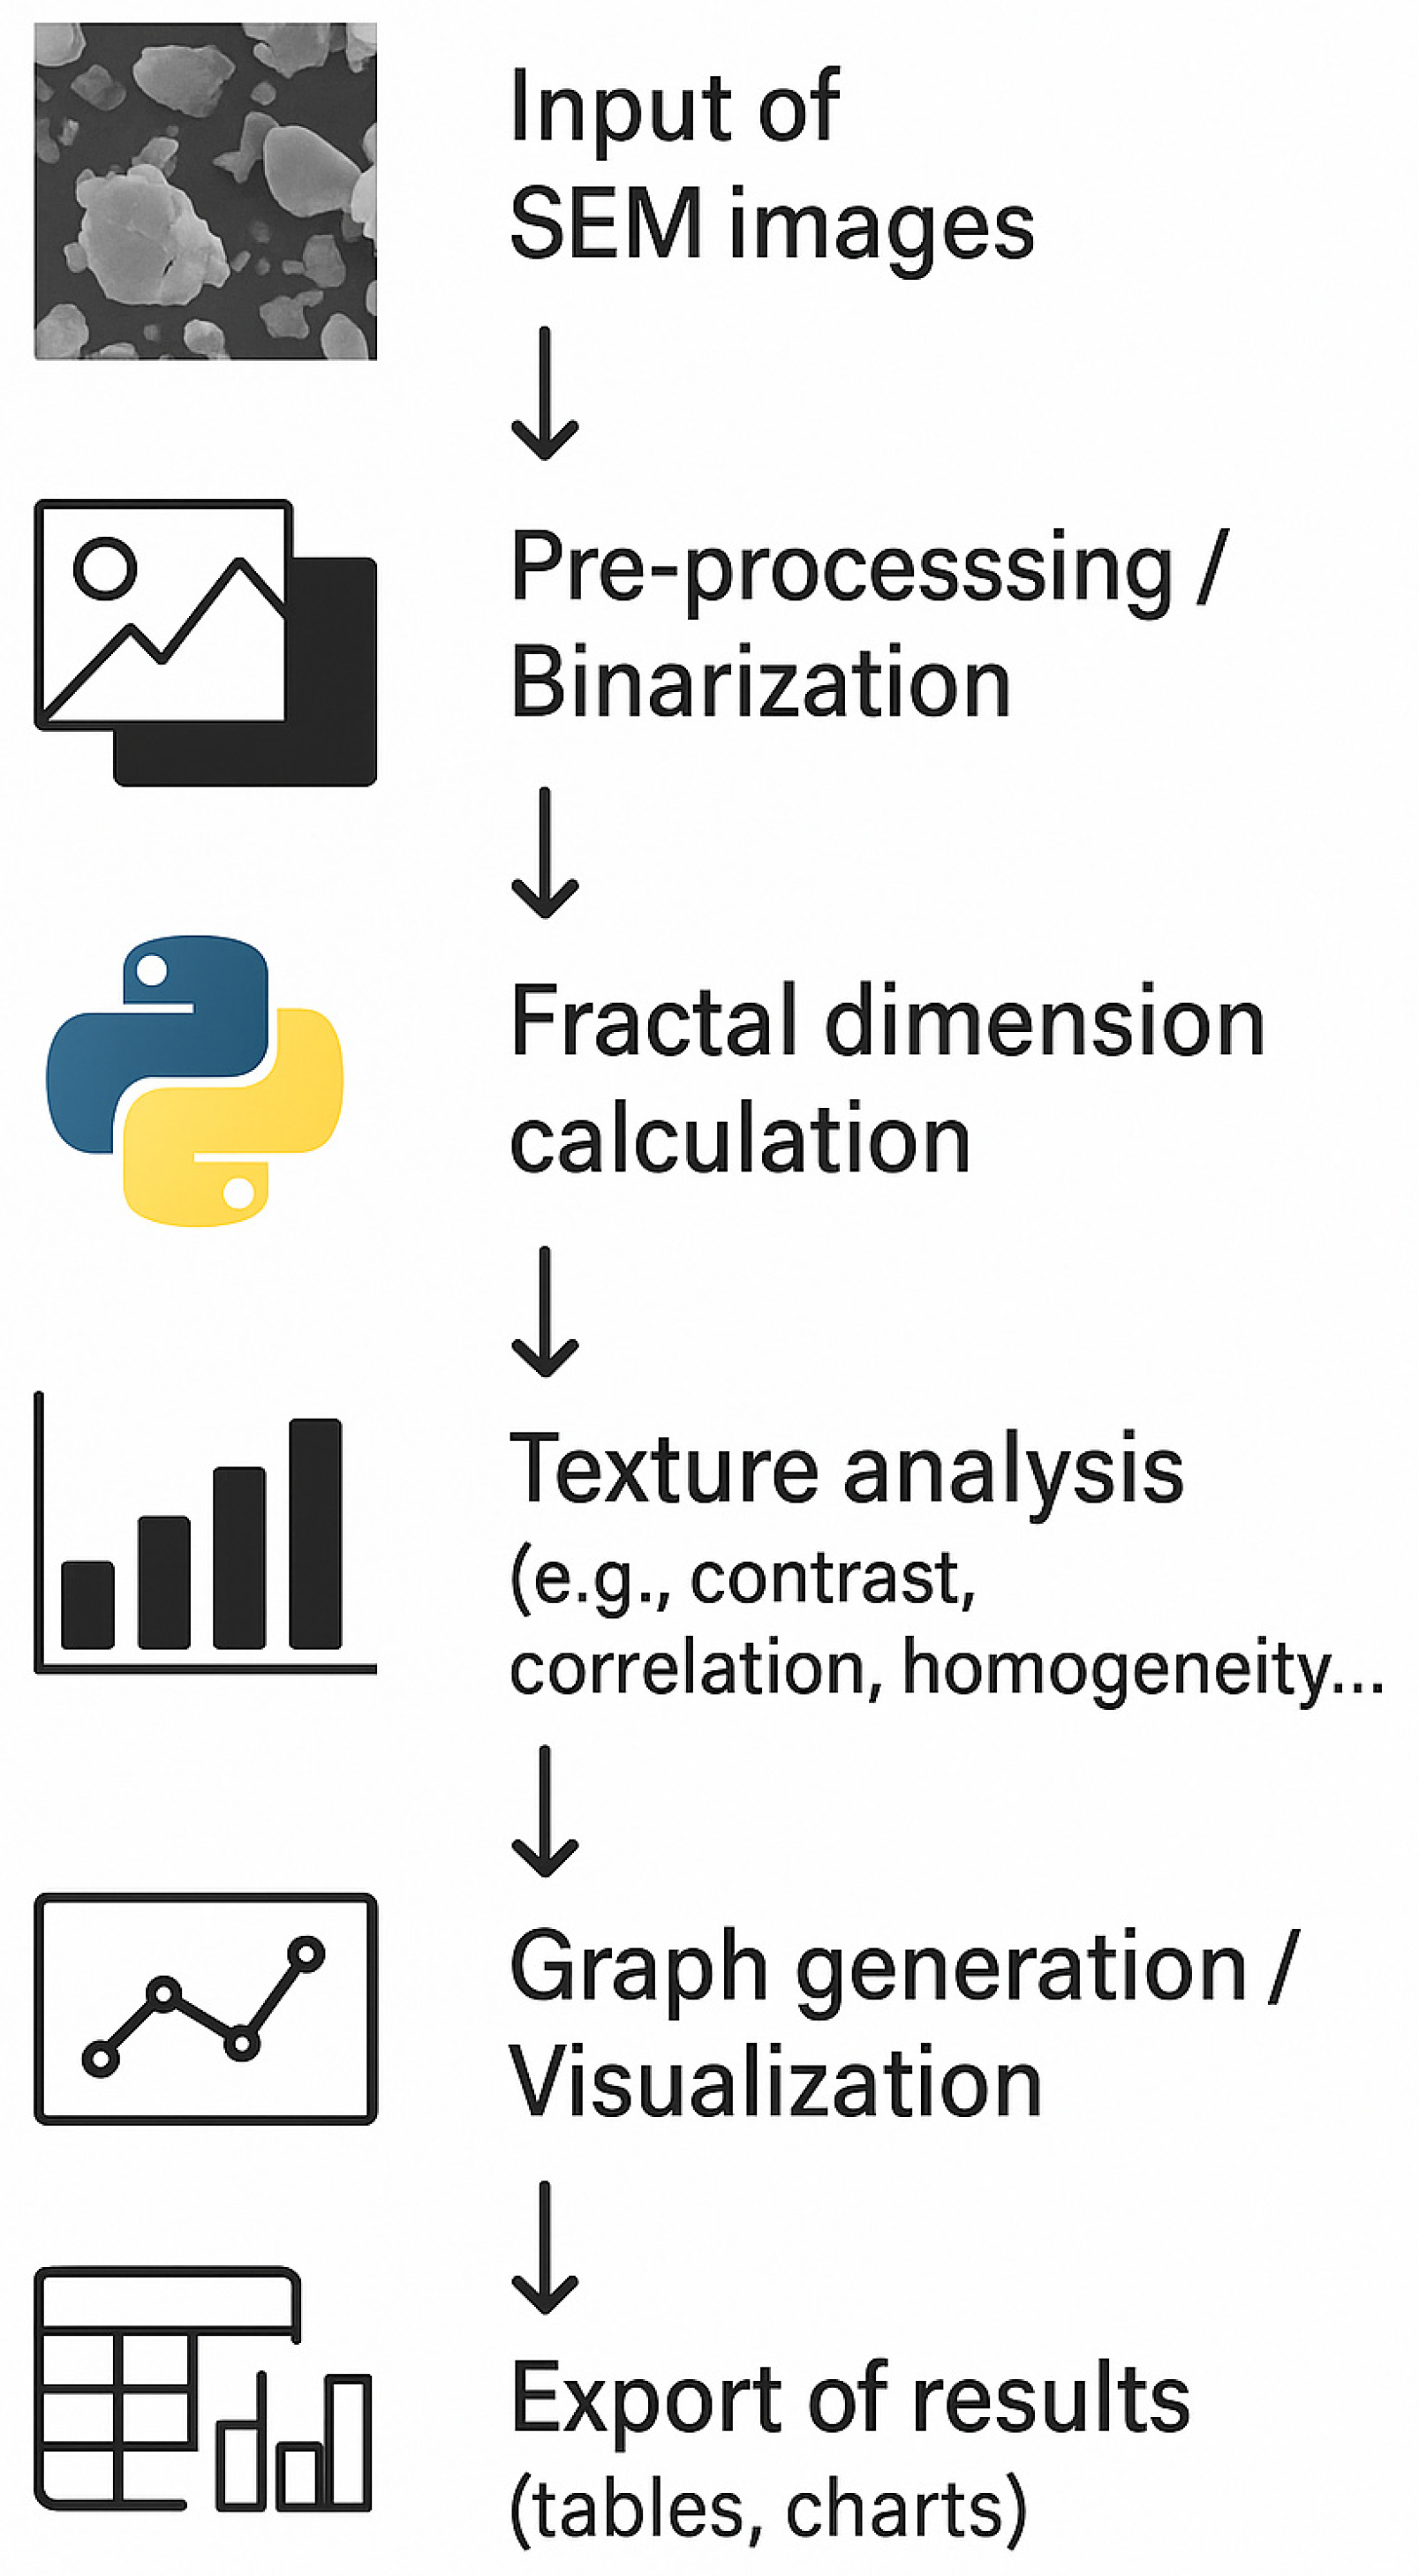
3.2. Dimension (Df) Analysis
To investigate the scale-dependent complexity of TiO
2 surface morphology, a fractal dimension (Df) analysis was performed using binarized SEM images from samples Im1, Im2, Im3, and Im4. This method enables a quantitative assessment of structural richness across multiple observational scales, reflecting the degree of self-similarity and hierarchical organization of the surface. The progressive thresholding offers a multiscale visual representation, demonstrating how threshold selection influences the perceived morphology and setting the stage for the quantitative Df analysis.
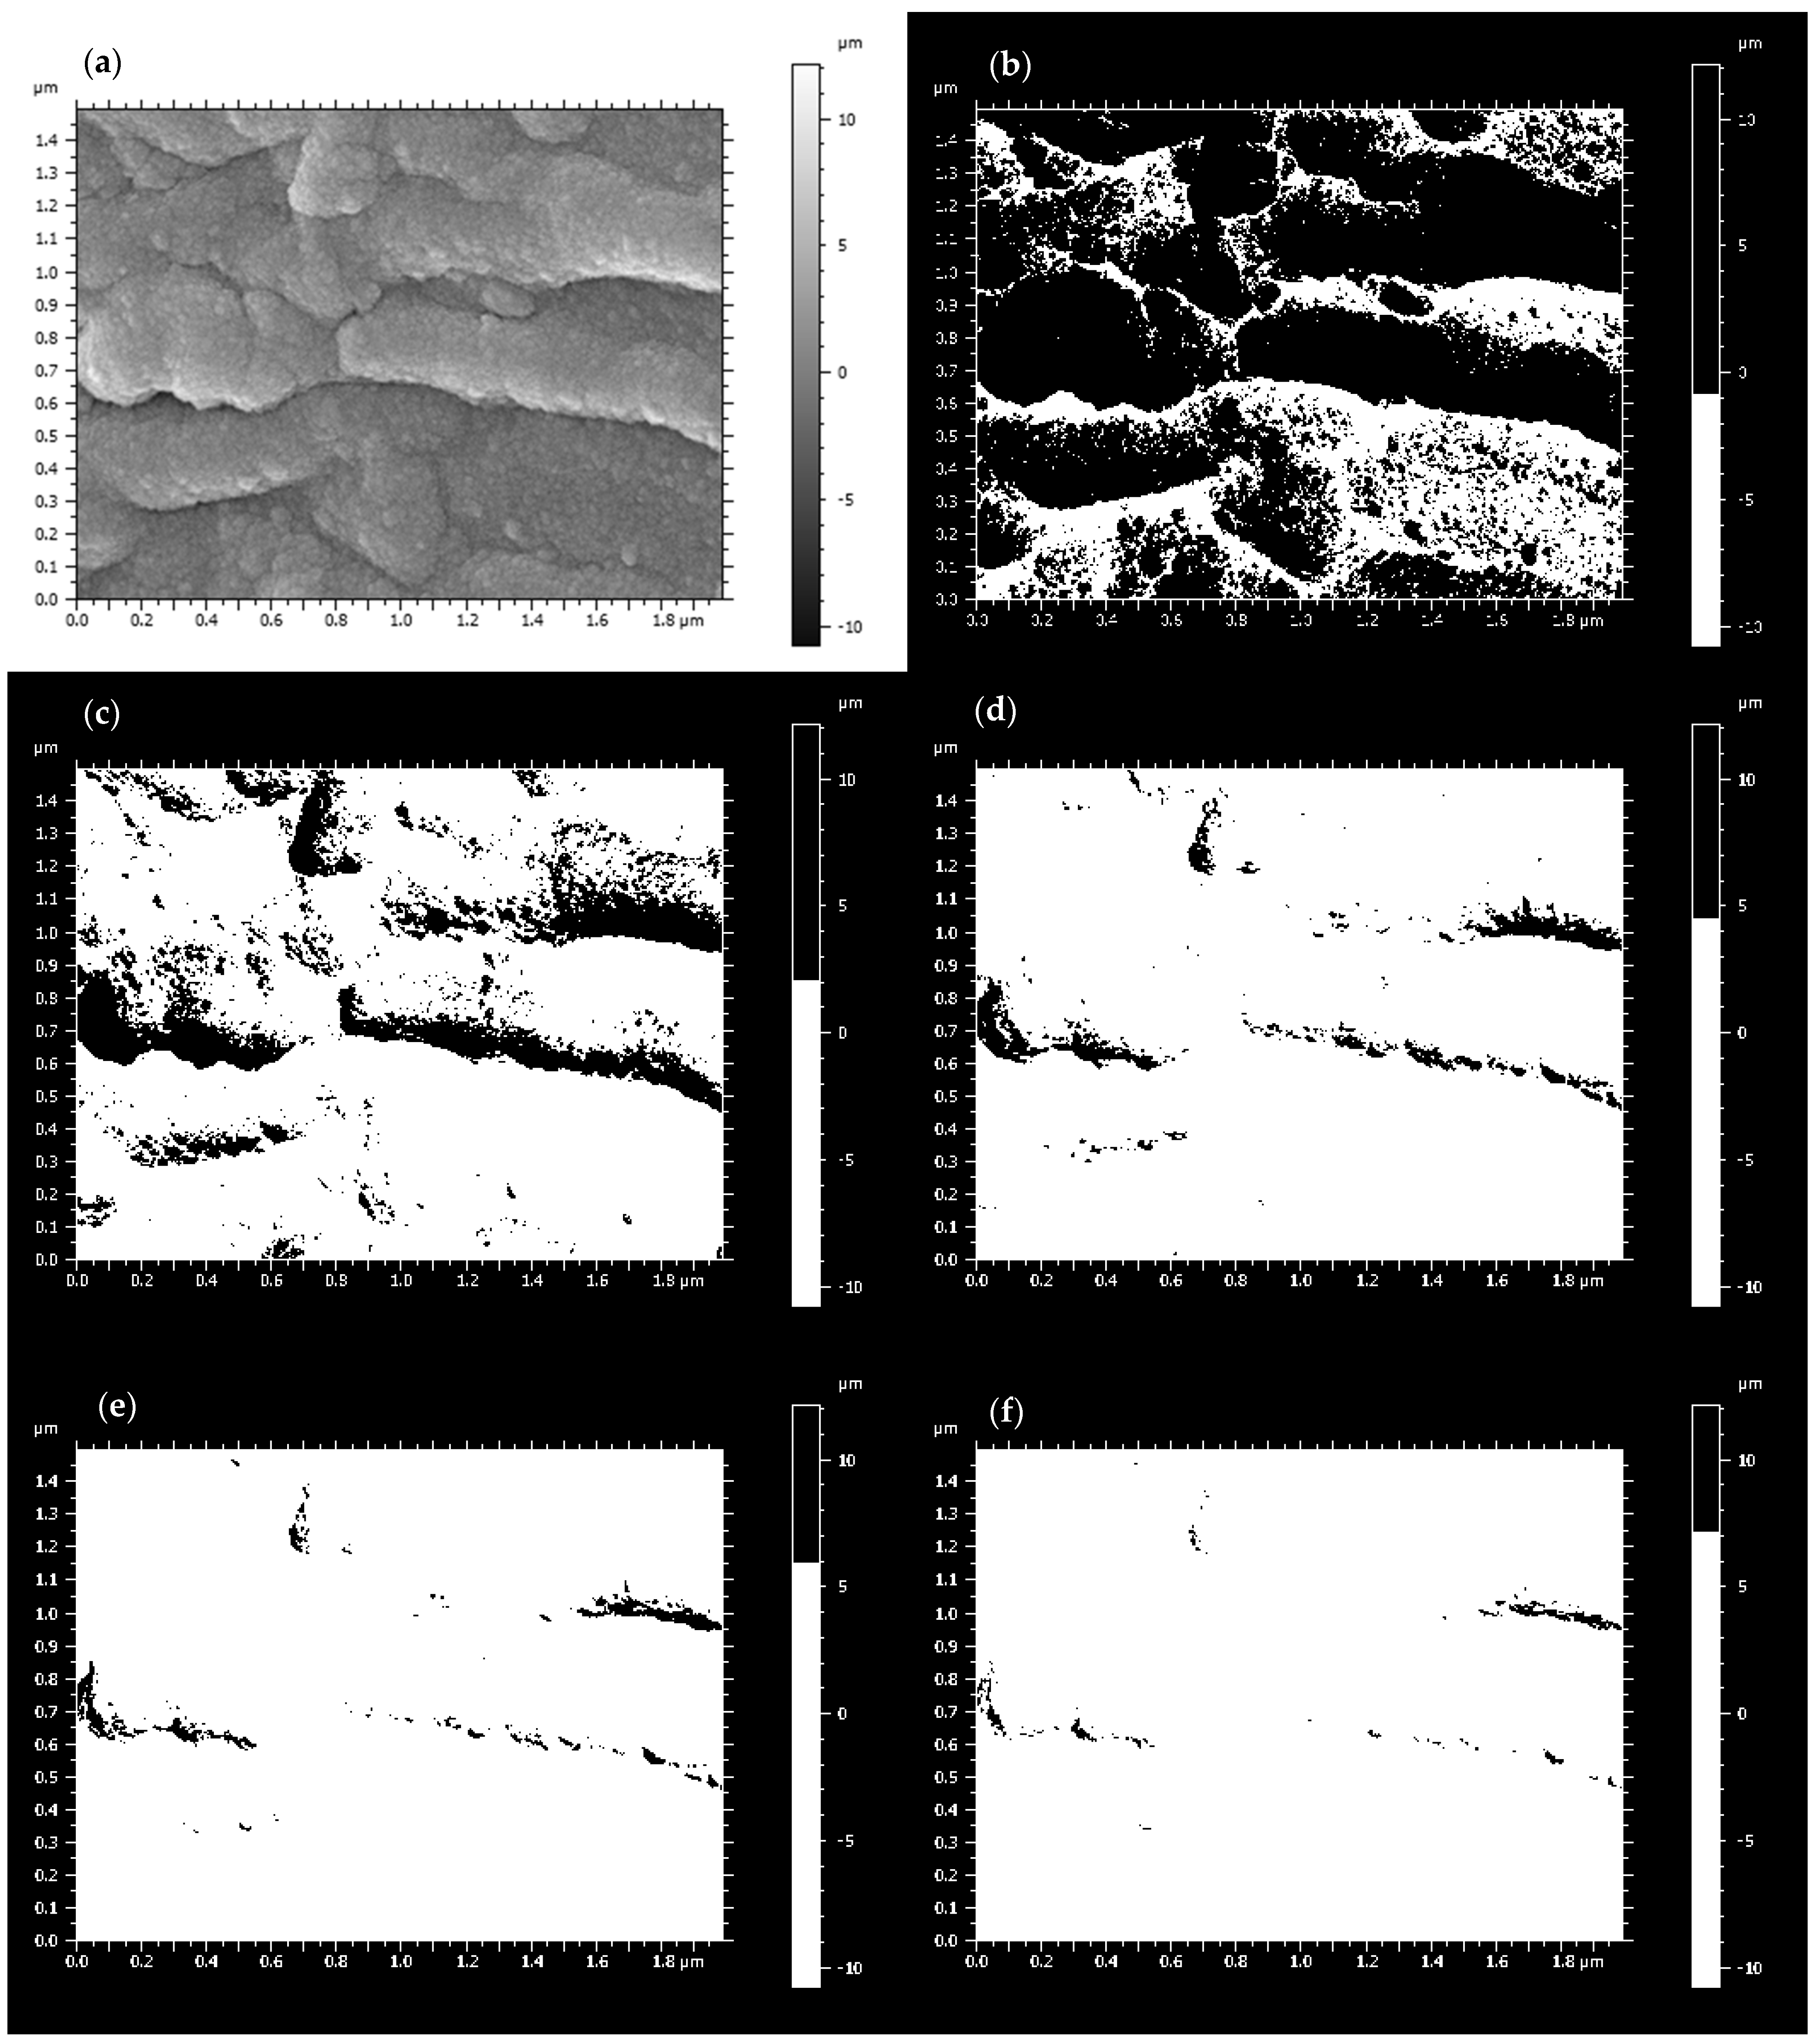
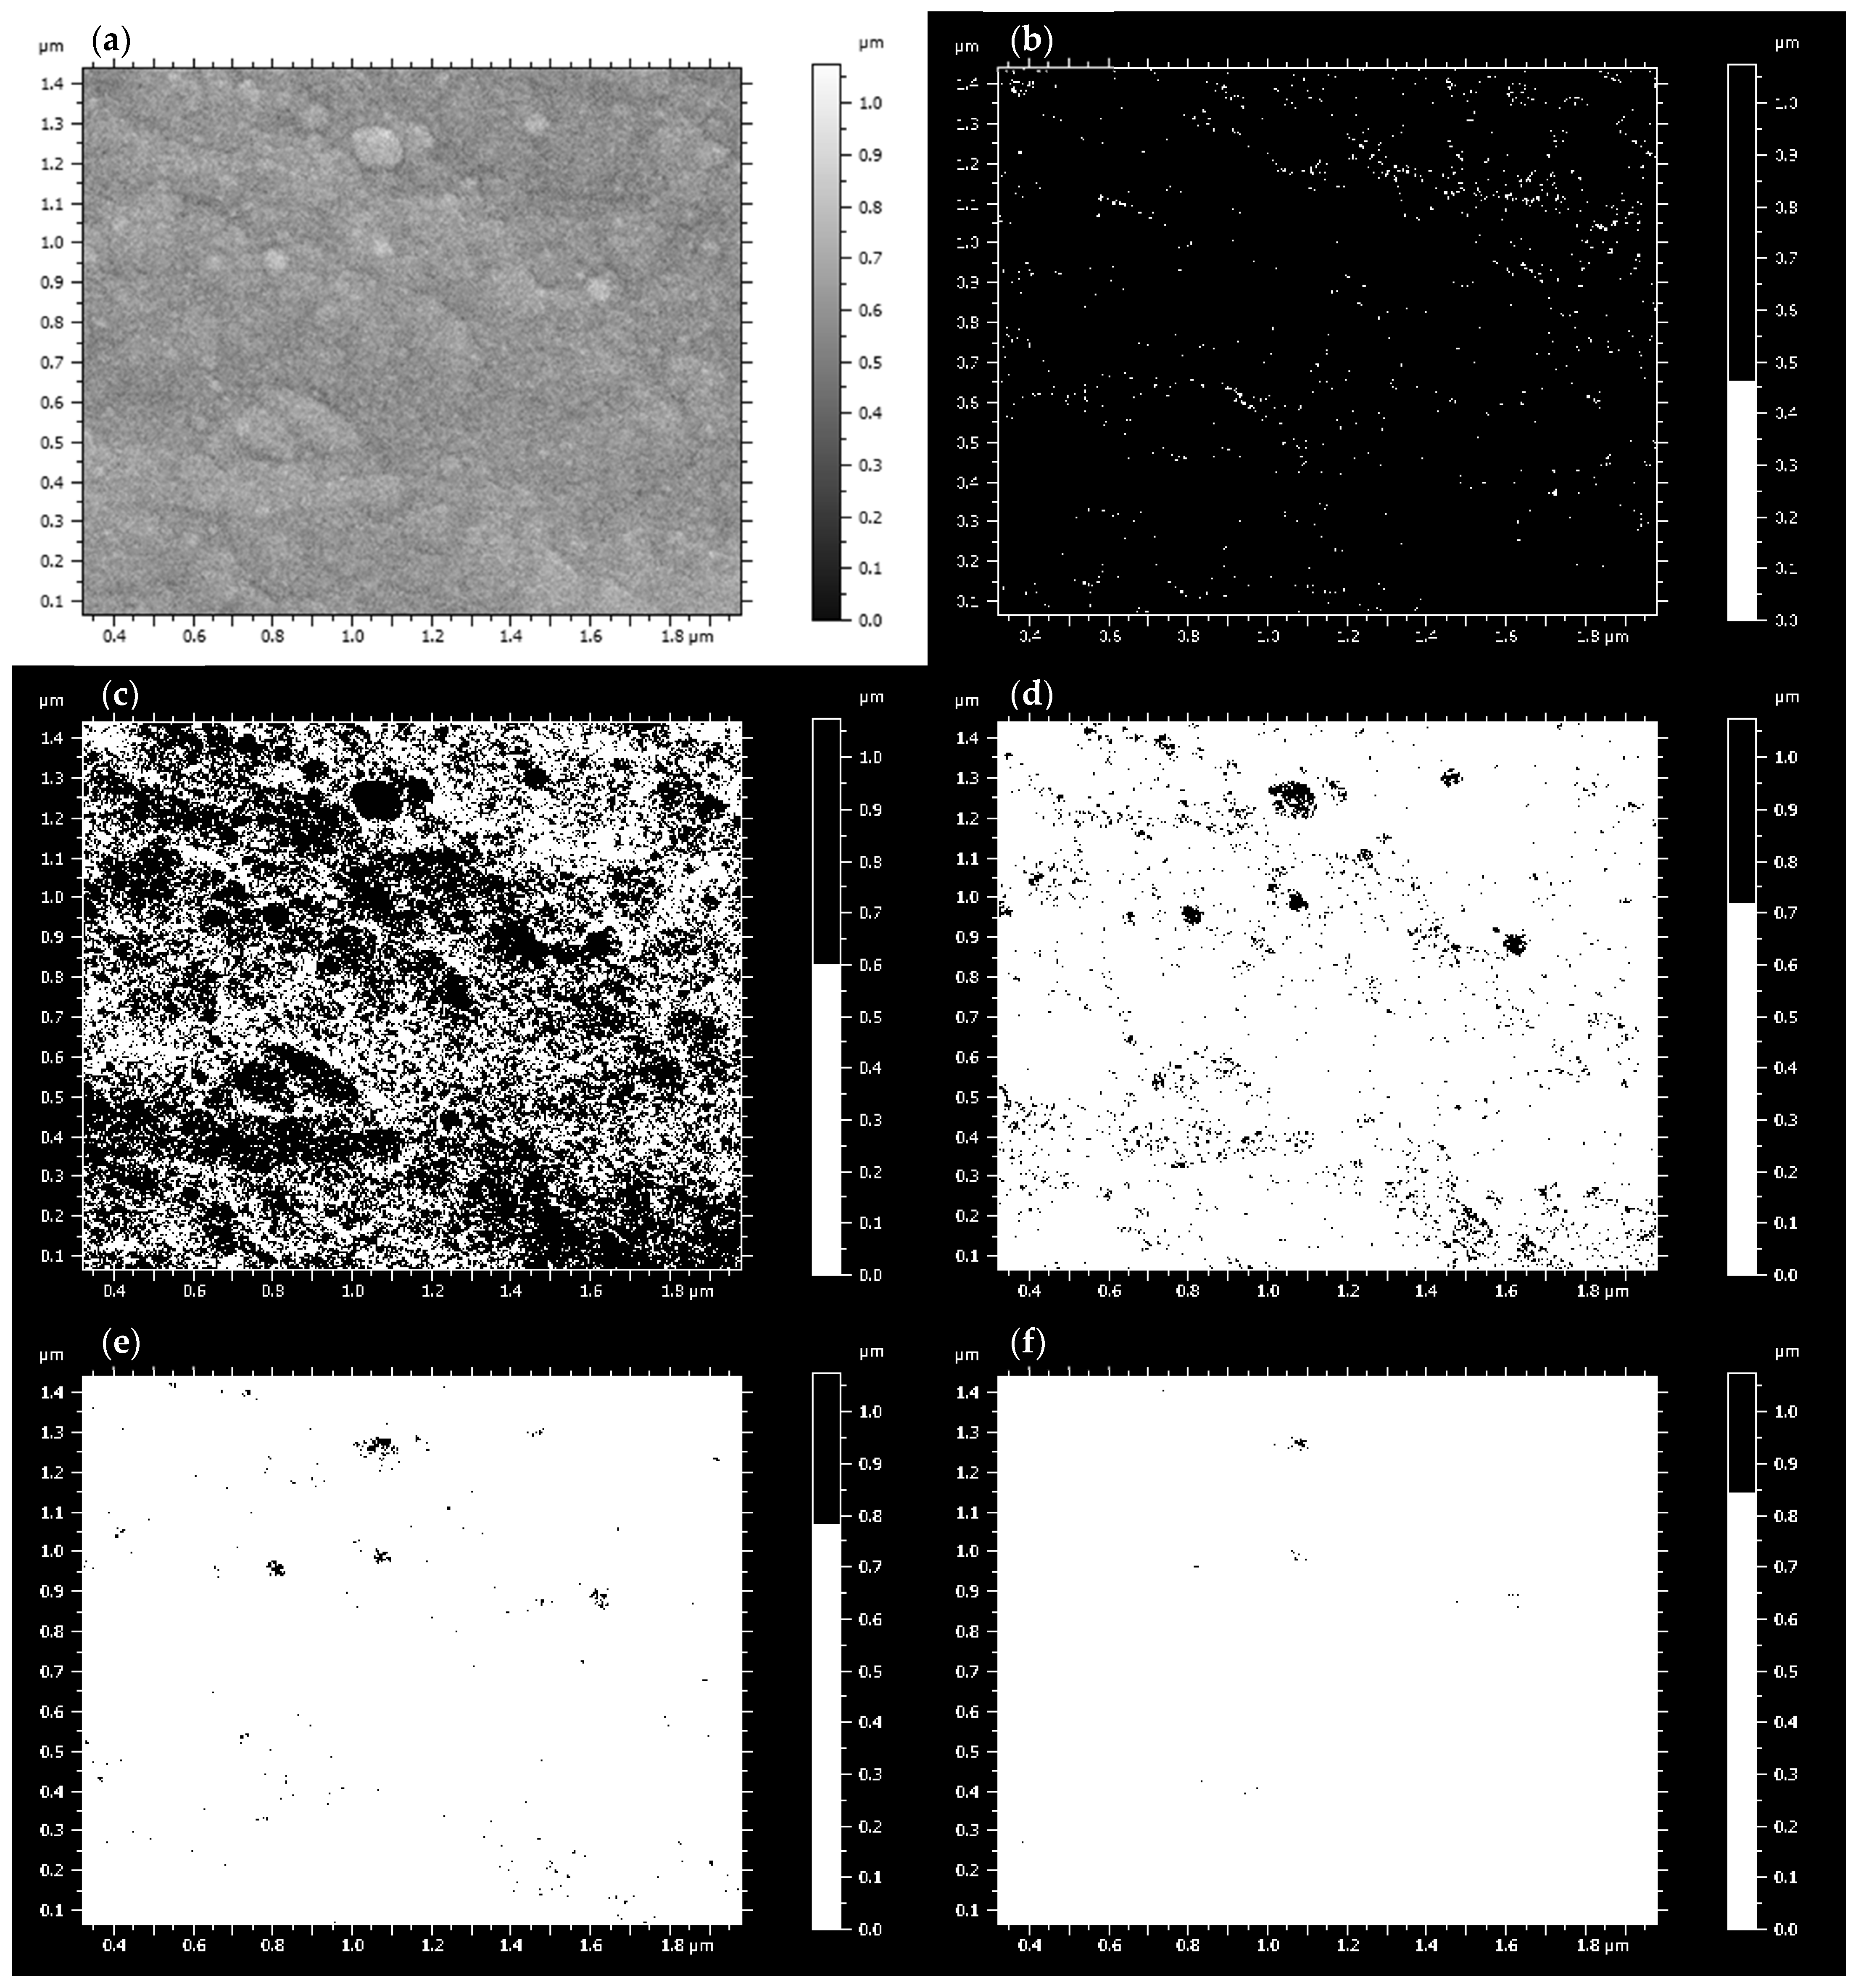
Figure 3 shows sample Im1, deposited using 50% oxygen and 1000 W. The SEM image in panel (a) reveals a porous and heterogeneous morphology composed of irregular microstructures and elongated features predominantly aligned along the horizontal axis. This grayscale image served as the basis for fractal segmentation. Panels (b) through (f) display binarized versions of the original image obtained using increasing threshold values (T = 0.50, 0.60, 0.70, 0.75, and 0.80), illustrating how structural features evolve with segmentation selectivity. At T = 0.50, segmentation is highly inclusive, preserving both fine and broad surface features, resulting in a dense, highly connected binary texture with strong black-and-white contrast. At T = 0.60, less prominent details are filtered out, enhancing the visibility of dominant elongated ridges and clarifying large-scale organization while maintaining structural complexity. At T = 0.70, significant simplification occurs as finer porosity and noise are largely removed, revealing a clearer dominance of horizontal formations and suggesting hierarchical organization where key features exist independently of small-scale roughness. At T = 0.75 and 0.80, the segmentation becomes increasingly selective, retaining only the most prominent and persistent structures: mainly interconnected ridges and larger surface channels. These likely correspond to energetically or kinetically favored growth pathways formed under the applied deposition conditions. This progressive filtering illustrates the scale-dependent nature of surface complexity: lower thresholds reveal a broad range of fine and coarse features, while higher thresholds emphasize the dominant structural backbone. The recurrence of specific morphological elements across thresholds suggests a self-similar, fractal-like organization, a pattern that becomes evident as additional samples are examined.
Sample Im2, obtained by DC reactive sputtering with 75% oxygen and 500 W of power, is presented in
Figure 4. The grayscale SEM image in panel (a) reveals a compact, granular morphology with rounded nodular features. The surface is densely packed, showing subtle topographical variations without any dominant directional alignment. This micrograph forms the basis for the fractal segmentation analysis shown in panels (b) through (f). Panels (b–f) present binarized versions of the original SEM image, corresponding to progressively higher threshold values (T = 0.50, 0.60, 0.70, 0.75, and 0.80). This sequence illustrates how morphological features are incrementally filtered as segmentation becomes more selective. At T = 0.50 (panel b), segmentation is highly inclusive, capturing both fine granular structures and broader topographical zones in a dense binary pattern. Although this preserves much of the surface’s inherent texture, the excess of detail can obscure dominant structural patterns. At T = 0.60 (panel c), minor surface features begin to disappear, emphasizing more prominent nodular clusters and simplifying background textures. At T = 0.70 (panel d), only the most pronounced protrusions remain, revealing an intermediate level of structural organization with smaller-scale features largely removed and no evident directional bias. At T = 0.75 and 0.80 (panels e and f), segmentation becomes highly selective, retaining only the largest and most persistent morphological elements, likely associated with kinetically favored growth regions. These coarser patterns suggest a hierarchical surface structure rather than a continuous network. Altogether, this threshold progression highlights the scale-dependent nature of surface complexity: lower thresholds capture a wide range of micro- and macro-features, while higher thresholds isolate the morphological backbone. The recurrence of specific features across multiple thresholds supports the notion of a self-similar, fractal-like organization, forming the foundation for the quantitative analysis of the fractal dimension (Df) that follows.
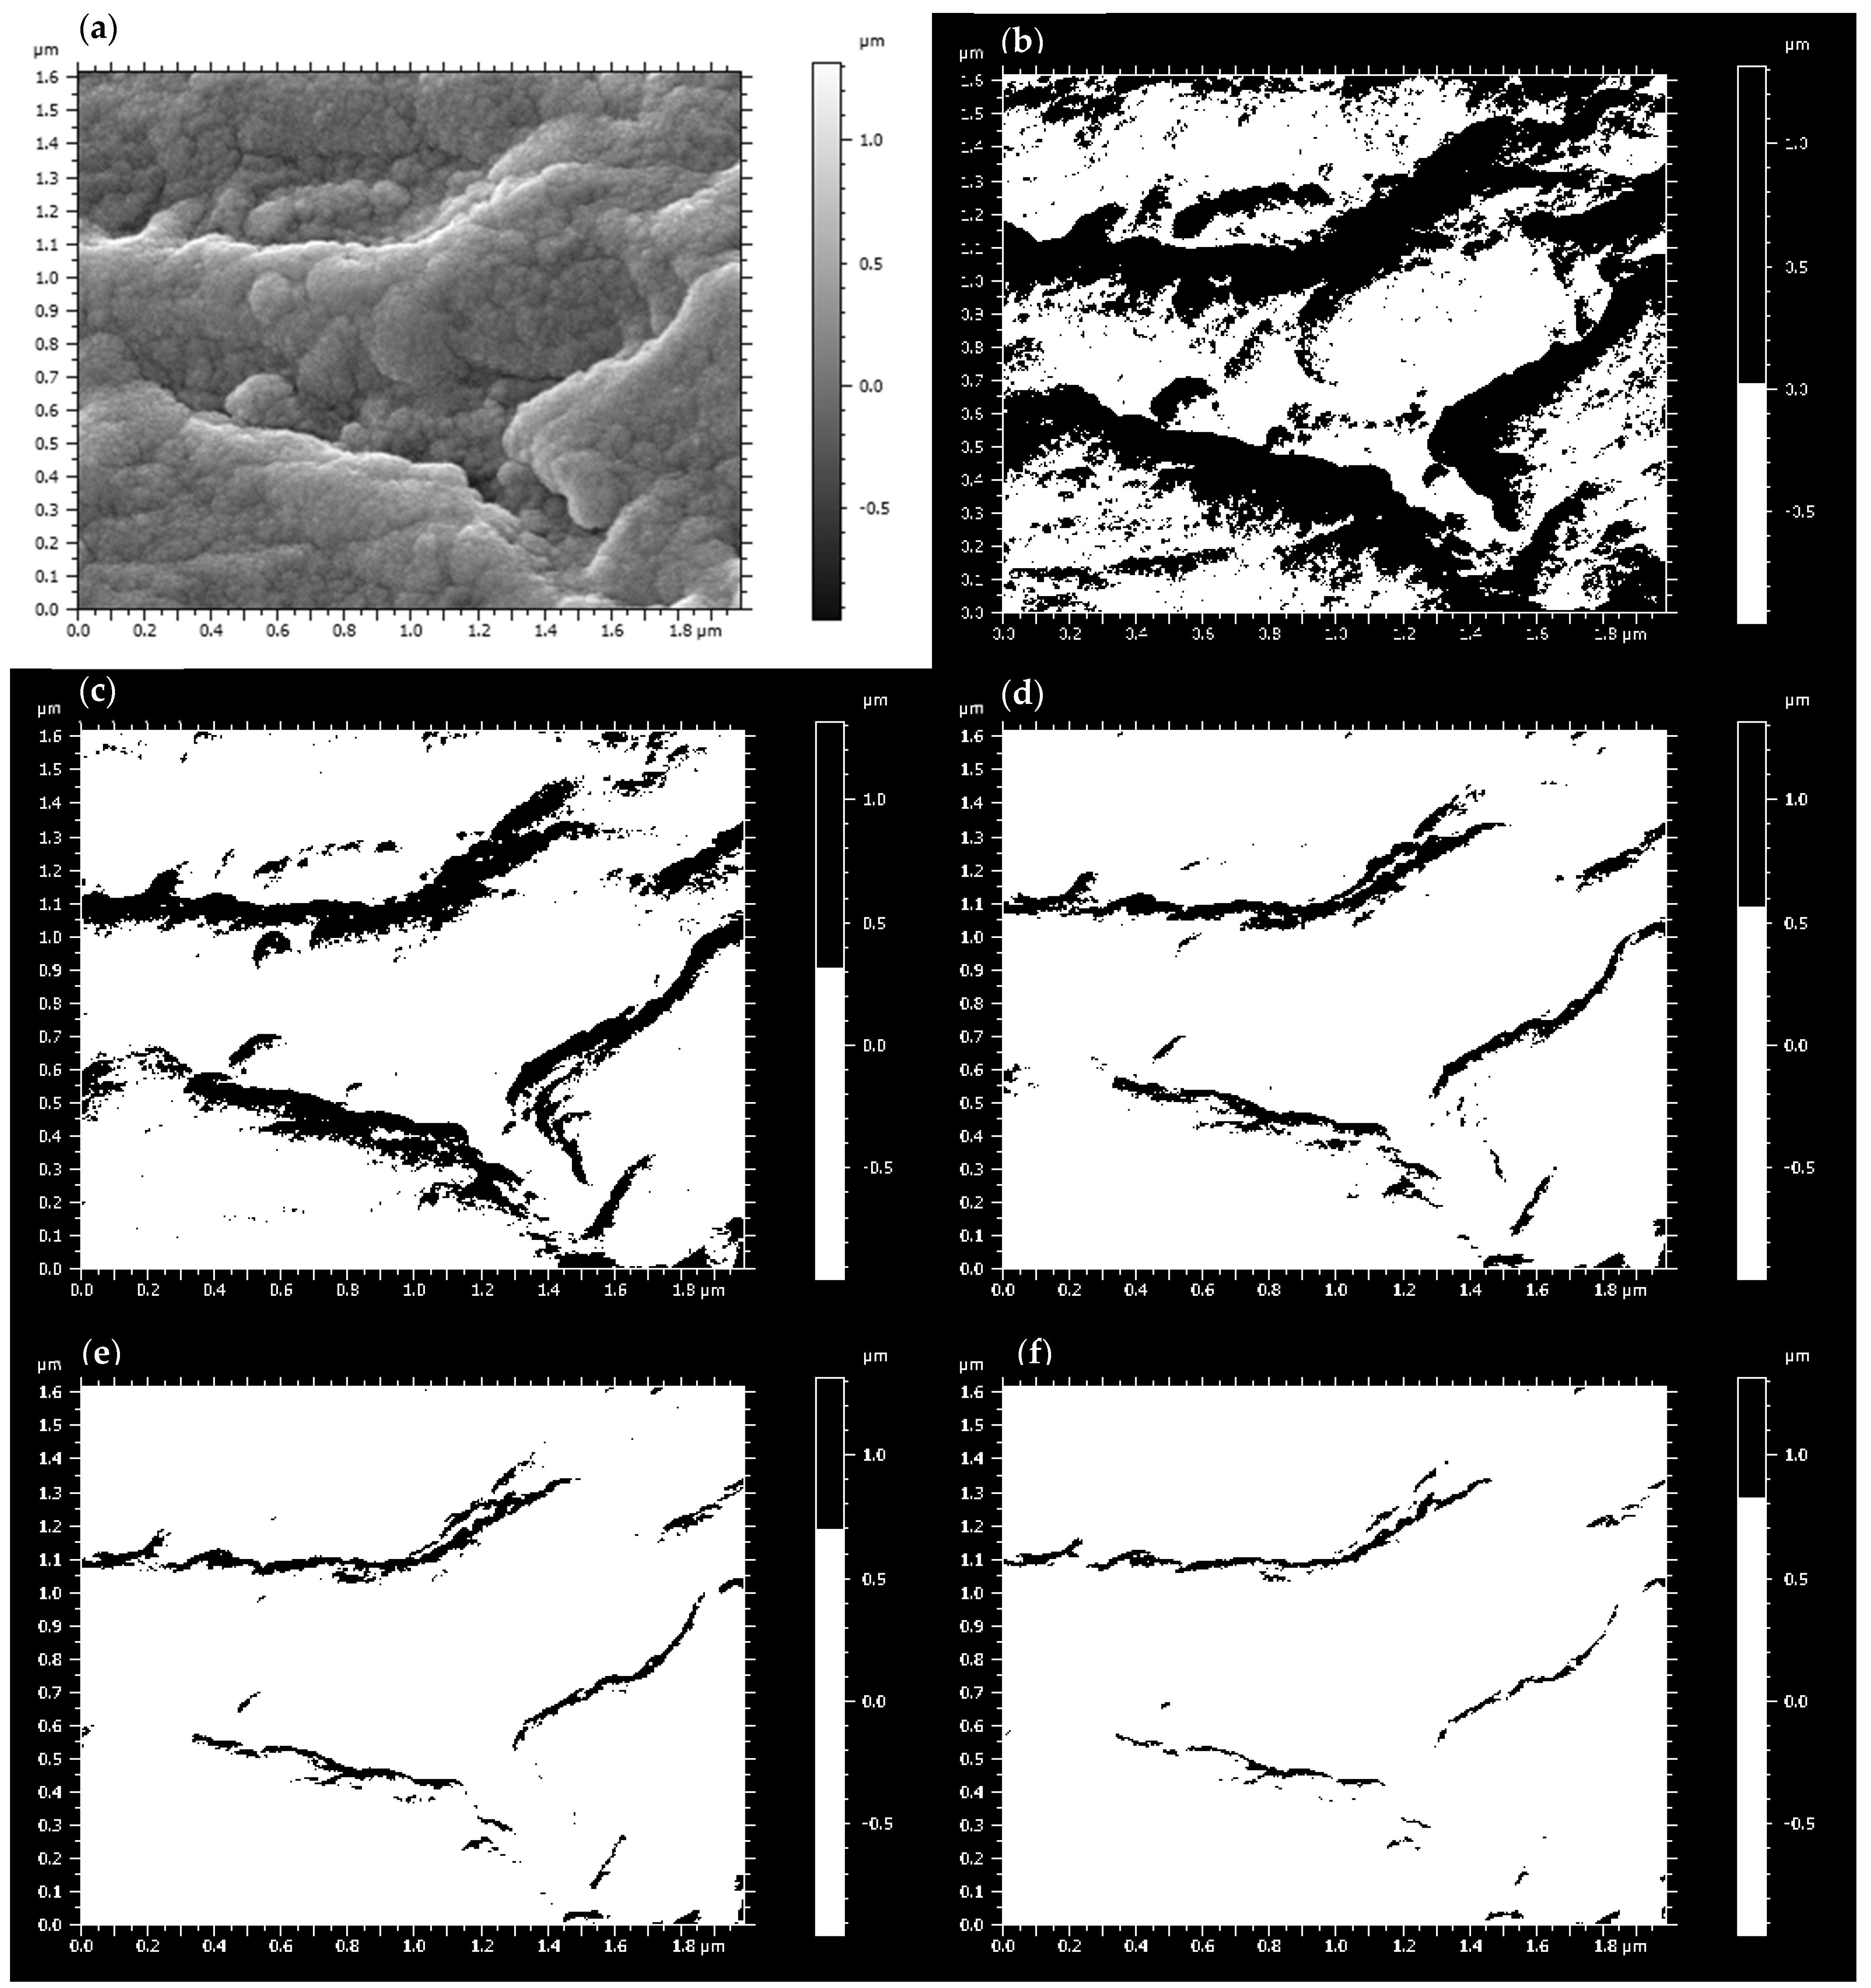
Sample Im3, obtained by DC reactive sputtering with 75% oxygen and 1000 W of power, is presented in
Figure 5. Panel (a) presents the grayscale SEM image revealing a layered, terraced morphology dominated by smooth, horizontally aligned ridges. Unlike the more porous or granular textures in other samples, Im3 exhibits relatively low surface roughness with an anisotropic, orderly growth pattern.
Panels (b–f) display binarized versions of the image at increasing thresholds T = 0.50, 0.60, 0.70, 0.75, and 0.80, respectively, showing progressive filtering of morphological features. At T = 0.50 (panel b), a wide range of surface details is preserved, capturing both fine textures and dominant ridges, though fine-scale features are less prominent than in irregular samples. At T = 0.60 (panel c), minor features fade, highlighting the anisotropic horizontal ridges. At T = 0.70 (panel d), most noise and minor textures disappear, revealing the intermediate-scale ridges. Finally, at T = 0.75 and 0.80 (panels e and f), only the most prominent ridges remain, representing the core morphological framework likely shaped by the kinetic growth conditions.
This threshold sequence underscores Im3’s reduced surface complexity compared to more porous films, yet indicates a scale-dependent, self-similar structure with persistent layered ridges. These observations underpin the forthcoming fractal dimension (Df) analysis that will quantify the surface’s hierarchical organization.
Sample Im4, obtained by DC reactive sputtering with 50% oxygen and 500 W of power, is presented in
Figure 6. The grayscale SEM image (panel a) shows a smooth, relatively featureless surface with a few rounded nodular features, indicating lower topographical complexity compared to other samples and suggesting a more uniform growth with limited surface texturing.
Binarized images at increasing thresholds (T = 0.50, 0.60, 0.70, 0.75, 0.80 in panels b–f) reveal the progressive filtering of surface features. At T = 0.50, only sparse, subtle structures appear, consistent with a surface lacking significant micro- or nanoscale variation. Increasing to T = 0.60, more texture emerges as fine-grained speckling and nodules become distinguishable, though the pattern remains diffuse and without strong directional order. At T = 0.70, most minor textures are filtered out, leaving mainly larger nodules and elevated features, showing limited hierarchical organization. At the highest thresholds (T = 0.75 and 0.80), segmentation is highly selective, isolating only prominent protrusions while the majority of the surface appears uniform, indicating a non-fractal, non-hierarchical morphology dominated by few localized elements.
This threshold progression confirms that Im4 has the lowest structural complexity among the studied films, with limited self-similarity and an absence of interconnected or branching features, consistent with growth under low-energy, low-oxygen conditions producing a simple, compact surface topology.
Fractal analysis was performed on binarized versions of the SEM images using the box-counting method. The fractal dimension (Df) values provide a measure of morphological complexity and surface irregularity, where higher values typically indicate more intricate, space-filling structures, while lower Df values reflect smoother or simpler morphologies.
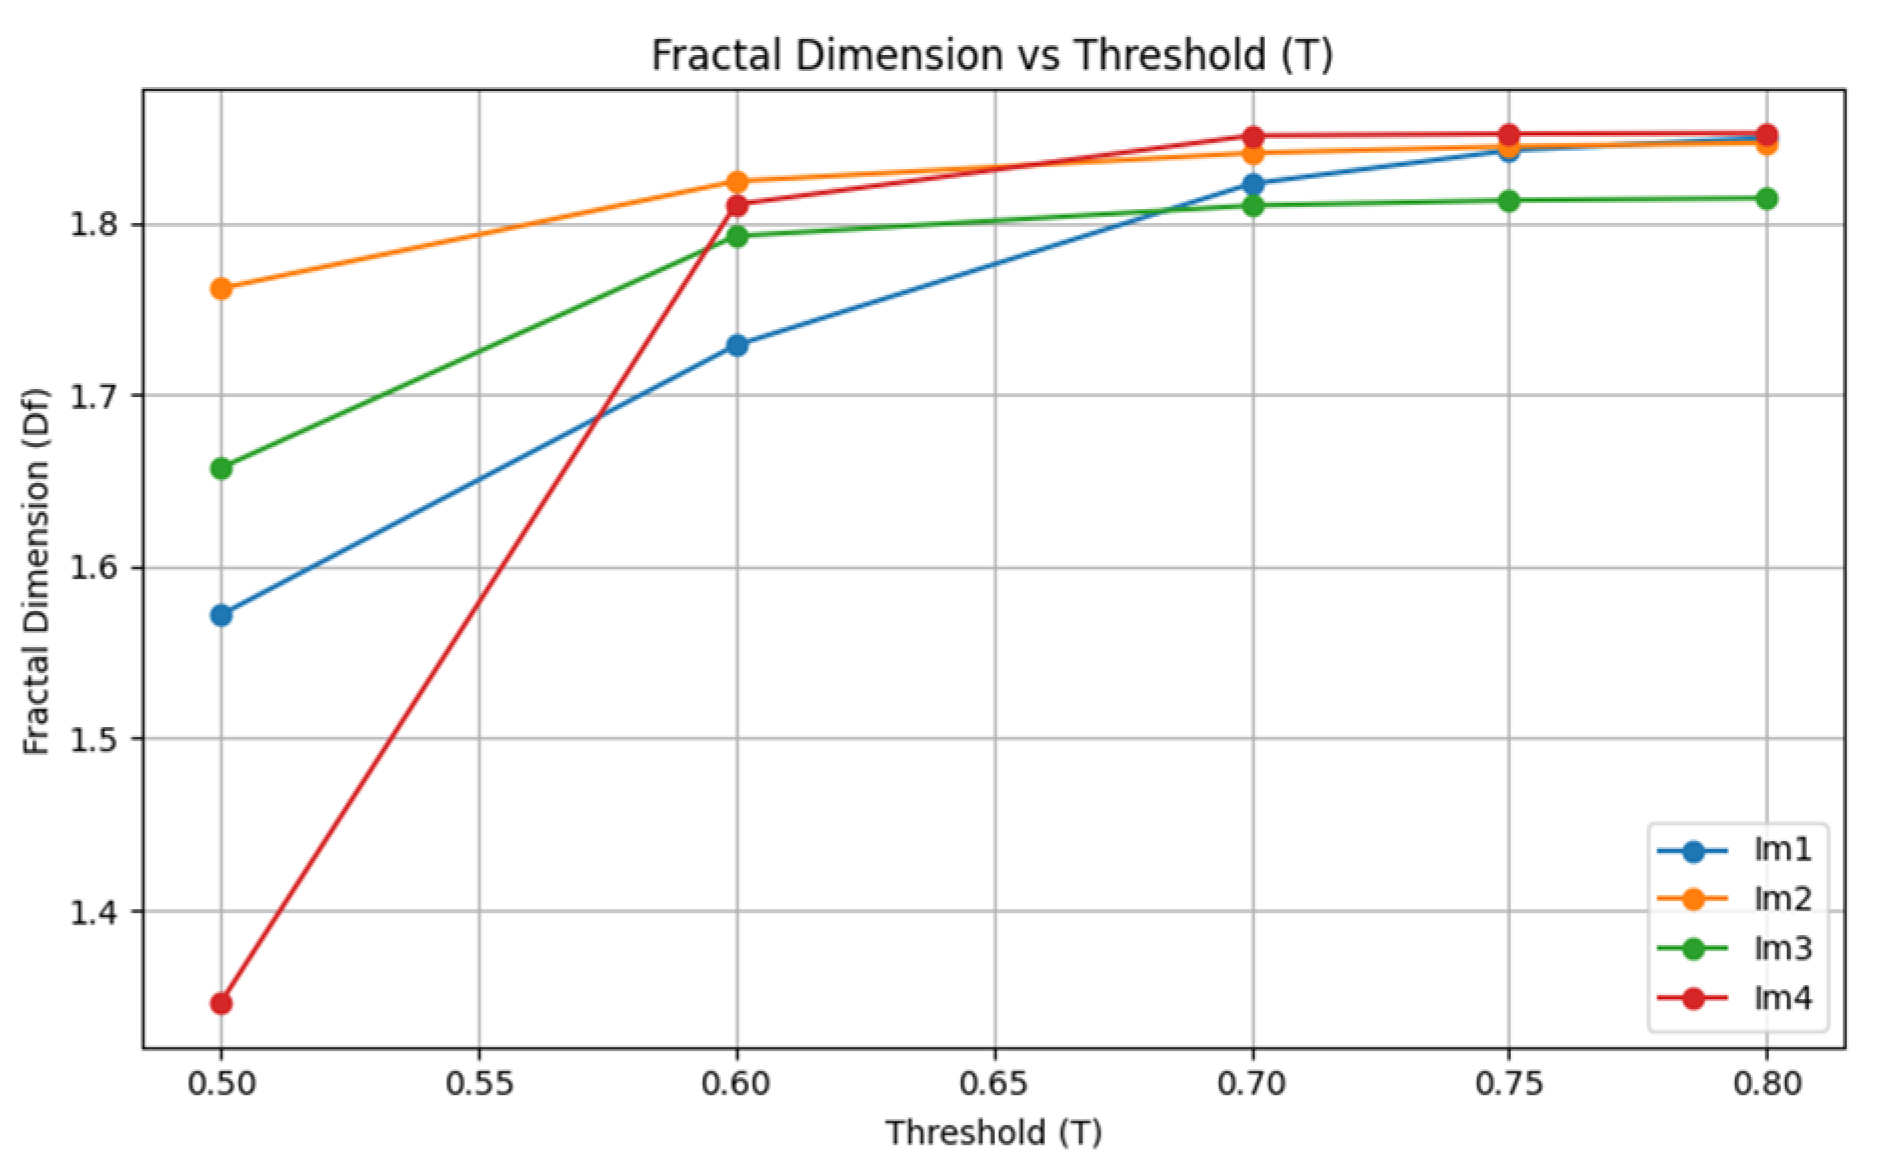
Figure 7 presents the variation in Df as a function of threshold (T) for all analyzed SEM images (Im1 to Im4), each corresponding to distinct deposition conditions. The estimated Df values ranged from approximately 1.35 to 1.85, showing a clear trend of increasing Df with higher oxygen concentration and greater sputtering power. This progression reflects the growing morphological complexity and spatial richness of the surface as the deposition environment becomes more energetic and oxidizing. This behavior aligns with theoretical models of sputtered thin film growth, where shadowing and reduced adatom diffusion under energetic conditions promote hierarchical structuring [
7]. The highest Df (~1.85) was recorded for the sample deposited at 1000 W/75% O
2 (Im3), which also corresponds to the sample that exhibited the highest roughness values in earlier topographic analysis (e.g., Rq and Rz). These values are consistent with previous reports on sputtered TiO
2 films, where increased surface complexity under high-energy conditions has been associated with elevated Df values and directional growth patterns [
4].This supports the interpretation that fractal dimension captures the multiscale, hierarchical nature of surface features, going beyond what is revealed by conventional roughness parameters that measure only vertical deviations.
Conversely, the lowest Df (~1.35) was observed in the film deposited at 1000 W/25% O2 (Im4), particularly evident at the lowest threshold (T = 0.50). This indicates a more compact and uniform surface topology, likely related to metallic-rich deposition conditions, which typically favor denser film growth due to enhanced surface diffusion and reduced oxidation during formation. The variation in Df with threshold levels also provides valuable insight: at lower thresholds (T = 0.50–0.60), the differences between samples are more pronounced, while at higher thresholds (T ≥ 0.70), Df tends to converge. This suggests that the finer, lower-intensity features contribute most to the differentiation in complexity, whereas larger-scale structures appear more similar across samples when binarized at higher intensity cutoffs.
Altogether, these results confirm the value of fractal dimension as a complementary morphological descriptor, capturing aspects of surface organization that are not accessible through standard roughness parameters, and providing a quantitative framework to assess structural richness as a function of deposition conditions.
3.3. GLCM Texture Analysis
To complement morphological and roughness analyses, surface texture was characterized using Gray-Level Co-occurrence Matrix (GLCM) descriptors computed from grayscale SEM images of the TiO
2 thin films. This second-order statistical method quantifies surface regularity, heterogeneity, and anisotropy by analyzing the frequency of pixel intensity pairs at defined spatial relationships. Key descriptors—contrast, correlation, dissimilarity, energy, and homogeneity—were calculated across four directions (0°, 45°, 90°, 135°) and two-pixel distances (d = 1, d = 2), enabling a multiscale, orientation-sensitive assessment. Lower distances capture fine local features, while higher distances reflect broader structural patterns. The angular variation helps detect anisotropic growth behaviors linked to specific deposition conditions. This is consistent with established applications of GLCM in image analysis, where pixel pair statistics are used to detect directional textures and second-order spatial patterns [
8].
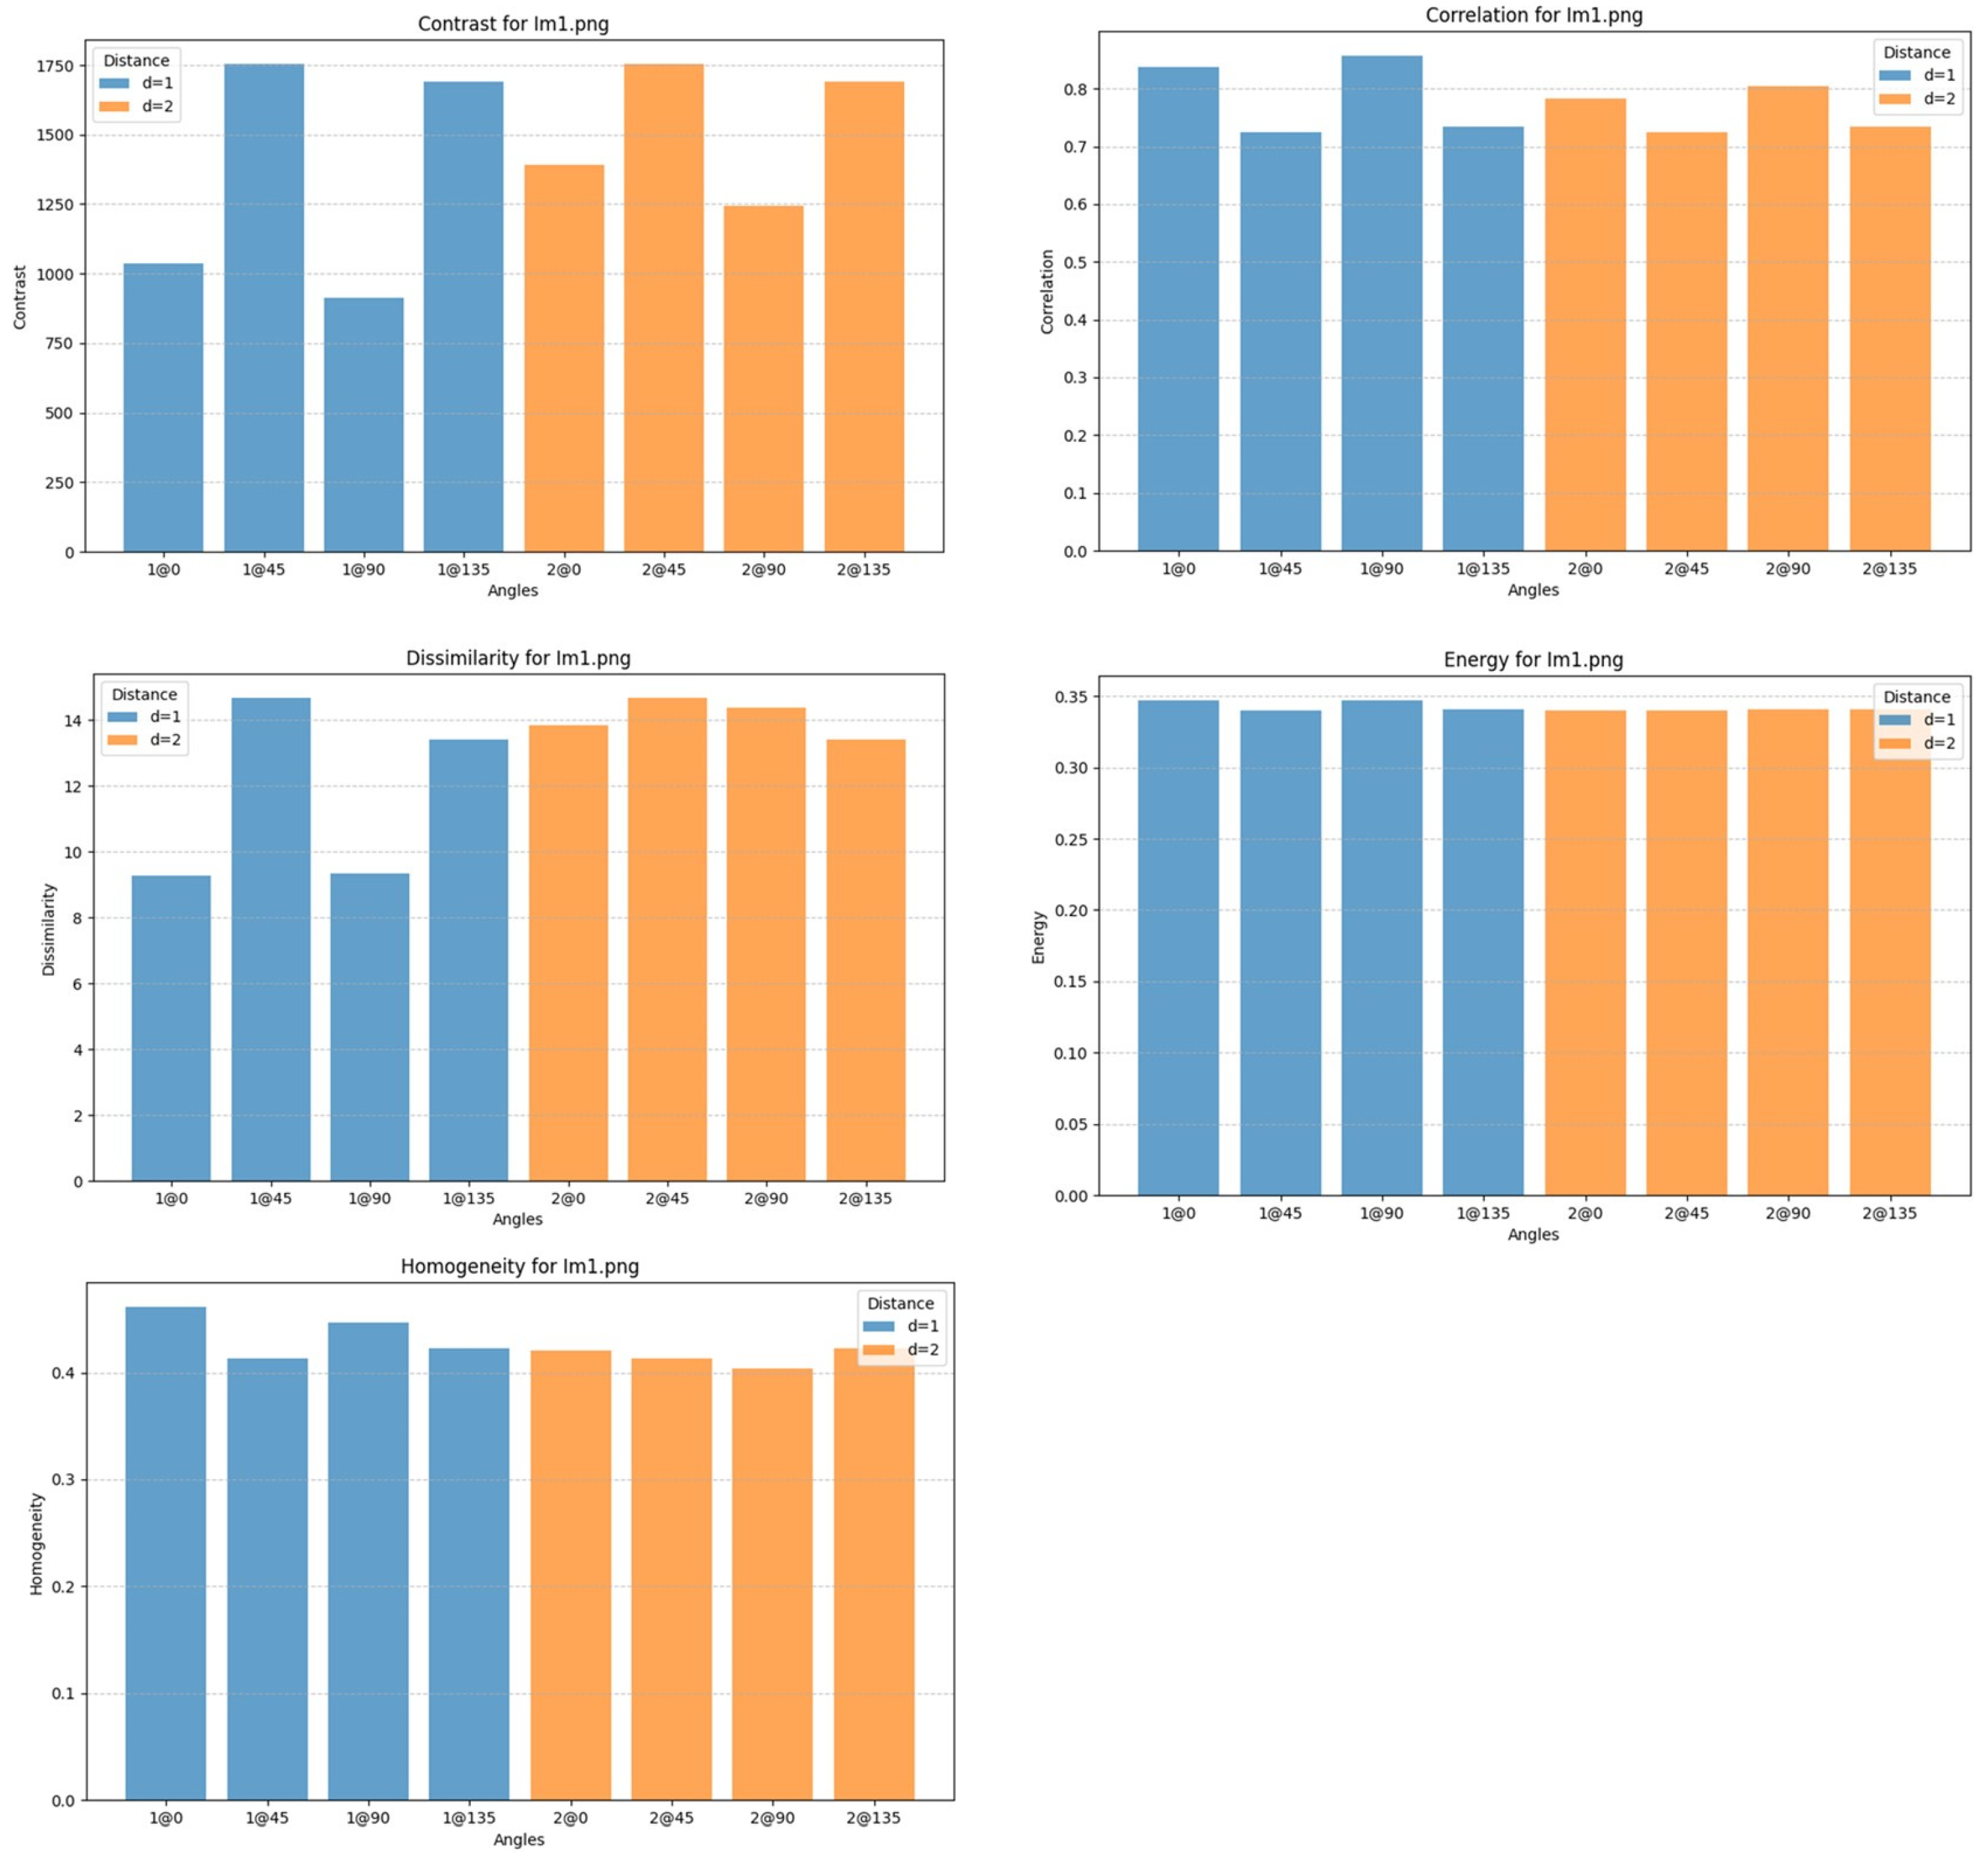
For sample Im1 (50% oxygen and 1000 W), the SEM image reveals a heterogeneous and porous morphology with irregular microstructures predominantly aligned along the horizontal axis. This directional anisotropy is clearly reflected in the GLCM texture descriptors shown in
Figure 8. Notably, contrast and dissimilarity values increase significantly at angles of 90° and 135°, indicating greater variation in gray levels along vertical and diagonal directions, which statistically confirms the horizontal elongation of surface features.
This anisotropic texture likely results from the interplay of intermediate oxygen concentration and high sputtering power. At 1000 W, increased kinetic energy of sputtered species enhances surface diffusion, directional re-emission, and shadowing effects, promoting elongated ridges and interconnected porous pathways aligned preferentially in the horizontal direction. Meanwhile, the 50% oxygen content provides sufficient reactivity for oxide formation without over-saturating the surface, supporting structured yet non-uniform growth and thus complex anisotropic patterns.
Comparing pixel distances d = 1 and d = 2, the texture parameters reveal scale-dependent surface organization. Contrast and dissimilarity generally increase with distance, particularly at 90°, reflecting longer-range gray-level transitions consistent with spacing between major surface features. Concurrently, correlation decreases with distance, indicating less predictable pixel intensity relationships at broader scales, signifying a complex texture without regular periodicity. Energy remains low across all directions, suggesting the absence of strong uniform patterns, while homogeneity decreases at d = 2, especially at 90°, confirming disruption of smoothness over larger spatial extents.
These GLCM results quantitatively support the SEM observations, revealing a surface with pronounced anisotropy and multiscale complexity shaped by the reactive sputtering conditions applied during deposition.
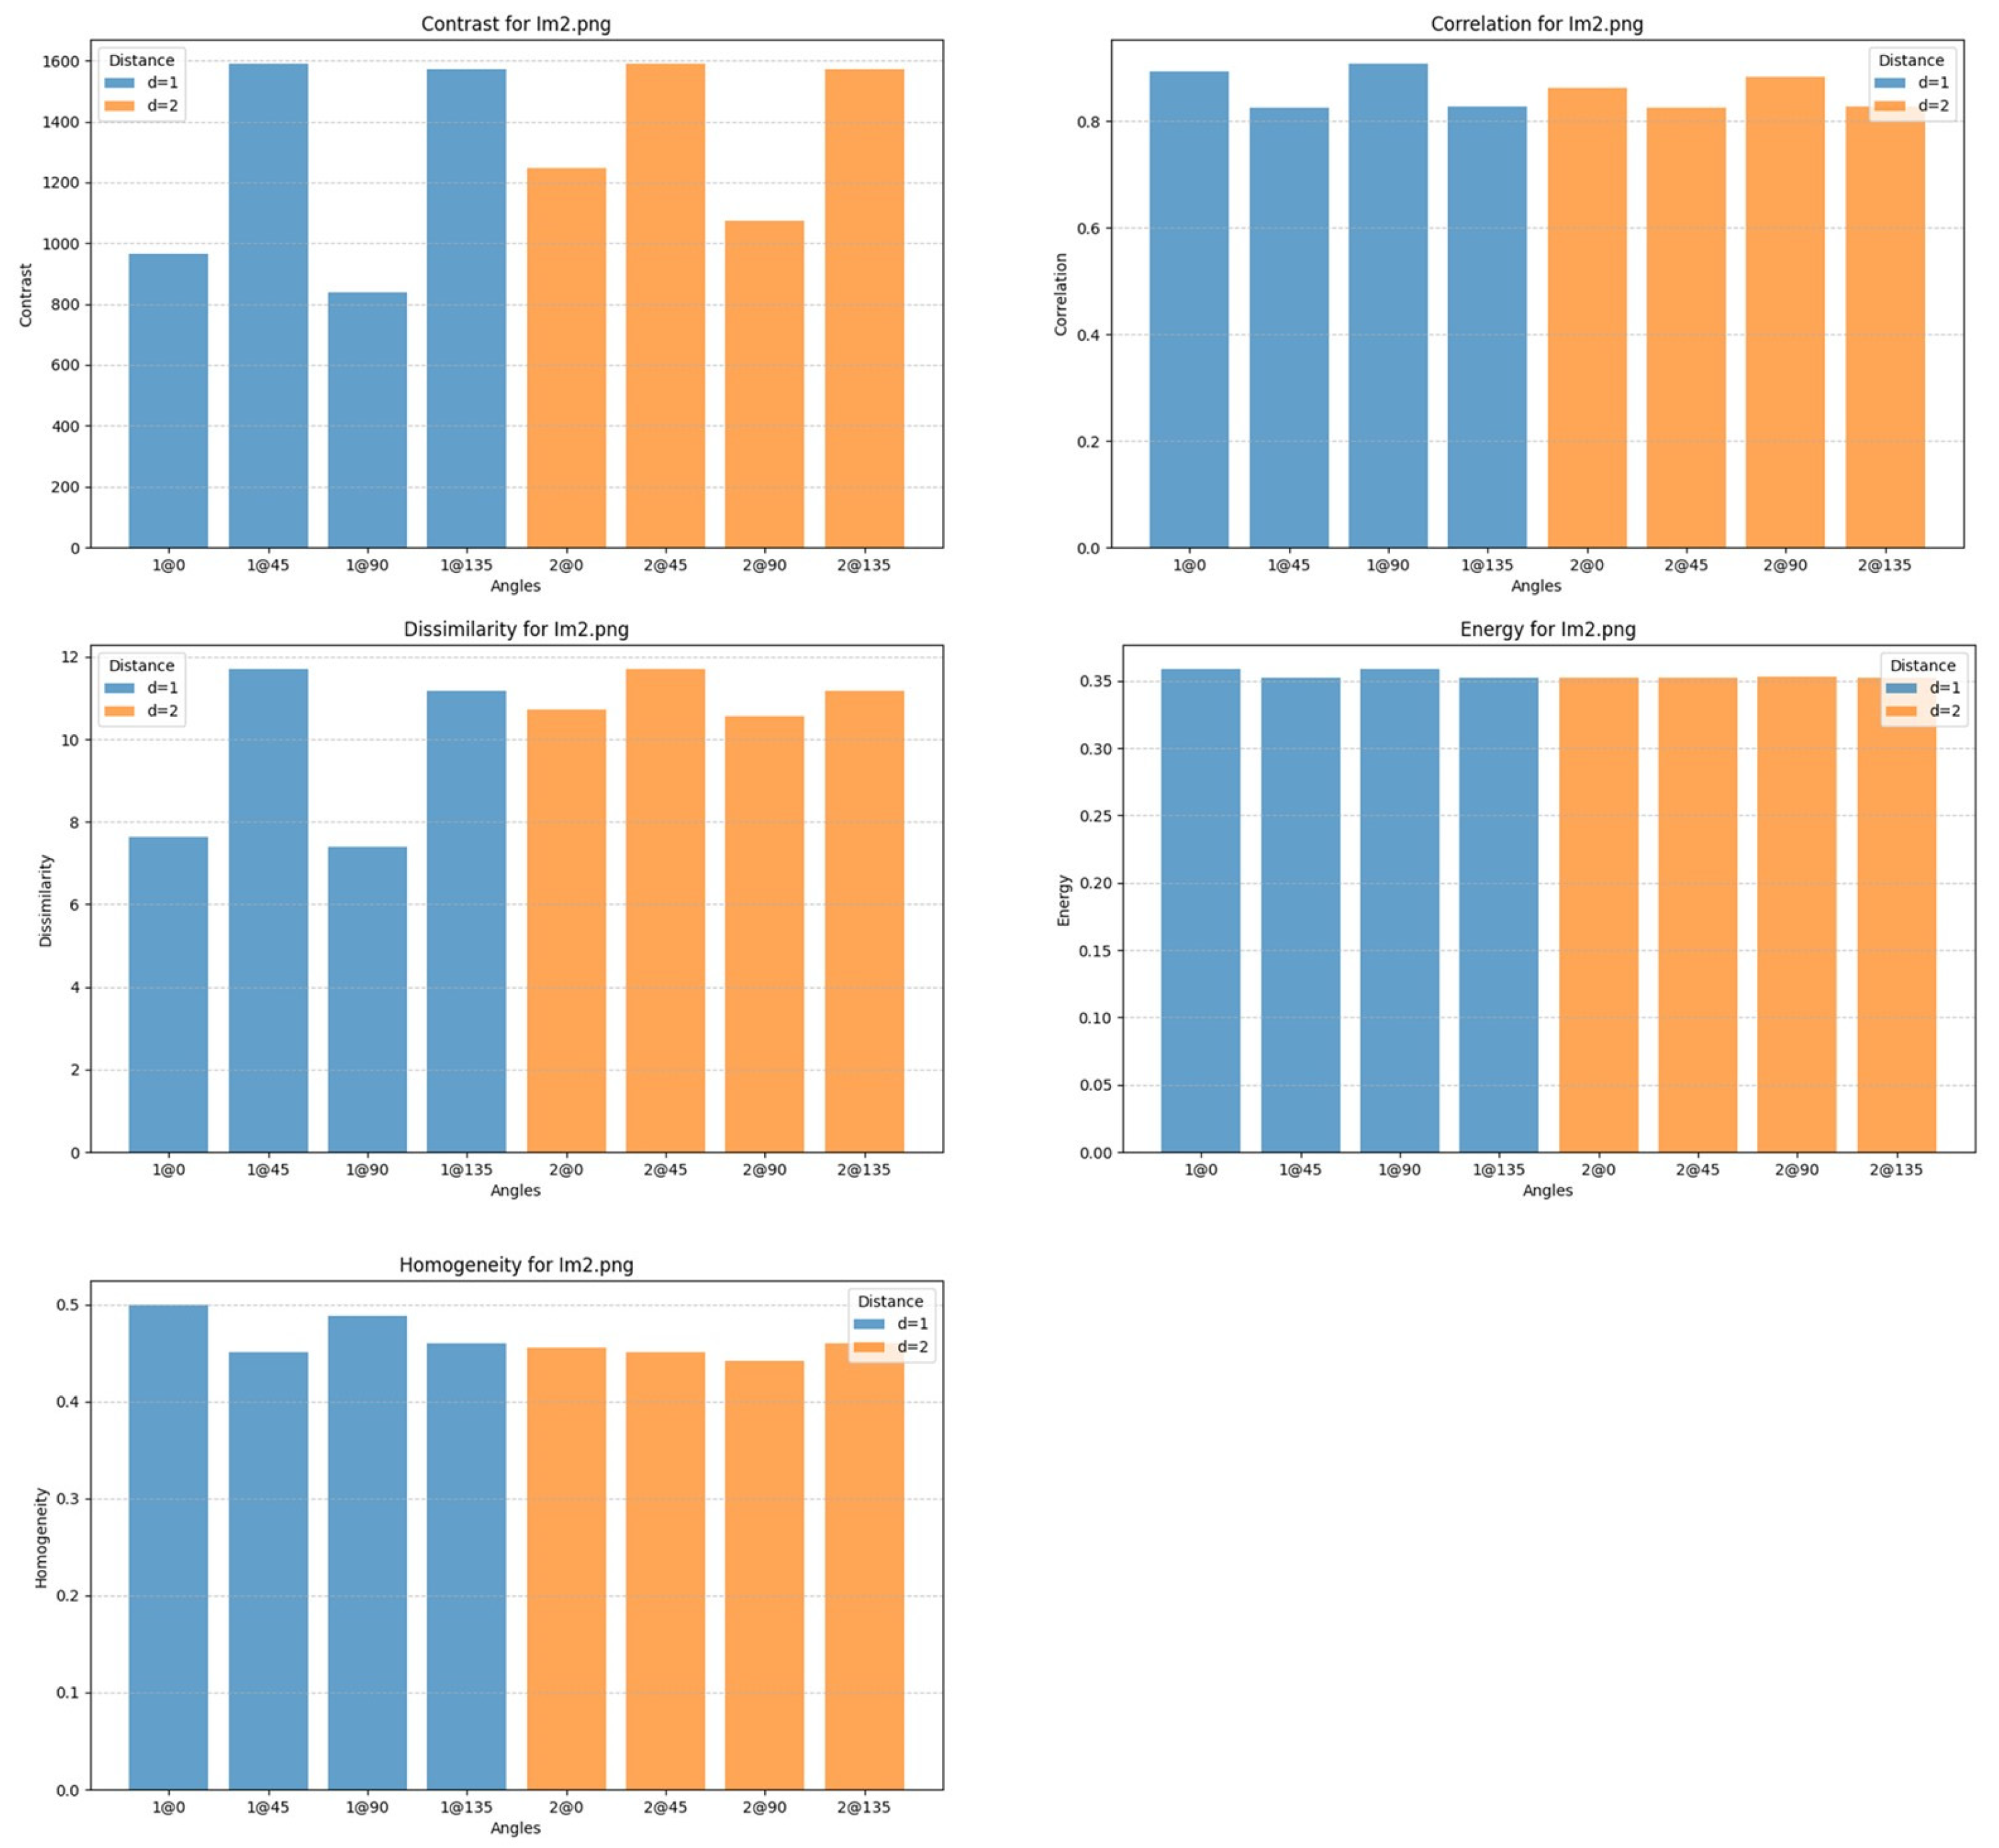
The GLCM texture analysis results for sample Im2 (75% oxygen, 500 W) are presented in
Figure 9. Compared to Im1, the increased oxygen partial pressure creates a more oxidizing plasma environment, favoring complete oxidation and the formation of stoichiometric TiO
2 phases. Simultaneously, the lower sputtering power reduces the kinetic energy of sputtered species, limiting surface diffusion and adatom mobility. Together, these factors promote a more compact and homogeneous morphology with reduced surface roughness and less structural anisotropy, which is clearly reflected in the GLCM descriptors. At pixel distance d = 1, contrast and dissimilarity are low across all directions, indicating reduced gray-level variation and a more uniform fine-scale texture consistent with limited directional growth instabilities. However, at d = 2, these parameters increase notably, especially at 90° and 135°, indicating that longer-range brightness variations exist, corresponding to broader topographical features such as columnar formations or grain boundaries. This highlights a multiscale organization: smooth at the local scale but retaining intermediate-range complexity. Correlation values are high at d = 1 and remain relatively high at d = 2, reflecting strong gray-level relationships and uniform texture across scales. Energy and homogeneity are consistently high and show minimal angular variation, confirming a regular, repeated surface pattern with minimal discontinuities.
Importantly, the angular dependence is less pronounced than in Im1, indicating a more isotropic surface texture. The reduced kinetic energy at 500 W limits directional surface diffusion, favoring randomized nucleation and finer-grained, symmetric growth.
In summary, the GLCM analysis shows that Im2 possesses a uniform, isotropic texture with low local heterogeneity and moderate mesoscale complexity. This texture arises from the combined effects of high oxygen flow and moderate sputtering power, resulting in a smoother, less complex surface than Im1, but retaining some residual structural variation at intermediate scales.
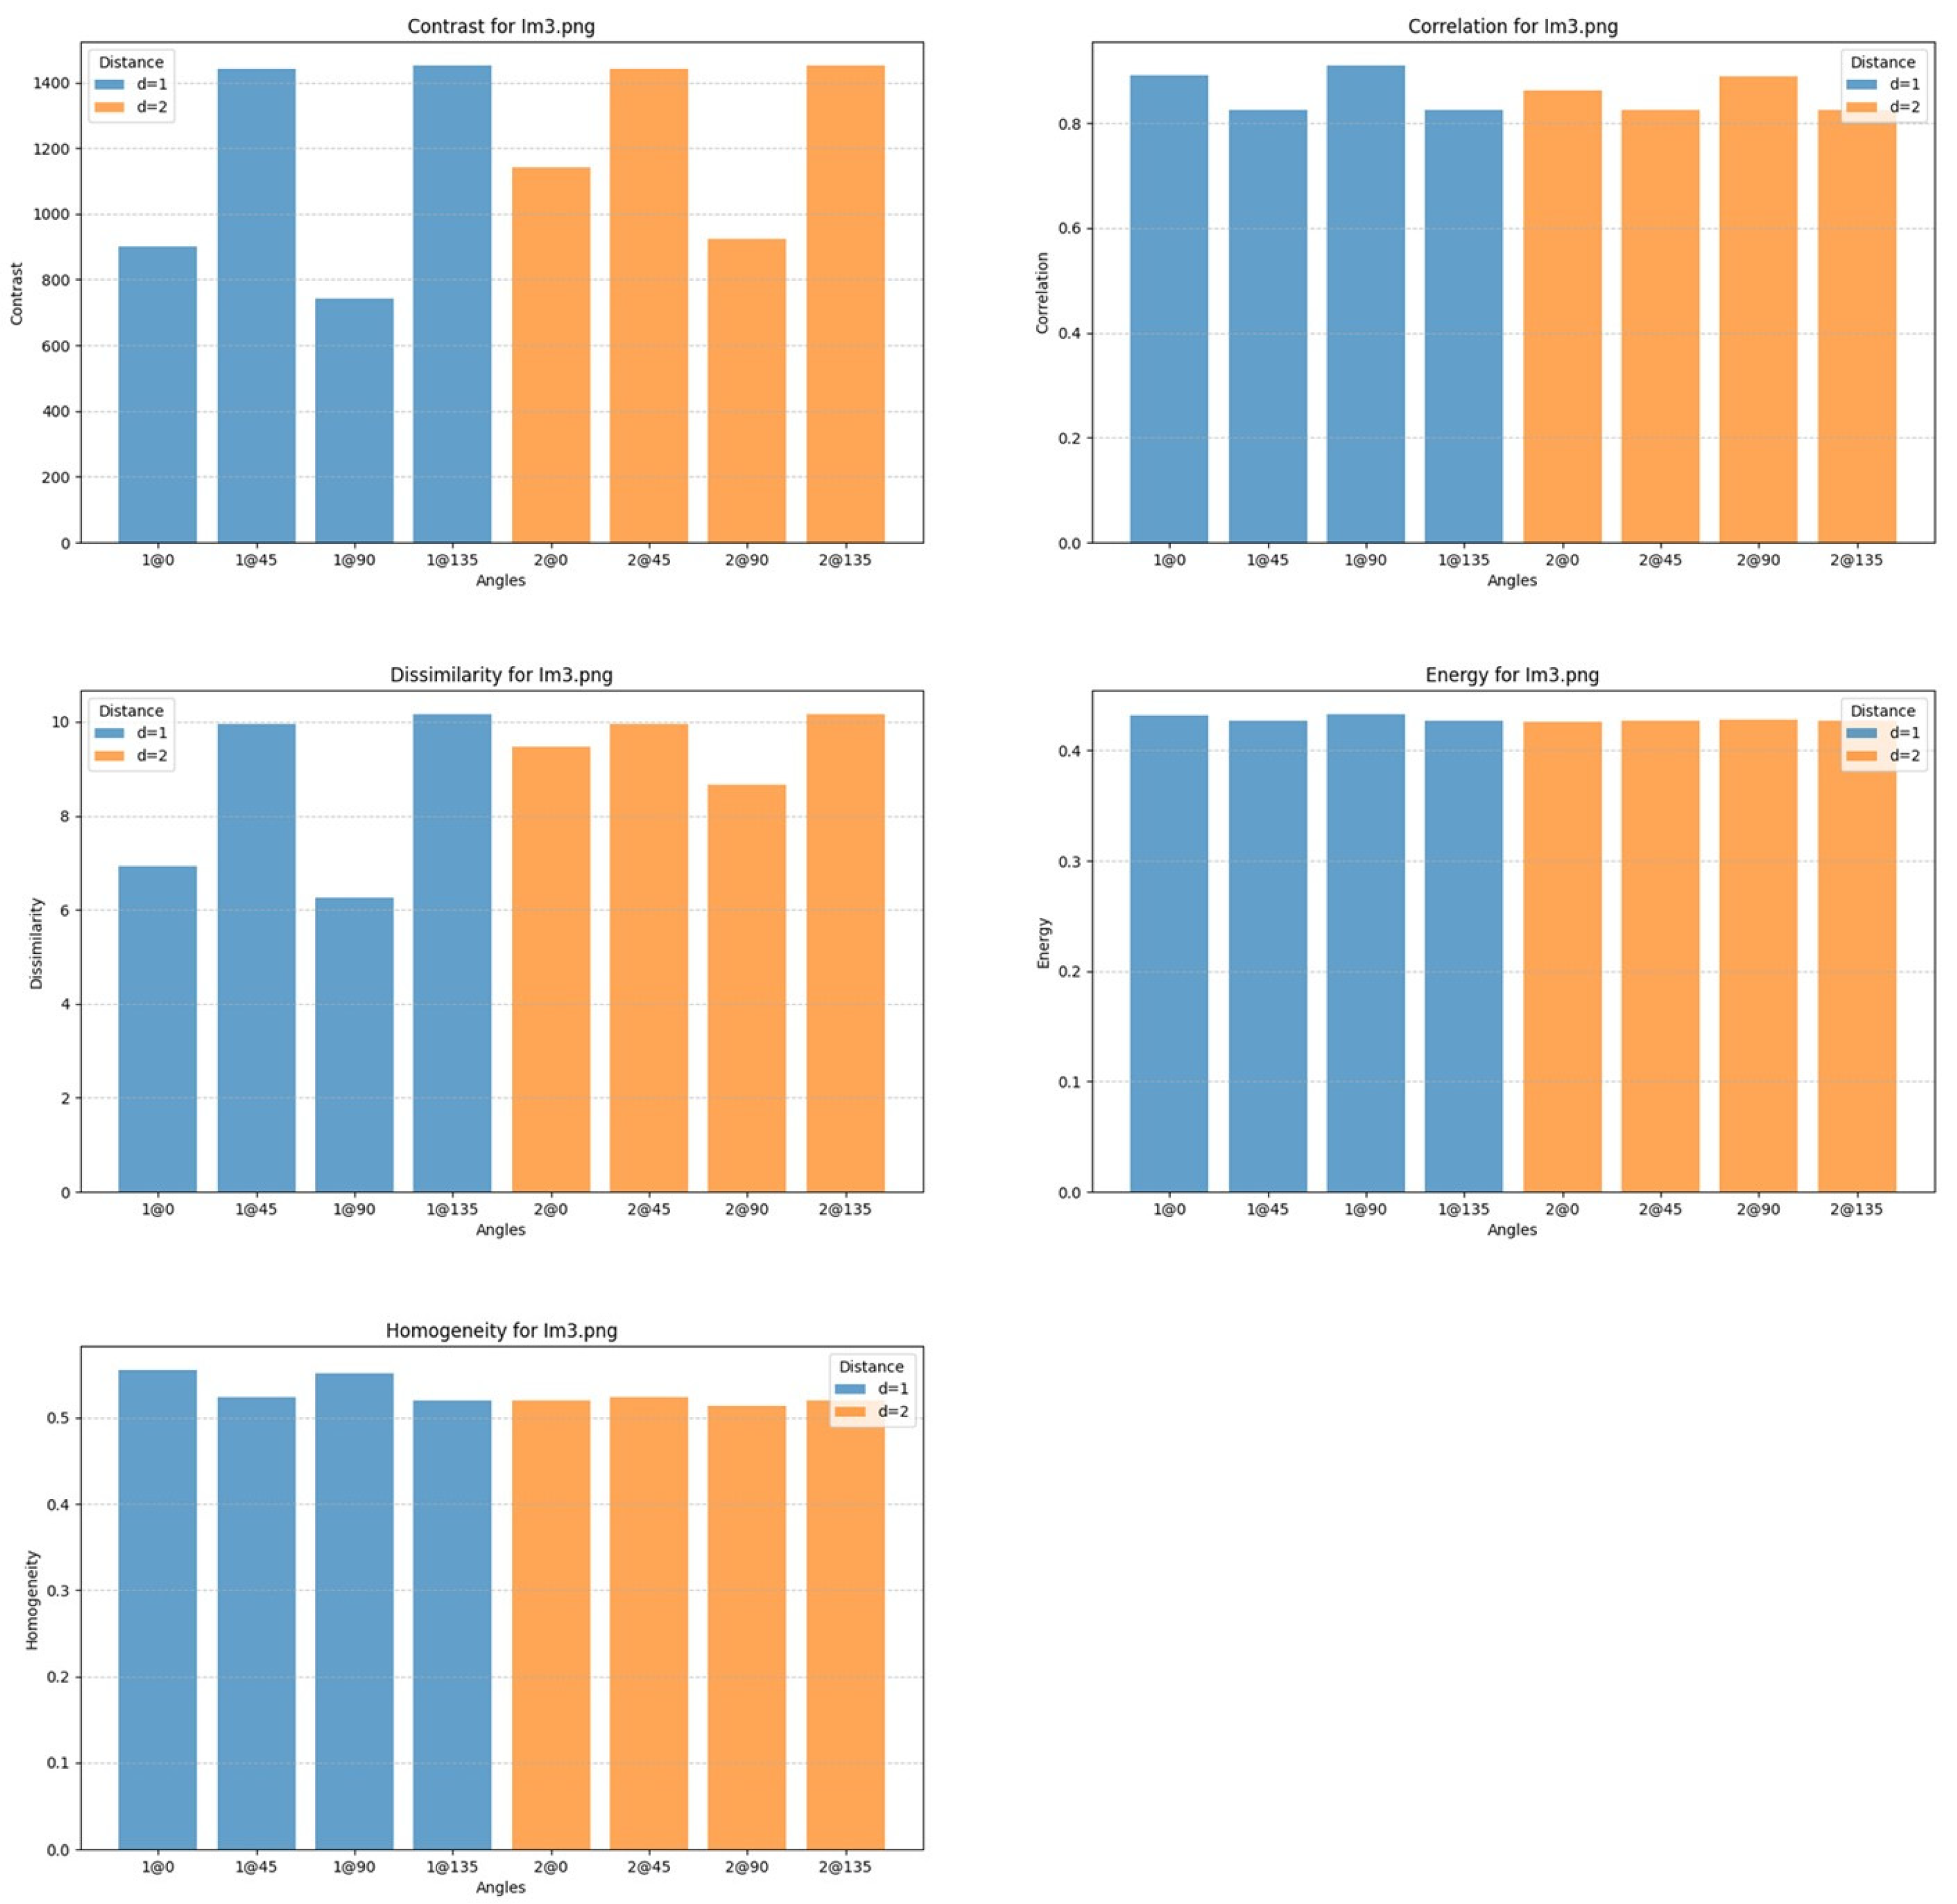
The GLCM texture analysis for sample Im3 (75% oxygen and 1000 W) is shown in
Figure 10. This combination creates a strongly oxidizing plasma and high kinetic energy species, promoting compact, dense films with pronounced microstructural features and enhanced crystallinity. Contrast and dissimilarity values are intermediate to high, especially at d = 2 and angles 45° and 135°, indicating mesoscale structural variations like preferential orientation domains or vertically aligned grain boundaries. At d = 1, contrast is lower, reflecting finer-scale uniformity typical of columnar growth.
Correlation remains high at both distances, slightly higher at d = 1, indicating strong local pixel intensity relationships and stable microstructure. A small decrease at d = 2 along 135° hints at subtle anisotropy linked to columnar texture from shadowing or adatom migration. Energy and homogeneity are consistently high and nearly angle-independent, confirming uniform, compact films with fine structural order and minimal abrupt intensity changes. Angular variations show anisotropy with higher contrast and dissimilarity at 45° and 135° at d = 2, likely due to column tilting or shadowing effects, emphasizing the need for multi-distance GLCM to capture hierarchical textures. Compared to Im2, which shows isotropic and smooth surfaces due to lower power, Im3’s high power leads to vertical growth and internal complexity, despite similar oxygen levels.
In summary, Im3 exhibits a dense, directionally textured film with high correlation, homogeneity, and mesoscale contrast along oblique angles, reflecting the interplay of strong oxidation and elevated adatom mobility. This results in uniform local texture with mesoscale anisotropies, highlighting the impact of energetic, oxygen-rich sputtering on surface morphology and potential functional properties.
The GLCM texture analysis for sample Im4 (50% O
2, 500 W), shown in
Figure 11, reflects the effects of a moderately oxidizing plasma combined with low sputtering energy. These conditions limit adatom mobility and reactivity, favoring the formation of granular, isotropic morphologies with reduced densification and minimal crystallographic alignment. Contrast and dissimilarity are moderate at d = 1 but increase noticeably at d = 2—especially at 45° and 135°—revealing mesoscale structural variation likely associated with grain coalescence or weak preferential domains. The lower values at short distances point to greater uniformity in local gray-level transitions, while broader pixel separations reveal more complex organization. Correlation remains high across directions and distances, confirming strong local intensity relationships and a repetitive, though non-directional, texture. A slight drop in correlation at d = 2 suggests minor long-range disorder, likely due to random grain nucleation and limited surface diffusion. Energy is relatively stable across parameters, indicating reasonable gray-level uniformity, though less marked than in more ordered films. Homogeneity is moderately high and angularly consistent, supporting the presence of a compact but slightly disordered surface.
Im4 displays a locally ordered, isotropic texture without significant anisotropy or hierarchical structure. Compared to Im3 (75% O2, 1000 W), which showed directionally textured and denser films due to enhanced mobility, Im4 highlights the impact of lower sputtering power—at constant oxidation—on promoting smoother, more homogeneous surface morphologies in TiO2 thin films.
The GLCM analysis reveals a clear dependence of surface texture on sputtering power and oxygen concentration. Films deposited at higher power (1000 W)—Im1 (50% O2) and Im3 (75% O2)—exhibit increased contrast and dissimilarity, particularly at longer pixel distances, reflecting enhanced gray-level variability and the presence of mesoscale structural features, such as elongated grains or columnar domains. These effects are further modulated by oxygen content: while Im1 shows strong anisotropy with horizontally aligned features, Im3 presents a more compact but directionally textured morphology, likely due to combined high reactivity and surface mobility.
Conversely, low-power depositions (500 W)—Im2 and Im4—yield smoother, more isotropic textures. Im2 (75% O2) displays high correlation and homogeneity, and low contrast, consistent with a uniform, fine-grained surface, stemming from complete oxidation and limited adatom mobility. Im4 (50% O2), while also relatively isotropic, exhibits slightly higher contrast and lower energy at d = 2, suggesting moderate mesoscale disorder, possibly due to granular coalescence in a less reactive environment.
Overall, the results demonstrate that sputtering power primarily governs surface roughness and textural complexity, while oxygen concentration modulates the degree of oxidation and crystallinity. The GLCM descriptors effectively capture these multiscale morphological variations, offering a robust statistical approach for correlating deposition conditions with film texture—key for tailoring functional properties in TiO
2 thin films. As highlighted in recent reviews, combining GLCM descriptors with fractal analysis provides a robust dual approach for capturing both local anisotropy and global complexity [
5].
3.4. Comparative Summary of Morphological and Textural Features
To consolidate the findings from surface roughness measurements, fractal dimension analysis, and GLCM-based texture characterization,
Table 1 presents a comparative synthesis of the four TiO
2 thin film samples. This overview highlights the influence of sputtering power and oxygen concentration on surface morphology and textural organization.
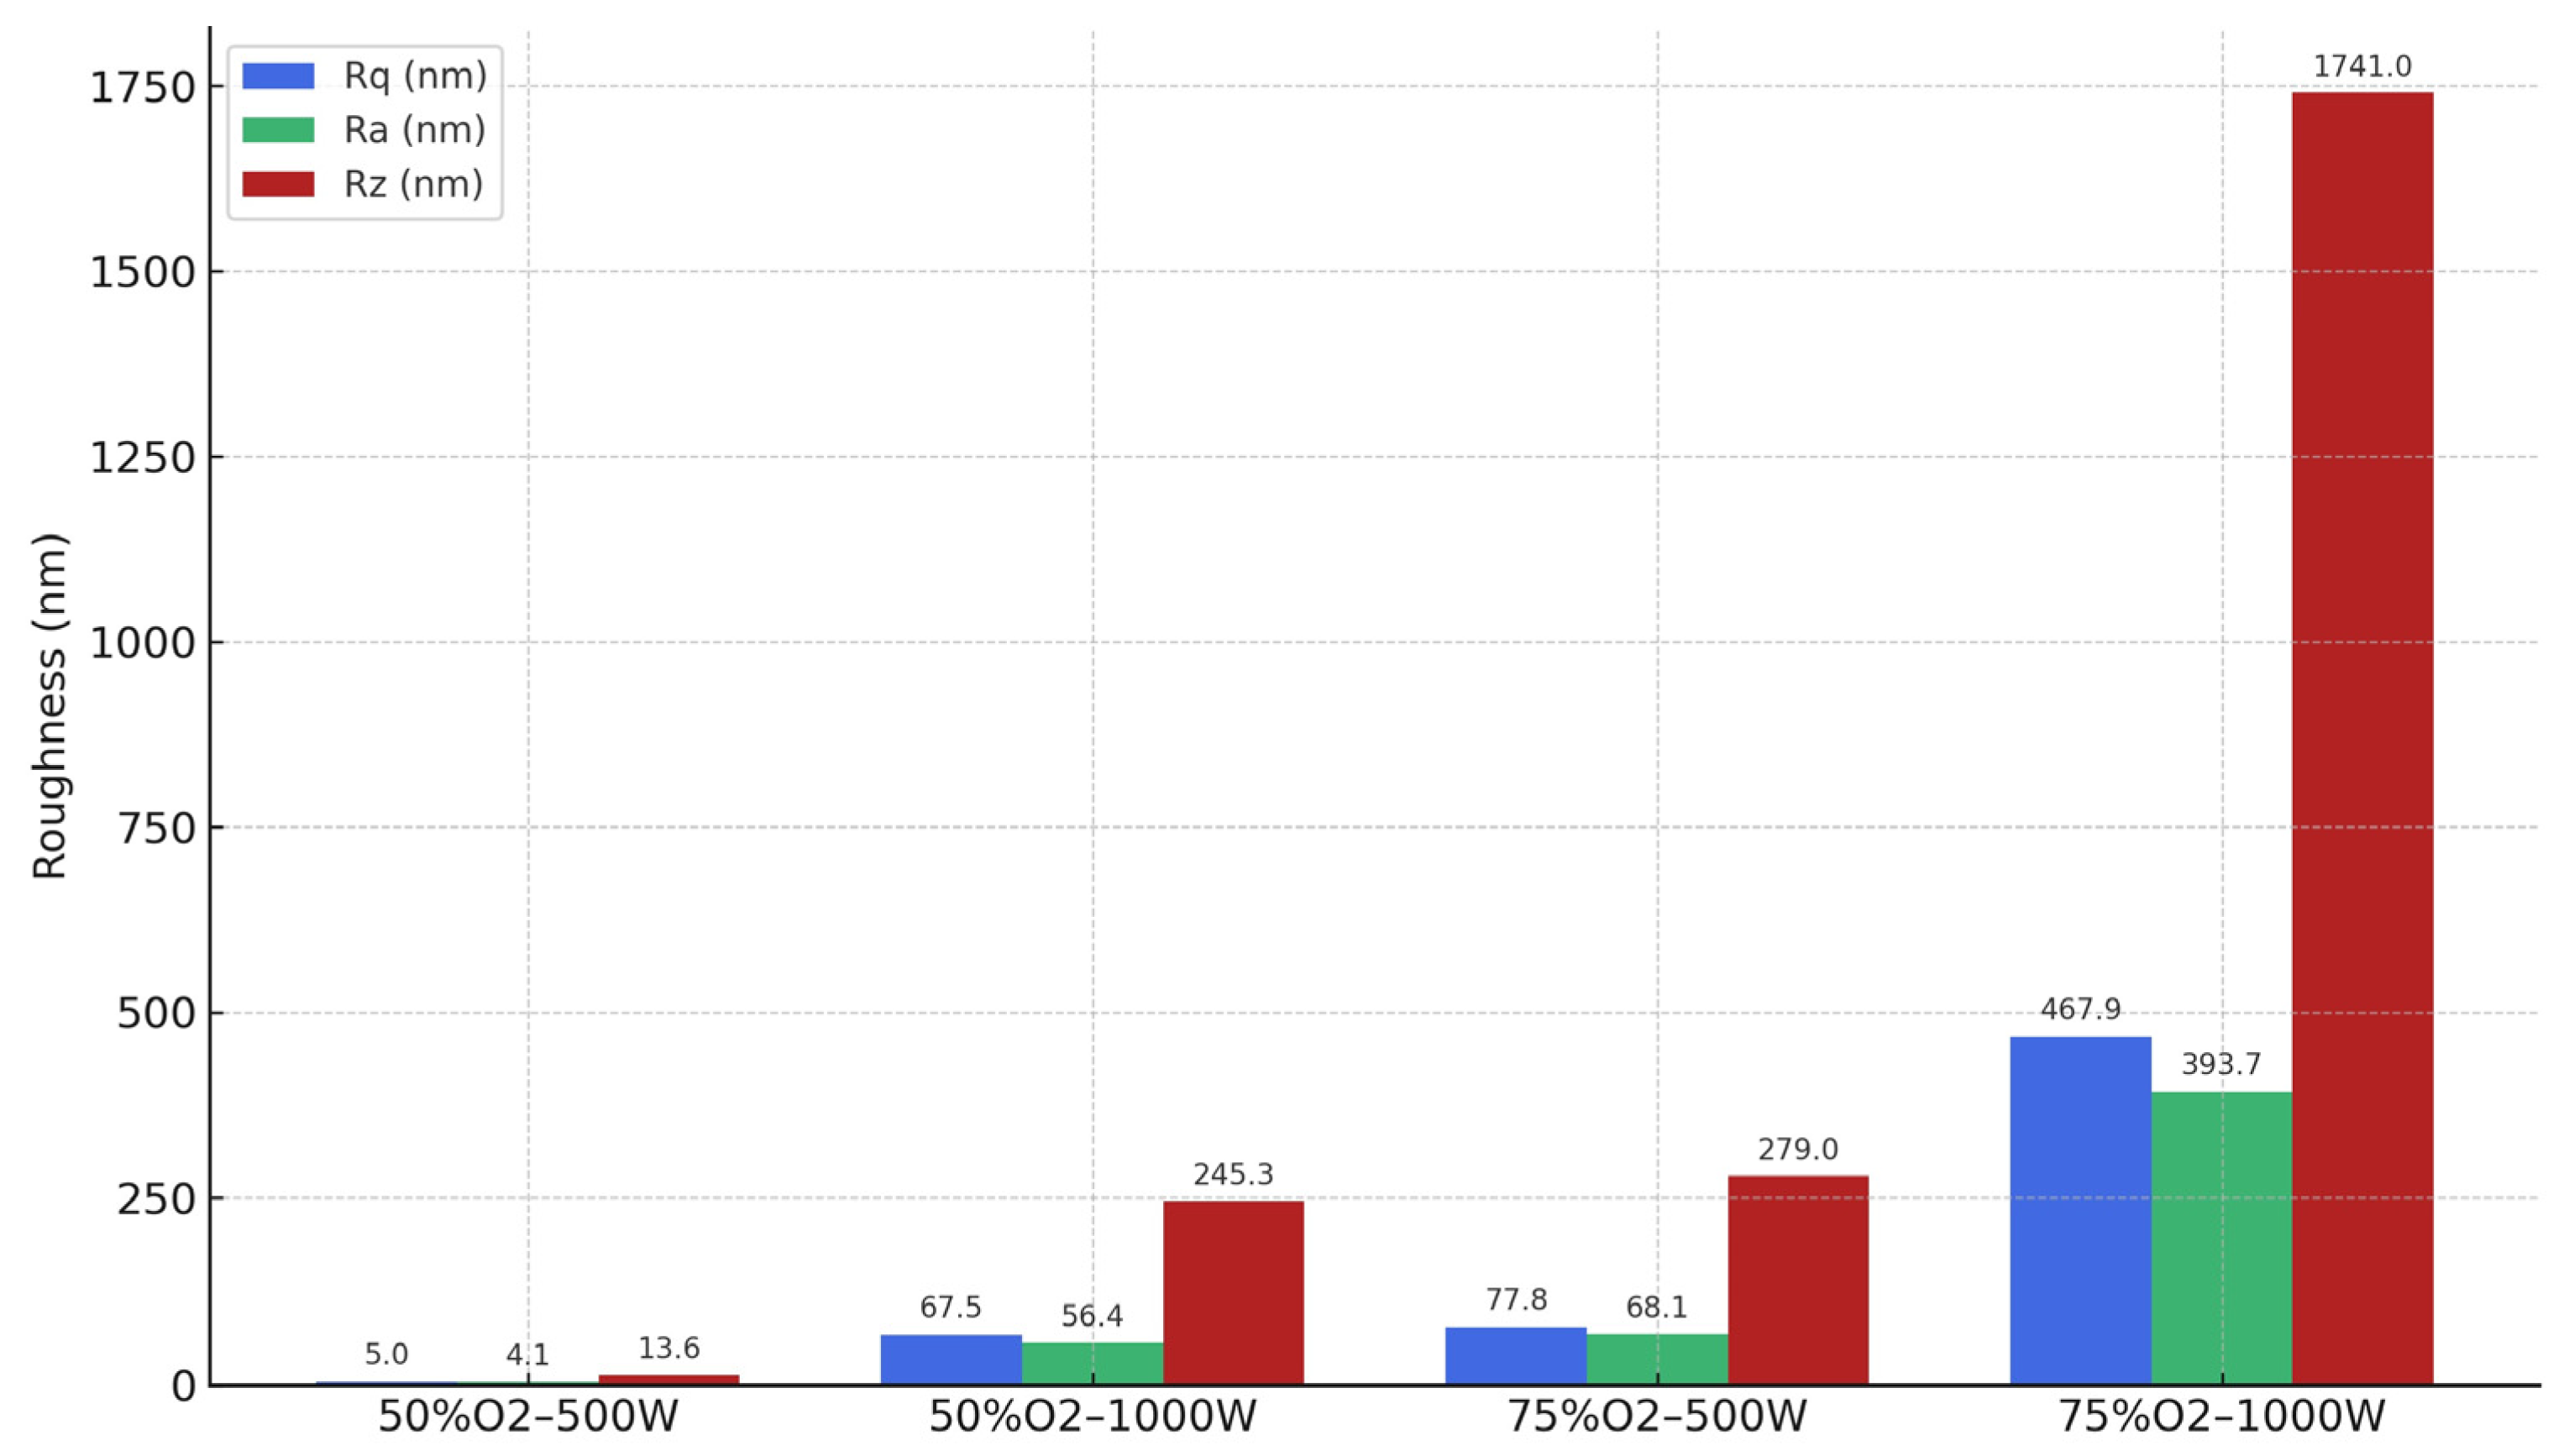
The comparison reveals consistent trends: higher sputtering power tends to increase surface complexity, as reflected by higher roughness parameters (Ra, Rz) and fractal dimension (Df), while also promoting textural anisotropy. Elevated oxygen content contributes to more complete oxidation, denser structures, and vertical growth features.
The trends observed in both fractal dimension and GLCM descriptors can be explained by key thin film growth mechanisms inherent to sputtering processes. At higher sputtering powers, the increased energy of the incident species enhances adatom surface mobility, leading to competitive growth and the development of preferential orientations or columnar structures. These structures contribute to anisotropy and greater spatial variability, which are reflected in higher fractal dimensions (Df) and elevated GLCM contrast and dissimilarity values. Additionally, shadowing effects—particularly under low diffusion conditions—favor vertical growth and ridge formation, reinforcing hierarchical complexity and directionality at the mesoscale.
In contrast, at lower power and oxygen levels, reduced energy input results in limited adatom rearrangement and more isotropic nucleation, yielding smoother, compact morphologies with fewer high-frequency features. These surfaces exhibit lower Df values and more homogeneous GLCM profiles. Grain boundary density and coalescence patterns, modulated by oxygen reactivity, also influence surface roughness and local gray-level transitions. Thus, the fractal and texture metrics used in this work provide a quantitative means to interpret the morphological signatures of the underlying physical growth mechanisms.
These effects are quantitatively supported by the five GLCM descriptors—contrast, correlation, dissimilarity, energy, and homogeneity—which reveal multiscale surface properties. For instance, higher contrast and dissimilarity values are associated with more heterogeneous and hierarchically structured surfaces, while higher energy and homogeneity indicate uniformity and repetition in pixel intensity patterns. Correlation provides insight into the predictability and order of local gray-level transitions.
The summarized parameters in
Table 1 offer an integrated perspective on how deposition conditions govern the evolution of surface features, from microstructural order to mesoscale texture, thus informing the optimization of functional thin films grown by reactive sputtering.


