Designing a Remote Room Monitoring System with Arduino and BME280 Sensor †
Abstract
1. Introduction
2. Application Topology
- ESP8266 programmed with Arduino IDE;
- Hosting server and domain name;
- PHP script to insert data into MySQL and display on a web page;
- MySQL database to store readings.
- -
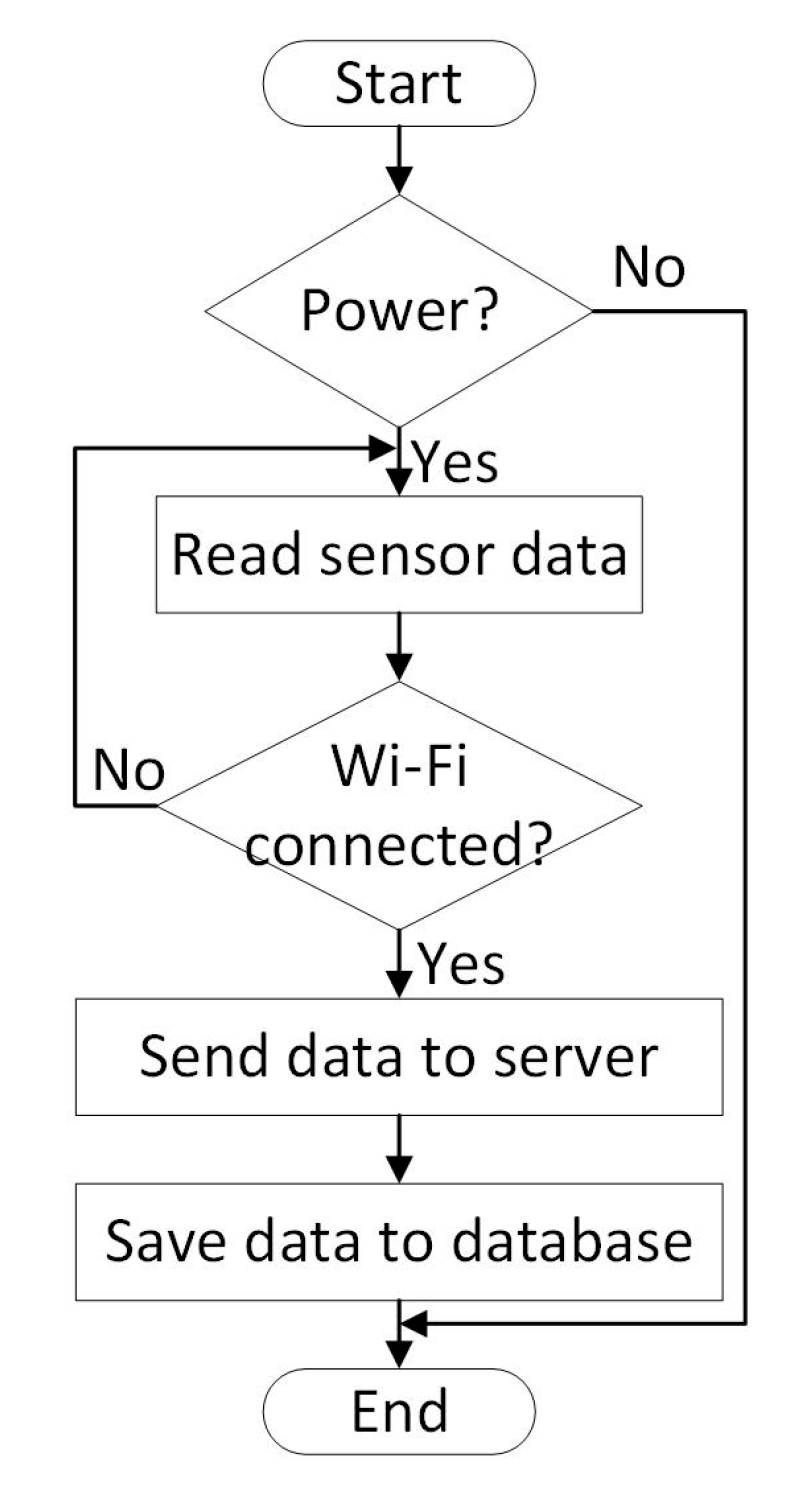
- Microprocessor system consisting of ESP 2866 microcontroller and BPE280 sensor measuring various parameters (temperature, humidity, and pressure). BPE280 sensor measures parameters in raw form and transmits data to ESP 2866. In ESP 2866, measurements are converted into an understandable data type. Then, ESP 2866 sends the converted data to a server via wireless connection via Wi-Fi;
- -
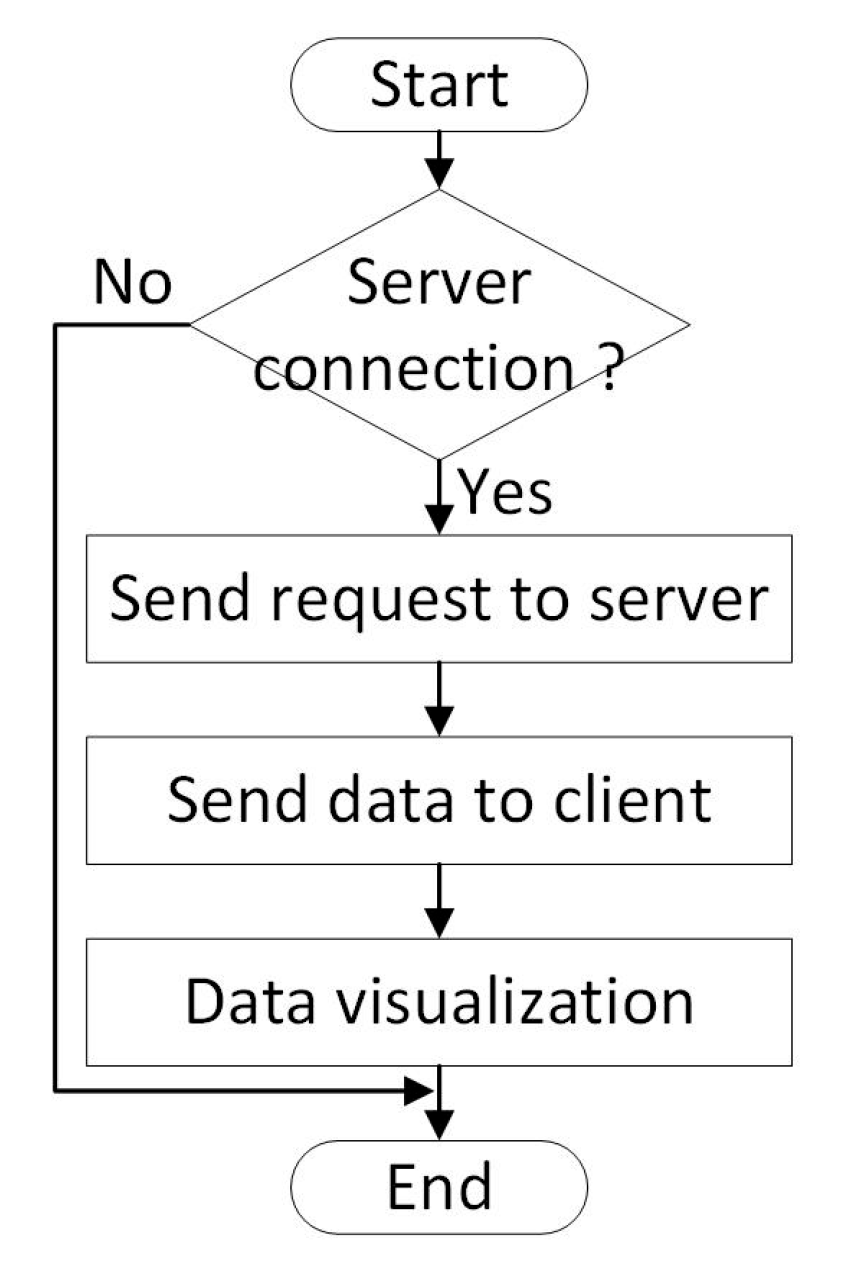
- Server and database—the server has two functionalities. One is to receive measured data from ESP 2866 and store them in a database. The other functionality is to receive requests from the client application and send the data;
- -
- Client computer—a specially developed WEB-based application is installed on it, which visualizes the measured values. This application sends requests to the server, receives the measurement data in response, and visualizes them.
3. System Design
3.1. Hardware Staging
- Wi-Fi Board (ESP8266 or ESP32);
- BME280—sensor for measuring three types of quantities: Temperature, Humidity, and Pressure;
- Breadboard basic construction for electronic prototypes;
- Power supply battery—9800 mAh 3.7 V;
- Power supply battery slot;
- Connecting the two components.

3.2. Software Implementation
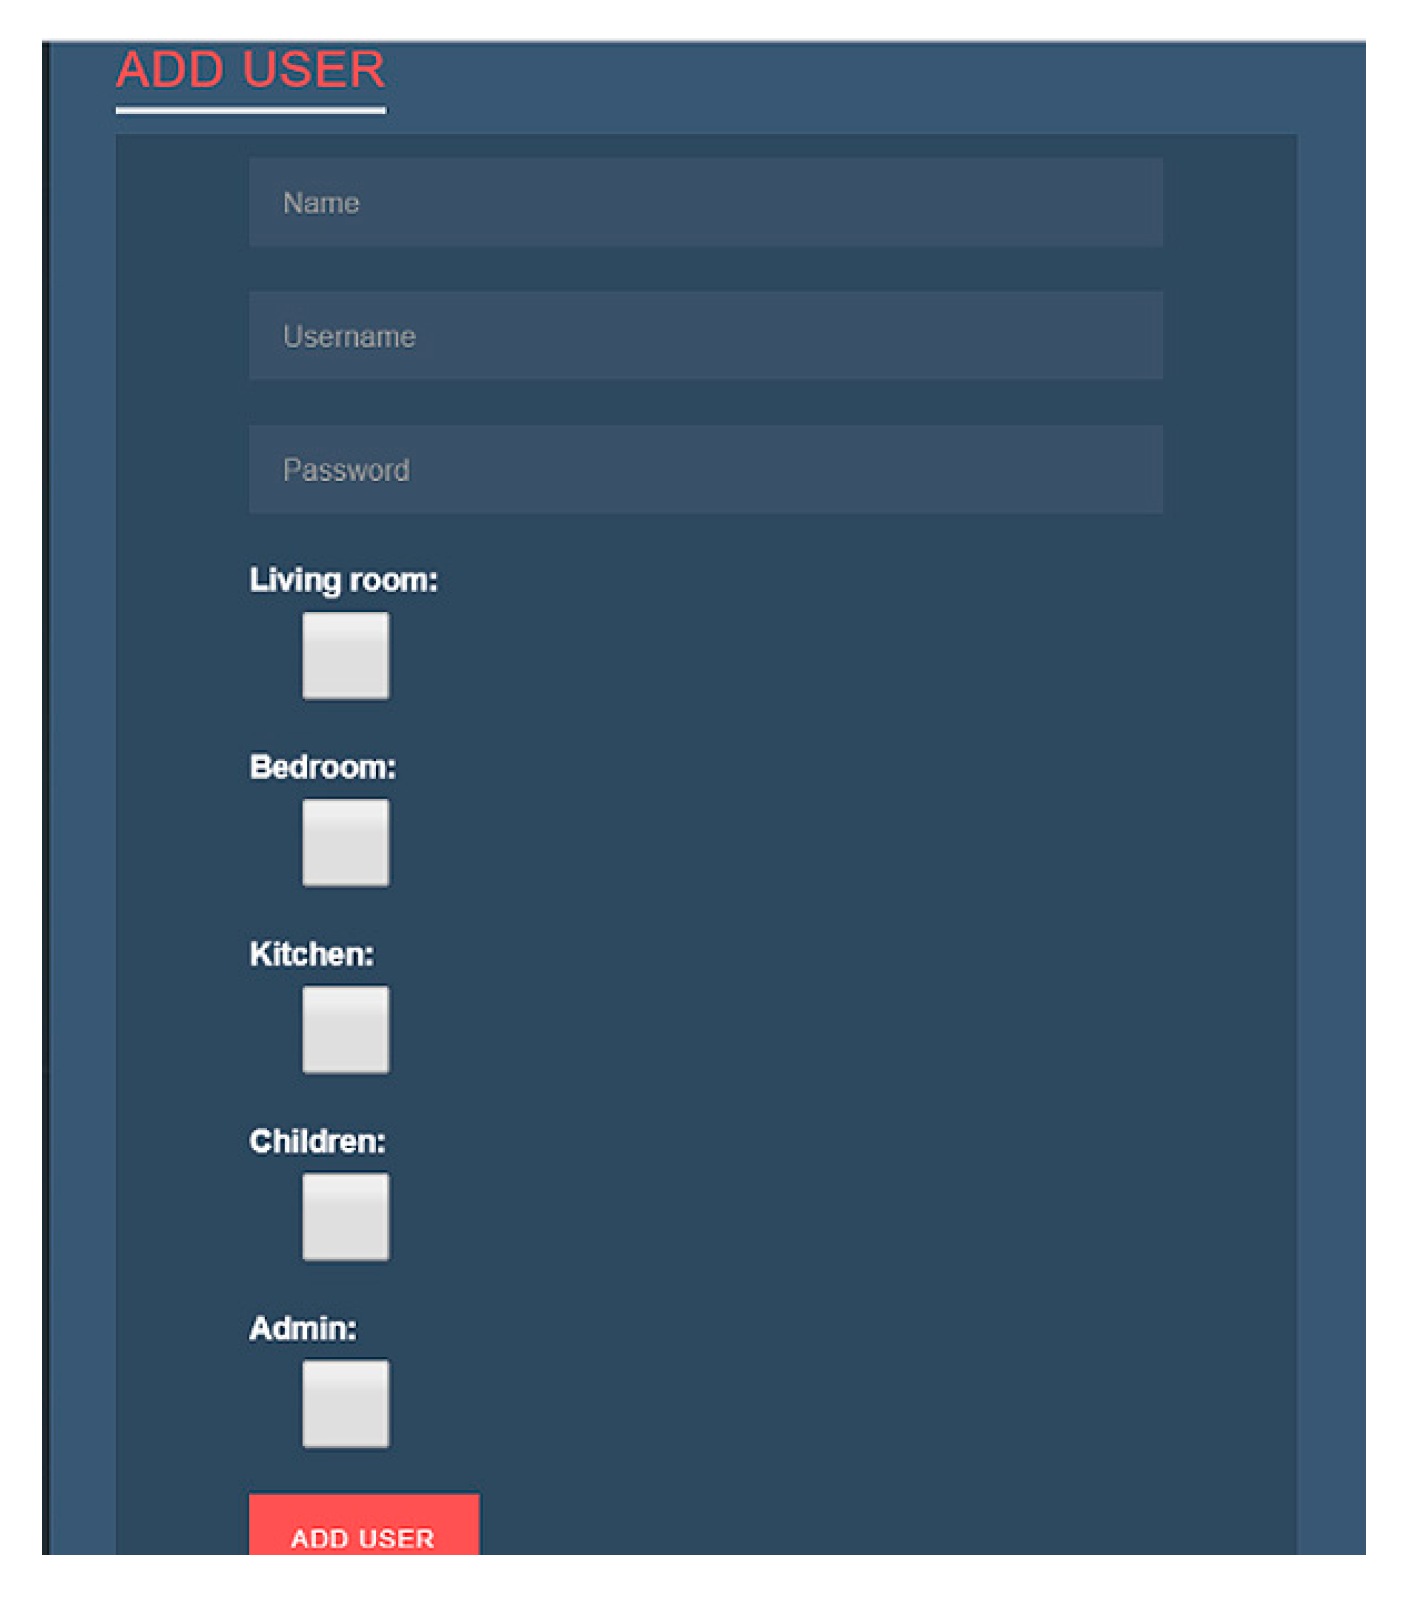
- Administrator—Anyone with this role can see all rooms and measured parameter values and create/change/delete new and current users;
- User—depending on what rights are granted to him by the Administrator, the user can see data for certain rooms (some of them, all rooms, or only one room);
- The database consists of five tables shown in Figure 6.
- Users table—the table contains all users registered in the system with their respective rights in it;
- The room table contains information about the premises/rooms;
- The temperature table contains information about the temperature in a specific room;
- The humidity table contains information about the humidity in a specific room;
- The pressure table contains information about the pressure in a specific room.
- On the Y axis, data is displayed showing the day when the temperature was measured. The data is displayed in the following format: YYYY-MM-DD;
- On the X axis, the measured temperature values are displayed with an accuracy of 1 tenth.
- view data for specific rooms;
- view data for one or more rooms (Figure 9).
4. Experimental Results
4.1. Checking the Sensor’s Battery Life
4.1.1. Test Scenario Steps
- Connect the device to the portable battery connector;
- Place the device in a location distant from any electrical appliances;
- Set it to read temperature, pressure, and humidity every four hours;
- Turn on the device.
4.1.2. Expected Result
4.1.3. Result Obtained
4.2. Checking Reported Data for a Different Time Period
4.2.1. Test Scenario Steps
- Connect the device to the battery slot;
- Position the apparatus in a location distant from any electronic equipment;
- Set it to read temperature, pressure, and humidity every four hours;
- Turn on the device;
- Wait seven days.
4.2.2. Expected Result
- The data in the application table for a given room should be displayed for the current day plus six days ago;
- The application graph for a given room should visualize the average temperature value for each day.
4.2.3. Result Obtained
4.3. Testing the Sensor to See if It Can Report Data at Certain Times
4.3.1. Test Scenario Steps
- Connect the device to the battery slot;
- Position the apparatus in a location distant from any electronic equipment;
- Set it to read temperature, pressure, and humidity for different hours;
- Turn on the device
4.3.2. Expected Result
4.3.3. Result Obtained
4.4. Testing the Application with No Data Received
4.4.1. Test Scenario Steps
- Connect the device to the battery slot;
- Position the apparatus in a location distant from any electronic equipment;
- Set it to read temperature, pressure, and humidity for different hours;
- Set the device to read data for a specific room.
4.4.2. Expected Result
- The data results should not be visualized for rooms that are not mentioned;
- The data should be visualized only for the given target room;
- The tabular view for the remaining three rooms in the application should only say that there is no data.
4.4.3. Result Obtained
4.5. Checking the Application When More than Four Measurements Are Received per Day
4.5.1. Test Scenario Steps
- Connecting the device to the battery slot;
- Placing the device in a place away from any electrical appliances;
- Setting it to read temperature, pressure, and humidity every three hours;
- Setting the device to read data for a specific room.
4.5.2. Expected Result
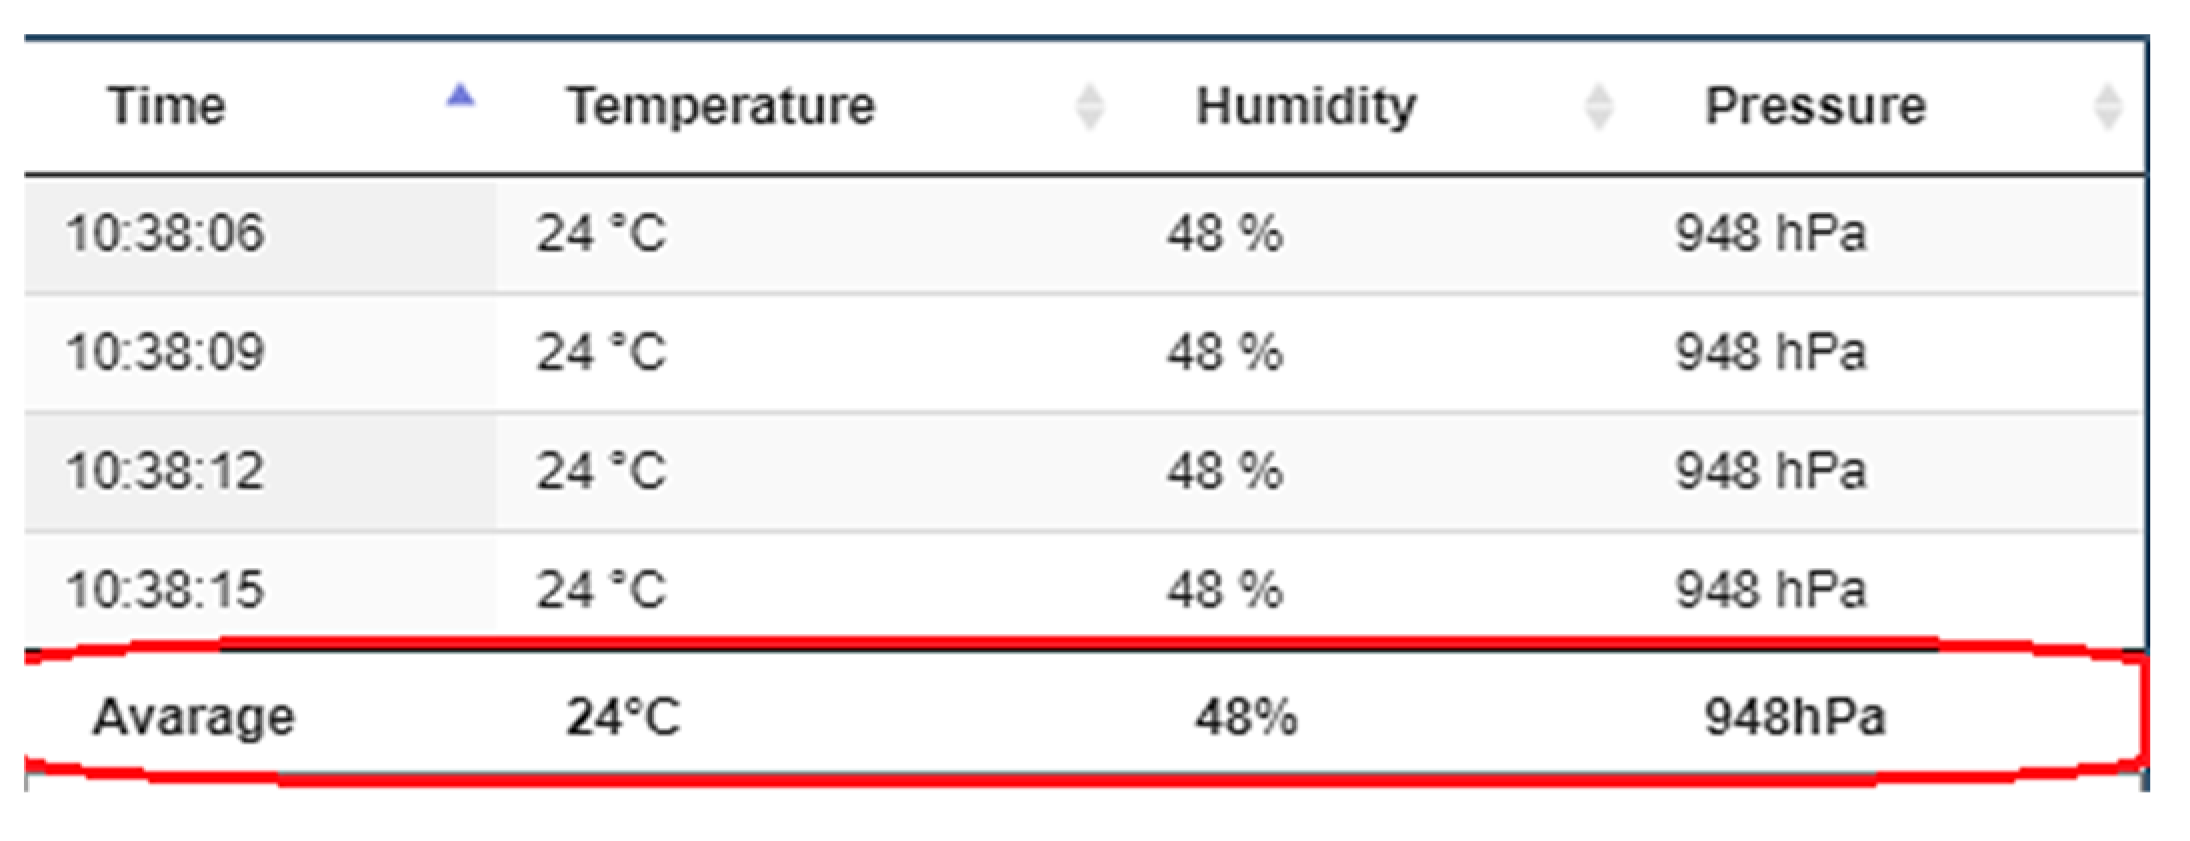
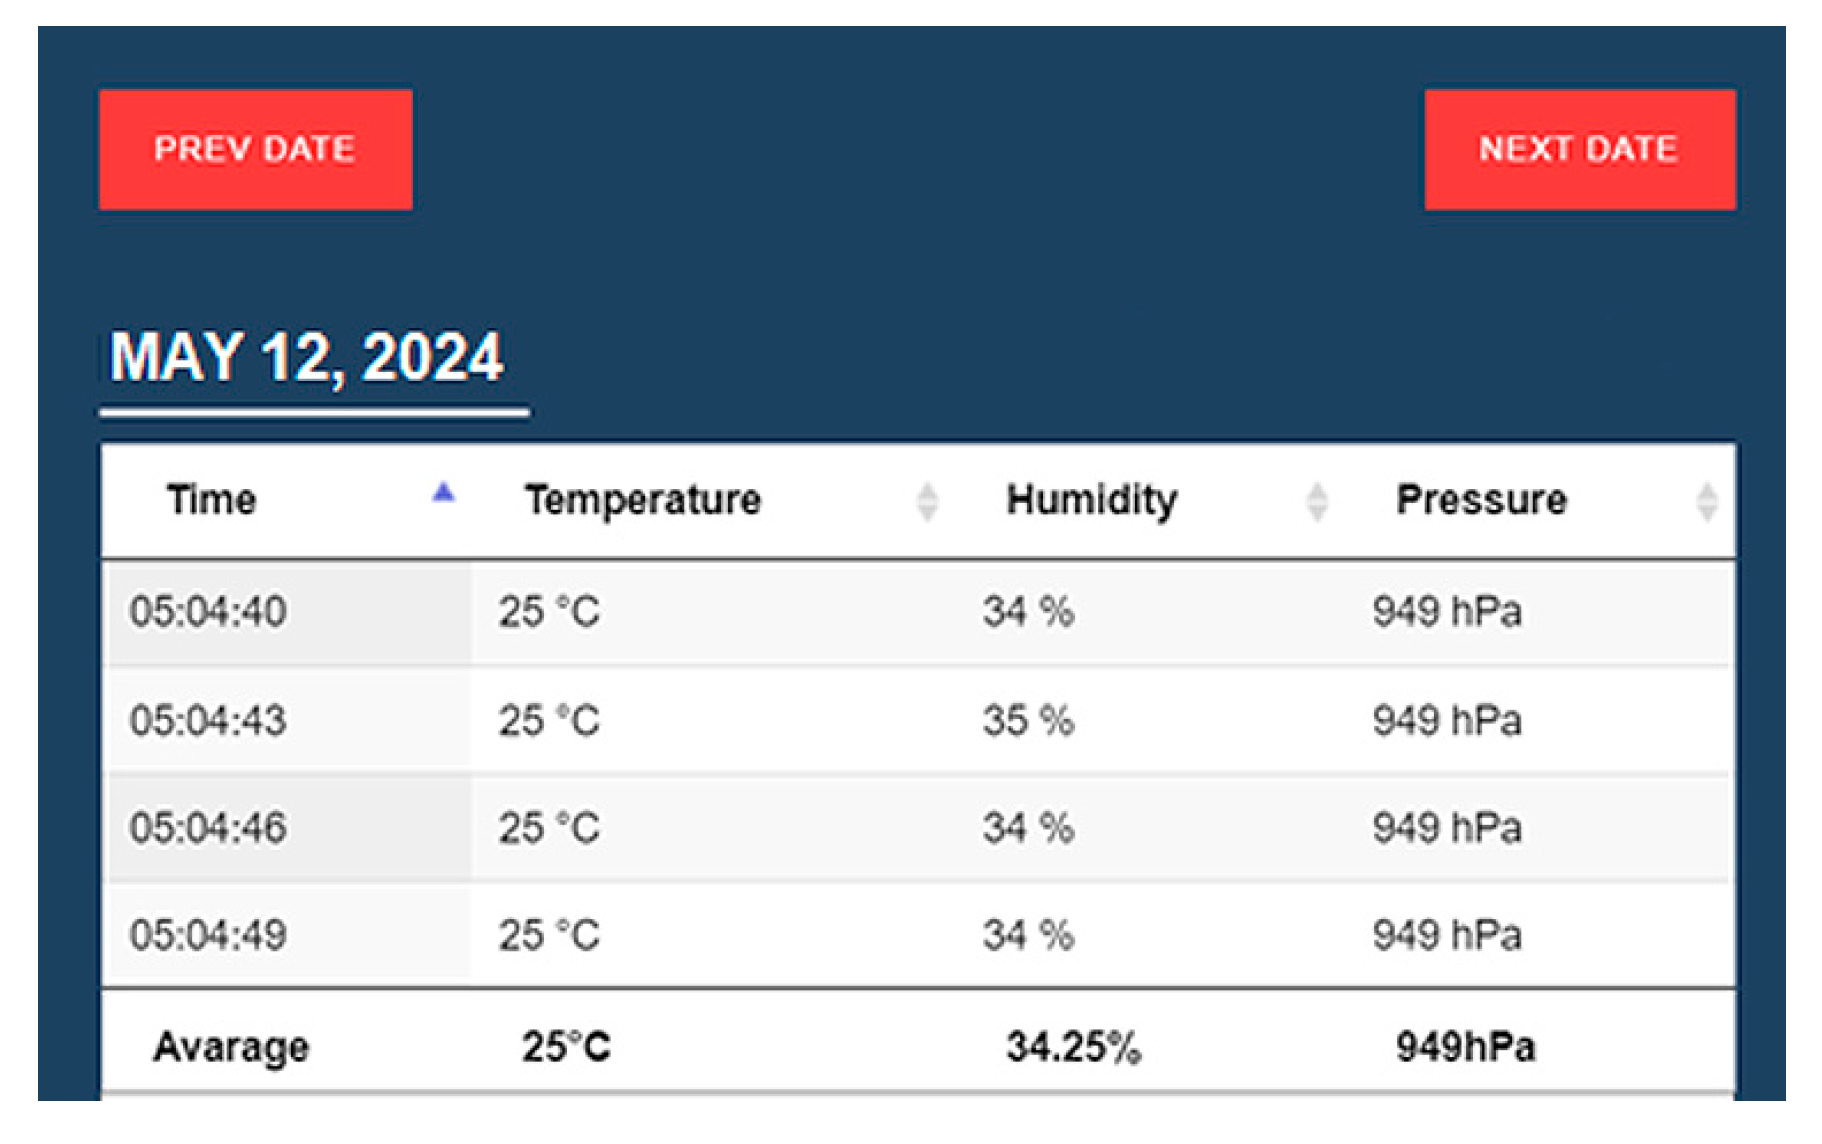
- The data in the application table will visualize the first four measurements for the day;
- The mean calculation will represent the initial quartet of recorded data points.
4.5.3. Result Obtained
- The application data visualizes the first four measurements;
- The average value is from all measurements for the day.
4.6. Testing the Device for Operation at Sub-Zero Temperatures
4.6.1. Test Scenario Steps
- Connecting the device to the battery slot;
- Placing the device in the refrigerator compartment with the door slightly ajar;
- Device operation time—1 h;
- Setting it to read temperature, pressure, and humidity every five minutes for one hour;
- Setting the device to read data for a specific room.
4.6.2. Expected Result
4.6.3. Result Obtained
4.7. Testing Two or More Devices to Send Data Simultaneously for the Same Room
4.7.1. Test Scenario Steps
- Connect the devices to the battery slot;
- Place the devices in a place away from any electrical appliances;
- Set them to read temperature, pressure, and humidity every four hours;
- Set the devices to read data for a specific room.
4.7.2. Expected Result
- The data in the application table will display the first four measurements of the day;
- The average value will be that of the first four measurements.
4.7.3. Result Obtained
- The application data displays the first four measurements (Figure 13);
- The average value is from all measurements for the day.
4.8. Testing When the Power Supply to the Device Is Suddenly Stopped
4.8.1. Test Scenario Steps
- Connecting the device to the battery slot;
- Placing the device in a place away from any electrical appliances;
- Setting it to read temperature, pressure, and humidity for different hours;
- Setting the device to read data for a specific room;
- After the first result, the device is stopped.
4.8.2. Expected Result
4.8.3. Result Obtained
5. Conclusions
Author Contributions
Funding
Institutional Review Board Statement
Informed Consent Statement
Data Availability Statement
Conflicts of Interest
References
- Arcenal, K.V.R.; Carmen, M.S.; Garcia, R.G. Effects of Low Humidity and High Humidity on the Nasal Area of the People. In Proceedings of the 2023 IEEE IAS Global Conference on Emerging Technologies (GlobConET), London, UK, 19–21 May 2023; pp. 1–6. [Google Scholar] [CrossRef]
- Debele, G.M.; Qian, X. Automatic Room Temperature Control System Using Arduino UNO R3 and DHT11 Sensor. In Proceedings of the 2020 17th International Computer Conference on Wavelet Active Media Technology and Information Processing (ICCWAMTIP), Chengdu, China, 18–20 December 2020; pp. 428–432. [Google Scholar] [CrossRef]
- Kumaran, M.; Vikram, I.; Kishore Kumar, S.; Rajesh Kumar, R.; Lokesh, S. Design of An Automatic Fan Speed Controlling System Using Arduino UNO. Int. J. Intellect. Adv. Res. Eng. Comput. 2018, 6, 2039–2042. [Google Scholar]
- Kaushik, S.; Chouhan, Y.S.; Sharma, N.; Singh, S. Automatic Fan Speed Control using Temperature and Humidity Sensor and Arduino. Int. J. Adv. Res. Ideas Innov. Technol. 2018, 2, 8. [Google Scholar]
- Siddika, A.; Nasrin, S.F. Design and Arduino-based Automatic Fan Control System Using PIR Sensor and LM35 Sensor. GSJ 2018, 6, 8. [Google Scholar]
- Zungeru, A.M.; Mangwala, M.; Chuma, J.; Gaebolae, B.; Basutli, B. Design and simulation of an automatic room heater control system. Heliyon 2018, 4, e00655. [Google Scholar] [CrossRef] [PubMed]
- N, Y.k.; A, O.K.; Abdulhameed, Z.N. Design and Implement a Wireless Temperature Monitoring System using Noncontact IR Sensor Based on Arduino. In Proceedings of the 2023 IEEE International Conference on ICT in Business Industry & Government (ICTBIG), Indore, India, 8–9 December 2023; pp. 1–5. [Google Scholar] [CrossRef]
- Nanthini, N.; A, S.; K, S.S.; C, S.; S, S. Arduino Powered Smart Weather Monitoring System. In Proceedings of the 2021 Second International Conference on Electronics and Sustainable Communication Systems (ICESC), Coimbatore, India, 4–6 August 2021; pp. 229–235. [Google Scholar] [CrossRef]
- Roy, A.; Das, P.; Das, R. Temperature and humidity monitoring system for storage rooms of industries. In Proceedings of the 2017 International Conference on Computing and Communication Technologies for Smart Nation (IC3TSN), Gurgaon, India, 12–14 October 2017; pp. 99–103. [Google Scholar] [CrossRef]
- Sharmin, F.; Moon, N.N.; Saifuzzaman, M.; Hasan, A.; Hossain, M.A.; Nur, F.N. Humidity Based Automated Room Temperature Controller Using IoT. In Proceedings of the 2019 Third International conference on I-SMAC (IoT in Social, Mobile, Analytics and Cloud) (I-SMAC), Palladam, India, 12–14 December 2019; pp. 226–231. [Google Scholar] [CrossRef]
- San, M.M.; Win, C.K.; Mon, K.Z. Design and Simulation of Fan Speed Control using Arduino UNO and LM35DZ. Int. J. Eng. Res. Adv. Technol. (IJERAT) 2020, 6, 6. [Google Scholar] [CrossRef]






Disclaimer/Publisher’s Note: The statements, opinions and data contained in all publications are solely those of the individual author(s) and contributor(s) and not of MDPI and/or the editor(s). MDPI and/or the editor(s) disclaim responsibility for any injury to people or property resulting from any ideas, methods, instructions or products referred to in the content. |
© 2025 by the authors. Licensee MDPI, Basel, Switzerland. This article is an open access article distributed under the terms and conditions of the Creative Commons Attribution (CC BY) license (https://creativecommons.org/licenses/by/4.0/).
Share and Cite
Spasova, G.; Boychev, I. Designing a Remote Room Monitoring System with Arduino and BME280 Sensor. Eng. Proc. 2025, 104, 52. https://doi.org/10.3390/engproc2025104052
Spasova G, Boychev I. Designing a Remote Room Monitoring System with Arduino and BME280 Sensor. Engineering Proceedings. 2025; 104(1):52. https://doi.org/10.3390/engproc2025104052
Chicago/Turabian StyleSpasova, Gergana, and Iliyan Boychev. 2025. "Designing a Remote Room Monitoring System with Arduino and BME280 Sensor" Engineering Proceedings 104, no. 1: 52. https://doi.org/10.3390/engproc2025104052
APA StyleSpasova, G., & Boychev, I. (2025). Designing a Remote Room Monitoring System with Arduino and BME280 Sensor. Engineering Proceedings, 104(1), 52. https://doi.org/10.3390/engproc2025104052


