Proceeding Paper

Analysis of Loss Functions for Colorectal Polyp Segmentation Under Class Imbalance †

1
School of Information Technology and Engineering, Kazakh-British Technical University, Almaty 050000, Kazakhstan
2
Department of Transportation System Engineering, Korea National University of Transportation, Uiwang-Si 27469, Republic of Korea
3
Department of Telecommunication, University of Ruse, Ruse 7004, Bulgaria
*
Author to whom correspondence should be addressed.
Presented at the International Conference on Electronics, Engineering Physics and Earth Science (EEPES 2025), Alexandroupolis, Greece, 18–20 June 2025.
Eng. Proc. 2025, 104(1), 17; https://doi.org/10.3390/engproc2025104017
Published: 25 August 2025

Abstract

Class imbalance is a persistent limitation in polyp segmentation, commonly resulting in biased predictions and reduced accuracy in identifying clinically relevant structures. This study systematically evaluated 12 loss functions, including standard, weighted, and compound formulas, applied to colon polyp segmentation using the UNet-VGG16 fixed architecture on the Kvasir-SEG dataset. The encoder was frozen to isolate the effect of loss functions under the same training conditions. A fixed random seed was used in all experiments to ensure reproducibility and control variance during training. The results reveal that the combined loss functions, namely WBCE combined with Dice and Tversky combined with Focal, achieved the top Dice scores of 0.8916 and 0.8917, respectively. Tversky plus Focal also provided the highest sensitivity of 0.8885, and WBCE obtained the best average IoU of 0.8120. Tversky loss showed the lowest error rate of 4.99, indicating stable optimization. These results clarify the influence of loss function selection on segmentation performance in scenarios characterized by considerable class imbalance.

1. Introduction

Artificial intelligence (AI) has become increasingly prominent as an effective means for alleviating diagnostic burden through advanced segmentation techniques in medical imaging, especially with the growing burden on healthcare systems [1]. Medical image segmentation represents a crucial computer vision task aimed at automatically distinguishing anatomical and pathological patterns from images [2]. Through advances in computation vision and deep learning (DL) technologies, polyp segmentation has gained attention as a pivotal area of research [3]. However, due to a number of issues inherent in medical data, accurate segmentation remains a challenge despite the continued progress of DL models. The main issue is class imbalance, where the foreground region covers a tiny fraction of the overall image [4]. This challenge is particularly evident in the segmentation of colonic polyps, where the morphologic variability of polyps, including differences in shape, size, and texture, combined with limited visibility on endoscopic images, makes them difficult to identify [5]. The similar issue arises in the segmentation of pulmonary nodules when nodules constitute only a small fraction of the total CT volume, resulting in an imbalance in the distribution of positive and negative samples [6]. Segmentation of COVID-19-affected lung lesions faces similar challenges, as infected areas are often characterized by heterogeneous texture, indistinct boundaries, and considerable variability in shape and dimension [7]. Recently, deep learning techniques have started to play an important role in solving these segmentation problems by efficiently extracting features from medical images. Fully convolutional networks (FCNs) [8] UNet [9] and SegNet [10], commonly applied in semantic medical segmentation tasks, have shown a competitive performance [11]. However, a key challenge in training these models remains the large class imbalance [12]. In many medical imaging tasks, foreground structures of interest are often less than 3–10% of the whole image pixel count. To overcome this problem, loss functions serve as a fundamental component in training DL models for segmentation [13]. In particular, they can be modified to penalize the misclassification of underrepresented classes more strongly, thereby guiding the model to better train on rare but clinically important foreground regions. The performance of automatic segmentation under class imbalance depends on the loss function [14], which determines the optimization objective and gradient distribution. The authors of [15] proposed a lightweight DL model based on MobileNetV3 and DeepLabV3+ for the segmentation of colorectal polyps, their study aimed at optimizing the model architecture. In [16], a transformer-based model was proposed for segmenting colon polyps using a hybrid loss function combining the Tversky focal function, binary cross-entropy and Jaccard index, and the method obtained a Dice score of 0.9048. Standard loss functions often favor the majority of classes, reducing accuracy in minority regions. To address this challenge, weighting factors are used in modified functions [17]. However, comparative analyses of loss functions under class imbalance remain limited in current studies.
This research conducts a controlled comparison of 12 loss functions using a fixed model and sequential random sampling to evaluate their performance in segmentation problems with imbalance.

2. Materials and Methods

The study used the Kvasir-SEG dataset [18] consisting of 1000 endoscopic colorectal images with polyp masks standardized to 256 × 256 pixels. To expand the data set to 1500 images, augmentation method was applied [19]. A key challenge was the large variability in polyp size of around 3–11% of the image area, creating a class imbalance. A fixed random seed was applied to all stochastic components of the experimental process [20], including augmentation operations, data partitioning, and initialization of model parameters.
The model in this study, UNet-VGG16, employs a UNet architecture with a pre-trained VGG16 encoder [21] that is fixed during training for hierarchical feature representation. The encoder consists of successive convolutional layers with increasing depth [22].
Binary cross-entropy loss (BCE) determines the negative logarithmic probability of the true class over the predicted probability distribution [23].
l B C E = 1 N i = 1 N [ y i log p i + ( 1 y i ) log ( 1 p i ) ]
Weighted binary cross entropy (WBCE) modifies the standard BCE by introducing a class-dependent weighting factor [24]. It increases the contribution of the minority class to the loss function.
l W B C E = 1 N j = 1 N [ w y i log p i + ( 1 w ) · ( 1 y i ) log ( 1 p i ) ]
In (2), w ∈ [0, 1] serves as a weighting factor amplifying the contribution of the positive class. This formulation penalizes errors on underrepresented regions more heavily [25].
l ( p , y ) = log ( p ) i f   y = 1 log ( 1 p ) i f   y = 0
A generalized form using the probability associated with the correct class is introduced in (4):
p t = p i f   y = 1 1 p i f   y = 0
In focal loss, a modulating factor is applied ( 1 p t ) γ to reduce the losses attributed to highly classified samples:
l f o c a l = α ( 1 p t ) γ · log ( p t )
In (5), α 1 , 0 serves as a scaling factor to account for differences in class distribution, while γ 0 regulates the intensity of loss suppression from correctly predicted instances.
Tversky loss is a generalization of Dice by incorporating asymmetric weights for false positives and false negatives [26], which allows for flexibility in managing the accuracy-recall trade-off in unbalanced segmentation tasks.
Surface loss [27] is a boundary loss function bounded by the interval [0, 1] that is computed using precomputed class weights to account for imbalance and does not change the optimization problem at the batch level. It is based on the distance to the object edge.
l S u r f a c e = 1 c = 1 C w c n = 1 N d n ( c ) ( 1 t n ( c ) + p n ( c ) ) 2 c = 1 C w n = 1 N ( d n ( c ) ) 2 ,
where C refers to the number of classes, N is the total number of spatial elements, the coefficient w c is the weight assigned to class c, d n ( c ) denotes the boundary distance [28] from pixel n to the class c, the term t n ( c ) represent the binary ground truth label, and p n ( c ) is the model prediction.
Mean squared error (MSE) [29] loss for segmentation quantifies variations across pixels by penalizing the mean square of the residuals between the estimated results and the corresponding reference annotations across all of the categories. In segmentation tasks with class imbalance, it enables equal contribution from all classes by updating predictions for both true and false classes.
l M S E = 1 2 N n = 1 N c = 1 C ( p n ( c ) t n ( c ) ) 2 ,
where N denotes the cardinality of the pixel space, C equals the total number of semantic classes, and p n ( c ) represents the model-assigned probability that a pixel n and belongs to the class c, t n ( c ) .
Mean absolute error (MAE) [30] loss quantifies the average magnitude of residuals between the predicted outputs and target values.
l M A E = 1 N n = 1 N c = 1 C p n ( c ) t n ( c ) ,
where N denotes the cardinality of the pixel space, C equals the total number of semantic classes, and p n ( c ) represents the model-assigned probability that a pixel n and belongs to the class c, t n ( c ) .
Jaccard loss [31] estimates the discrepancy between the predicted results and reference masks through direct minimization of the discrepancy based on IoU.
l J a c c a r d = 1 n 1 N c = 1 C p n ( c ) t n ( c ) n = 1 N c = 1 C ( p n ( c ) + t n ( c ) p n ( c ) t n ( c ) ) ,
where N denotes the cardinality of the pixel space, C equals the total number of semantic classes, and p n ( c ) represents the model-assigned probability that a pixel n and belongs to the class c, t n ( c ) .
Dice loss is a region-based loss function [32] that measures the overlap between predicted and true segmentation masks.
l D i c e = 1 2 n = 1 N p n + n = 1 N t n + ε n = 1 N p n + n = 1 N t n + ε ,
where N denotes the cardinality of the pixel space, C equals the total number of semantic classes, and p n ( c ) represents the model-assigned probability that a pixel n and belongs to the class c, t n ( c ) .
Dice + BCE loss is a combined loss function that combines region-based and pixel-based supervision.
l D i c e B C E = α l B C E + ( 1 α ) l D i c e
WBCE + Dice loss addresses class imbalance by weighting pixel-wise binary cross-entropy and combining it with region-based Dice loss.
l W B C E + D i c e = α l W B C E + ( 1 α ) l D i c e
Tversky + Focal loss combines the Tversky index, which controls for false positives and false negatives, with Focal loss, which emphasizes hard samples.
l T v e r s k y + F o c a l = α l T v e r s k y + ( 1 α ) l F o c a l
Various measures, primarily classification accuracy and spatial correspondence were used to assess the effectiveness of the model. These include Dice score, mean IoU and accuracy. The Dice score metric estimates the spatial coverage overlap between predicted (P) and reference areas (G), giving an indication of segmentation consistency [33].
Mean IoU estimates the average overlap across all classes, offering a balanced metric.
M e a n   I O U = 1 N i = 1 N P i G i P i G i
Sensitivity, also known as recall, determines the model capacity to distinguish the relevant class [34]. Accuracy measures the proportion of correctly classified pixels relative to the total number of pixels [35,36].
The experiments were run on an A100 GPU (40 GB) with Python 3.10 and TensorFlow 2.13.

3. Results

The quantitative analysis presented in Table 1 demonstrates the comparative effectiveness of 12 different loss functions evaluated on a validation subset of 150 images.
In terms of accuracy, WBCE and WBCE + Dice showed the highest value of 0.9557, which is an increase of 0.04 % compared to BCE at 0.9553. This minor improvement is due to the class weighting mechanism in WBCE. For the Dice coefficient, the combined Tversky + Focal and WBCE + Dice losses attained values of 0.8917 and 0.8916, respectively. These results are 0.39 and 0.38 % higher than the BCE and 0.34 and 0.33 % higher than the standard Dice losses. In terms of mean IOU, WBCE performed the highest at 0.8120, which is 0.16% higher than BCE at 0.8104 and 1.67% higher than MAE at 0.7953. MAE and MSE equally accounted for pixel-by-pixel deviations, without considering the class distribution. The highest sensitivity was observed for Tversky + Focal at 0.8885. This corresponds to an increase of 3.09% over Dice at 0.8466 and 1.18% over BCE at 0.8576. The improvement in sensitivity is explained by the parameters α and β of the Tversky index, which control the compromise between false-positive and false-negative results. The error comparisons for each loss function are summarized below in Table 2, including validation loss values, absolute differences, and relative error rates.
As shown in Table 2, BCE produced the highest validation loss of 0.2020 and an error ratio of 23.65, indicating overfitting and limited generalization. WBCE reduced the validation loss by 50.9% and the error ratio by 7.08 points, demonstrating the advantage of class overfitting. Tversky achieved a lower validation loss of 0.1093 and the lowest error ratio among single losses, 4.99, reflecting stable learning under class imbalance. The surface yielded a validation loss of 0.0381 and an error ratio of 7.36. MSE and MAE resulted in low validation losses of 0.0312 and 0.0388, with error rates of 13.69 and 5.67, respectively. These values indicate good convergence, but limited structural representation. The validation loss by Jaccard’s criterion reached 0.1798, with an error rate of 3.23. Focal loss produced the lowest validation loss of 0.0147, but the highest error ratio of 24.77, suggesting sensitivity to complex samples and potential instability. Dice and Dice + BCE showed validation losses of 0.1105 and 0.1385, with error ratios of 6.67 and 11.64, respectively, suggesting a balance between regional and pixel-by-pixel learning. The combined Tversky + Focal loss provided 0.1281 validation loss and an error rate of 15.97, improving the stability performance over BCE-based losses.
Training time, average epoch duration, and frames per second (FPS) are provided in Table 3.
Tversky showed the lowest training time of 523.97 s, followed by WBCE, MSE, and Focal at around 524 s. These features also showed high FPS values, with Tversky’s reaching 154.59, indicating the efficiency of executing a single frame. The longest training time was recorded for Surface at 559.32 s, the epoch duration was 11.19 s, and the lowest FPS was 144.82. The training time of Jaccard and Dice + BCE functions also exceeded 547 s, indicating a higher computational load, probably due to their structural operations over the prediction and truth regions. Combined loss functions such as WBCE + Dice and Tversky + Focal showed moderate training times of 535.44 and 542.83 s, with FPS values of 151.28 and 149.22, respectively.
The validation results are plotted in Figure 1, allowing for a comparison of the stability of convergence under identical training conditions.
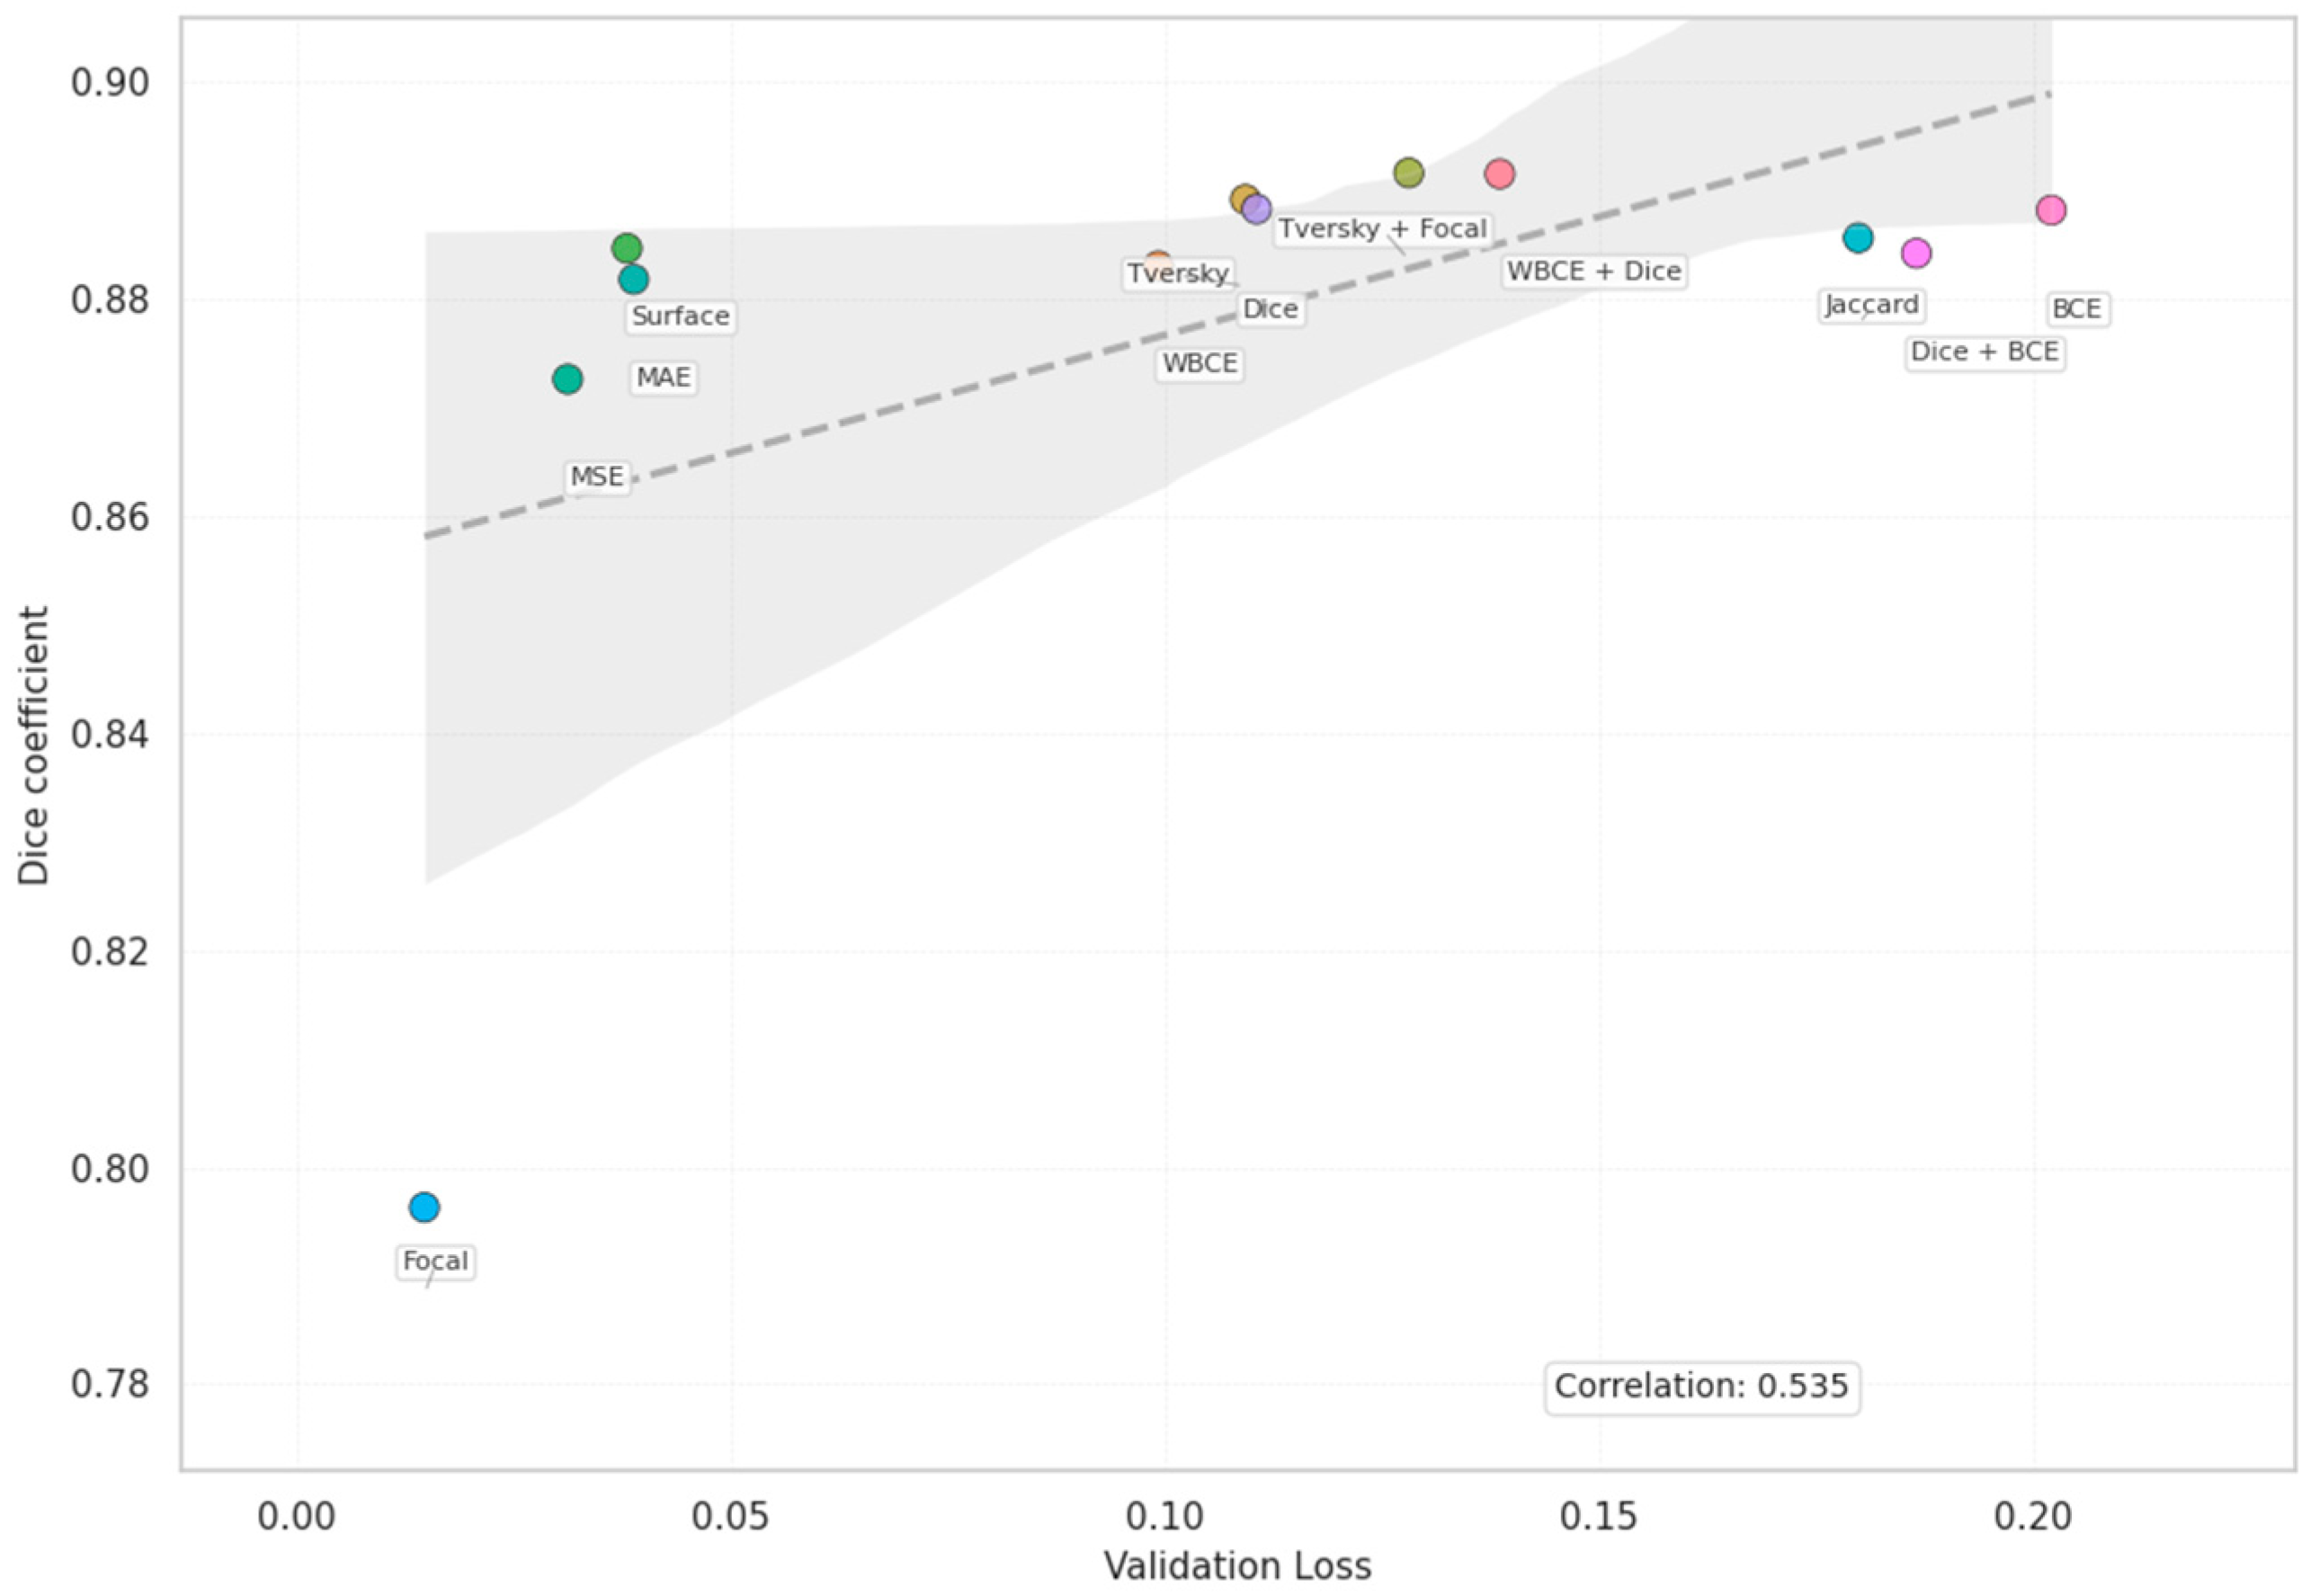
The diagram in Figure 1 illustrates that most loss functions achieve near-optimal validation performance within the first 15–20 epochs. However, notable fluctuations are observed in certain functions. There is a distinct peak in the Jaccard loss curve around epoch 30, accompanied by a temporary deterioration in the validation results for the other metrics. Likewise, Dice + BCE exhibits increased variability between epochs 25 and 35, especially in the sensitivity and Dice coefficient curves. In contrast, loss functions such as WBCE, Tversky, and WBCE + Dice maintain a consistent trajectory without sharp deviations after epoch 20. The relationship between the validation loss and Dice coefficient for all estimated loss functions is depicted in Figure 2.
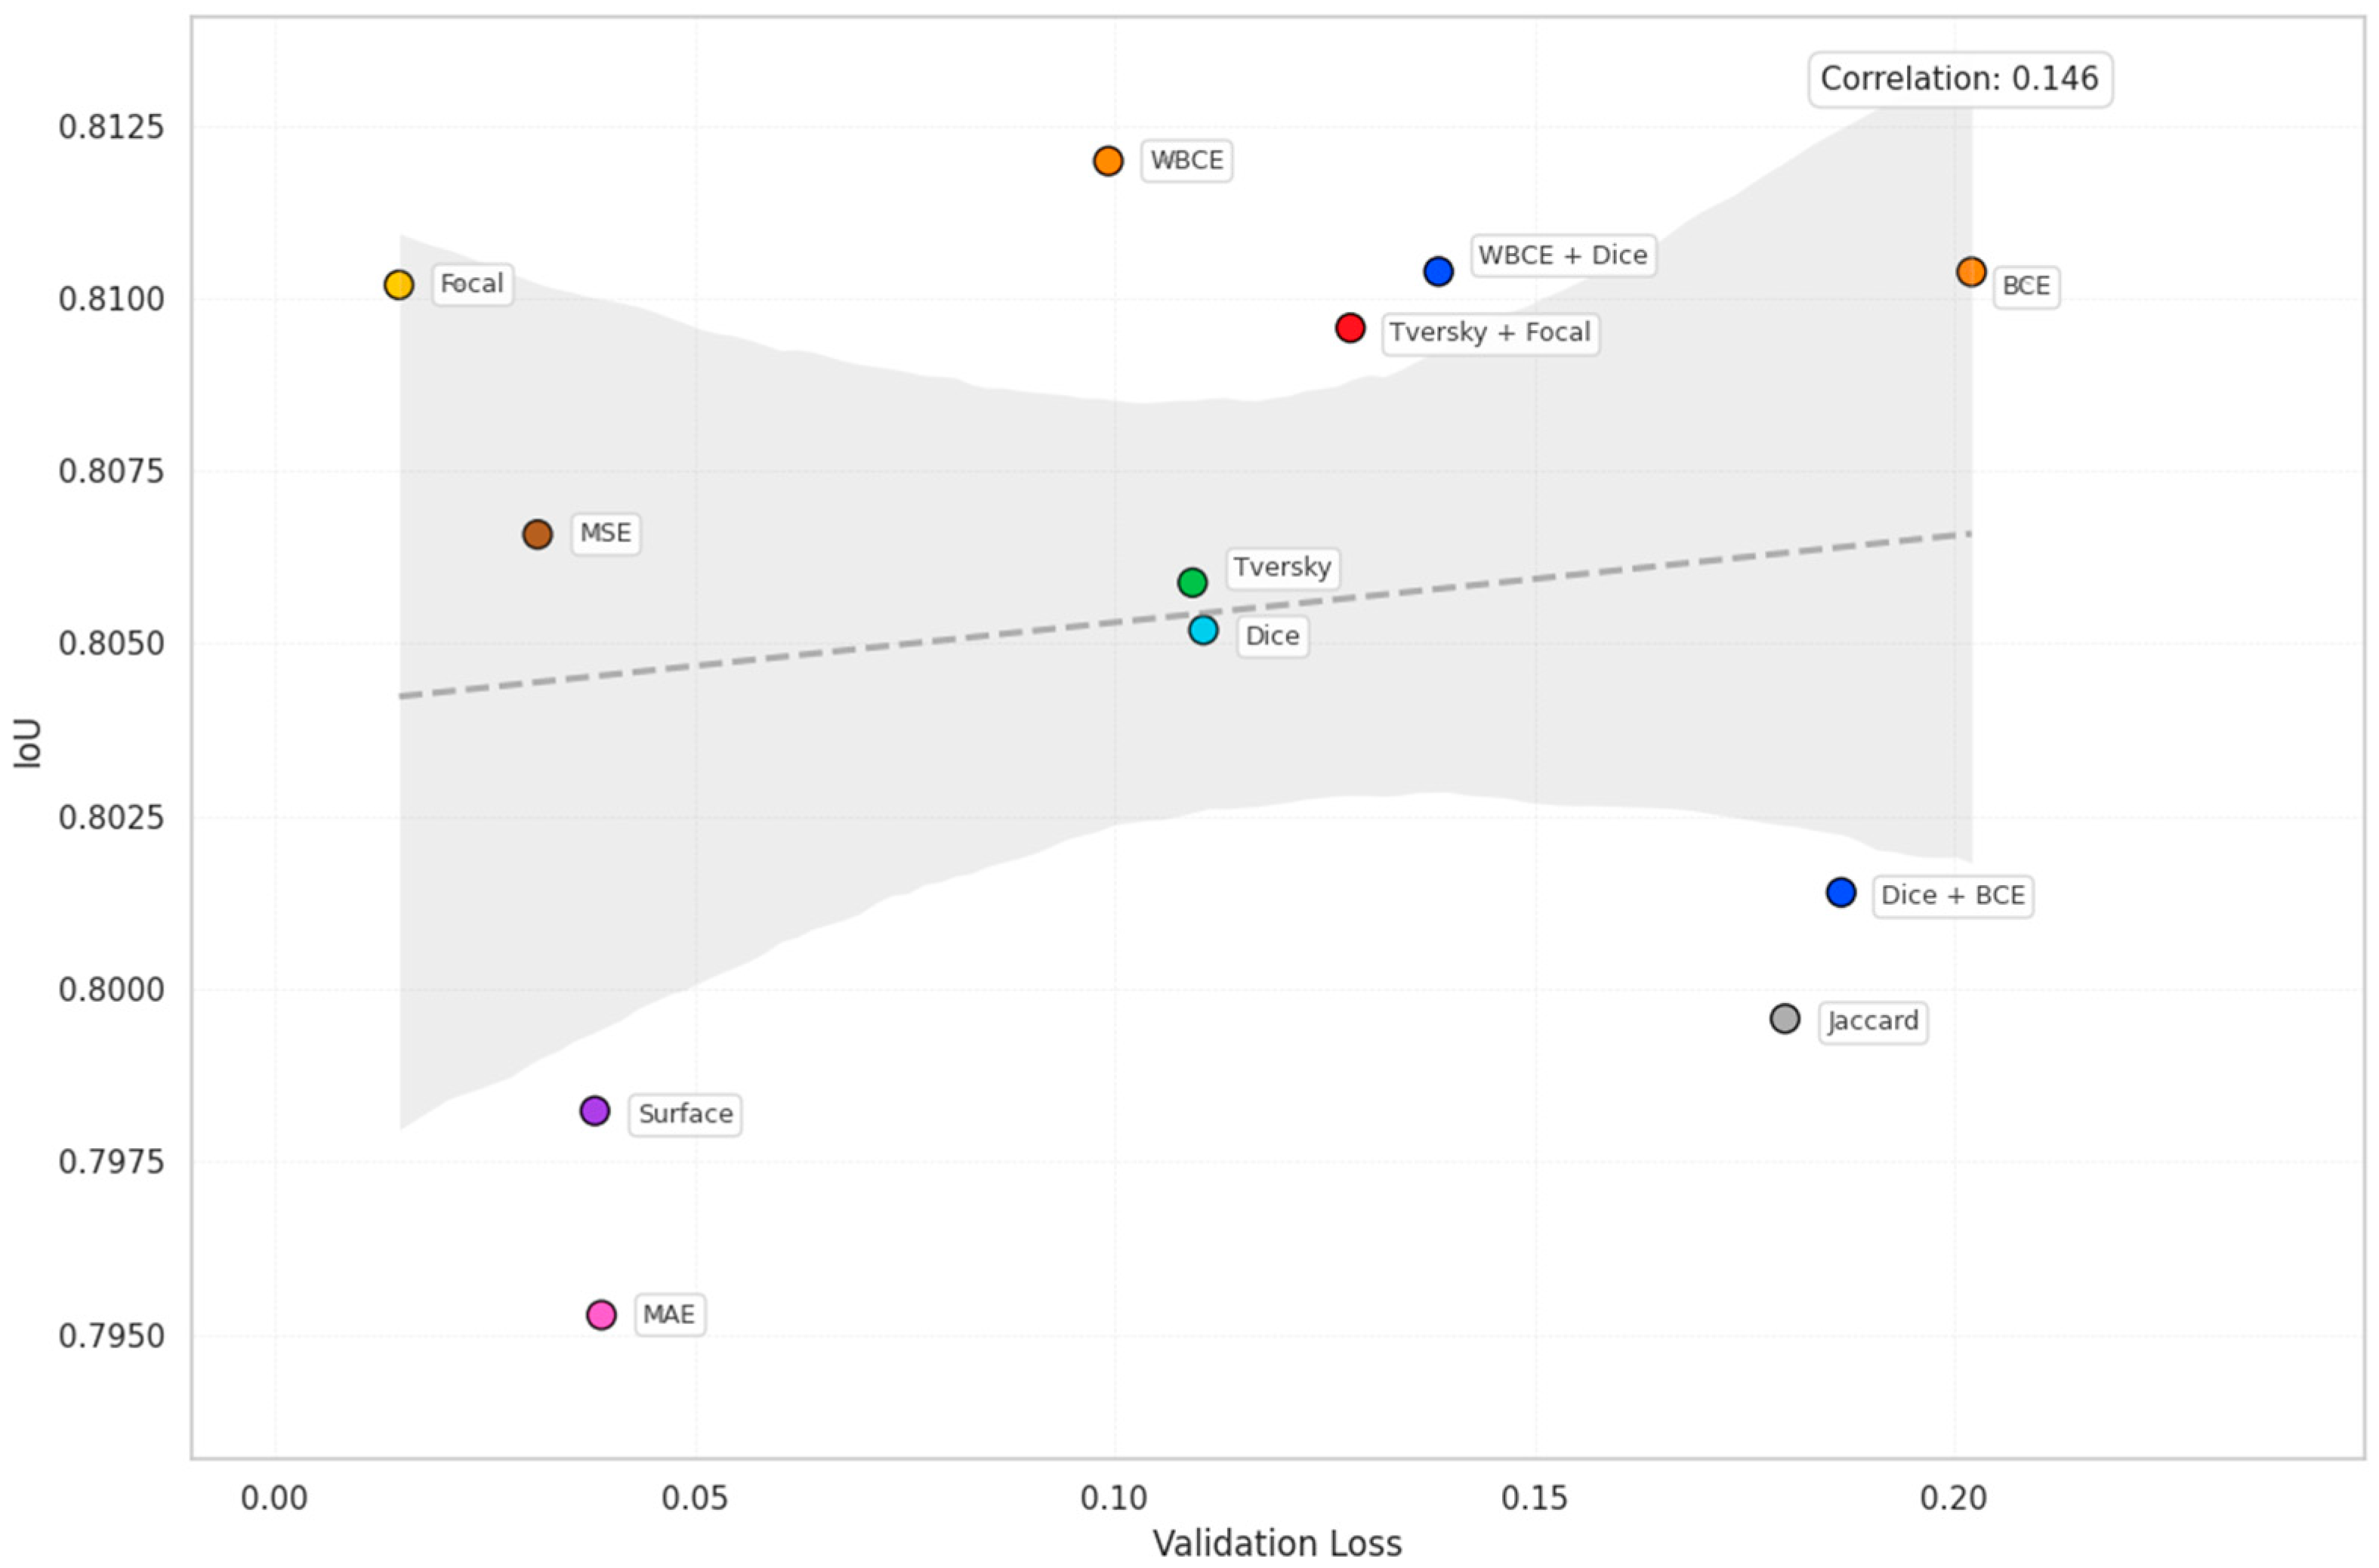
The chart in Figure 2 indicates a weak positive correlation between validation loss and Dice score with an estimated correlation coefficient of 0.32. Loss functions such as Tversky + Focal and WBCE + Dice achieve high Dice coefficient scores despite higher validation losses. In contrast, MAE, Surface, and MSE show low loss values, but moderate Dice results. Focal loss is considerably different, having the lowest loss and the lowest Dice coefficient score, confirming that loss mitigation does not directly lead to segmentation accuracy. The correlation between validation loss and IoU for the estimated loss functions is shown in Figure 3, providing a comparative analysis of segmentation consistency relative to error magnitude.
The diagram in Figure 3 demonstrates a weak positive correlation between validation loss and IoU, with an estimated correlation coefficient of 0.21. Loss functions such as WBCE, Focal, and WBCE + Dice achieve relatively high IoU values despite the differences in validation loss, indicating consistent segmentation at the region level. In contrast, MAE and Surface exhibit low validation losses, but the lowest IoU values.
The qualitative results in Figure 4 and Figure 5 illustrate the influence of different loss functions on the fixed model under conditions of class imbalance and structural similarity in polyp segmentation.
Most loss functions provide consistent localization, although there are slight differences in the accuracy of boundary detection and the number of false positives. Loss functions such as WBCE, Dice, WBCE + Dice and Tversky + Focal demonstrate more accurate localization. These features allow for better separation of the polyp from the mucosal background compared to the standard BCE or Focal.
Figure 5 provides a second sample of segmentation under severe class imbalance, illustrating how different loss functions cope with the complex morphology of polyps and their separation from surrounding tissues.
Figure 5 presents a second qualitative sample with a greater class imbalance compared to the first sample, with a smaller and less defined polyp area. Features such as Dice, Tversky, WBCE + Dice, and Tversky + Focal show relatively stable localization and shape preservation, although minor over-segmentation and imprecise boundaries are observed. In contrast, BCE, MSE, and Focal produce noticeable false positives and fragmentation. Compared to the first example in Figure 4, where most loss functions produced consistent predictions, this second case shows the limitations of some functions in scenarios with extreme foreground sparsity and morphological complexity.

4. Conclusions

Segmentation of polyp images commonly encounters the problem of class imbalance, where anatomically important foreground structures take up a minimal proportion of the image area compared to the background. This imbalance challenges the effectiveness of conventional loss functions that weight all pixel contributions uniformly and, hence, bias the model optimization towards majority classes. Addressing this, class-sensitive loss function formulas that incorporate weighting mechanisms have been developed to enhance the influence of underrepresented regions during training. In the present study, 12 loss functions, including standard, weighted, and composite variants, were rigorously evaluated under the UNet-VGG16 fixed architecture on the Kvasir-SEG dataset. Special attention has been paid to studying the interaction between pixel accuracy and region-level coherence under imbalanced conditions. Notably, WBCE introduces class-dependent modulation, and composite formulas such as WBCE plus Dice and Tversky plus Focal combine additional targets to refine the gradient behavior. Empirical results showed that Tversky plus Focal achieved the highest Dice coefficient of 0.8917 and sensitivity of 0.8885, while WBCE achieved the highest average IoU of 0.8120. Tversky losses showed excellent stability of the optimization with the lowest error rate of 4.99. However, the analysis was limited to the Kvasir-SEG dataset and the fixed UNet-VGG16 architecture with a frozen coder, which may limit generalizability. The impact of adaptive weighting and dynamic loss scheduling was not investigated. The study’s limitations include the use of a single, homogeneous set of endoscopic images and a fixed UNet VGG16 configuration with a frozen coder, which restricts the generalizability of the results to other imaging protocols and architectures. Additionally, the hyperparameters of the loss functions were not optimized through advanced search, and the evaluation was conducted without multi-round stratified testing or statistical testing of differences. Future work will involve using multicenter collections with different imaging conditions, implementing domain adaptation to remove bias in the distributions, and testing the same loss functions in hybrid convolutional models of varying depth.

Author Contributions

Conceptualization, D.K., A.M., J.W.K., T.I. and A.B.; methodology, D.K., A.M., J.W.K., T.I. and A.B.; software, D.K. and A.M.; validation, D.K., A.M., J.W.K., T.I. and A.B.; formal analysis, A.M. and D.K.; investigation, J.W.K., D.K. and A.M.; resources, J.W.K.; data duration, D.K. and A.M.; writing—original draft preparation, D.K. and A.M.; writing—review and editing, D.K. and A.M.; visualization, D.K. and A.M.; supervision, T.I.; project administration, T.I. and J.W.K. and A.B. All authors have read and agreed to the published version of the manuscript.

Funding

This work was supported by the Korea Institute for Advancement of Technology (KIAT) grant funded by the Korea Government (MOTIE) (RS-2022-KI002562, HRD Program for Industrial In-novation) and this research was supported by the Ministry of Trade, Industry and Energy (MOTIE) and the Korea Institute for Advancement of Technology (KIAT) through the “Support for Middle Market Enterprises and Regional innovation Alliances (RS-2025-02633071)” program.

Institutional Review Board Statement

Not applicable.

Informed Consent Statement

Not applicable.

Data Availability Statement

The raw data supporting the conclusions of this article will be made available by the authors upon request.

Conflicts of Interest

The authors declare no conflicts of interest.

References

  1. Khalifa, M.; Albadawy, M. AI in diagnostic imaging: Revolutionising accuracy and efficiency. Comput. Methods Programs Biomed. Update 2024, 5, 100146. [Google Scholar] [CrossRef]
  2. Birjais, R. Challenges and Future Directions for Segmentation of Medical Images Using Deep Learning Models. In Deep Learning Applications in Medical Image Segmentation: Overview, Approaches, and Challenges; Bhat, S.Y., Rehman, A., Abulaish, M., Eds.; John Wiley & Sons, Inc.: Hoboken, NJ, USA, 2025; pp. 243–264. [Google Scholar] [CrossRef]
  3. Wang, R.; Lei, T.; Cui, R.; Zhang, B.; Meng, H.; Nandi, A.K. Medical image segmentation using deep learning: A survey. IET Image Process. 2022, 16, 1243–1267. [Google Scholar] [CrossRef]
  4. Li, Z.; Kamnitsas, K.; Glocker, B. Analyzing overfitting under class imbalance in neural networks for image segmentation. IEEE Trans. Med. Imaging 2020, 40, 1065–1077. [Google Scholar] [CrossRef]
  5. Gupta, M.; Mishra, A. A systematic review of deep learning based image segmentation to detect polyp. Artif. Intell. Rev. 2024, 57, 7. [Google Scholar] [CrossRef]
  6. Yu, H.; Li, J.; Zhang, L.; Cao, Y.; Yu, X.; Sun, J. Design of lung nodules segmentation and recognition algorithm based on deep learning. BMC Bioinform. 2021, 22, 314. [Google Scholar] [CrossRef] [PubMed]
  7. Yin, S.; Deng, H.; Xu, Z.; Zhu, Q.; Cheng, J. SD-UNet: A Novel Segmentation Framework for CT Images of Lung Infections. Electronics 2022, 11, 130. [Google Scholar] [CrossRef]
  8. Shelhamer, E.; Long, J.; Darrell, T. Fully convolutional networks for semantic segmentation. IEEE Trans. Pattern Anal. Mach. Intell. 2016, 39, 640–651. [Google Scholar] [CrossRef]
  9. Ronneberger, O.; Fischer, P.; Brox, T. U-net: Convolutional networks for biomedical image segmentation. In Medical Image Computing and Computer-Assisted Intervention–MICCAI 2015, Proceedings of the 18th International Conference, Munich, Germany, 5–9 October 2015; Springer: Cham, Switzerland, 2015. [Google Scholar]
  10. Yao, W.; Bai, J.; Liao, W.; Chen, Y.; Liu, M.; Xie, Y. From CNN to transformer: A review of medical image segmentation models. J. Imaging Inform. Med. 2024, 37, 1529–1547. [Google Scholar] [CrossRef]
  11. Mukasheva, A.; Koishiyeva, D.; Sergazin, G.; Sydybayeva, M.; Mukhammejanova, D.; Seidazimov, S. Modification of U-Net with Pre-Trained ResNet-50 and Atrous Block for Polyp Segmentation: Model TASPP-UNet. Eng. Proc. 2024, 70, 16. [Google Scholar] [CrossRef]
  12. Ghosh, K.; Bellinger, C.; Corizzo, R.; Branco, P.; Krawczyk, B.; Japkowicz, N. The class imbalance problem in deep learning. Mach. Learn. 2024, 113, 4845–4901. [Google Scholar] [CrossRef]
  13. Xie, Z.; Shu, C.; Fu, Y.; Zhou, J.; Chen, D. Balanced Loss Function for Accurate Surface Defect Segmentation. Appl. Sci. 2023, 13, 826. [Google Scholar] [CrossRef]
  14. Nasalwai, N.; Punn, N.S.; Sonbhadra, S.K.; Agarwal, S. Addressing the class imbalance problem in medical image segmentation via accelerated tversky loss function. In Advances in Knowledge Discovery and Data Mining; Karlapalem, K., Cheng, H., Ramakrishnan, N., Agrawal, R.K., Reddy, P.K., Srivastava, J., Chakraborty, T., Eds.; Lecture Notes in Computer Science; Springer: Cham, Switzerland, 2021; Volume 12714. [Google Scholar] [CrossRef]
  15. Jeong, S.-M.; Lee, S.-G.; Seok, C.-L.; Lee, E.-C.; Lee, J.-Y. Lightweight Deep Learning Model for Real-Time Colorectal Polyp Segmentation. Electronics 2023, 12, 1962. [Google Scholar] [CrossRef]
  16. Goceri, E. Polyp segmentation using a hybrid vision transformer and a hybrid loss function. J. Imaging Inform. Med. 2024, 37, 851–863. [Google Scholar] [CrossRef]
  17. Bourday, R.; Aattouchi, I.; Ait Kerroum, M. A Comparative Study of Deep Learning Loss Functions: A Polyp Segmentation Case Study. In Computing, Internet of Things and Data Analytics; García Márquez, F.P., Jamil, A., Ramirez, I.S., Eken, S., Hameed, A.A., Eds.; Springer: Cham, Switzerland, 2024; pp. 68–78. [Google Scholar] [CrossRef]
  18. Jha, D.; Smedsrud, P.H.; Riegler, M.A.; Halvorsen, P.; De Lange, T.; Johansen, D.; Johansen, H.D. Kvasir-seg: A segmented polyp dataset. In MultiMedia Modeling, Proceedings of the 26th International Conference, MMM 2020, Daejeon, Republic of Korea, 5–8 January 2020; Proceedings, part II 26; Springer International Publishing: Cham, Switzerland, 2020; pp. 451–462. [Google Scholar] [CrossRef]
  19. Gabdullin, M.T.; Mukasheva, A.; Koishiyeva, D.; Umarov, T.; Bissembayev, A.; Kim, K.S.; Kang, J.W. Automatic cancer nuclei segmentation on histological images: Comparison study of deep learning methods. Biotechnol. Bioprocess Eng. 2024, 29, 1034–1047. [Google Scholar] [CrossRef]
  20. Åkesson, J.; Töger, J.; Heiberg, E. Random effects during training: Implications for deep learning-based medical image segmentation. Comput. Biol. Med. 2024, 180, 108944. [Google Scholar] [CrossRef] [PubMed]
  21. Pravitasari, A.A.; Iriawan, N.; Nuraini, U.S.; Rasyid, D.A. On comparing optimizer of UNet-VGG16 architecture for brain tumor image segmentation. In Brain Tumor MRI Image Segmentation Using Deep Learning Techniques; Chaki, J., Ed.; Academic Press: Cambridge, MA, USA, 2022; pp. 197–215. [Google Scholar] [CrossRef]
  22. Tiwari, T.; Saraswat, M. A new modified-unet deep learning model for semantic segmentation. Multimed. Tools Appl. 2023, 82, 3605–3625. [Google Scholar] [CrossRef]
  23. Porter, E.; Solis, D.; Bruckmeier, P.; Siddiqui, Z.A.; Zamdborg, L.; Guerrero, T. Effect of Loss Functions in Deep Learning-Based Segmentation. In Auto-Segmentation for Radiation Oncology; CRC Press: Boca Raton, FL, USA, 2021; pp. 133–150. [Google Scholar]
  24. Hui, H.; Zhang, X.; Wu, Z.; Li, F. Dual-path attention compensation U-net for stroke lesion segmentation. Comput. Intell. Neurosci. 2021, 2021, 7552185. [Google Scholar] [CrossRef] [PubMed]
  25. Li, X.; Wang, W.; Wu, L.; Chen, S.; Hu, X.; Li, J.; Yang, J. Generalized focal loss: Learning qualified and distributed bounding boxes for dense object detection. Adv. Neural Inf. Process. Syst. 2020, 33, 21002–21012. [Google Scholar]
  26. Altini, N.; Prencipe, B.; Brunetti, A.; Brunetti, G.; Triggiani, V.; Carnimeo, L.; Cascarano, G.D. A Tversky loss-based convolutional neural network for liver vessels segmentation. In Intelligent Computing Theories and Application, Proceedings of the 16th International Conference, ICIC 2020, Bari, Italy, 2–5 October 2020; Springer: Cham, Switzerland, 2020. [Google Scholar]
  27. Celaya, A.; Riviere, B.; Fuentes, D. A generalized surface loss for reducing the hausdorff distance in medical imaging segmentation. arXiv 2023, arXiv:2302.03868. [Google Scholar] [CrossRef]
  28. Zhan, J.; Liu, J.; Wu, Y.; Guo, C. Multi-Task Visual Perception for Object Detection and Semantic Segmentation in Intelligent Driving. Remote Sens. 2024, 16, 1774. [Google Scholar] [CrossRef]
  29. Kato, S.; Hotta, K. Mse loss with outlying label for imbalanced classification. arXiv 2021, arXiv:2107.02393. [Google Scholar] [CrossRef]
  30. Qi, J.; Du, J.; Siniscalchi, S.M.; Ma, X.; Lee, C.H. On mean absolute error for deep neural network based vector-to-vector regression. IEEE Signal Process. Lett. 2020, 27, 1485–1489. [Google Scholar] [CrossRef]
  31. Yuan, Y.; Chao, M.; Lo, Y.C. Automatic skin lesion segmentation using deep fully convolutional networks with jaccard distance. IEEE Trans. Med. Imaging 2017, 36, 1876–1886. [Google Scholar] [CrossRef]
  32. Zhang, Y.; Liu, S.; Li, C.; Wang, J. Rethinking the dice loss for deep learning lesion segmentation in medical images. J. Shanghai Jiaotong Univ. (Sci.) 2021, 26, 93–102. [Google Scholar] [CrossRef]
  33. Müller, D.; Soto-Rey, I.; Kramer, F. Towards a guideline for evaluation metrics in medical image segmentation. BMC Res. Notes 2022, 15, 210. [Google Scholar] [CrossRef] [PubMed]
  34. Koishiyeva, D.; Bissembayev, A.; Iliev, T.; Kang, J.W.; Mukasheva, A. Classification of Skin Lesions using PyQt5 and Deep Learning Methods. In Proceedings of the 2024 5th International Conference on Communications, Information, Electronic and Energy Systems (CIEES), Veliko Tarnovo, Bulgaria, 20–22 November 2024. [Google Scholar] [CrossRef]
  35. Maxwell, A.E.; Warner, T.A.; Guillén, L.A. Accuracy assessment in convolutional neural network-based deep learning remote sensing studies—Part 1: Literature review. Remote Sens. 2021, 13, 2450. [Google Scholar] [CrossRef]
  36. Tolkynbekova, A.; Koishiyeva, D.; Bissembayev, A.; Mukhammejanova, D.; Mukasheva, A.; Kang, J.W. Comparative Analysis of the Predictive Risk Assessment Modeling Technique Using Artificial Intelligence. J. Electr. Eng. Technol. 2025, in press. [Google Scholar] [CrossRef]
Figure 1. Validation performance curves for different loss functions: (A) Dice coefficient, (B) loss, (C) mean IoU, and (D) sensitivity.
Engproc 104 00017 g001
Figure 2. Correlation between validation loss and Dice coefficient across different loss functions.
Engproc 104 00017 g002
Figure 3. Correlation between validation loss and IOU across different loss functions.
Engproc 104 00017 g003
Figure 4. Segmentation results on an imbalanced sample with a small foreground region.
Engproc 104 00017 g004
Figure 5. Segmentation results on an imbalanced sample with a severely limited foreground region.
Engproc 104 00017 g005
Table 1. Comparative evaluation of loss functions based on validation metrics for image segmentation.
LossAccuracyDiceMean IOUSensitivity
BCE0.95530.88820.81040.8576
WBCE0.95570.88310.81200.8593
Tversky0.95460.88920.80590.8438
Surface0.95250.88470.79820.8616
MSE0.95430.87270.80660.8516
MAE0.95180.88190.79530.8344
Jaccard0.95290.88570.79960.8532
Focal0.95520.79630.81020.8483
Dice0.95390.88830.80520.8466
Dice + BCE0.95380.88430.80140.8402
WBCE + Dice0.95570.89160.81040.8498
Tversky + Focal0.95400.89170.80960.8885
Table 2. Assessment of stability of loss functions by difference and ratio of errors on validation.
LossValidation DifferenceError Ratio
BCE0.20200.193523.6540
WBCE0.09920.093216.5767
Tversky0.10930.08744.9933
Surface0.03810.03297.3658
MSE0.03120.029013.6952
MAE0.03880.03205.6681
Jaccard0.17980.12433.2367
Focal0.01470.014124.77
Dice0.11050.09406.6742
Dice + BCE0.13850.126611.6415
WBCE + Dice0.20200.193523.6540
Tversky + Focal0.1281 0.120015.9704
Table 3. Assessment of computational efficiency of loss functions in terms of training time and processing speed.
LossTrainingEpochFPS
BCE527.6010.55153.52
WBCE524.6810.49154.38
Tversky523.9710.48154.59
Surface559.3211.19144.82
MSE524.7510.50154.36
MAE526.2210.52153.93
Jaccard554.6411.09146.04
Focal524.5710.49154.41
Dice528.6710.57153.22
Dice + BCE547.4110.95147.97
WBCE + Dice535.4410.71151.28
Tversky + Focal542.8310.86149.22
Disclaimer/Publisher’s Note: The statements, opinions and data contained in all publications are solely those of the individual author(s) and contributor(s) and not of MDPI and/or the editor(s). MDPI and/or the editor(s) disclaim responsibility for any injury to people or property resulting from any ideas, methods, instructions or products referred to in the content.