Proceeding Paper

Disaster-Based Mobile Learning System Using Technology Acceptance Model †

by
John A. Bacus
College of Engineering and Architecture, Mapua Malayan Colleges Mindanao, Davao City 8000, Philippines
Presented at the 8th Eurasian Conference on Educational Innovation 2025, Bali, Indonesia, 7–9 February 2025.
Eng. Proc. 2025, 103(1), 5; https://doi.org/10.3390/engproc2025103005
Published: 5 August 2025

Abstract

Recently, the usage of mobile phone-based games has increased due to the growing accessibility and convenience they provide. Using a descriptive-quantitative design, a disaster-based mobile application was developed in this study to enhance disaster literacy among the private senior high schools in science, technology, engineering, and mathematics (STEM) education in Davao City, the Philippines. The developed application was provided together with survey questionnaires to 364 students randomly selected from different schools in Davao City usingF a simple random sampling method. The technology acceptance (TAM) model was used to explain how users accepted the new technology. The mobile application was designed with features in four disaster scenarios—fire, flood, volcano, and earthquake. The results revealed a high acceptance, with an average score of the perceived usefulness (PE) of 4.52, perceived ease of use (PEOU) of 4.44, and a behavioral intention (BI) of 4.12. The students accepted the application to enhance disaster risk reduction and management. Aligned with SDG 4 and SDG 11, the application can be used to equip users with the knowledge to respond to disasters and ensure community resilience.

1. Introduction

Mobile learning systems are a revolution in education and training, as they deliver dynamic, interactive, and personalized content through ubiquitous mobile devices. Unlike standard educational tools, these systems provide users with unique flexibility and ubiquity [1,2]. Integrating the technology acceptance model (TAM) into the system offers a theoretical framework to evaluate and enhance user adoption. TAM is based on two main factors, perceived usefulness (PU) and perceived ease of use (PEOU), which are used to predict behavioral intention (BI) and actual use [3]. Recent advances in mobile learning systems indicate the necessity of extending TAM along with other constructs, including trust, system quality, and real-time adaptability, especially for disaster preparedness. These extensions meet the user expectations and situational requirements in emergency contexts [4,5].
TAM in mobile learning (M-learning) reflects diverse contexts and user needs, with self-efficacy, subjective norms, and perceived enjoyment as significant predictors of M-learning adoption. TAM is a framework to understand user intentions, especially with trust and mobile anxiety [6]. An extended TAM model with academic relevance and institutional support revealed factors shaping behavioral intentions and perceived mobility value that influenced technology adoption significantly [7]. Neural network modeling is used to identify flexibility, efficiency, and social learning as predictors of adoption intentions, providing insights for enhancing M-learning in developing countries [8].
A mobile system and its service efficacy were evaluated using TAM, and positive PU and PEOU were observed, indicating positive user attitudes toward mobile technology [9]. A success model for M-learning in Saudi Arabia emphasized the importance of information technology (IT) infrastructure, top management support, and awareness [10]. While TAM is well-established in mobile learning research, its application to disaster education remains underexplored. In the Philippines, disaster preparedness applications remain underexplored in M-learning.
Existing studies predominantly focused on academic and professional environments, neglecting the unique demands of disaster scenarios, such as preparedness for floods, earthquakes, volcanoes, and fires. These scenarios have challenges, lacking trust, perceived risk, urgency, and accessibility in user adoption [11,12]. Furthermore, there is a paucity of studies integrating TAM with metrics to evaluate mobile applications’ practical impact on disaster preparedness. By addressing these gaps, optimizing technology can be provided for life-saving education tailored to these disaster scenarios [13].
In this study, a mobile learning application was developed to enhance disaster preparedness by providing appropriate training and resources. A mobile application with interactive features was developed to improve users’ disaster response skills. To develop four disaster preparedness scenarios, such as fire, flood, volcano, and earthquake, the DepEd’s Senior High School Curriculum in Disaster Readiness and Risk Reduction was employed. The application was evaluated using TAM for user acceptance using PU, PEOU, and BI.
TAM has not been applied in disaster education and mobile learning. Therefore, by applying TAM and developing guidelines for user-centered designs of mobile applications, user trust and perceived risk can be enhanced. The model helps policymakers, educators, and developers offer scalable solutions. The potential of mobile learning in addressing societal challenges demonstrates how accessible technology saves lives during emergencies.

2. Methodology

The conceptual framework of this study was constructed as shown in Figure 1. The input included four disaster scenarios adopted from the DepEd’s Senior High School Curriculum in Disaster Readiness and Risk Reduction to develop a disaster-based mobile application. Android Studio was used in the integrated development environment (IDE), and Android Illustrator and Photoshop were also used for creating user interface elements, storyboard layouts, and graphical assets. The curriculum was integrated into the application with interactive features.
Variables related to the acceptance of technology were assessed using TAM. A questionnaire survey was conducted to collect data on PU, PEOU, and BI of the participants and understand patterns, relationships, and influences with minimized bias. Descriptive quantitative designs were used to validate TAM constructs and their relationships [14,15]. Structural equation modeling and regression analysis were conducted to examine factors such as social norms and user interface design in influencing PEOU and PU [16]. Biases inherent in self-reported measures were mitigated by employing reliability testing to ensure the accuracy and consistency of the collected data.
The study was conducted in Davao City, which is a major city in Southern Mindanao, the Philippines. It has a diverse population, economic activity, and technological advancement. Davao City was selected because it embraces digital technologies faster than other cities while also being Mindanao’s education and business center. The city has an appropriate environment for investigating the acceptance of technology with its blended urban and semi-urban characteristics, substantial digital literacy, and the availability of technological infrastructure. The participants who drew their perspectives from various sectors were recruited as they presented technology acceptance in different settings. The educational and commercial establishments in Davao City provide diverse digital systems’ PU and ease of use.
The respondents of the study were grade 12 senior high school students learning science, technology, engineering, and mathematics (STEM). 364 respondents were enrolled at private schools in Davao City and selected using a simple random sampling method.
A TAM questionnaire on a five-point Likert scale was developed as presented in Table 1: from 1 (strongly disagree) to 5 (strongly agree). TAM is used to identify PU and PEOU as key factors influencing an individual’s attitude toward technology. PU refers to the extent to which the application enhances learning about emergencies and disaster preparedness, while PEOU reflects how easy it is for students to navigate and use the application. Additionally, BI is a critical determinant of actual usage and reflects students’ willingness to use the application in school discussions about safety and recommend it to peers.

Software Development

The creation of the application followed the Agile Methodology, a flexible and iterative process that promotes collaboration, adaptability, and customer satisfaction. This process helped the development team react well to feedback and changing needs as the project progressed. Agile helped continuously improve the software and make sure it had the features that users wanted based on user testing and stakeholder feedback. Android Studio was one of the main IDEs used to create the application. Android Studio is the official IDE for Android application development. It offered tools that were helpful in coding, debugging, and testing the Android application. Java ensured the application’s backend was reliable, scalable, and easy to maintain. Adobe Illustrator 27.9 was used to design UI elements. The vector-based instrument of Illustrator enabled the Android application builder to create scalable and high-quality design elements. The user interface (UI) components were designed to be user-friendly and visually appealing and matched with modern design standards. With the software, the product’s detailed storyboard was designed to show the flow of the application in visuals. Using Photoshop’s advanced graphic-editing capabilities was essential in generating high-quality visual content and ensuring the consistent appearance of the application’s graphics.
Figure 2 shows the features of the mobile application. The application starts on the main menu, which shows the play, exit, and help buttons. The exit button is used to end the application, and the help button is used to show the instructions on how to use the application. The play button displays the four disaster scenarios that users can choose. These scenarios have questions to ensure user learning. After finishing each scenario, the user can tap the quiz button for a disaster education assessment.
For data analysis, mean scores and standard deviation (SD) were calculated using the JASP v0.18.1 software. Descriptive statistics were obtained to understand the tendency and data variability. The mean score was calculated as the arithmetic average of all scores by dividing the summed scores by the number of observations. Table 2 shows the weighted mean interpretation of the app’s acceptance. The mean was used to measure the average level of agreement or perception of the respondents on PU, PEOU, and BI. SD is a measure of data spread from the mean. If the SD is small, data points are closer to the mean, indicating respondents are consistent in their answers. On the other hand, a higher SD means greater dispersion, suggesting less agreement and similar opinions. SD is used to determine how consistent participants’ perceptions across the constructs were.

3. Results and Discussions

3.1. Design and Features

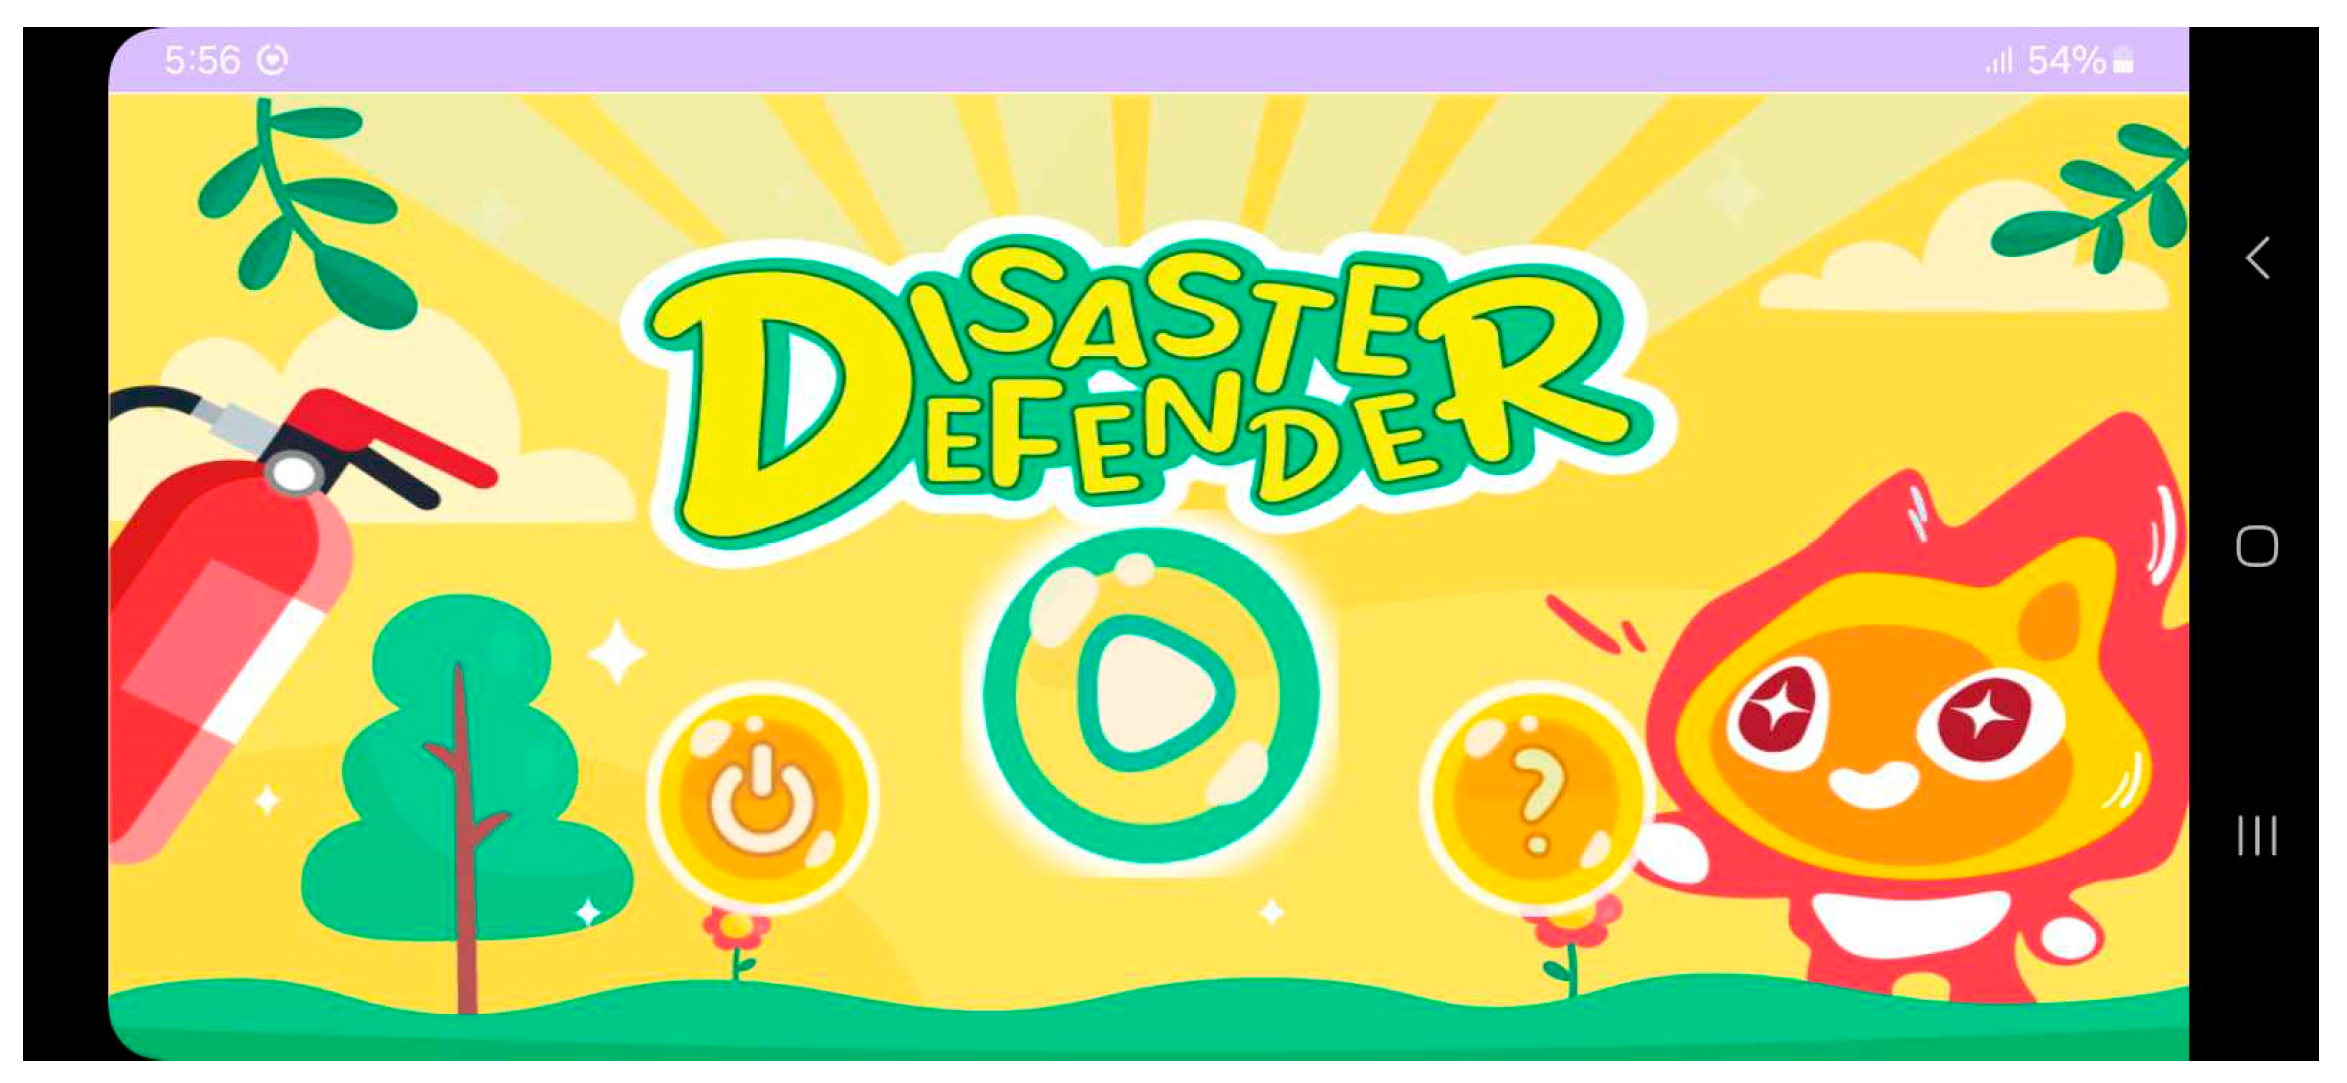
The features of the application were designed based on Nielsen’s Usability Heuristics [17]. The main menu is shown in Figure 3. The buttons included exit, play, and help.
The exit button closes the application when pressed. Meanwhile, the help button on the right side is used to show the instructions on how to play the game (Figure 4).
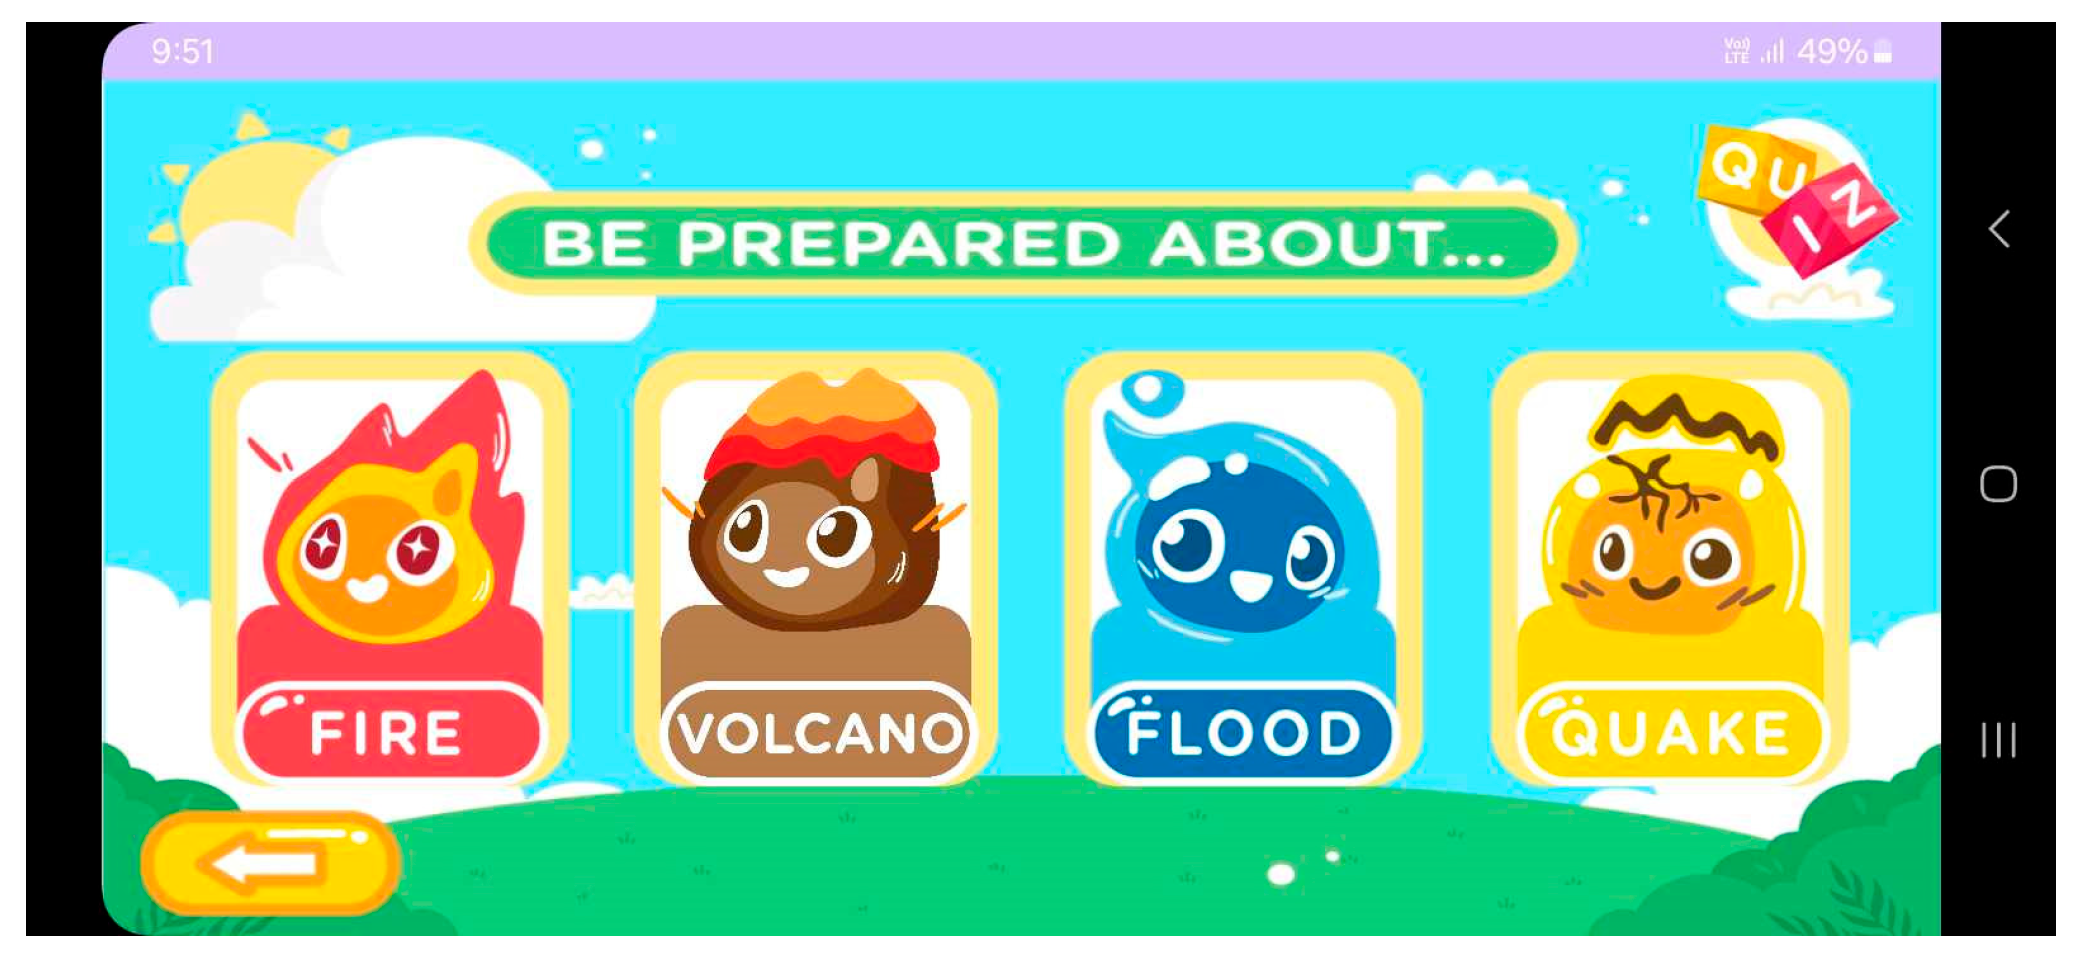
The play button leads to four disaster scenarios: fire, flood, earthquake, and volcano scenarios (Figure 5). These scenarios included concept-checking questions to ensure the learning of the users.
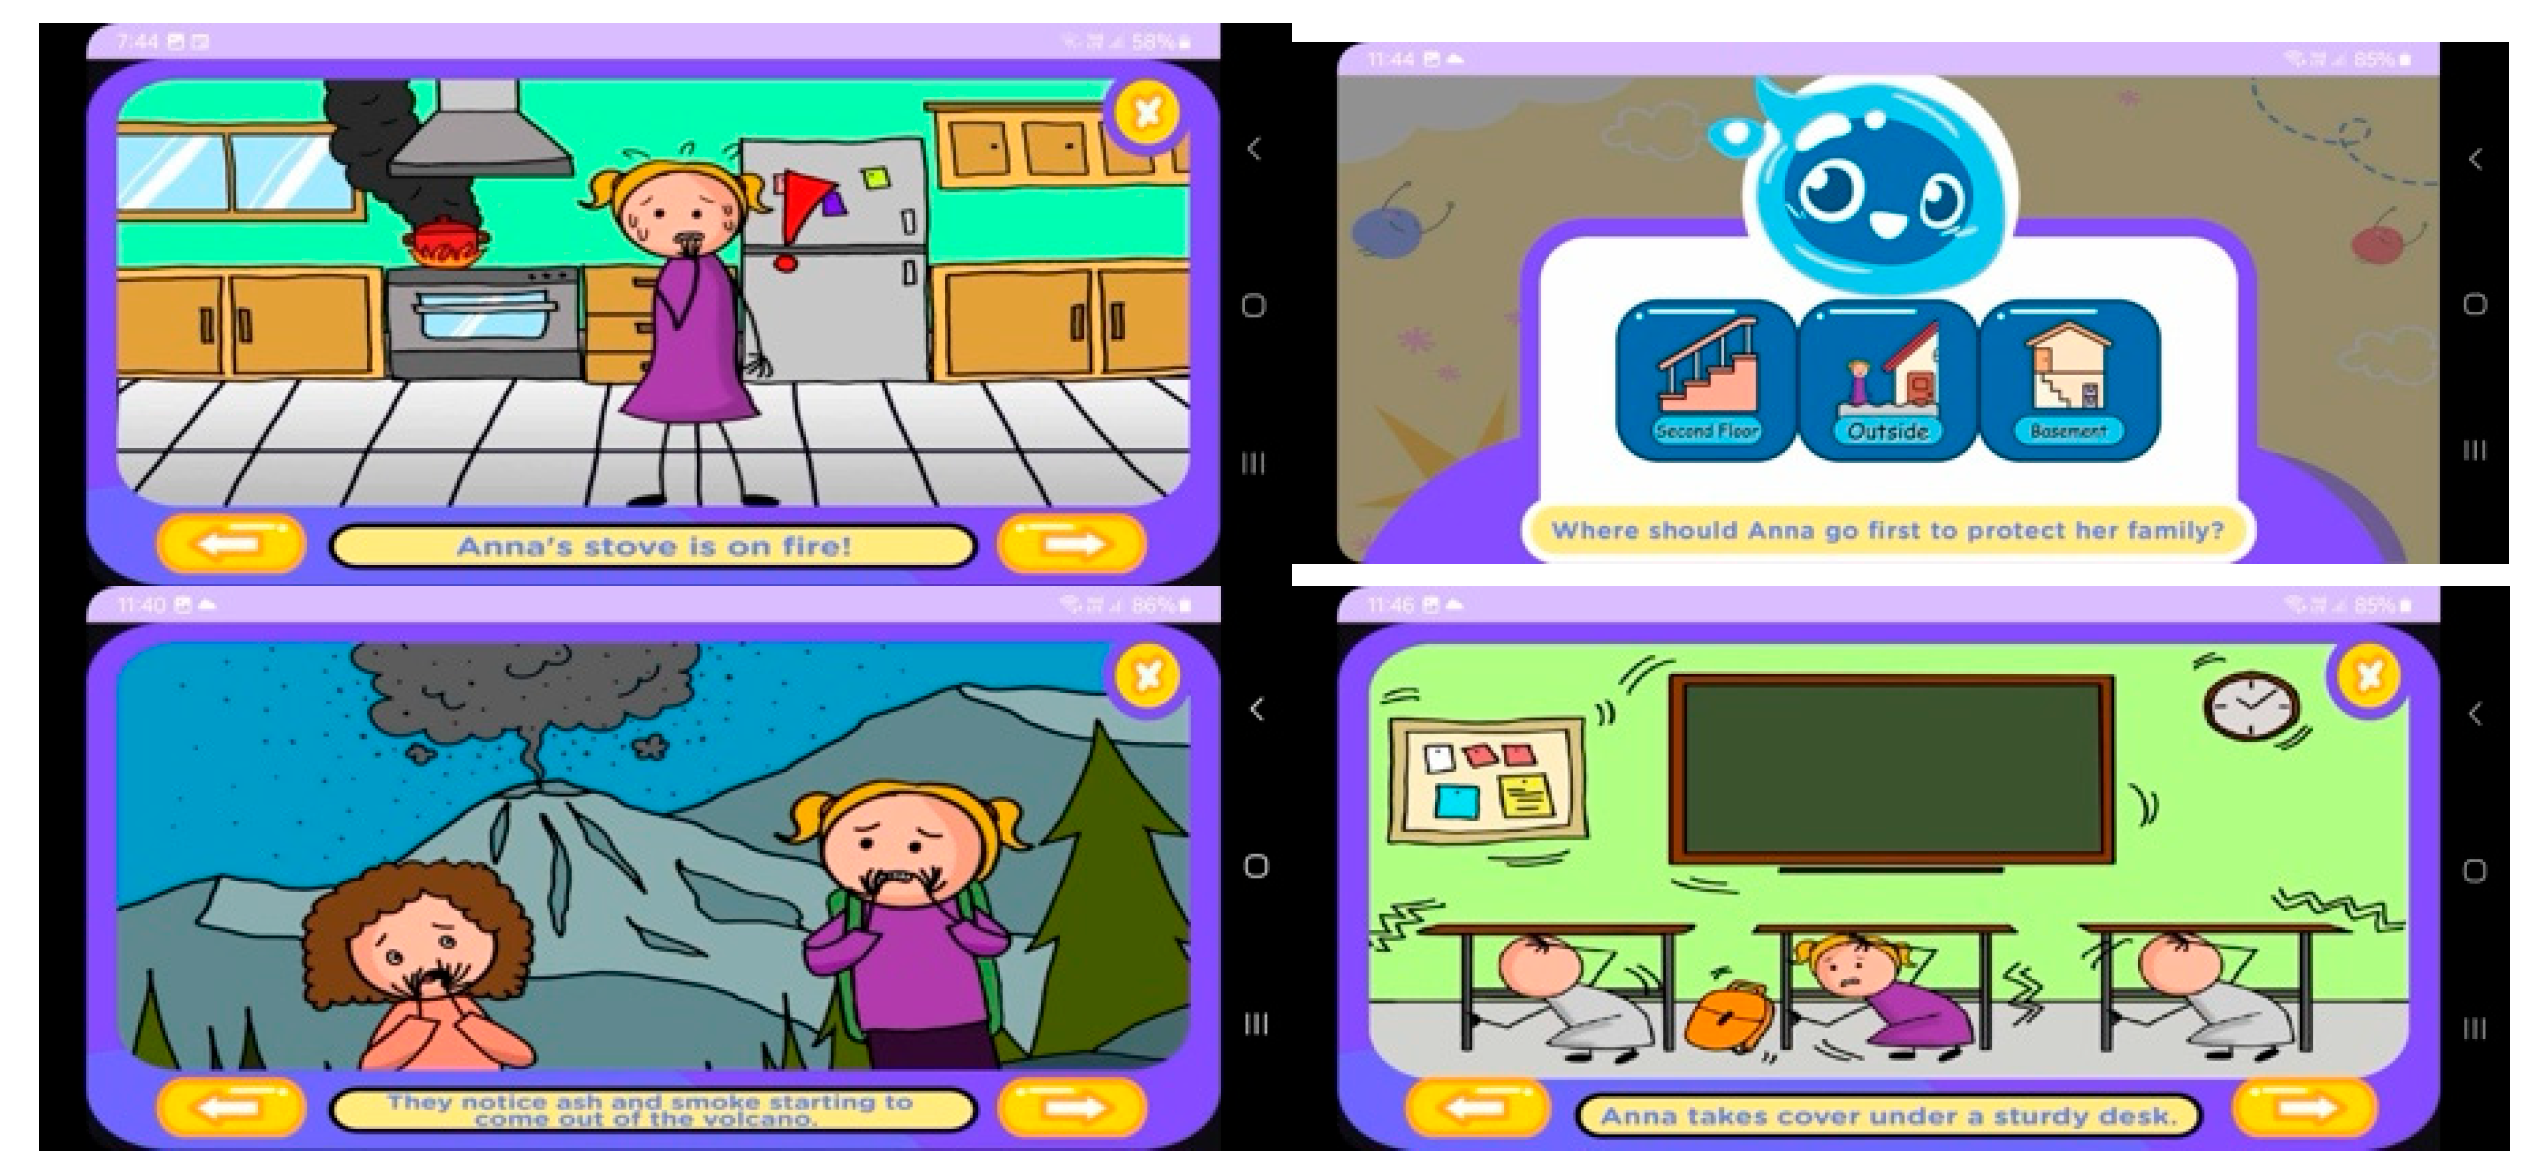
Figure 6 shows each disaster scenario of fire, volcano, flood, and earthquake from the top to the bottom.
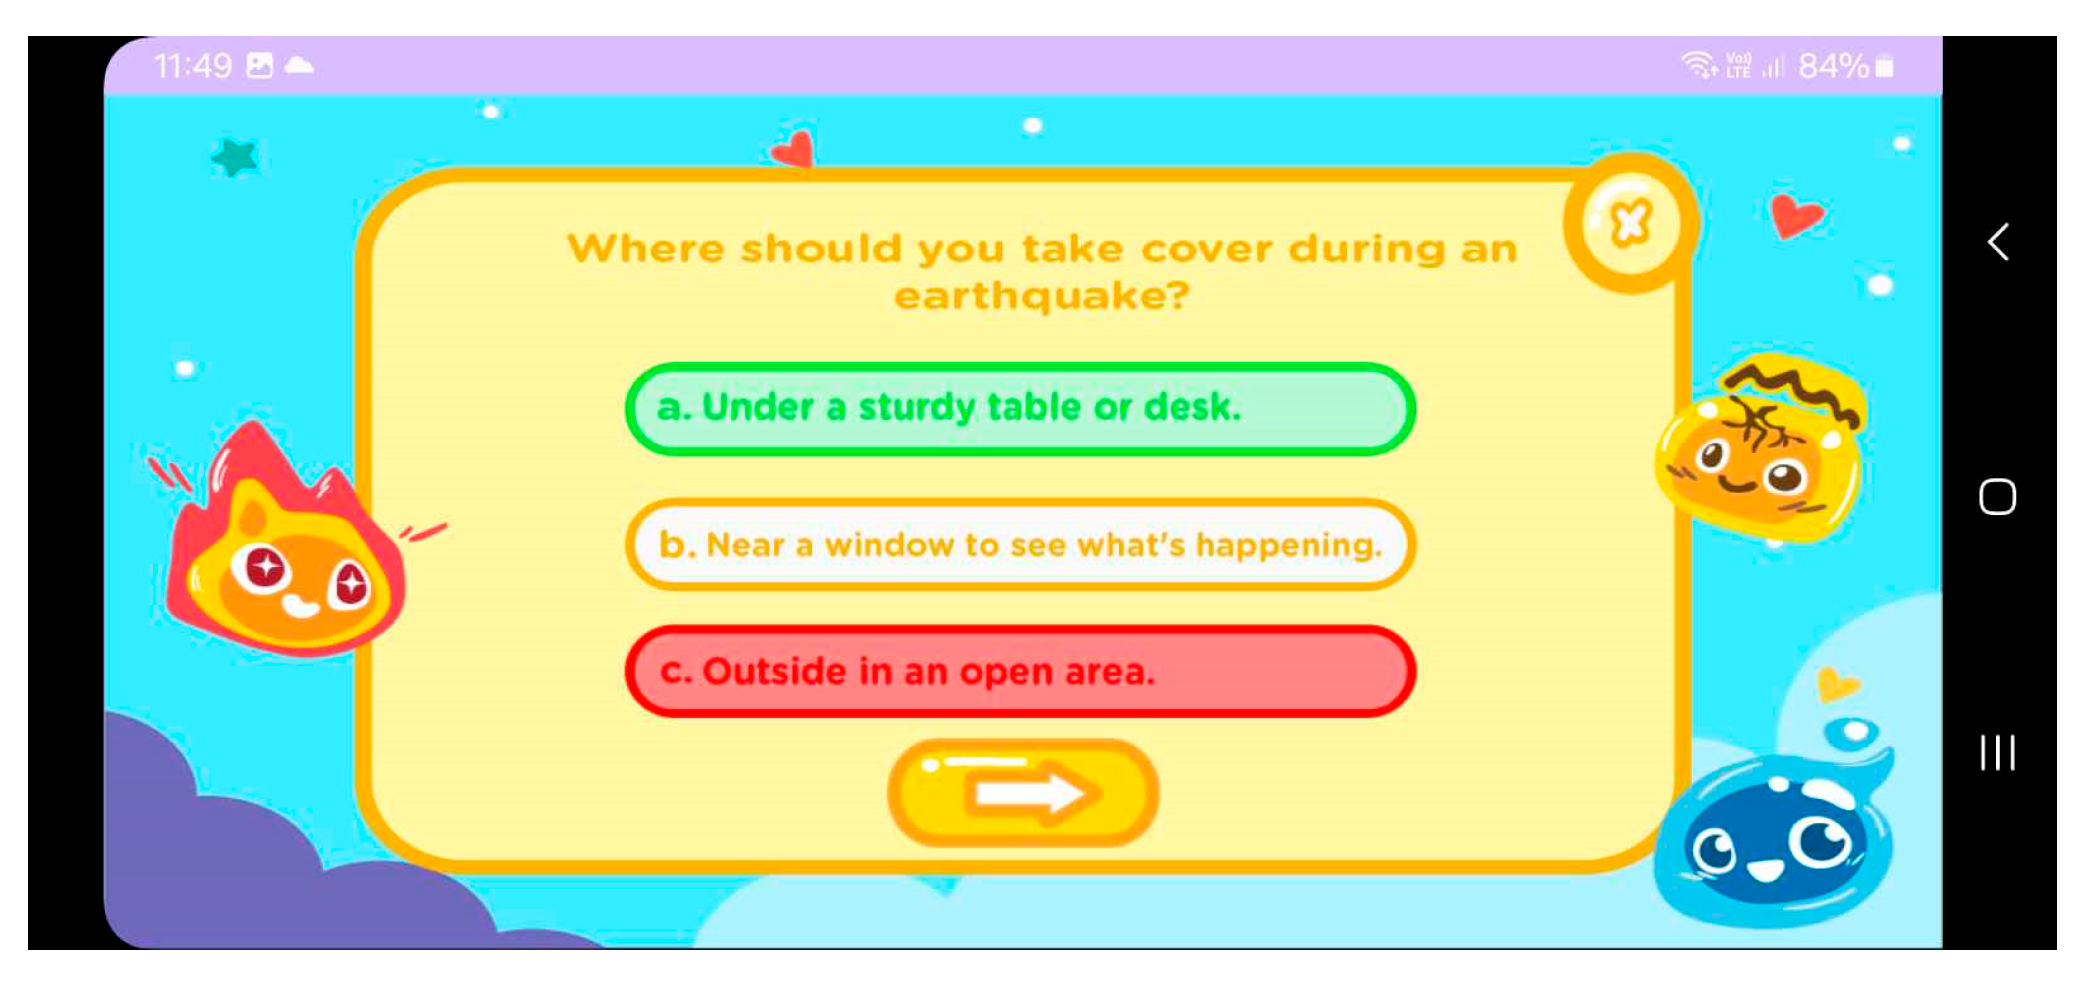
After successfully finishing the different disaster scenarios. The quiz button appears. The quiz ensures that the learners gain the disaster knowledge they need. Figure 7 shows an example of a user interface for the quiz. If the users incorrectly answer the questions, the answer is highlighted in red and shows the correct answer in green.

3.2. Level of Technology Acceptance

Table 3 shows the mean score and SD of technology acceptance.
The mean value of PU was 4.52, indicating that users strongly perceive the technology as highly useful and significantly enhancing their performance. SD was 0.55, showing relatively low variability in user responses and a consistent agreement among the participants regarding the usefulness of the technology. The mean value of PEOU was 4.44, indicating that users find the technology easy to use. SD was 0.58, indicating more variability than PU but showing a consensus that the technology is user-friendly. The mean of BI was 4.12, indicating that the participants were inclined to use the technology and recognize its benefits, though several participants showed conservativeness. SD was 0.85, indicating higher variability in responses than PU and PEOU and diverse opinions or levels of intent to adopt the technology.
The overall mean score was 4.36, indicating that the participants strongly agreed that the application was useful, easy to use, and encouraged their intention to adopt it. This positive evaluation suggested that the application met its intended purpose of educating users about disaster preparedness and safety. An SD of 0.67 reflected a moderate level of consistency in responses across all constructs.

4. Conclusions

The application for disaster preparedness was developed by using the Agile Methodology in this study. Android Studio was used as the primary IDE, and Java was employed as the programming language to develop backend functionality, ensuring reliability and scalability. Adobe Illustrator was employed to design high-quality and scalable UI elements, while Adobe Photoshop was used to create storyboard layouts and graphical assets that enhanced the application’s visual appeal and usability. The application was perceived as highly useful, easy to use, and capable of encouraging strong intentions for adoption, with an overall mean score of 4.36. Both PU (4.52) and PEOU (4.44) were scored high, highlighting the application’s effectiveness in helping users learn about disaster preparedness and safety in an engaging and user-friendly manner. However, a lower mean score of BI (4.12), coupled with a higher variability, suggested that several participants had irregular usage patterns and conservativeness.
Based on these findings, several recommendations are proposed. First, to enhance behavioral engagement and encourage consistent use, the application needs to integrate additional features such as gamification, interactive quizzes, or regular content updates. To address the variability in user perceptions, particularly in behavioral intention, further research is necessary to identify and address specific user concerns. Additionally, providing training or tutorials for users with varying digital literacy levels is needed to improve confidence and encourage broader adoption. The application’s usage can be promoted through a collaboration of schools and communities to increase its visibility and relevance as a disaster preparedness tool. Finally, iterative development is required using user feedback to refine the application’s functionality and design and ensure it is effective and user-friendly. It is also important to explore the application’s long-term impacts on knowledge retention and behavioral changes in emergencies, as well as factors influencing individual variability in adoption. These efforts are required to ensure that the application remains a valuable and impactful tool for disaster preparedness education.
In this study, the participants were selected only in Davao City. Technology acceptance differs across cultures because of varying degrees of trust, institutional support, and digital infrastructure [18]. Therefore, advanced technologies such as artificial intelligence (AI) or machine learning (ML) need to be added to TAM. Both technologies improve the mobile learning application’s adaptability and responsiveness. The technologies’ integration enhances disaster-specific training and real-time decision-making support. Also, the reliance on data to measure TAM constructs might cause potential biases, social desirability bias, and inaccurate self-assessment [19]. Longitudinal data are also needed to enable an understanding of user acceptance and behavior, particularly in disaster preparedness.

Funding

This research received no external funding.

Institutional Review Board Statement

Not applicable.

Informed Consent Statement

Informed consent was obtained from all subjects involved in the study.

Data Availability Statement

The data presented in this study are available on request from the corresponding author. The data are not publicly available due to ethical and privacy restrictions involving participating private schools in the Davao Region. Disclosure of the dataset may reveal sensitive institutional and individual information that could compromise confidentiality agreements with the involved institutions.

Conflicts of Interest

The author declares no conflict of interest.

References

  1. Almaiah, M.A.; Alamri, M.M.; Al-Rahmi, W. Applying the UTAUT Model to Explain the Students’ Acceptance of Mobile Learning System in Higher Education. IEEE Access. 2019, 7, 174673–174686. [Google Scholar] [CrossRef]
  2. Zaidi, S.; Osmanaj, V.; Ali, O.; Zaidi, S. Adoption of mobile technology for mobile learning by university students during COVID-19. Int. J. Inf. Learn. Technol. 2021, 38, 329–343. [Google Scholar] [CrossRef]
  3. Venkatesh, V. Determinants of PEOU: Integrating control, intrinsic motivation, and emotion into the technology acceptance model. Inf. Syst. Res. 2000, 11, 342–365. [Google Scholar] [CrossRef]
  4. Alsharida, R.A.; Hammood, M.; Al-Emran, M. Mobile Learning Adoption: A Systematic Review of the Technology Acceptance Model from 2017 to 2020. Int. J. Emerg. Technol. Learn. 2021, 16, 147–162. [Google Scholar] [CrossRef]
  5. Nikou, S.; Economides, A. Mobile-based assessment: Integrating acceptance and motivational factors into a combined model of self-determination theory and technology acceptance. Comput. Hum. Behav. 2017, 68, 83–95. [Google Scholar] [CrossRef]
  6. Baghcheghi, N.; Karimy, H.R.; Alizadeh, S. Factors affecting mobile learning adoption in healthcare professional students based on technology acceptance model. Acta Fac. Medicae Naissensis. 2020, 37, 191–200. [Google Scholar] [CrossRef]
  7. Saroia, A.I.; Gao, S. Investigating university students’ intention to use mobile learning management systems in Sweden. Innov. Educ. Teach. Int. 2018, 56, 569–580. [Google Scholar] [CrossRef]
  8. Arain, A.; Hussain, Z.; Rizvi, W.H.; Vighio, M.S. Extending UTAUT2 toward acceptance of mobile learning in the context of higher education. Univers. Access Inf. Soc. 2019, 18, 659–673. [Google Scholar] [CrossRef]
  9. Almaiah, M.A.; Alismaiel, O. Examination of factors influencing the use of mobile learning system: An empirical study. Educ. Inf. Technol. 2018, 24, 885–909. [Google Scholar] [CrossRef]
  10. Almaiah, M.A.; Ayouni, S.; Hajjej, F.; Lutfi, A.; Almomani, O.; Awad, A.B. Smart Mobile Learning Success Model for Higher Educational Institutions in the Context of the COVID-19 Pandemic. Electronics. 2022, 11, 1278. [Google Scholar] [CrossRef]
  11. Wahyudi, J. The acceptance of a smartphone application for disaster: Technology acceptance model approach. IOP Conf. Ser. Earth Environ. Sci. 2023, 1180, 012002. [Google Scholar] [CrossRef]
  12. Brar, P.S.; Shah, B.; Singh, J.; Ali, F.; Kwak, D. Using Modified Technology Acceptance Model to Evaluate the Adoption of a Proposed IoT-Based Indoor Disaster Management Software Tool by Rescue Workers. Sensors. 2022, 22, 1866. [Google Scholar] [CrossRef] [PubMed]
  13. Prieto, J.C.S.; Olmos-Migueláñez, S.; García-Peñalvo, F. MLearning and pre-service teachers: An assessment of the BI using an expanded TAM model. Comput. Hum. Behav. 2017, 72, 644–654. [Google Scholar] [CrossRef]
  14. Machdar, N.M. The effect of information quality on PU and PEOU. Bus. Entrep. Rev. 2019, 15, 131–146. [Google Scholar] [CrossRef]
  15. Yalcin, M.E.; Kutlu, B. Examination of students’ acceptance of and intention to use learning management systems using extended TAM. Br. J. Educ. Technol. 2019, 50, 2414–2432. [Google Scholar] [CrossRef]
  16. Siagian, H.; Tarigan, Z.; Basana, S.R.; Basuki, R. The effect of perceived security, PEOU, and PU on consumer BIthrough trust in digital payment platform. Int. J. Data Netw. Sci. 2022, 6, 861–874. [Google Scholar] [CrossRef]
  17. Nielsen, J. Usability Engineering; Morgan Kaufmann: San Francisco, CA, USA, 1994. [Google Scholar]
  18. Tarhini, A.; Hone, K.; Liu, X.; Tarhini, T. Examining the moderating effect of individual-level cultural values on users’ acceptance of E-learning in developing countries: A structural equation modeling of an extended technology acceptance model. Interact. Learn. Environ. 2017, 25, 306–328. [Google Scholar] [CrossRef]
  19. Wu, M.-Y. Organizational Acceptance of Social Media Marketing: A Cross-Cultural Perspective. J. Intercult. Commun. Res. 2020, 49, 313–329. [Google Scholar] [CrossRef]
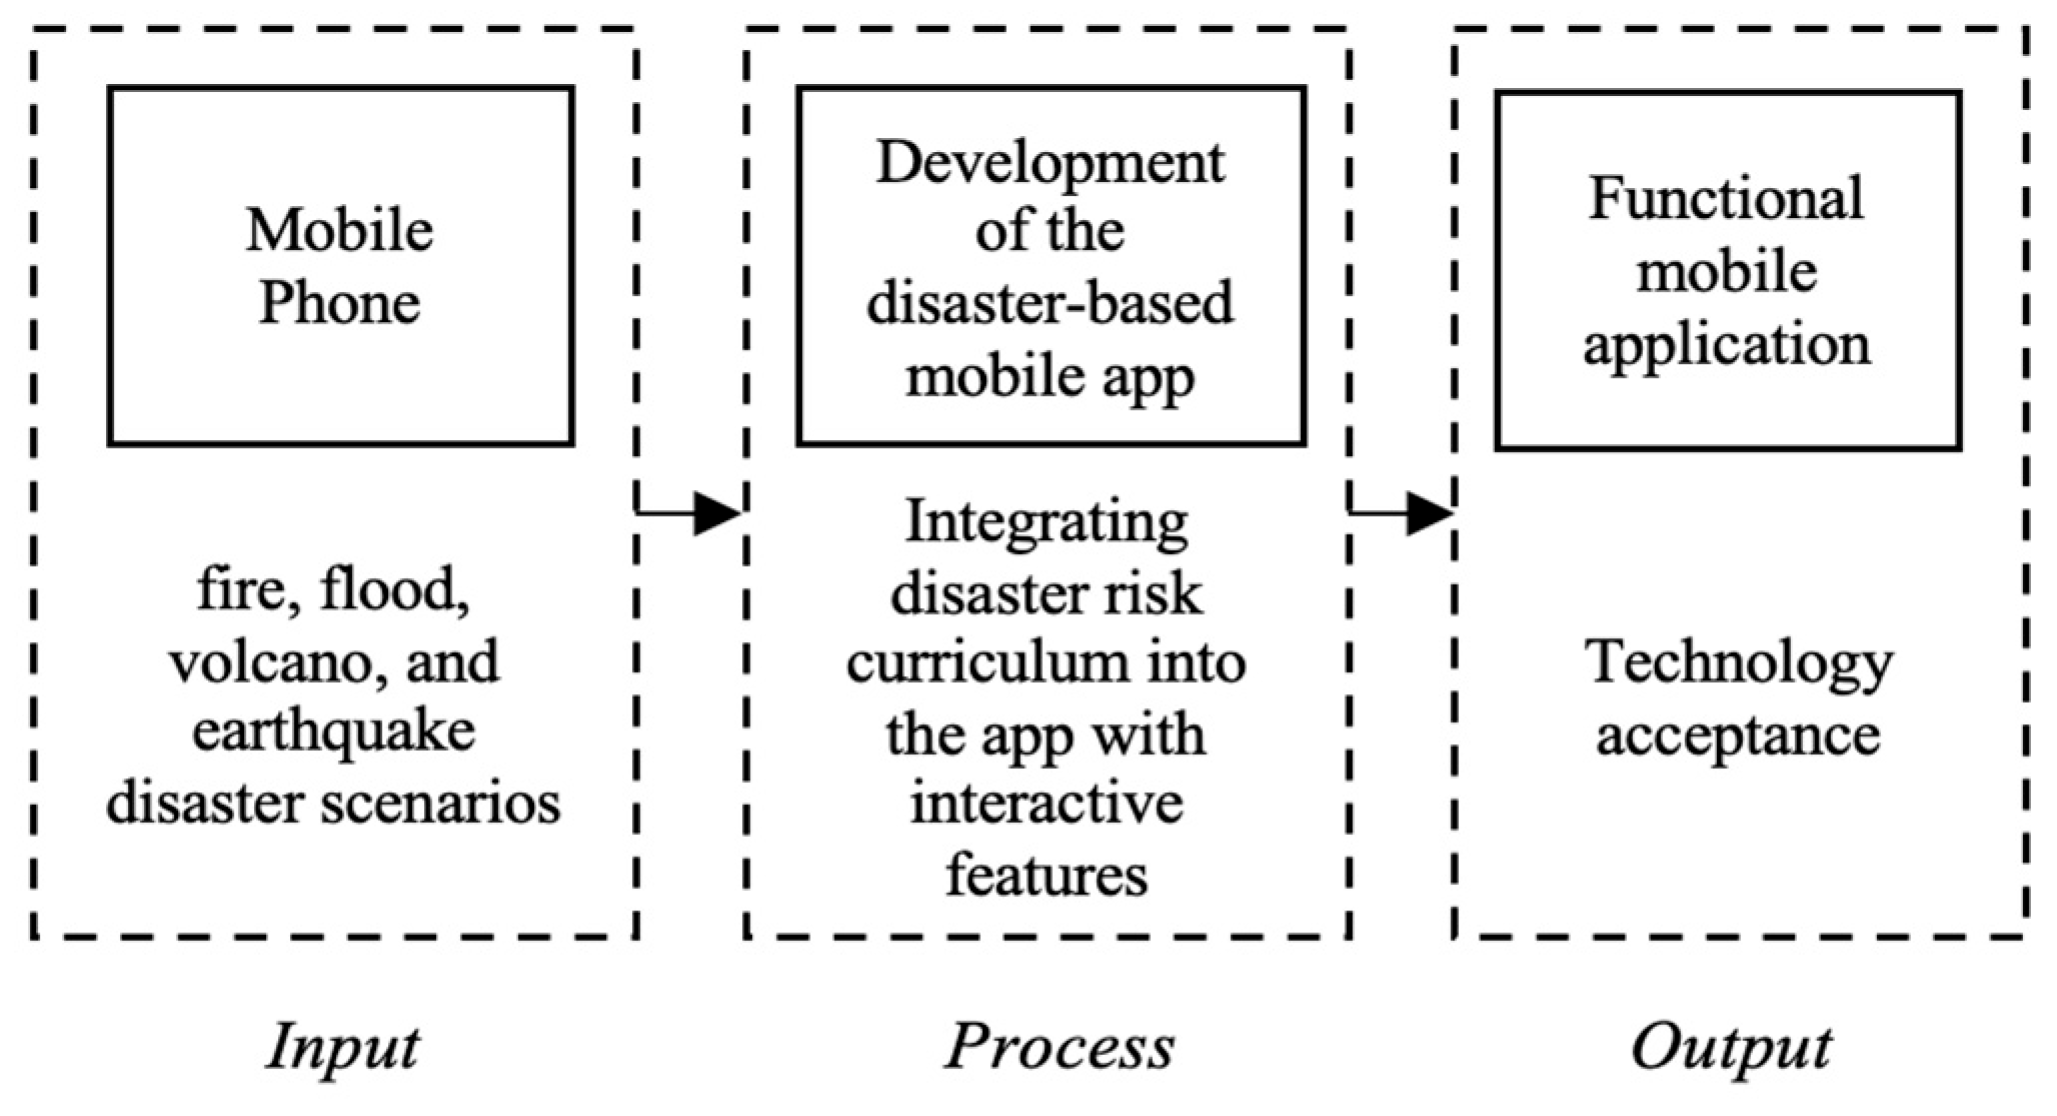
Figure 1. Framework of this study.
Engproc 103 00005 g001
Figure 2. Flowchart of application (* refer to different scenarios).
Engproc 103 00005 g002
Figure 3. Main menu of application.
Engproc 103 00005 g003
Figure 4. Game instructions.
Engproc 103 00005 g004
Figure 5. Disaster scenarios and user interface.
Engproc 103 00005 g005
Figure 6. Fire, volcano, flood, and earthquake scenarios.
Engproc 103 00005 g006
Figure 7. Sample quiz.
Engproc 103 00005 g007
Table 1. TAM questionnaire.
PU
1. The application helps me learn about what to do in emergencies.
2. Using the application makes learning about safety fun.
3. I can learn faster about disasters with the application.
4. The application helps me remember what I learned about staying safe.
PEOU
1. It is easy for me to use the application.
2. I can easily find what I’m looking for in the application.
3. I understand how to do things on the application.
4. The pictures and words in the application are clear and easy for me to understand.
BI
1. I would use the application every time we talk about safety at school.
2. I would tell my friends to use the application too.
Table 2. Weighted mean of TAM.
Weighted MeanDescriptive LevelInterpretation
4.20–5.00Very HighUsers exhibit strong intentions to use the technology and perceive it as significantly enhancing their performance.
3.40–4.19HighUsers are inclined to use the technology and recognize its benefits, though minor reservations may exist.
2.60–3.39ModerateUsers are undecided, seeing potential benefits but also facing uncertainties or usability concerns.
1.80–2.59LowUsers show reluctance and minimal intention to use the technology, doubting its effectiveness or ease of use.
1.00–1.79Very LowUsers exhibit strong resistance and little to no intention to use the technology, questioning its value altogether.
Table 3. Scores of technology acceptance.
MeanStandard
Deviation
Interpretation
PU4.520.55Very High
1. The application helps me learn about what to do in emergencies.4.610.63
2. Using the application makes learning about safety fun.4.490.69
3. I can learn faster about disasters with the application.4.430.67
4. The application helps me remember what I learned about staying safe.4.560.64
PEOU4.440.58Very High
1. It is easy for me to use the application.4.460.71
2. I can easily find what I’m looking for in the application.4.350.74
3. I understand how to do things on the application.4.440.72
4. The pictures and words in the application are clear and easy for me to understand.4.530.68
BI4.120.85High
1. I would use the application every time we talk about safety at school.3.970.97
2. I would tell my friends to use the application too.4.230.89
Overall TAM score4.360.67
Disclaimer/Publisher’s Note: The statements, opinions and data contained in all publications are solely those of the individual author(s) and contributor(s) and not of MDPI and/or the editor(s). MDPI and/or the editor(s) disclaim responsibility for any injury to people or property resulting from any ideas, methods, instructions or products referred to in the content.