Proceeding Paper

MMI Sensor for Diameter Measurement †

1
Applied Electromagnetism Laboratory, Federal University of Pará, Rua Augusto Corrêa, 01, Belém 66075-110, Brazil
2
Centre for Applied Photonics, Institute for Systems and Computer Engineering, Technology and Science (INESC TEC), Rua do Campo Alegre, 687, 4150-179 Porto, Portugal
3
Polytechnic Institute of Viana do Castelo, Rua Escola Industrial e Comercial de Nun’Álvares, 4900-347 Viana do Castelo, Portugal
4
Laboratory of Photonics, Military Institute of Engineering, Praça Gen. Tibúrcio, 80, Rio de Janeiro 22290-270, Brazil
5
Faculty of Computing and Electrical Engineering, Federal University of South and Southeast of Pará, Marabá 68507-590, Brazil
6
Department of Physics and Astronomy, Faculty of Sciences, University of Porto, Rua do Campo Alegre, 687, 4169-007 Porto, Portugal
*
Author to whom correspondence should be addressed.
Presented at the 8th International Electronic Conference on Sensors and Applications, 1–15 November 2021; Available online: https://ecsa-8.sciforum.net.
Eng. Proc. 2021, 10(1), 68; https://doi.org/10.3390/ecsa-8-11324
Published: 1 November 2021

Abstract

:
Cylindrical structure analysis is important in several areas and can be performed through the evaluation of the diameter changes of these structures. Two important areas can be mentioned: pipelines for oil or gas distribution and the condition and growth of trees. In the tree diameter changes, monitoring is directly related to irrigation, since it depends on the water soil deficit and trees are important in the global circulation of heat and water. This diameter can change in the order of 5 mm for some species. In this paper, a strain gauge sensor based on a core diameter mismatch technique for diameter measurement is proposed and investigated. The sensor structure is formed by splicing an uncoated short section of MMF (Multimode Fiber) between two standard SMFs (Singlemode Fiber) called SMF–MMF–SMF (SMS); the MMF length is 15 mm. Two cylindrical structures were placed on a 3D printer, with different diameter sizes ( D S : 80 mm and 110 mm), to assist in monitoring the diameter changes. The SMS sensor was placed on the printed structure and fixed at two points, such that, by reducing the diameter of the structure, the sensor presents dips or peaks shift of the transmittance spectrum due to the induced curvature and strain. Three values were used for the spacing between the fixation points ( F P ): (a) 5 mm, (b) 10 mm, and (c) 15 mm. For each choice of fixation points, D S = 80 mm: (a) a sensitivity of −0.876 nm/mm, R 2 of 0.9909 and a dynamic range of 5 mm; (b) a sensitivity of −0.3892 nm/mm, R 2 of 0.9954 and a dynamic range of 4 mm; and (c) a sensitivity of −0.768 nm/mm, R 2 of 0.9811 and a dynamic range of 2 mm. For D S = 110 mm, the sensor presents for each choice of fixation points: (a) a sensitivity of −0.22 nm/mm, R 2 of 0.9979 and a dynamic range of 8 mm; (b) a sensitivity of −0.2284 nm/mm, R 2 of 0.9888 and a dynamic range of 6 mm; and (c) a sensitivity of −0.691 nm/mm, R 2 of 0.9892 and a dynamic range of 3.5 mm.

1. Introduction

Radial growth control is observed in several applications. In many areas, this monitoring plays an important role. In the oil or gas transportation infrastructure, the pressure in the pipeline is high, causing deformation and fatigue and, consequently, a disruption [1]. Pipelines deform when the deformation exceeds the established limit, which may be caused by the environment when natural disasters, such as landslides and earthquakes, occur or theft of material transported in pipelines happens. The corrosion process is also one of the main factors contributing to accidents in pipelines. In both cases, they can produce significant environmental damage, product loss, financial problems, and sometimes the loss of life from explosions [2,3]. In another example, the monitoring of the tree diameter change is directly related to irrigation because it depends on the soil water deficit. Trees are essential in the global circulation of heat and water. In addition, tree growth is affected by the CO2 rate and air pollutants [4,5,6,7,8]. The use of optical sensors for these cases is interesting because they present characteristics, such as: immunity to electromagnetic interference, compact size, resistance to pressure, heat, and corrosion, and the possibility of transmission over long distances.
Multimodal Interference (MMI) devices based on fiber optics have been extensively investigated in recent years for different applications as sensors to detect physical parameters, such as temperature [9], strain [10], vibration [11], and flow rate [12]. Optical fiber sensors (OFS) offer many advantages: They are not susceptible to electromagnetic interference, have low attenuation, are lightweight, can survive harsh environments, and tolerate high temperatures. There are several types of MMI structures, including: Sagnac Interferometer [13], Fabry-Perot Interferometer [14], and Singlemode–Multimode–Singlemode (SMS) [15]. The most common MMI structure is SMS [15,16]. This structure is formed of a short segment of multimode fiber (MMF) between two single-mode fibers (SMFs). SMS sensor is based on the core diameter mismatch (CDM) technique. The mechanism consists of a mode-coupling to transfer optical power between the core mode and higher-order modes of the cladding through mismatched sections. In addition, SMS presents the advantages of optical fiber over conventional measurement techniques, the low cost of production, flexible design, ease of fabrication, compact size, and high sensitivity [17,18,19].
In this work, we investigate a method for diameter monitoring using a traditional SMS structure. We use an experimental setup that uses the principle of the strain gauge based on SMS for diameter monitoring. We develop a structure in a 3D printer so that it was possible to perform the analysis of the diameter variation of different structures. The SMS sensor is put on the strain gauge and fixed on it in three points where the distance of fixation points is 5, 10, and 15 mm.

2. Experimental Setup

A traditional SMS structure consists of a short MMF section spliced between two SMFs, as depicted in Figure 1. The light is injected from the input SMF into the MMF, where higher order and fundamental modes are excited, and interference between the different modes occurs while the light beam propagates along the MMF section [11,12]. Due to higher modes excitation, the optical power coupled to the output SMF depends on the amplitudes and phases of the MMF modes, and this dictates the transmission spectral response at the output SMF. The MMF couples part of the light that travels along the core of the input SMF to the cladding of the output SMF, and this coupling induces a loss of power in the transmitted signal that travels along the core [20,21,22].
In this work an experimental setup was proposed, as shown in Figure 2. The transmission spectrum of the SMS sensor was monitored with an Optical Spectrum Analyzer (Anritsu, MS9740A). The sensors assembled in this work are fabricated with the core/cladding diameters of the SMF 8.2 / 125 μm (Corning SMF-28, Inc., Corning, NY, USA) and for the step-index MMF section, the core/cladding diameters are 105 / 125 μm (FG105-LCA from Thorlabs, Inc., Newton, NJ, USA). It is important to emphasize that for the lengths of the MMF section used in this work, it is now possible to observe the self imaging phenomenon because the length of the MMF is much shorter than the length needed to observe this phenomenon. According to Soldano, the self imaging phenomenon can be described as property of multimode waveguides where an input field profile is produced in single or multiple images at periodic intervals along the propagation direction of the guide [23].
The MMFs lengths were 15 mm. Two cylindrical structures were developed on a 3D printer, with different diameter sizes ( d 0 ), 80 mm and 110 mm, to assist in monitoring the diameter changes ( Δ d ). The sensing head was fixed at two points on the pieces, with different distances between the fixed points. Three values were used for the spacing between the fixed points ( F P ), 5 mm, 10 mm, and 15 mm. The linear translation stage was used to apply tension by moving the linear stage away from the fixed support. Thus, it is possible to introduce a strain in the sensor. The sensors present dips or peaks shift of transmittance spectrum due to the induced curvature and strain, as depicted in Figure 3.

3. Results and Discussion

The strain gauge with the SMS sensor was inserted in the linear stage transition that is controlled by a computer. A structure was created for monitoring the diameter using a 3D printer, as depicted in Figure 3a. This structure was created to simulate a diameter change in structures, such as pipelines and tree trunks, which need to have their diameter monitored. A strain and curvature are applied on the optical fiber by reducing the diameter of the structure ( d 0 ) and, therefore, it was possible to obtain the sensor response. This principle is observed in Figure 3b. The diameters of the structures are 80 and 110 mm ( d 0 ).

3.1. Structure Diameter with 80 mm

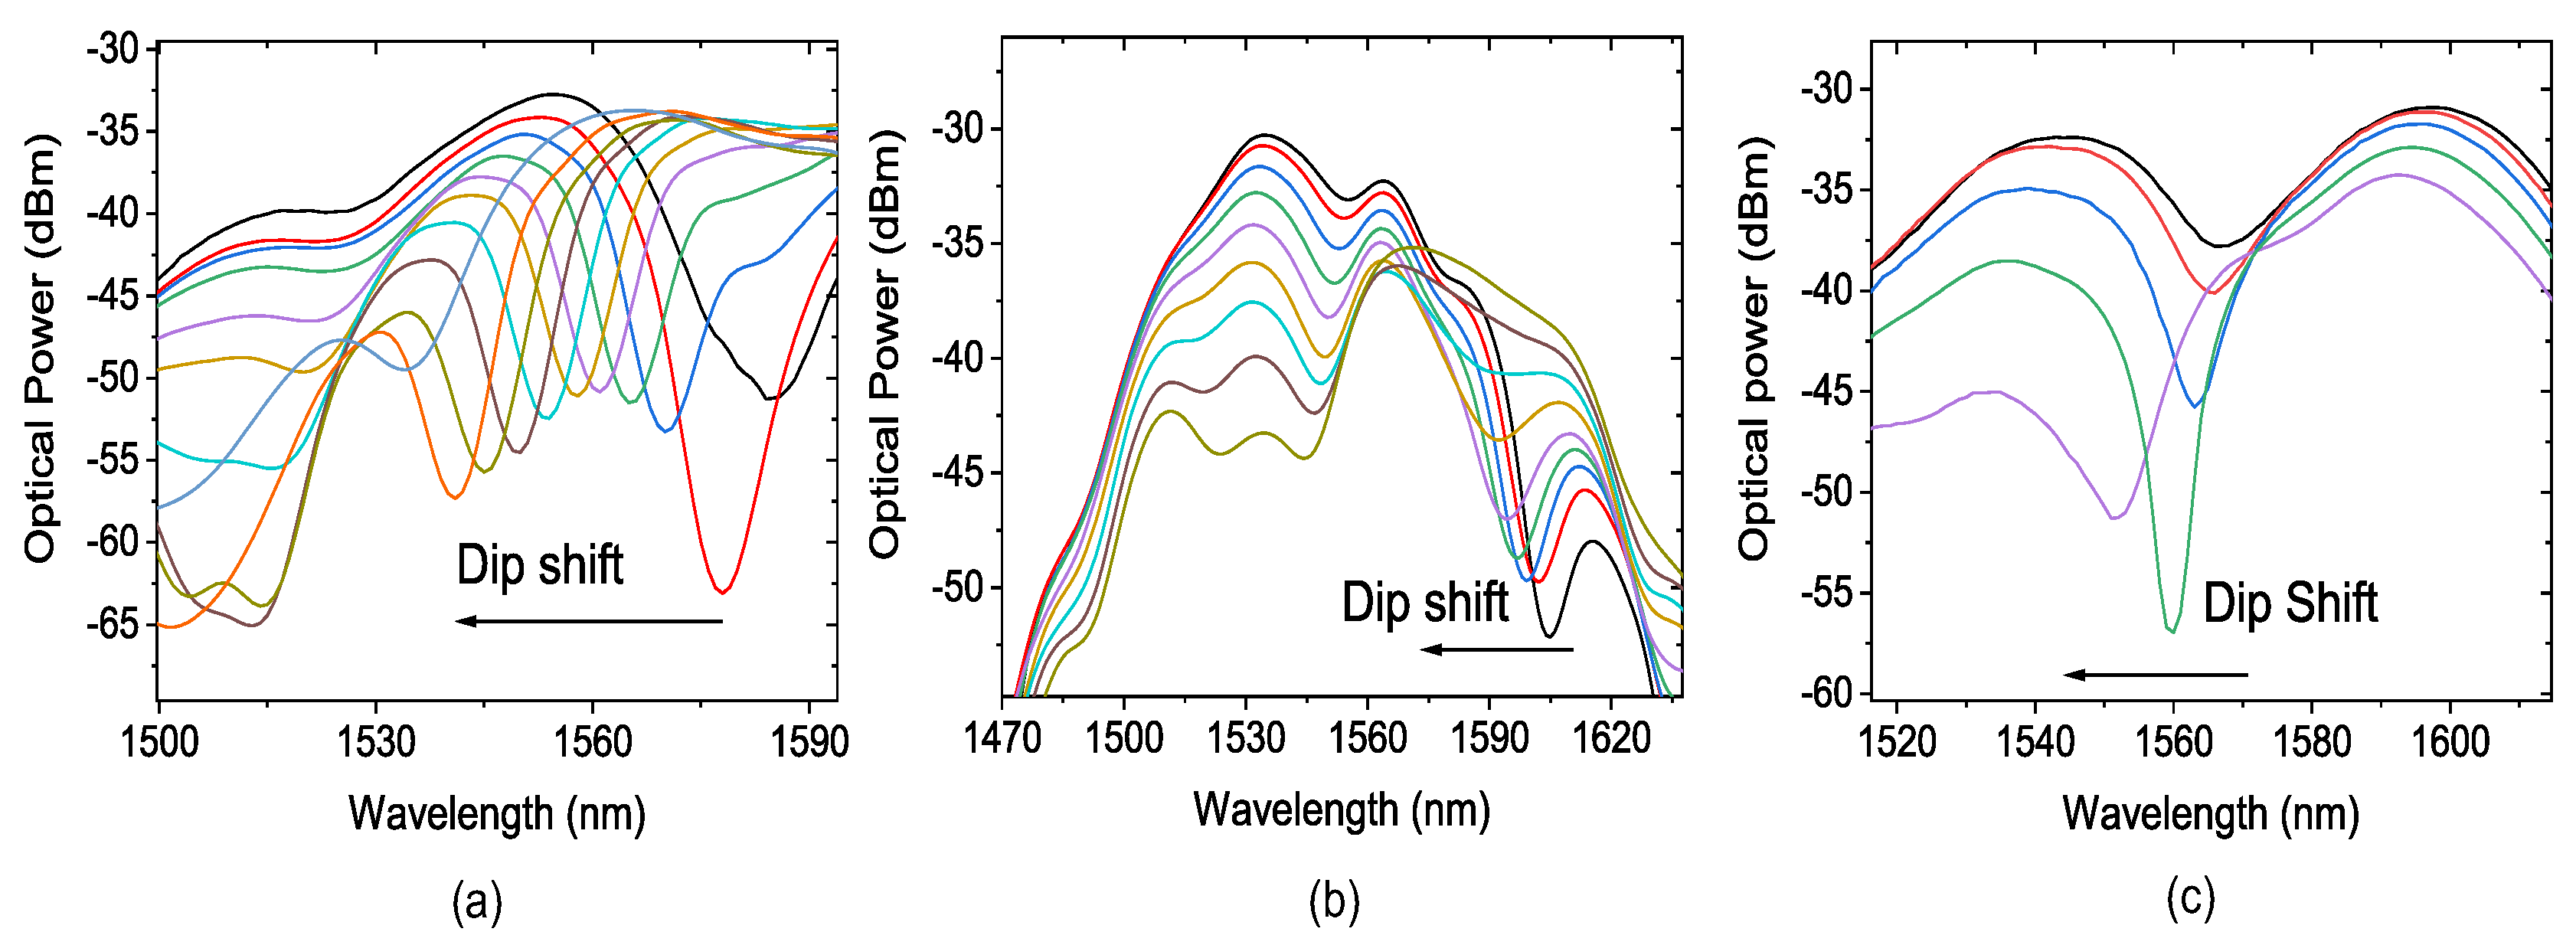
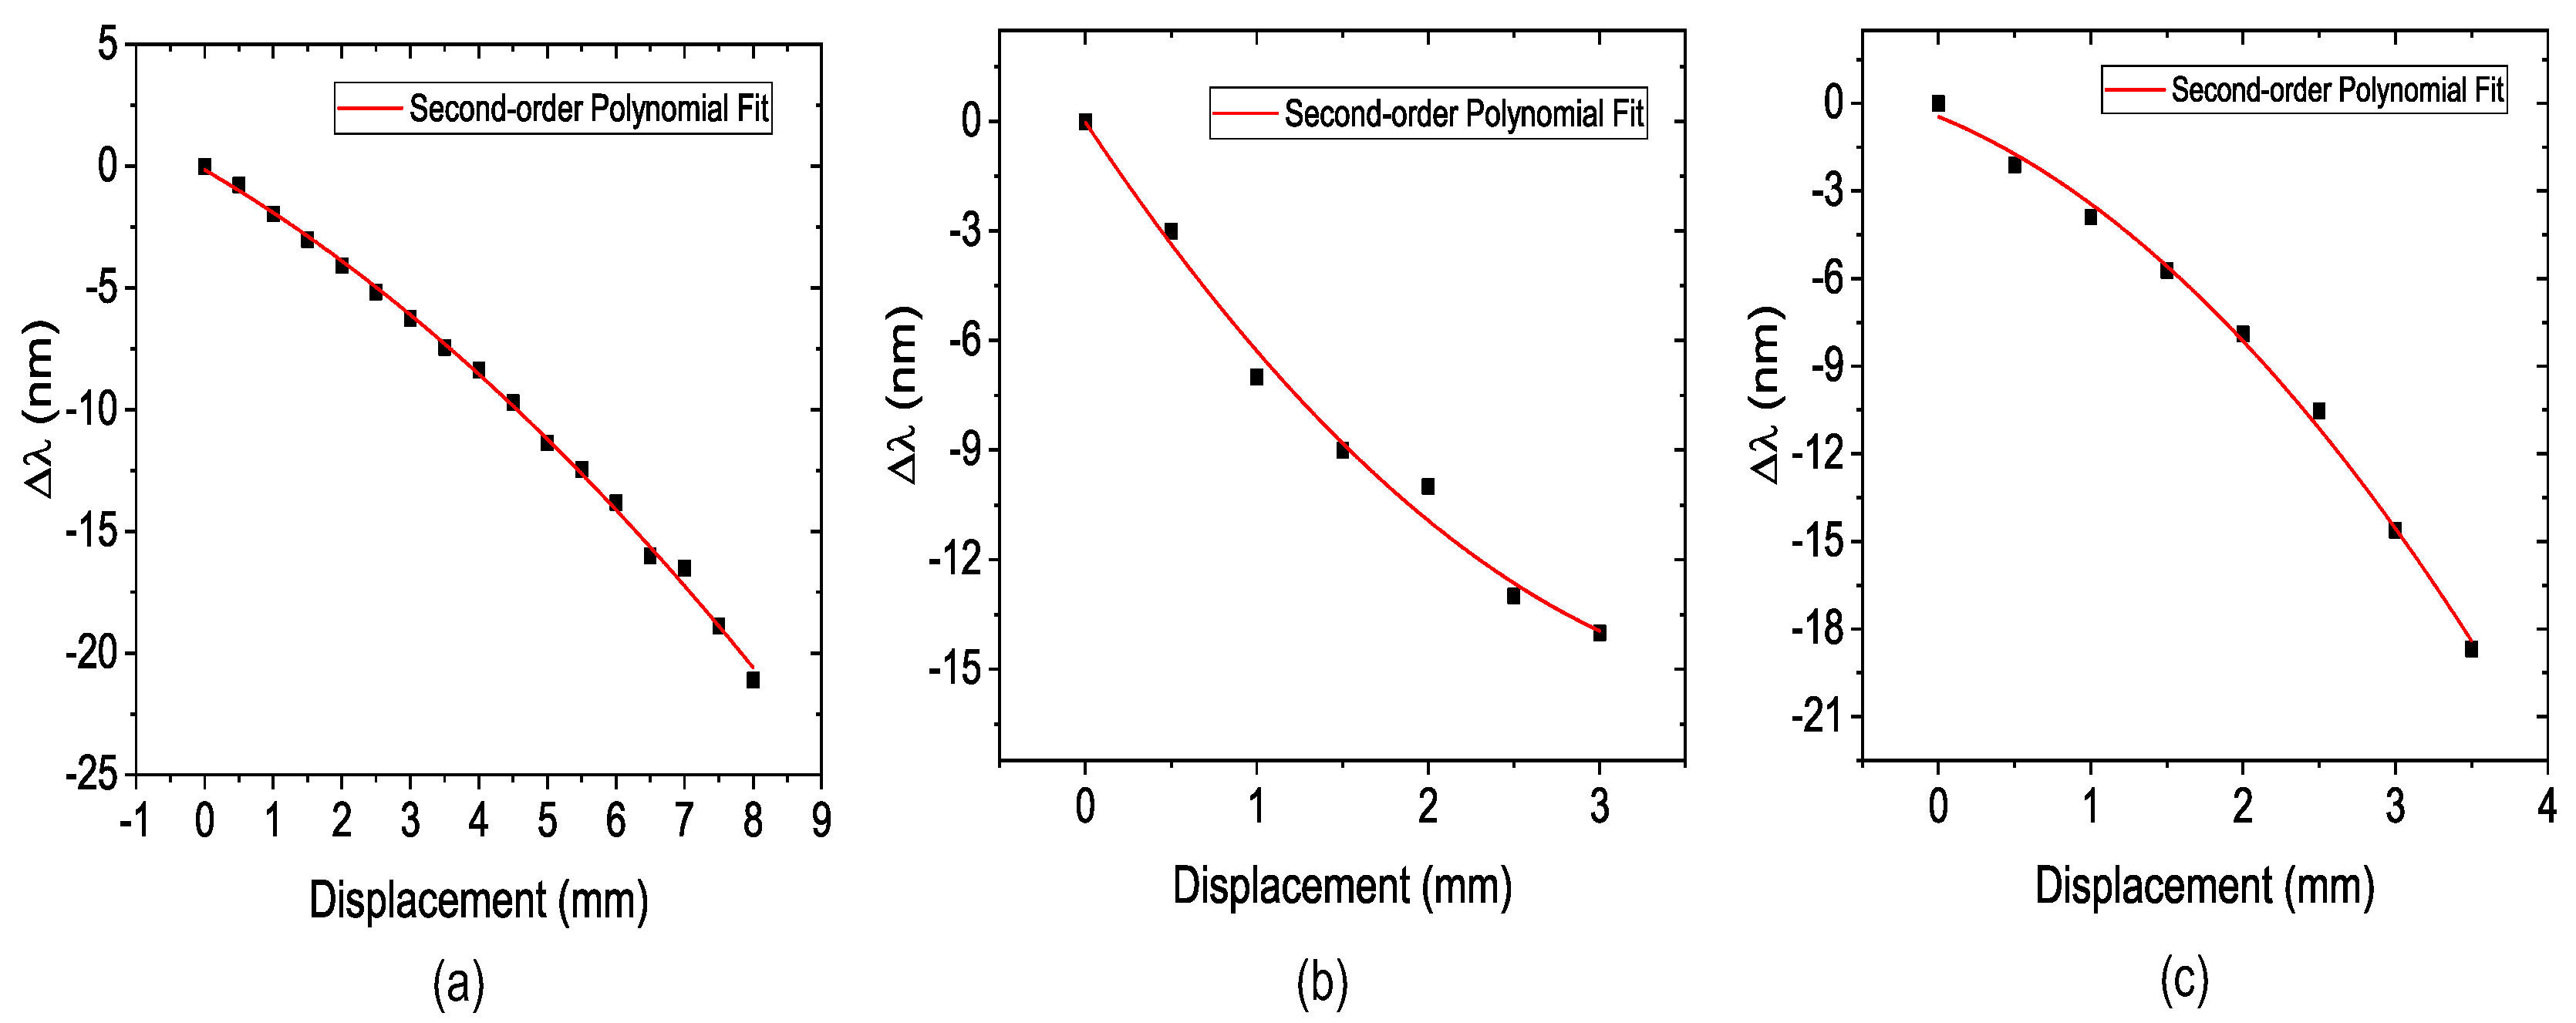
Firstly, the SMS sensor was placed on the cylindrical structure and it was fixed at 5 mm of the total length of the MMF section. Figure 4 shows the recorded spectrum of this experiment, and Figure 5 shows the second-order polynomial fitting result of the corresponding wavelength shift as a function of displacement. Figure 4a shows the dip shift of the transmittance spectrum due to the induced curvature strain in F P = 5 mm. It was possible to obtain a sensitivity of 0.876 nm/mm, coefficient of determination ( R 2 ) of 0.9909 , and the dynamic range ( Δ d ) of 5 mm, as depicted in Figure 5a. After that, the F P was increased to 10 mm. Figure 4b shows the dip shift of the transmittance spectrum due to the induced curvature strain in F P = 10 mm. The R 2 showed a small increase, to 0.9954 as shown in Figure 5b. The sensitivity obtained for this configuration was −0.3892 nm/mm and the dynamic range of 4 mm. Figure 4c shows the dip shift of the transmittance spectrum due to the induced curvature strain in F P = 15 mm. When the F P = L M M F = 15 mm, it was possible to observe an increase in the sensitivity, of 0.768 nm/mm, when comparing with the result for F P = 10 mm. R 2 and dynamic range showed a reduction, respectively, to 0.9811 and 2 mm, as depicted Figure 5c.

3.2. Structure Diameter with 110 mm

The second part of the experiment is similar to what was performed previously. Figure 6 shows the recorded spectrum of this experiment and Figure 7 shows the second-order polynomial fitting result of the corresponding wavelength shift as a function of displacement. For the F P = 5 mm, Figure 6a shows the peak shift of the transmittance spectrum due to the induced curvature strain, it was possible to obtain a sensitivity of 0.22 nm/mm, R 2 of 0.9979 and dynamic range of 8 mm, as depicted in Figure 7a. After that, the F P was increased to 10 mm. Figure 6b shows the peak shift of the transmittance spectrum due to the induced curvature strain in F P = 10 mm. The R 2 showed a decrease to 0.9888 , as shown in Figure 7b. The sensitivity obtained for this configuration was 0.2284 nm/mm and the dynamic range of 4.5 mm. When F P = L M M F = 15 mm, Figure 6c shows the peak shift of transmittance spectrum due to induced curvature and strain. It was possible to observe an increase in the sensitivity of 0.691 nm/mm when comparing with the result for F P = 10 mm. The R 2 and dynamic range showed a reduction, respectively, to 0.9892 and 3.5 nm, as depicted in Figure 7c.

4. Conclusions

In conclusion, we proposed an experimental investigation about the strain gauge based on traditional MMI structure for diameter monitoring. We developed an experimental setup for this investigation. The setup fabrication and the proposed sensor are simple and repeatable. The results demonstrate that it is possible to monitor the diameter using the strain gauge based on the SMS sensor proposed in this work. The results present good sensitivities values, excellent coefficient of determination, and dynamics range with several possibilities to practical application, such as in pipelines and tree trunk growth. This study presents preliminary results and the next step will be to analyze other possible configurations since, with the correct arrangement, it is possible to optimize the structure and it is characteristics.

Supplementary Materials

The following are available online at https://www.mdpi.com/article/10.3390/ecsa-8-11324/s1.

Author Contributions

Conceptualization, V.C.; Methodology, V.C. and J.L.S.; Data curation, V.C.; Investigation, V.C.; Resources, J.L.S.; Writing—Original draft preparation, V.C.; Supervision, Writing—reviewing and editing, P.C., M.T.G. and J.C.; Supervision, P.C., M.T.G., C.F., O.F., J.C. and J.L.S. All authors have read and agreed to the published version of the manuscript.

Institutional Review Board Statement

Not applicable.

Informed Consent Statement

Not applicable.

Data Availability Statement

Not applicable.

Acknowledgments

This study was financed in part by the Brazilian Funding Agencies Conselho Nacional de Desenvolvimento Científico e Tecnológico (CNPq) and Coordenação de Aperfeiçoamento de Pessoal de Nível Superior (CAPES). It was supported by the Federal University of Pará (UFPA) and the Military Institute of Engineering (IME) from Brazil and the Institute for Systems and Computer Engineering, Technology and Science (INESC TEC) and the Department of Physics and Astronomy, Faculty of Sciences, University of Porto from Portugal.

Conflicts of Interest

The authors declare no conflict of interest.

References

  1. Amaro, R.L.; Drexler, E.S.; Slifka, A.J. Fatigue crack growth modeling of pipeline steels in high pressure gaseous hydrogen. Int. J. Fatigue 2014, 62, 249–257. [Google Scholar] [CrossRef]
  2. Yanga, Y.; Hongb, C.; Abrob, Z.A.; Wanga, L.; Yifan, Z. A new Fiber Bragg Grating sensor based circumferential strain sensorfabricated using 3D printing method. Sens. Actuators A Phys. 2019, 295, 663–670. [Google Scholar] [CrossRef]
  3. Ren, L.; Jia, Z.G.; Li, H.N.; Song, G. Design and experimental study on FBG hoop-strain sensor in pipeline monitoring. Opt. Fiber Technol. 2014, 20, 15–23. [Google Scholar] [CrossRef]
  4. Cohen, M.; Goldhamer, D.A.; Fereres, E.; Girona, J.; Mata, M. Assessment of peach tree responses to irrigation water ficits by continuous monitoring of trunk diameter changes. J. Hortic. Sci. Biotechnol. 2001, 76, 55–60. [Google Scholar] [CrossRef]
  5. Martín-Palomo, M.; Corell, M.; Girón, I.; Andreu, L.; Trigo, E.; López-Moreno, Y.; Torrecillas, A.; Centeno, A.; Pérez-López, D.; Moriana, A. Pattern of trunk diameter fluctuations of almond trees in deficit irrigation scheduling during the first seasons. Agric. Water Manag. 2019, 218, 115–123. [Google Scholar] [CrossRef] [Green Version]
  6. Çakir, R. Effect of water stress at different development stages on vegetative and reproductive growth of corn. Field Crops Res. 2004, 89, 1–16. [Google Scholar] [CrossRef]
  7. Corella, M.; Martín-Palomoa, M.; Girónb, I.; Andreua, L.; Galindoa, A.; Centenod, A.; Pérez-Lópezd, D.; Morianaa, A. Stem water potential-based regulated deficit irrigation scheduling for olive table trees. Agric. Water Manag. 2020, 242, 106418. [Google Scholar] [CrossRef]
  8. Goldhamer, D.A.; Fereres, E. Irrigation scheduling of almond trees with trunk diameter sensors. Irrig. Sci. 2004, 23, 11–19. [Google Scholar] [CrossRef]
  9. Wang, Q.; Meng, H.; Fan, X.; Zhou, M.; Liu, F.; Liu, C.; Wei, Z.; Wang, F.; Tan, C. Optical fiber temperature sensor based on a Mach-Zehnder interferometer with single-mode-thin-core-single-mode fiber structure. Rev. Sci. Instrum. 2020, 91, 015006. [Google Scholar] [CrossRef]
  10. Fernandes, C.S.; Rocco Giraldi, M.T.M.; de Sousa, M.J.; Costa, J.C.W.A.; Rodrigues, L.D.; da Silva, F.R.B.; Ferreira, G.F.; dos Reis, R.A.N. Strain sensing based on a core diameter mismatch structure. Microw. Opt. Technol. Lett. 2019, 61, 2013–2019. [Google Scholar] [CrossRef]
  11. Fernandes, C.S.; Giraldi, M.T.M.R.; de Sousa, M.J.; Costa, J.C.W.A.; Gouveia, C.; Jorge, P.; Franco, M.A.R. Curvature and Vibration Sensing Based on Core Diameter Mismatch Structures. IEEE Trans. Instrum. Meas. 2016, 65, 2120–2128. [Google Scholar] [CrossRef] [Green Version]
  12. Costa, J.; Franco, M.A.; Serrão, V.A.; Cordeiro, C.M.; Giraldi, M.T. Macrobending SMS fiber-optic anemometer and flow sensor. Opt. Fiber Technol. 2019, 52, 101981. [Google Scholar] [CrossRef]
  13. Ruan, J. Fiber curvature sensor based on concave-heterotypic cascaded fiber Sagnac interferometer. Microw. Opt. Technol. Lett. 2020, 62, 3645–3649. [Google Scholar] [CrossRef]
  14. Li, X.; Chen, N.; Zhou, X.; Gong, P.; Wang, S.; Zhang, Y.; Zhao, Y. A review of specialty fiber biosensors based on interferometer configuration. J. Biophotonics 2021, 14, e202100068. [Google Scholar] [CrossRef] [PubMed]
  15. Wu, Q.; Qu, Y.; Liu, J.; Yuan, J.; Wan, S.P.; Wu, T.; He, X.D.; Liu, B.; Liu, D.; Ma, Y.; et al. Singlemode-Multimode-Singlemode Fiber Structures for Sensing Applications—A Review. IEEE Sens. J. 2021, 21, 12734–12751. [Google Scholar] [CrossRef]
  16. Wang, K.; Dong, X.; Köhler, M.H.; Kienle, P.; Bian, Q.; Jakobi, M.; Koch, A.W. Advances in Optical Fiber Sensors Based on Multimode Interference (MMI): A Review. IEEE Sens. J. 2021, 21, 132–142. [Google Scholar] [CrossRef]
  17. Korposh, S.; James, S.W.; Lee, S.W.; Tatam, R.P. Tapered Optical Fibre Sensors: Current Trends and Future Perspectives. Sensors 2019, 19, 2294. [Google Scholar] [CrossRef] [Green Version]
  18. Lu, X.; Thomas, P.J.; Hellevang, J.O. A Review of Methods for Fibre-Optic Distributed Chemical Sensing. Sensors 2019, 19, 2876. [Google Scholar] [CrossRef] [PubMed] [Green Version]
  19. Roriz, P.; Silva, S.; Frazão, O.; Novais, S. Optical Fiber Temperature Sensors and Their Biomedical Applications. Sensors 2020, 20, 2113. [Google Scholar] [CrossRef] [Green Version]
  20. Wu, Q.; Semenova, Y.; Wang, P.; Farrell, G. High sensitivity SMS fiber structure based refractometer—Analysis and experiment. Opt. Express 2011, 19, 7937–7944. [Google Scholar] [CrossRef]
  21. Wang, Q.; Farrell, G.; Yan, W. Investigation on single-mode-multimode-single-mode fiber structure. J. Light. Technol. 2008, 26, 512–519. [Google Scholar] [CrossRef]
  22. Li, Y.; Liu, Z.; Jian, S. Multimode interference refractive index sensor based on coreless fiber. Photonic Sens. 2014, 4, 21–27. [Google Scholar] [CrossRef] [Green Version]
  23. Soldano, L.B.; Pennings, E.C.M. Optical Multi-Mode Interference Devices Based on Self-Imaging: Principles and Applications. J. Ligthwave Technol. 1995, 13, 615–627. [Google Scholar] [CrossRef] [Green Version]
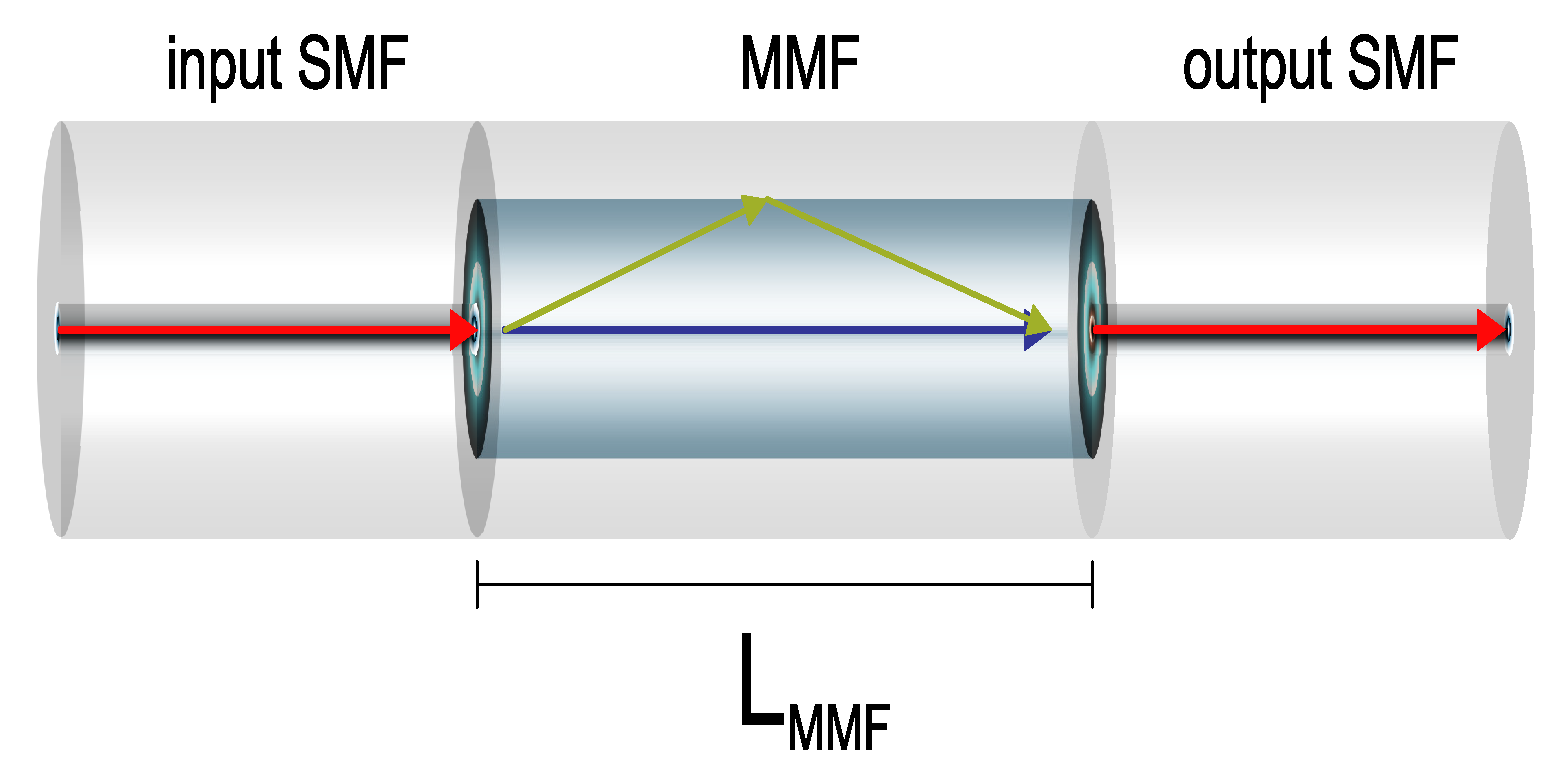
Figure 1. Schematic of the MMI sensor based on the Core Diameter Mismatch technique.
Engproc 10 00068 g001
Figure 2. Schematic of the experimental setup for the diameter analysis that demonstrates the diameter reduction using a linear translation stage.
Engproc 10 00068 g002
Figure 3. (a) Cylindrical structure developed on a 3D printer. (b) Mechanism of operation of the structure that demonstrates the diameter reduction.
Engproc 10 00068 g003
Figure 4. Wavelength shift as a function of displacement. (a) The sensor as F P = 5 mm and D S = 80 mm. (b) The sensor as F P = 10 mm and D S = 80 mm. (c) The sensor as F P = 15 mm and D S = 80 mm.
Engproc 10 00068 g004
Figure 5. Transmission spectrum of the sensor. (a) The sensor as F P = 5 mm and D S = 80 mm. (b) The sensor as F P = 10 mm and D S = 80 mm. (c) The sensor as F P = 15 mm and D S = 80 mm.
Engproc 10 00068 g005
Figure 6. Wavelength shift as a function of displacement. (a) The sensor as F P = 5 mm and D S = 110 mm. (b) The sensor as F P = 10 mm and D S = 110 mm. (c) The sensor as F P = 15 mm and D S = 110 mm.
Engproc 10 00068 g006
Figure 7. Transmission spectrum of the sensor. (a) The sensor as F P = 5 mm and D S = 110 mm. (b) The sensor as F P = 10 mm and D S = 110 mm. (c) The sensor as F P = 15 mm and D S = 110 mm.
Engproc 10 00068 g007
Publisher’s Note: MDPI stays neutral with regard to jurisdictional claims in published maps and institutional affiliations.