Abstract
Graphene oxide (GO) has the advantage of a uniform dispersion in water, which is essential for producing high-quality sensors. In this research, we monitor the production of a GO sensor by measuring the change in conductance of the aqueous GO during painting, heating and drying, and converting GO to reduced Graphene oxide with a heat shock. Subsequent testing of the sensor with three-point bending on the compression side of a substrate revealed a clean conductance signal and an anhysteretic and almost linear calibration curve.
1. Introduction
Graphene oxide (GO), the oxidized form of graphene, has the significant advantage over graphene that the former is hydrophilic so that aqueous dispersions of GO are stable due to the absorption of water. This property makes GO an ideal precursor material for producing strain and force sensors. Furthermore, the negative charge of GO in water [1] leads to electric repulsion, explaining the interlayer distance of 11–13 Å [2], a property which contributes to the uniformity of the dispersions. GO, in contrast to graphene, is an insulator. GO can be reduced to Graphene (rGO, reduced graphene oxide) chemically or thermally. Dried graphene inks and graphene dispersed in polymers are piezoresistive, i.e., their conductance is a function of stress and strain.
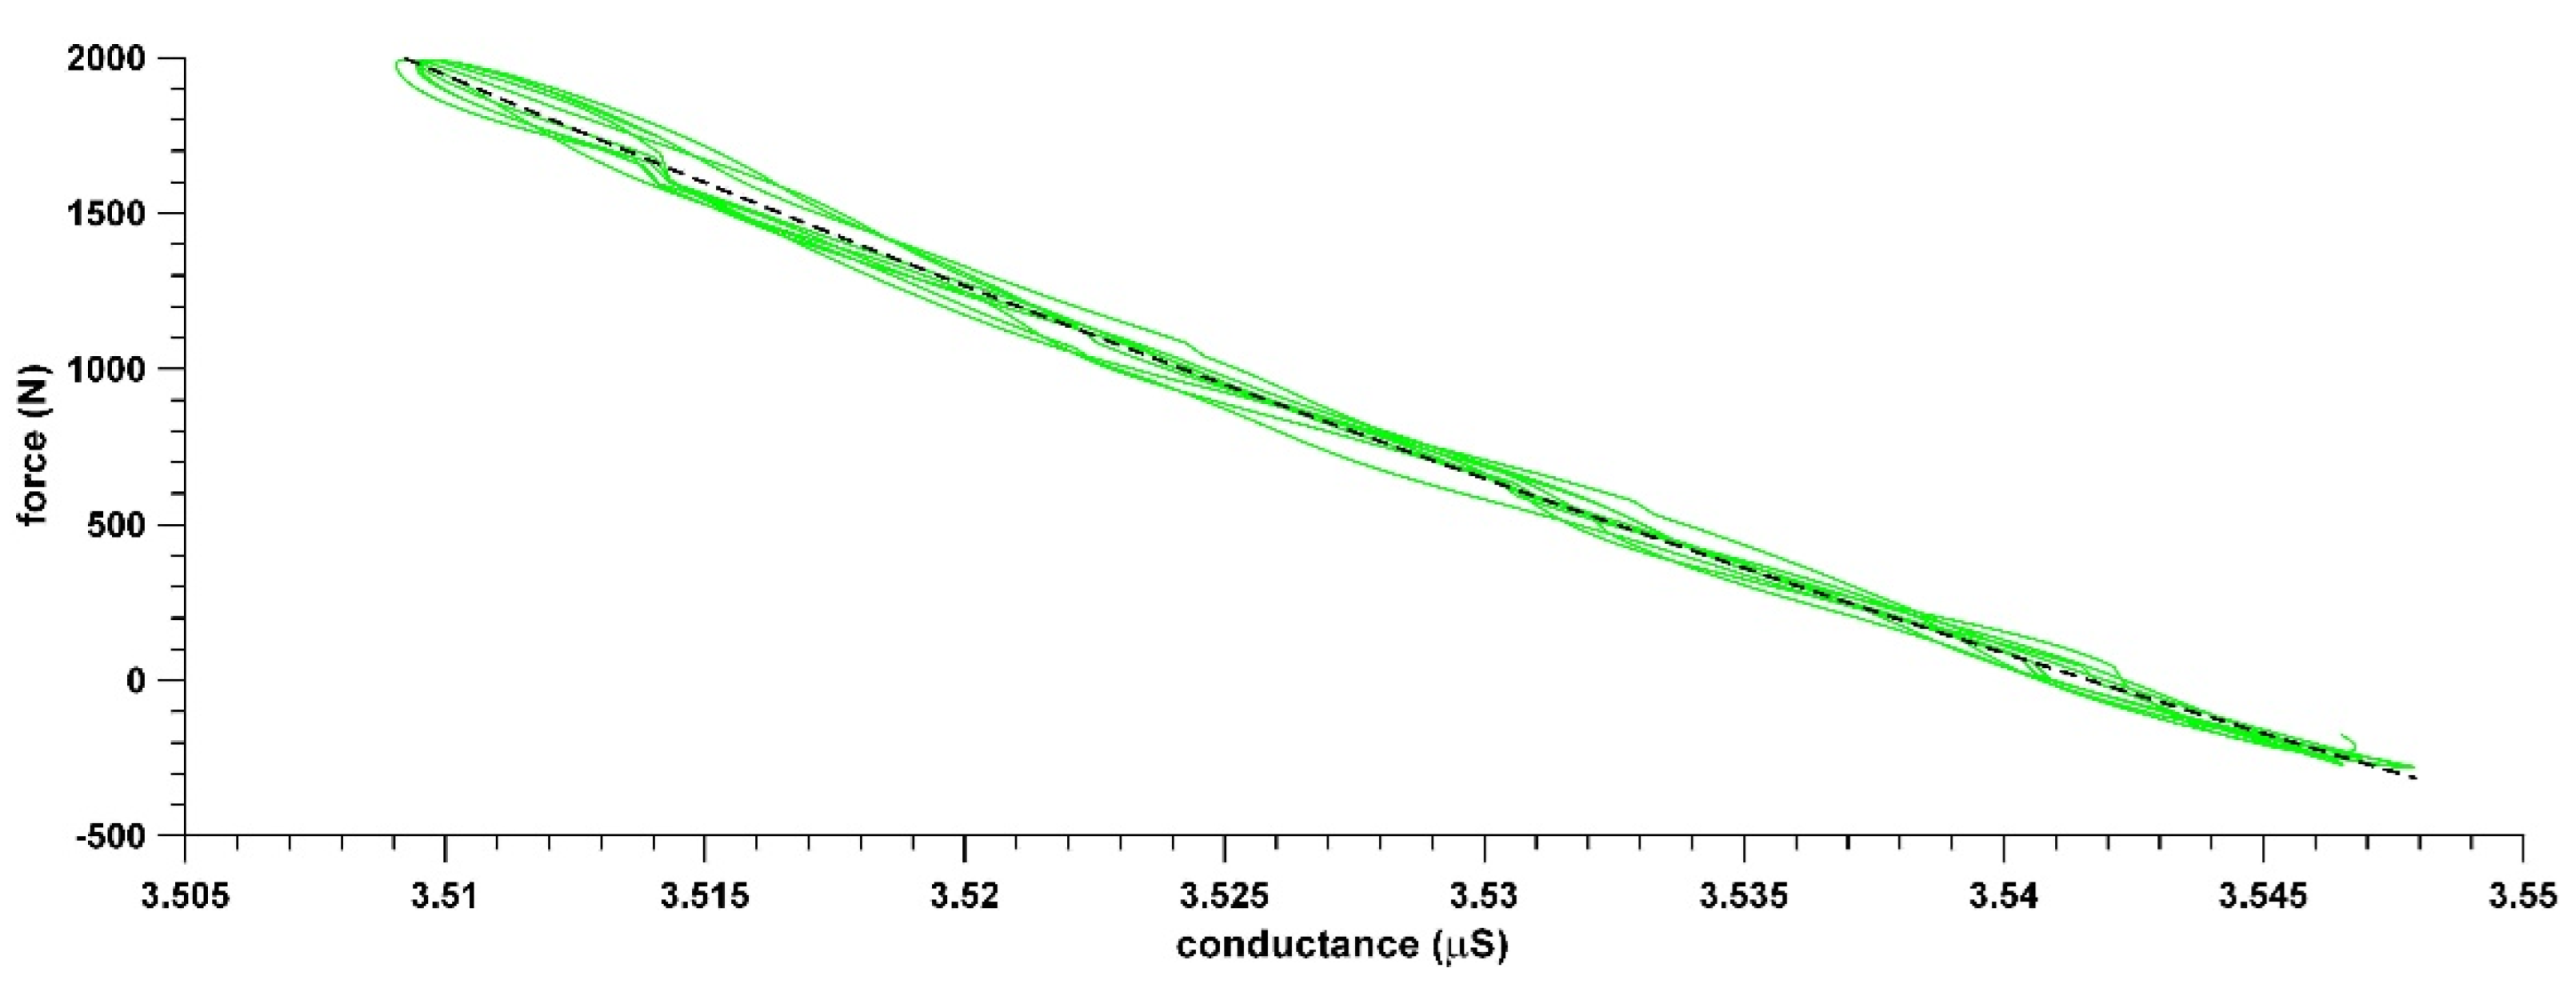
In a preliminary experiment [3] of tensile testing and calibrating a glass fibre composite infused with GO and reduced to rGO at 80 °C for 15 h, the authors found that the calibration curve was almost linear, and the hysteresis was negligible (Figure 1). To investigate these extraordinary electromechanical properties further, pure GO/rGO, preferably without any matrix material, i.e., water-based, needs to be tested.

Figure 1.
Force vs. conductance plot of an rGO glass fibre composite under tensile testing [3].
Thus, the aim of this paper was (a) to explore how the manufacturing process, including painting, drying and reduction of GO to an rGO sensor can be monitored in terms of the conductance; and (b) to test the quality of the shunt mode sensor under tension and compression. The quality refers specifically to the drift and noise of the conductance signal and the subsequent calibration curve derived, which would be monitored for hysteresis, linearity and ease of curve-fitting. Furthermore, other aspects of the signal, such as sensitivity, accuracy and the saturation point, would be explored.
2. Materials and Methods
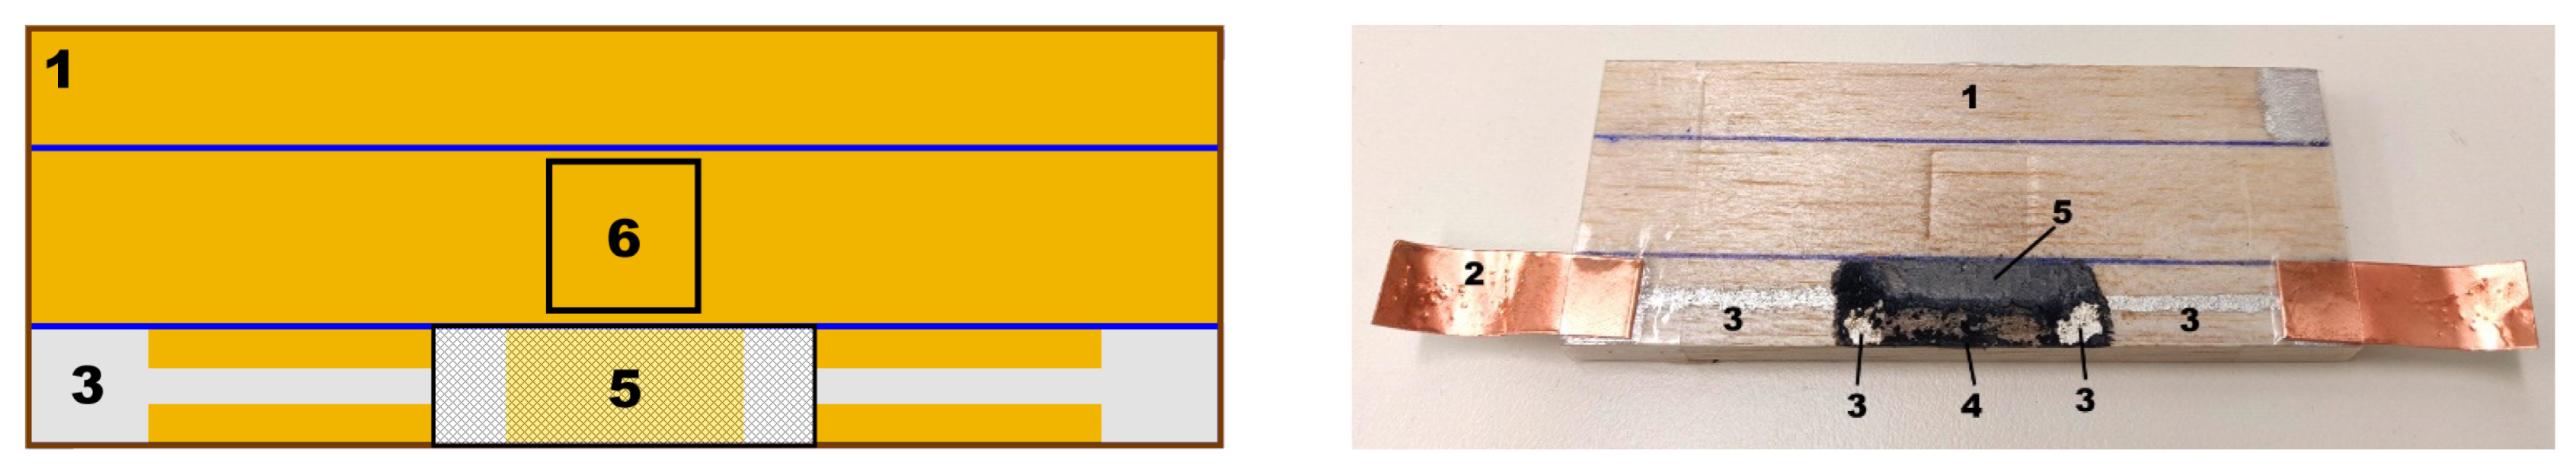
To monitor the production of a graphene sensor, we painted two dumbbell-shaped silver electrodes (Silver Conductive Paint, Electrolube, Hannover, Germany) on a wooden substrate (100 × 35 × 5 mm; Figure 2). We connected these electrodes via copper foil to a voltage divider with a reference resistor of 68 kΩ, and continuously recorded the change in voltage across the reference resistor at 2 Hz. The open circuit was then closed by painting a GO solution (10 mg/mL water-based solution, SupraG, Melbourne, Australia) across the electrodes. The fluid GO dispersion was dried with a heat gun (Master Appliance, Racine, WI, USA). This process of painting, heating and drying was repeated twice, and after painting a third time, the GO was left to air dry for approximately 2 h. Subsequently, the temperature of the heat gun was pre-set to 350 °C as per the recommendation of Sengupta et al. [4], and GO was reduced to rGO.
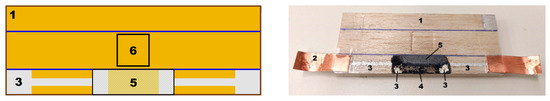
Figure 2.
Sensor layout (left) and compound (right); 1: wooden substrate; 2: copper electrodes; 3: silver electrodes; 4: rGO flaking and blown off the wooden substrate and the silver electrodes by the heat gun; 5: intact rGO sensor; 6: point of application of the central force for 3-point bending.
After the reduction process to rGO, the shunt-mode sensor was tested by a three-point bending test (Instron 5967, Instron, Norwood, MA, USA), with the sensor located on the compression side. A triangular force wave profile was applied with a frequency of 0.03 Hz and loading, unloading and dwell (zero force) segments of 11, 10 and 12 s, respectively, with a maximum force of 200 N. The measured voltage sampling frequency across the reference resistor was increased to 20 Hz. The data processing was carried out by aligning the peaks of the force and voltage signals, and the voltage was converted to the conductance of the sensor, which increased as the force did. Finally, the force-conductance data were fitted with a 4th-order polynomial to establish the calibration curve.
3. Results
3.1. Monitoring of the Production Process
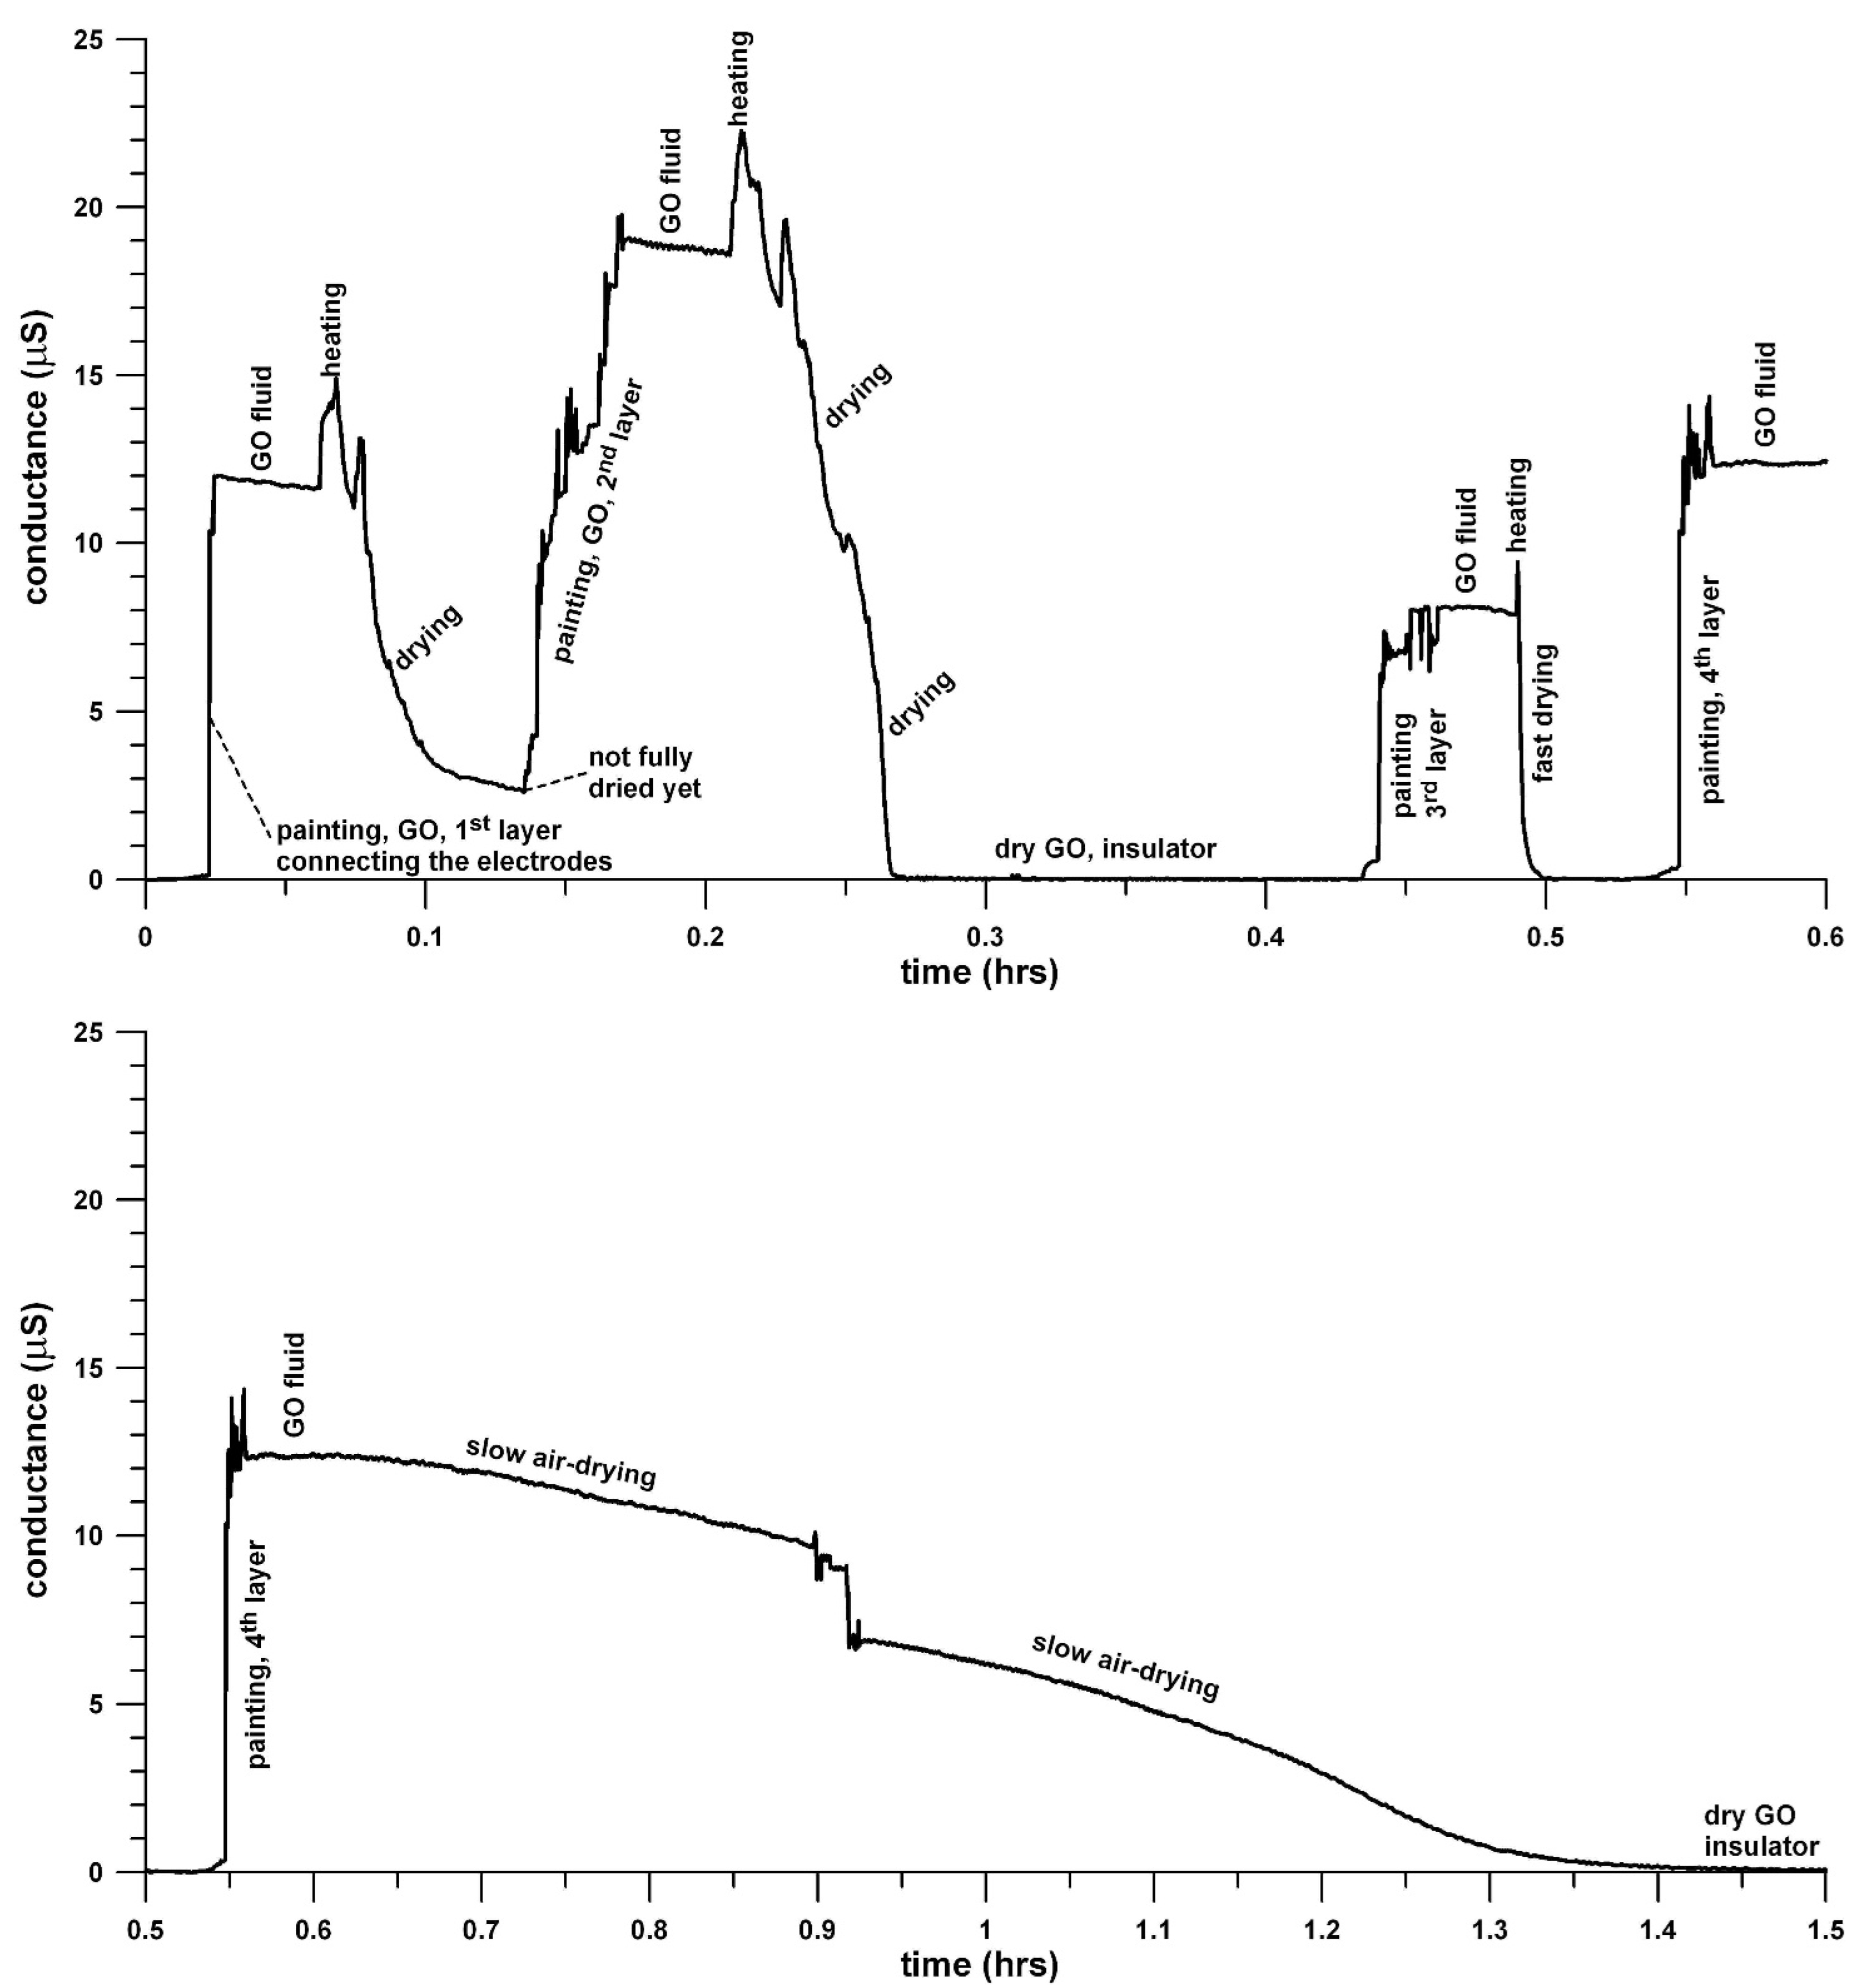
Figure 3 and Figure 4 show the conductance, G, changing throughout the manufacturing process of the sensor. When painting the GO solution across the electrodes, we closed the circuit, and the conductance increased from 0 to 5–20 μS. The heating process of the fluid GO dispersion with an air gun increased the conductance by a further 2–5 μS until the water started to evaporate, and the conductivity dropped to zero when a dry layer of GO was left. After air drying the GO for approximately 2 h, we reduced the GO layer to rGO. During the reduction process, the conductivity spiked to 0.8–1 S within 0.5 s, but it dropped immediately through a power decay with an exponent of −0.24 (= d logt/d logG).

Figure 3.
Conductance vs. time graph of the manufacturing process (data sampling frequency 2 Hz).
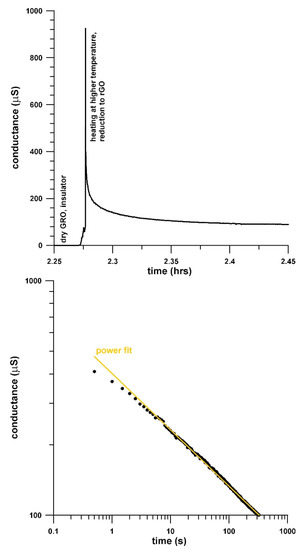
Figure 4.
Conductance vs. time graph of the reduction process, GO to rGO (data sampling frequency 2 Hz).
3.2. Calibration of the rGO Sensor
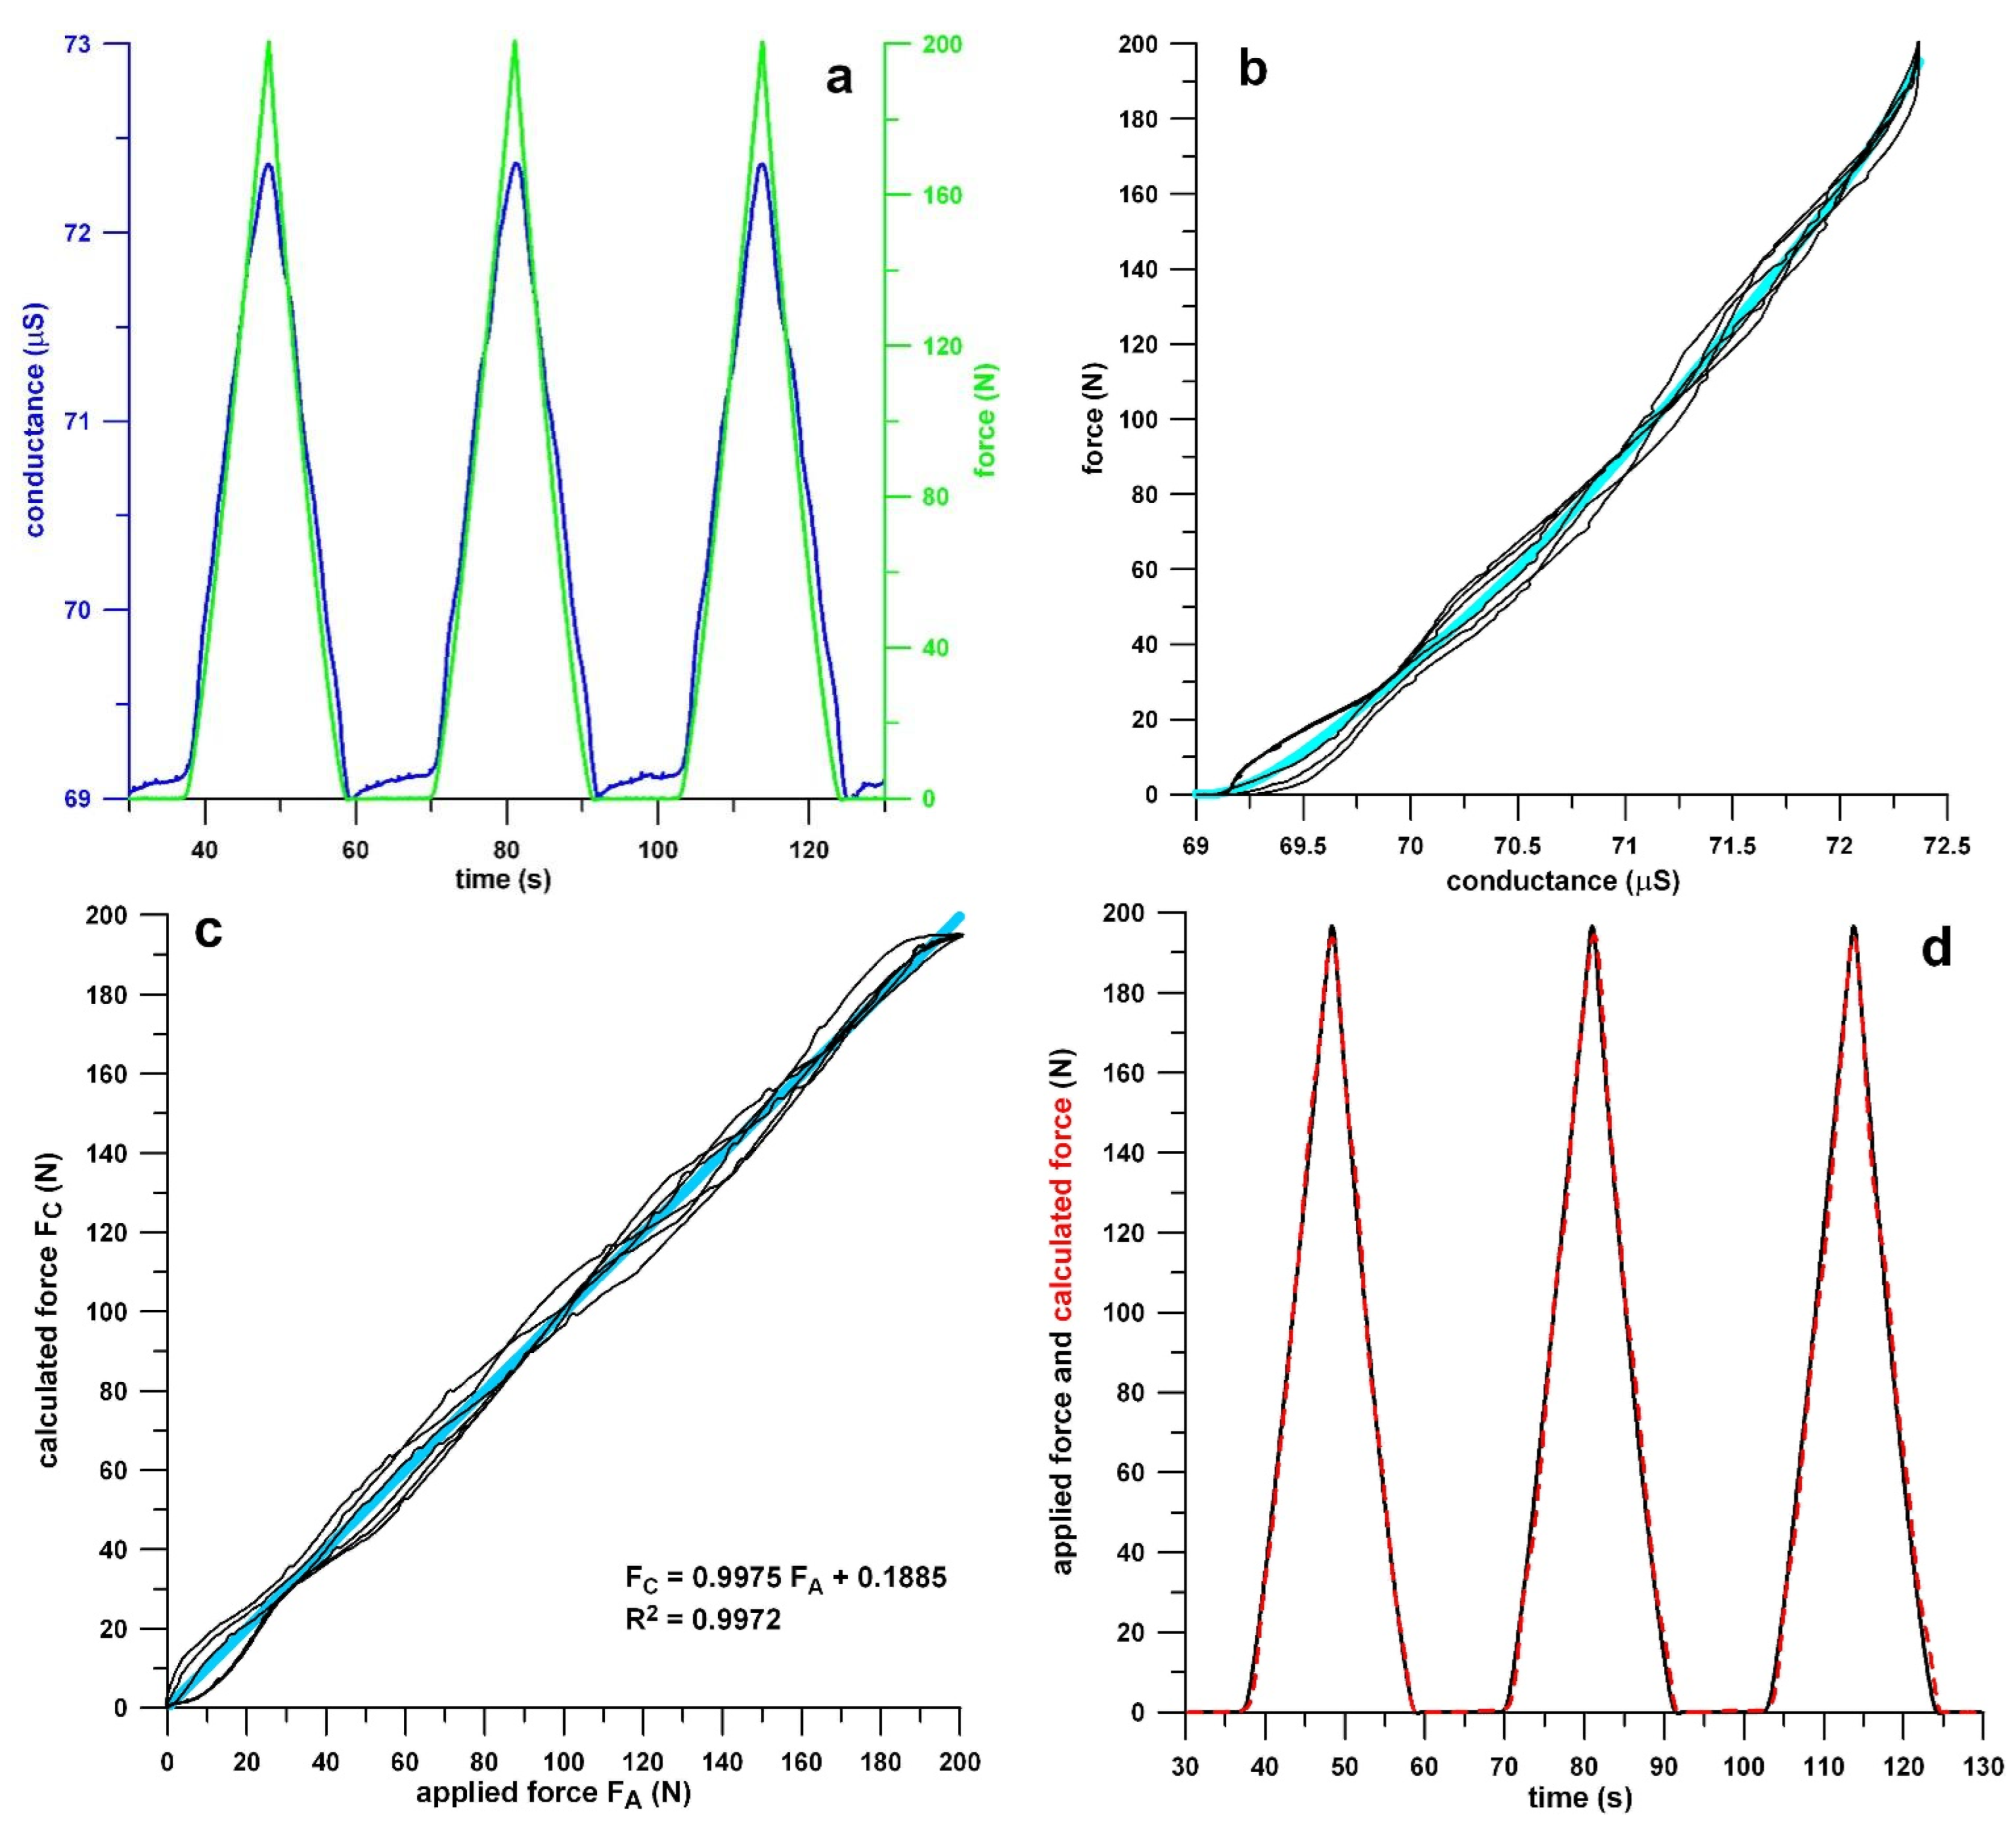
Figure 5 shows the procedure and the outcome of the calibration process. In Figure 5b, the calibration curve, force F vs. conductance G, is slightly curved and far from saturation (where dF/dG → ∞). From the three-point bending equations, the strain (ε) at the centre of the wooden substrate is merely 0.57% (at 200 N, and a deflection of 1.07 mm).
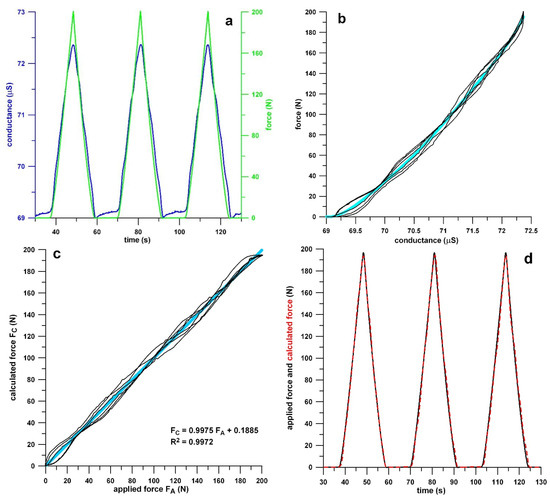
Figure 5.
(a) conductance (blue graph) and force (green graph) vs. time; (b) calibration curve of force vs. conductance, fitted with a 4th-order polynomial (light blue); (c) force calculated from the calibration curve vs. force applied by the material testing machine, fitted with a linear function (light blue); (d) applied (black graph) and calculated (red graph) forces vs. time.
The force was recalculated from the calibration curve, resulting in a good match of the originally applied force and the recalculated one (Figure 5c), resulting in an RMSE of 3.4 N. The RMSE% was <10% at forces >50 N, and <5% at forces >75 N. Alternatively, instead of the force accuracy, the time accuracy can be calculated. Although the hysteresis was negligible (Figure 5b,c), the calculated force lagged the original by 0.25 s at small forces, decreasing linearly to 0 s at the peak force (1.2% of the loading–unloading cycle and 0.76% of the total cycle including the dwell segment). The force and time accuracy data, as well as the comparison of the applied and calculated forces in Figure 5d, proved that the sensor is sufficiently accurate.
4. Discussion
Monitoring of the production process of the sensor before reducing GO to the extent shown in Figure 3 depends on the electrolytic properties of the aqueous GO solution, as GO is an insulator. These properties can be due to ionic impurities of the aqueous solution and possibly to the negatively charged GO sheets. Heating of the electrolyte solution increased the conductivity [5]. As water evaporated during heating, the concentration of the electrolyte solution increases, resulting in an increase of conductance first, followed by a decrease [5], thereby counteracting the temperature effect. We can clearly observe this increasing conductance behaviour in Figure 3, when heating the solution after painting.
The temperature of 350 °C was selected as per the recommendations in the literature [4]. However, the heat was applied as a thermal shock instead of baking a GO sensor in the oven at 80 °C for 15 h [3]. Wood chars gradually from 250 °C onwards, yet we applied the heat shock only for a few seconds, so that the wood substrate was only very slightly charred (Figure 2). We removed the heat gun immediately when small parts of the sensor were blown off the wooden substrate and the silver electrode (Figure 2) by the strong airflow of the gun, which happened at the same time the conductance spiked up due to the reduction process (Figure 4). The sudden decrease (power law decay, Figure 4) of the conductance after reduction is evident, as temperature has a positive influence on the conductivity of graphene [6]. In contrast to metals, the conductance of Graphene increases during heating.
The calibration of the sensor served for evaluation of the quality of the conductance signal and the calibration curve, as well as the accuracy of the sensor. The voltage and conductance signals were very clean, unaffected by drift or noise (Figure 5a). The calibration curve exhibited an insignificant hysteresis (Figure 5b) and a slightly curved shape, ideal for curve-fitting with a polynomial function. The accuracy of the sensor is evaluated from two different aspects [7], which are either the force or the time accuracy. The former assumes that two force data (applied and calculated) occur at the same time but do not necessarily have the same magnitude, and the latter assumes that two force data (applied and calculated) have the same magnitude but do not necessarily occur at the same time. The accuracy of the sensor results from the magnitude of either the force or time difference, which was reported in the Results section.
It is surprising that the conductance of the sensor in the unloaded state is only 69 μS, which, based on the sensor’s dimensions, corresponds to a conductivity of approximately 1 S/m, considering that after evaporation of the water of the GO fluid, and after reduction, the sensor is supposed to consist of only rGO. In this case, the entire matrix of the sensor would be conductive, in the magnitude of 104–105 S/m [8], so that the number of conductive paths within the material is invariable and is no longer a function of force or stress. We therefore assume that the GO was not entirely reduced to rGO such that the matrix of the sensor is a mixture of conductive and insulating particles, ideal for a piezoresistive sensor by forming and dissolving electric paths when loaded and unloaded, respectively. This assumption is consistent with the observation that the wood was only slightly charred, indicating that the heat shock temperature was below 350 °C, so that the reduction process was incomplete [4]. This result is paramount for producing rGO sensors, which apparently enabled the excellent sensor properties of an rGO composite structure [3], reduced at 80 °C for 15 h (Figure 1).
Author Contributions
Conceptualization, methodology, formal analysis, writing—original draft preparation, writing—review and editing: F.K.F., A.M.T., Y.W., N.H. All authors have read and agreed to the published version of the manuscript.
Funding
This research received no external funding.
Data Availability Statement
The data presented in this study are available on request from the corresponding author to any qualified researcher.
Conflicts of Interest
The authors declare no conflict of interest.
References
- Mouhat, F.; Coudert, F.-X.; Bocquet, M.-L. Structure and chemistry of graphene oxide in liquid water from first principles. Nat. Commun. 2020, 11, 1566. [Google Scholar] [CrossRef] [PubMed]
- Boehm, H.P.; Clauss, A.; Hoffmann, U. Graphite oxide and its membrane properties. J. Chim. Phys. Rev. Gen. Colloides 1960, 58, 110–117. [Google Scholar] [CrossRef]
- Fuss, F.K.; Reghat, M.; Tan, A.M.; Weizman, Y.; Hameed, N. Electro-mechanical testing and calibration of glass fiber composites infused with reduced Graphene oxide. Unpublished report.
- Sengupta, I.; Chakraborty, S.; Talukdar, M. Thermal reduction of graphene oxide: How temperature influences purity. J. Mater. Res. 2018, 33, 4113–4122. [Google Scholar] [CrossRef]
- Zhang, W.; Chen, X.; Wang, Y.; Wu, L.; Hu, Y. Experimental and modeling for electrolyte solution systems. ACS Omega 2020, 5, 22465–22474. [Google Scholar] [CrossRef] [PubMed]
- Haditale, M.; Dariani, R.S.; Ghasemian Lemraski, E. Electrical behavior of graphene under temperature effect and survey of I–T curve. J. Theor. Appl. Phys. 2019, 13, 351–356. [Google Scholar] [CrossRef] [Green Version]
- Fuss, F.K.; Ahmad, A.; Tan, A.M.; Razman, R.; Weizman, Y. Pressure sensor system for customised scoliosis braces. Sensors 2021, 21, 1153. [Google Scholar] [CrossRef] [PubMed]
- Fang, C.; Zhang, J.; Chen, X.; Weng, G.J. Calculating the Electrical Conductivity of Graphene Nanoplatelet Polymer Composites by a Monte Carlo Method. Nanomaterials 2020, 10, 1129. [Google Scholar] [CrossRef] [PubMed]

Publisher’s Note: MDPI stays neutral with regard to jurisdictional claims in published maps and institutional affiliations. |
© 2021 by the authors. Licensee MDPI, Basel, Switzerland. This article is an open access article distributed under the terms and conditions of the Creative Commons Attribution (CC BY) license (https://creativecommons.org/licenses/by/4.0/).