Proceeding Paper

Ultrasonic Oscillating Temperature Sensor for Operation in Air †

by
Ali Elyounsi
and
Alexander N. Kalashnikov
*
Department of Engineering and Mathematics, Sheffield Hallam University, Sheffield S1 1WB, UK
*
Author to whom correspondence should be addressed.
Presented at the 8th International Electronic Conference on Sensors and Applications, 1–15 November 2021; Available online: https://ecsa-8.sciforum.net.
Eng. Proc. 2021, 10(1), 62; https://doi.org/10.3390/ecsa-8-11276
Published: 1 November 2021

Abstract

:
Ultrasonic oscillating temperature sensors (UOTSs) were shown to respond to temperature changes in aqueous solutions faster than conventional temperatures sensors [1]. This study describes a recently developed air UOTS and presents experimental results on its response to air temperature step changes recorded simultaneously using AHT20 and BMP280 air temperature sensors. These results demonstrate a remarkably fast UOTS response time.

1. Introduction

Keeping the room temperature comfortable for the inhabitants of modern buildings comes at a substantial cost that includes greenhouse gas emissions. For example, ‘In the US, 38% of greenhouse gas emissions from residential housing are produced from heating and cooling rooms… It is estimated that 19% of the UK’s greenhouse gas emissions come from warming up the places we live and work …’ [2]. Reducing these figures is possible via superior indoor temperature regulation, which requires sensing temperature via a temperature sensor(s). Although the global market size for temperature sensors was estimated at 6.3 billion USD in 2020 with a projected annual growth of 4.8% through 2027 [3], not all of these sensors are suitable for air temperature measurement (e.g., infrared sensors). Additionally, air temperature can be notably uneven across a room. Thus, several conventional temperature sensors might be required for energy-efficient temperature control geared towards environmental comfort. Ultrasonic oscillating temperature sensors (UOTSs) can measure temperature across the entire ultrasonic pathways almost instantly almost instantly [1], which makes them a serious contender as an alternative to conventional air temperature sensors for indoor climate control applications.
In this study, we describe a recently developed air UOTS and present experimental results on its responses to air temperature step changes recorded simultaneously along with the responses of AHT20 and BMP280 air temperature sensors.

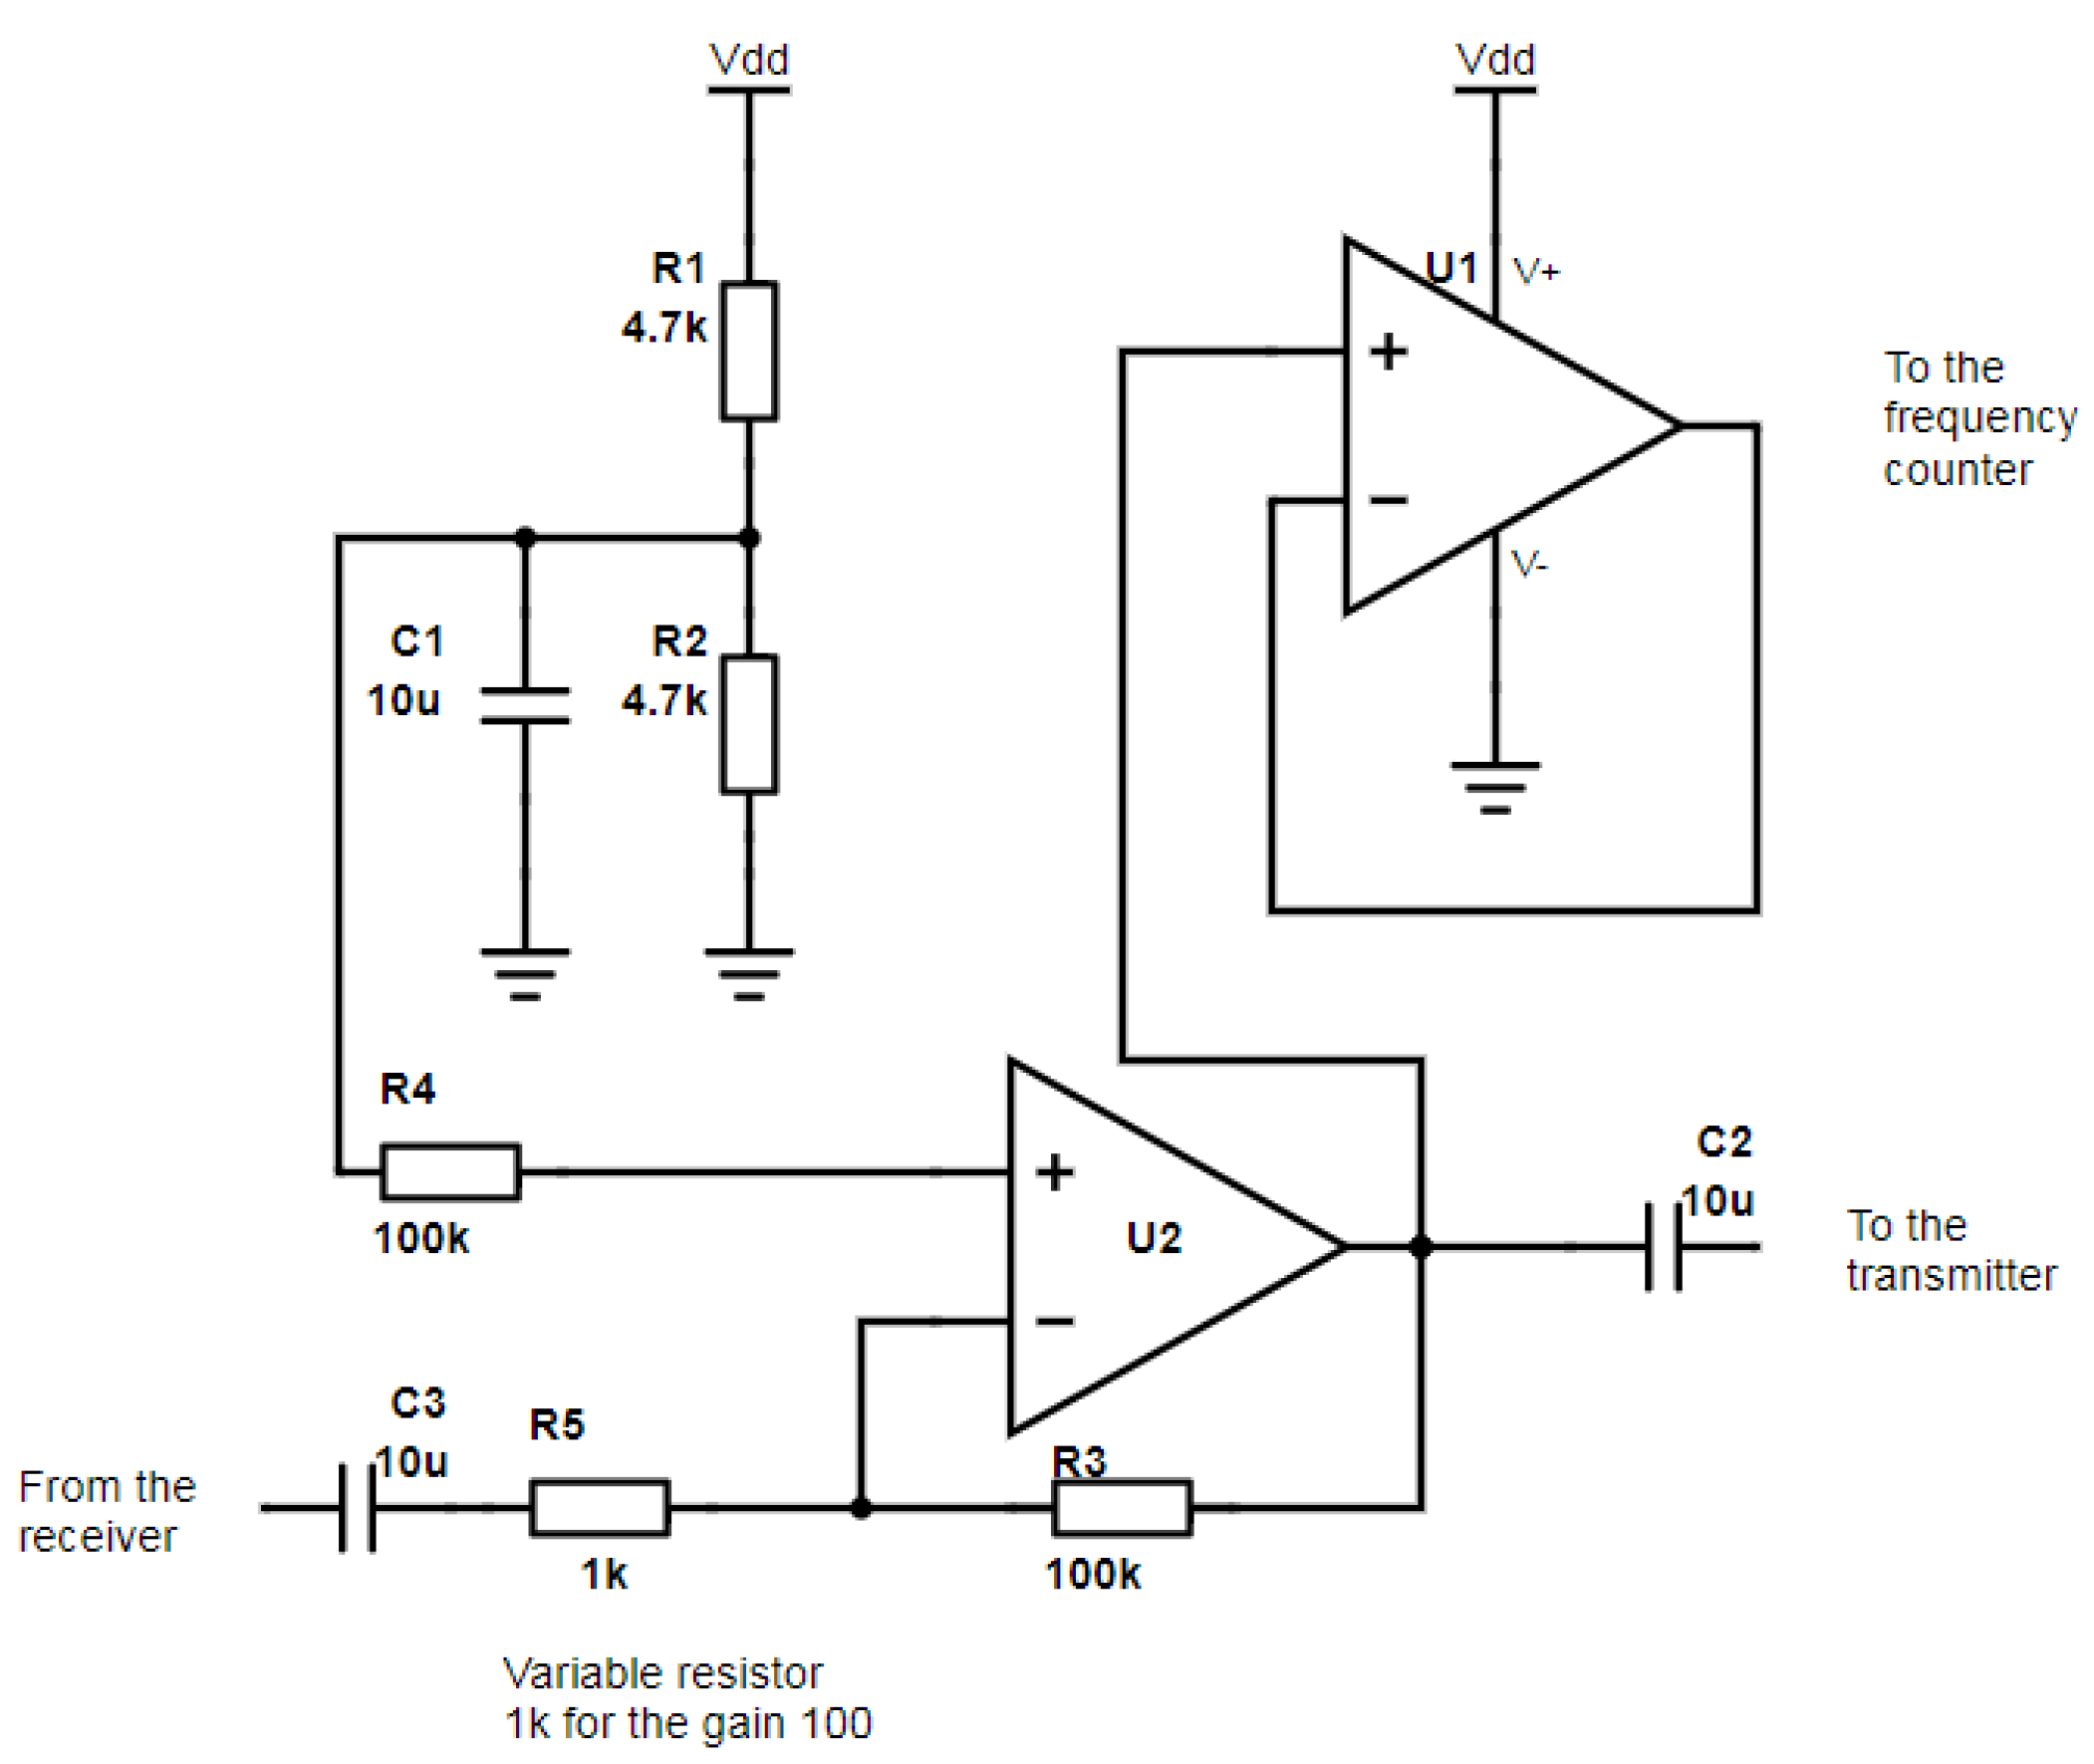
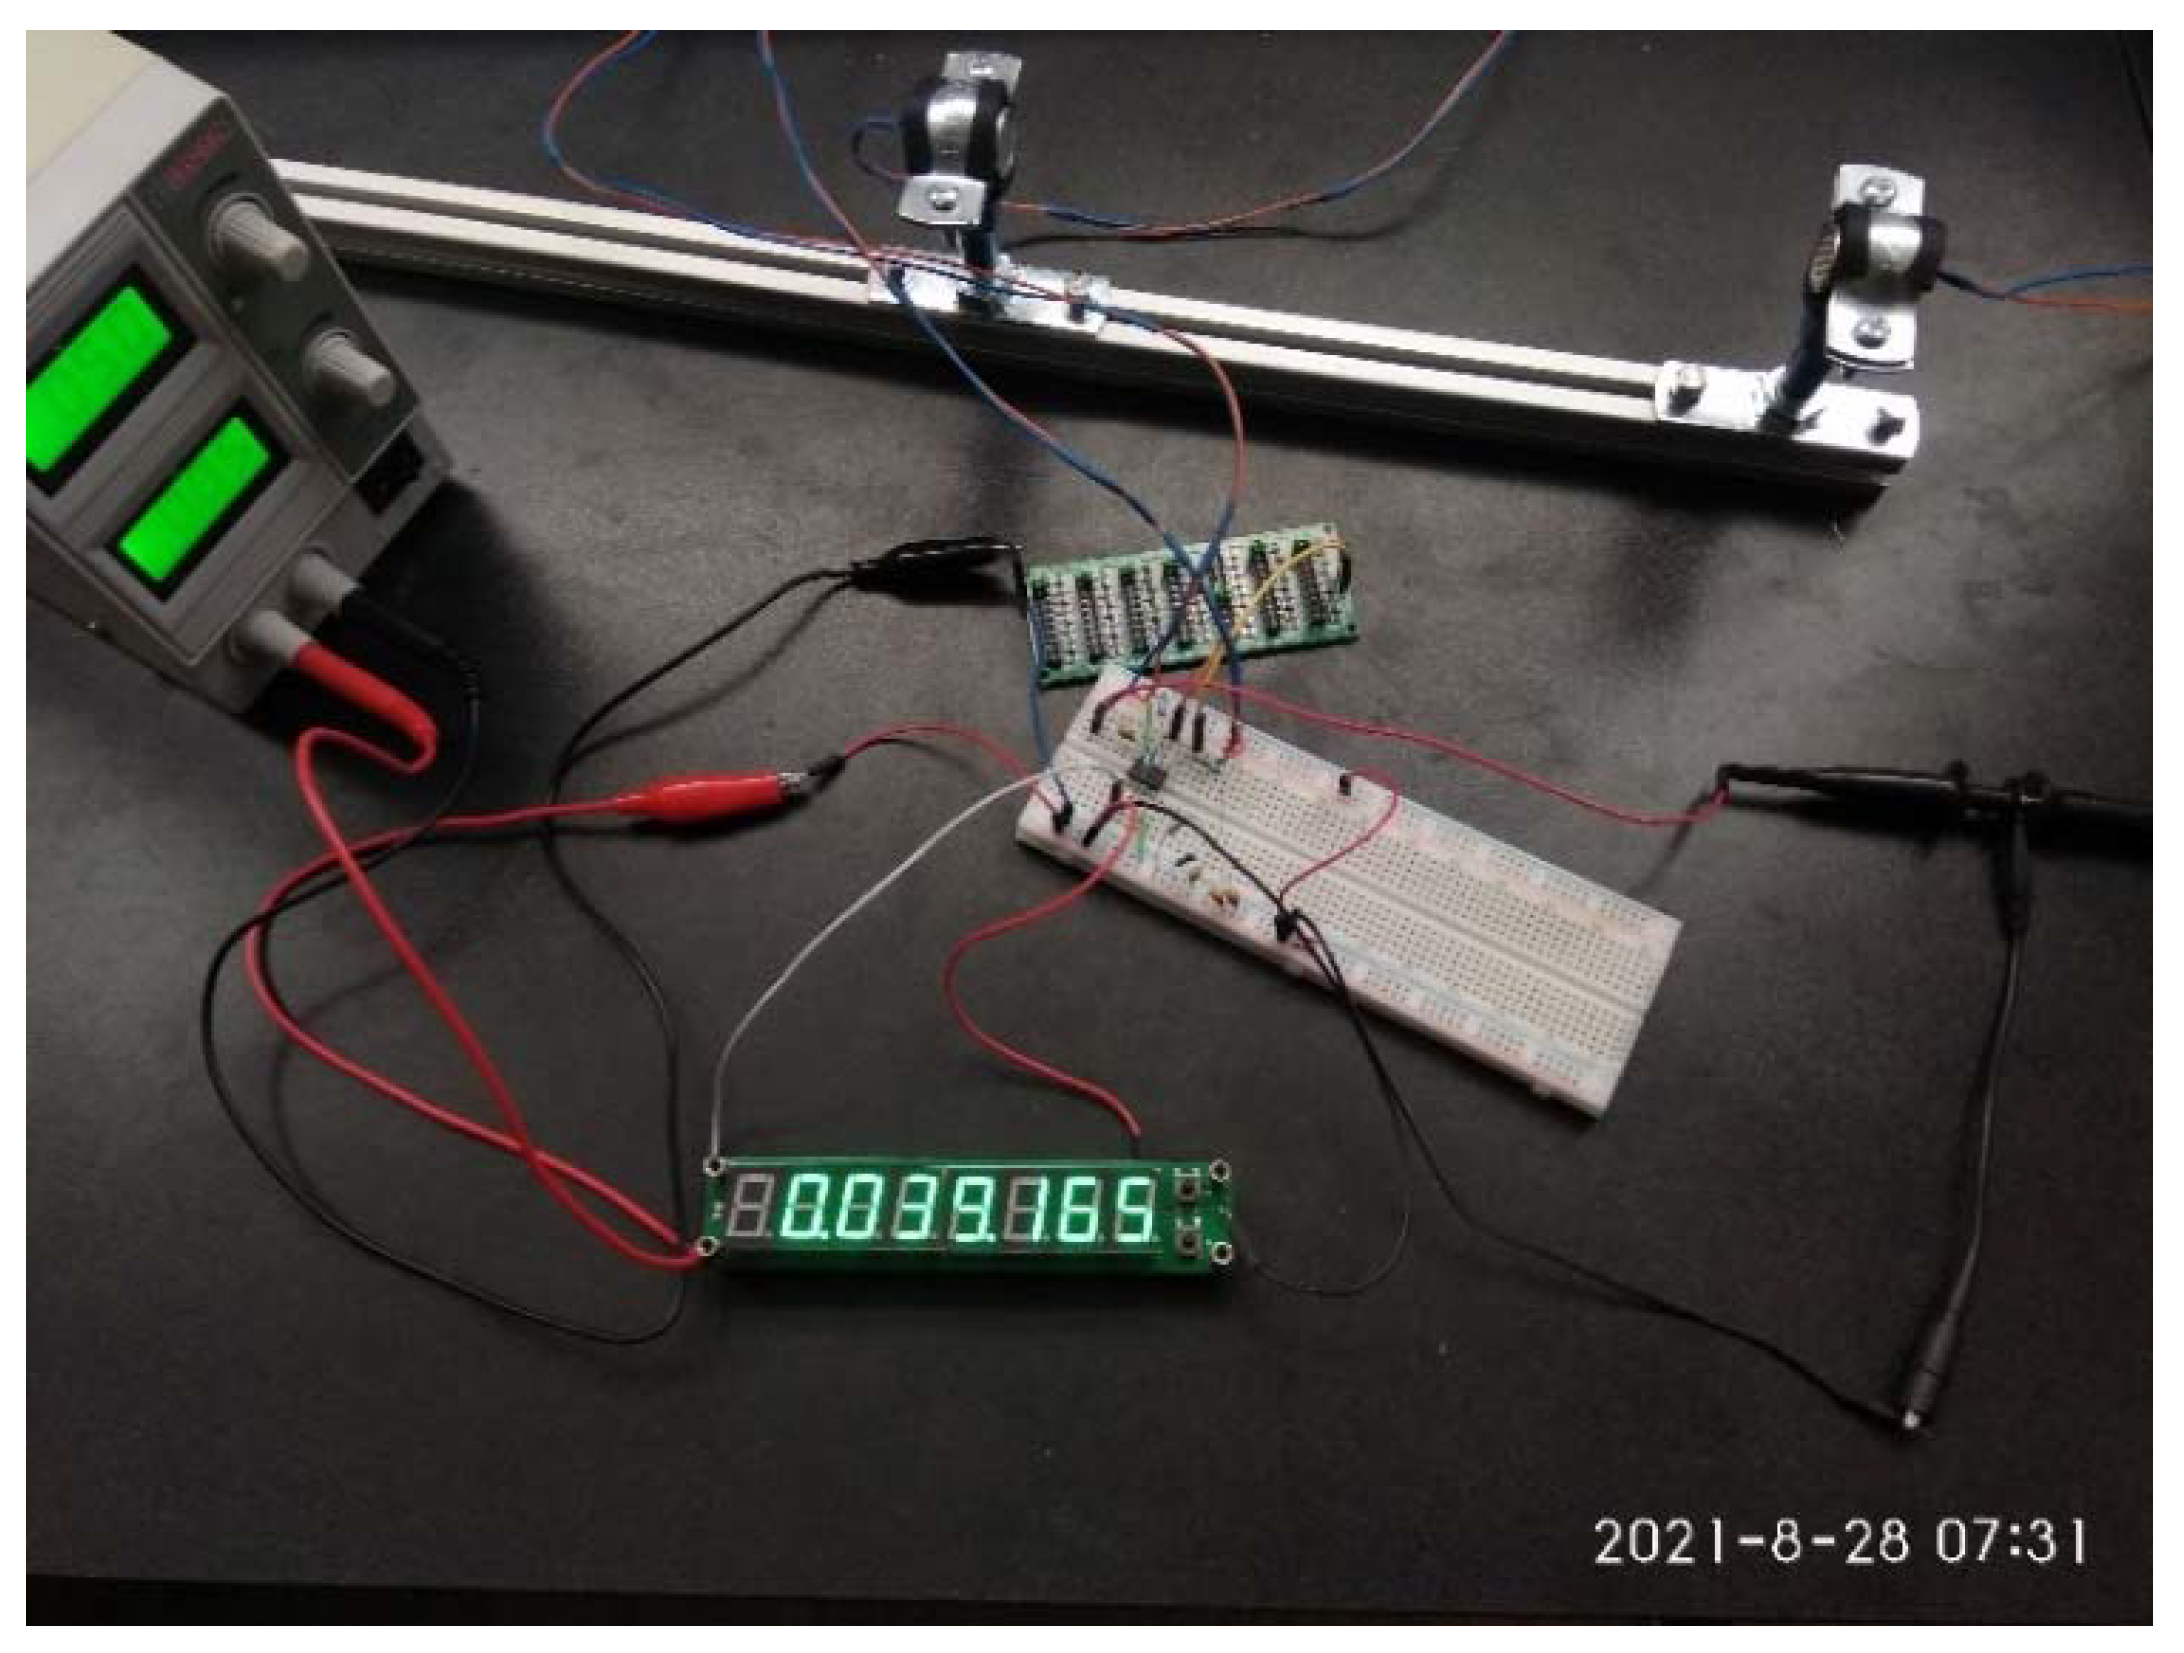
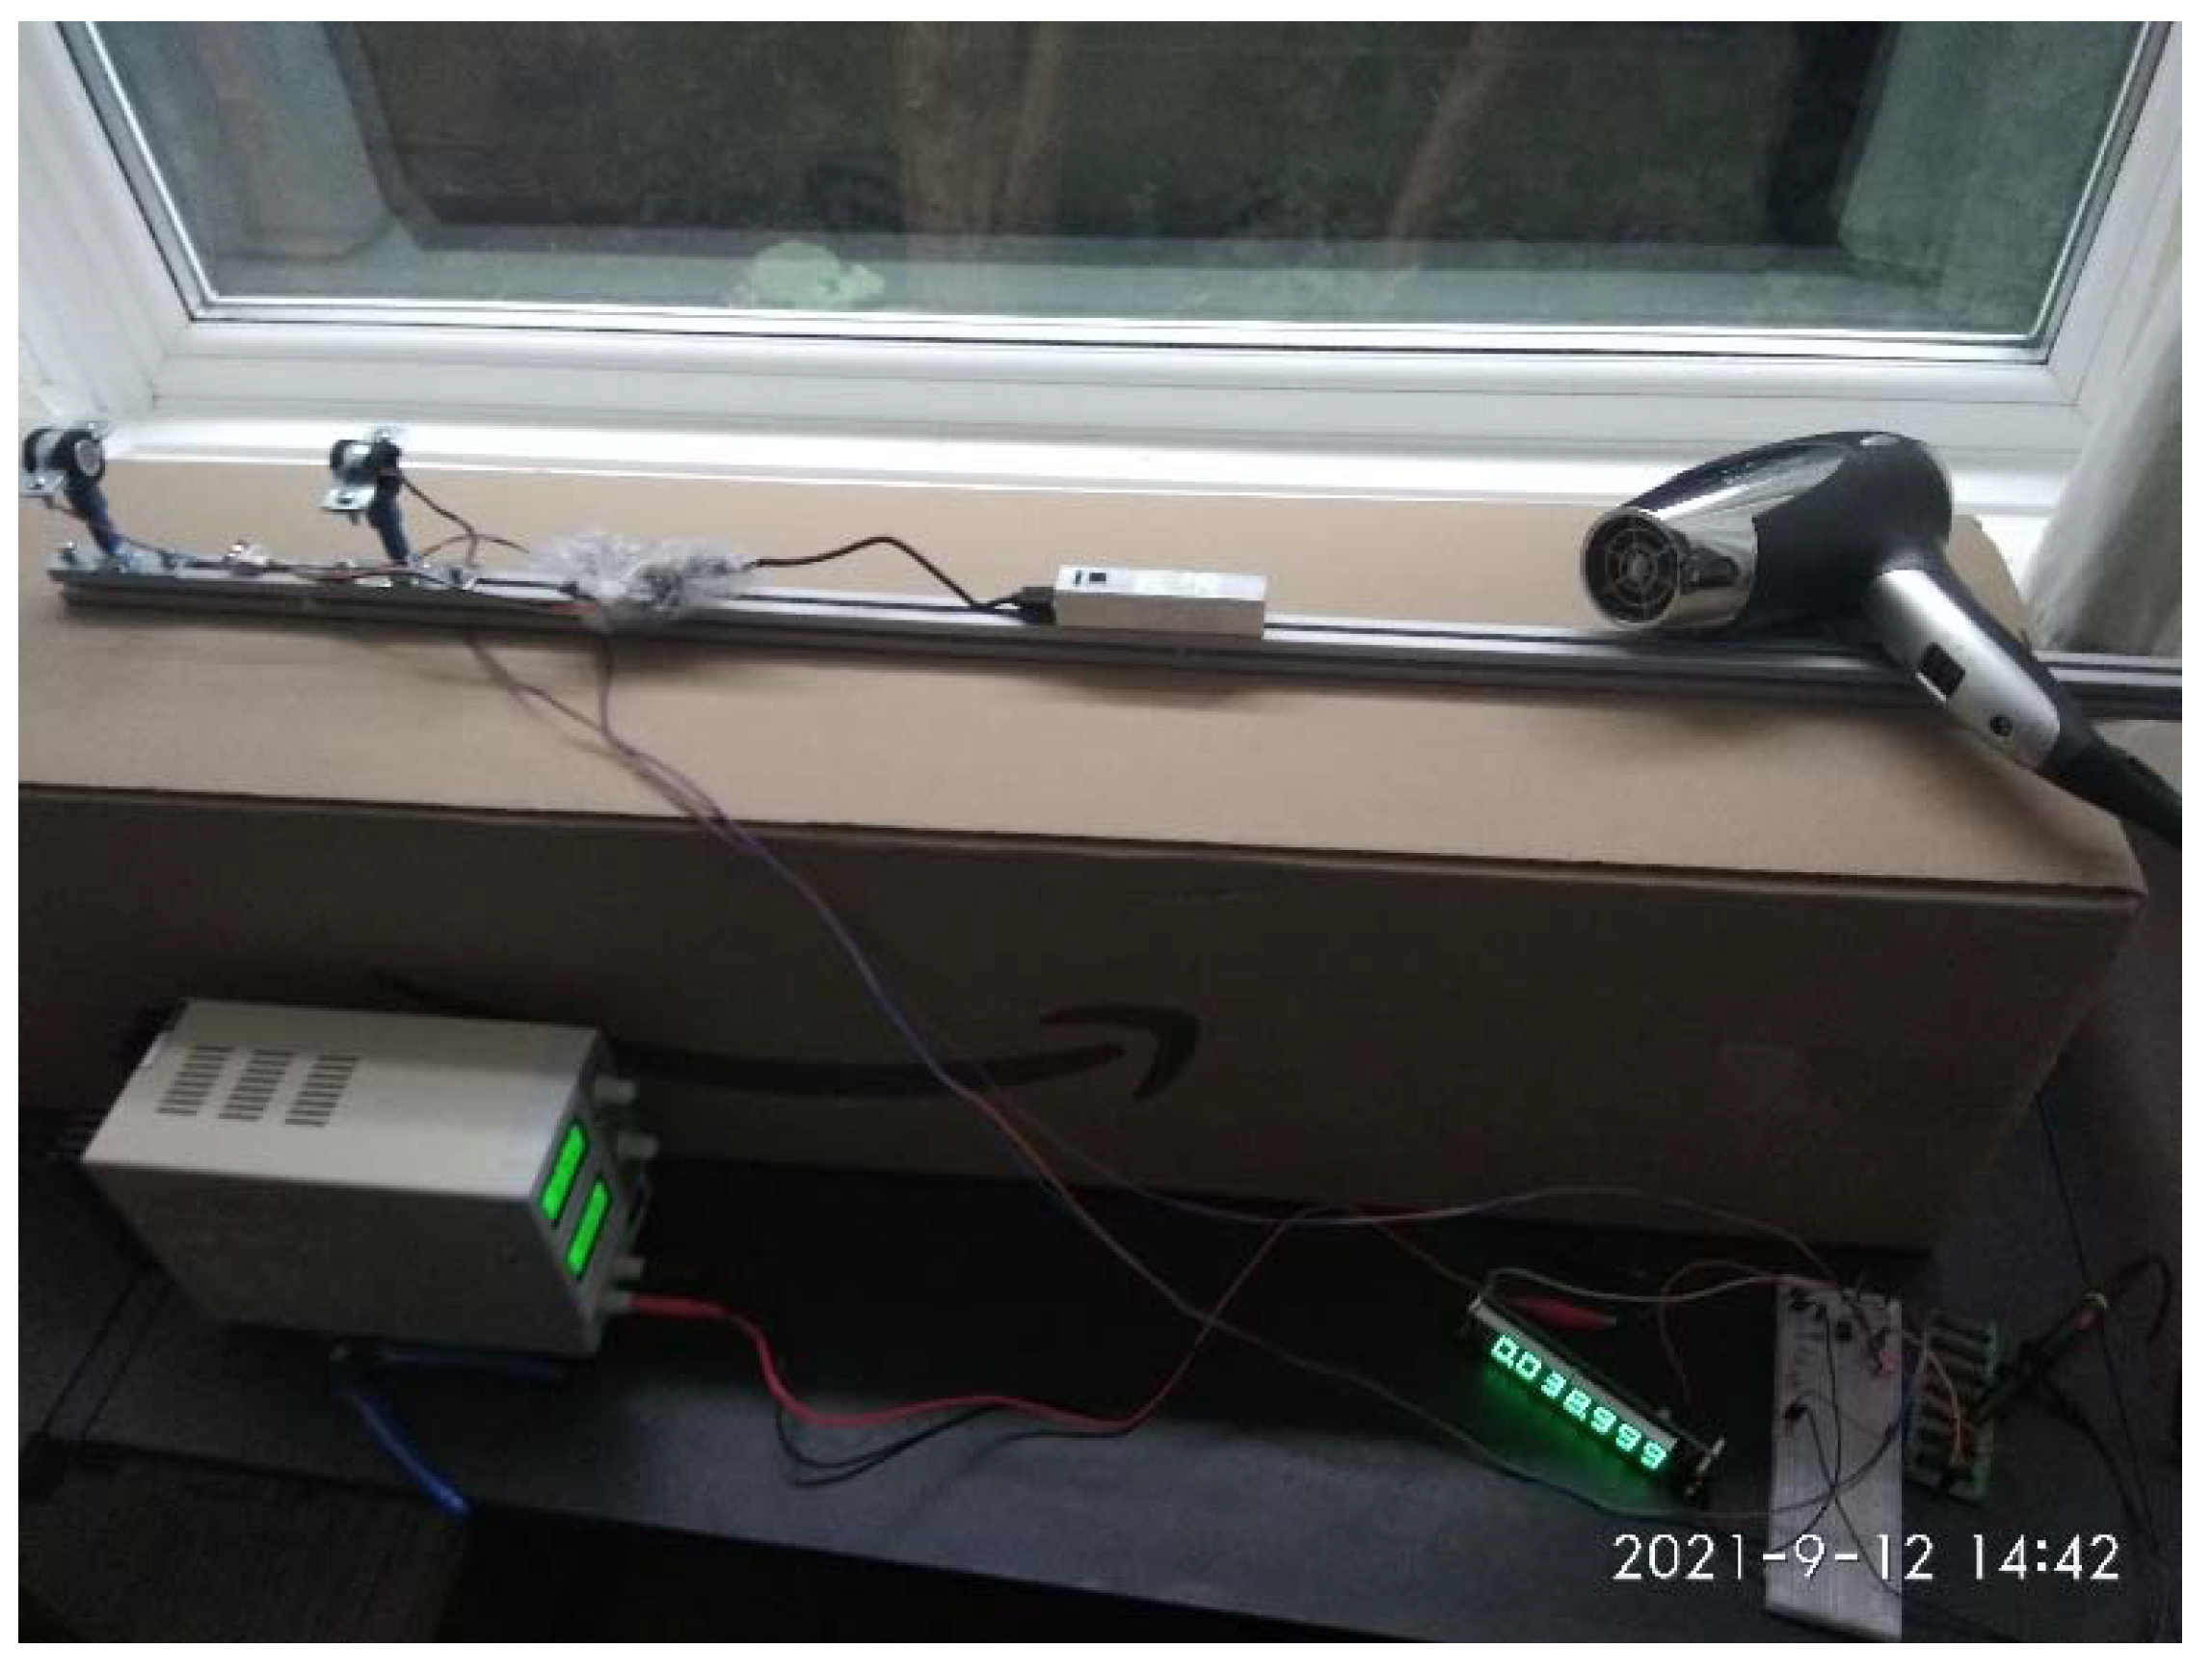
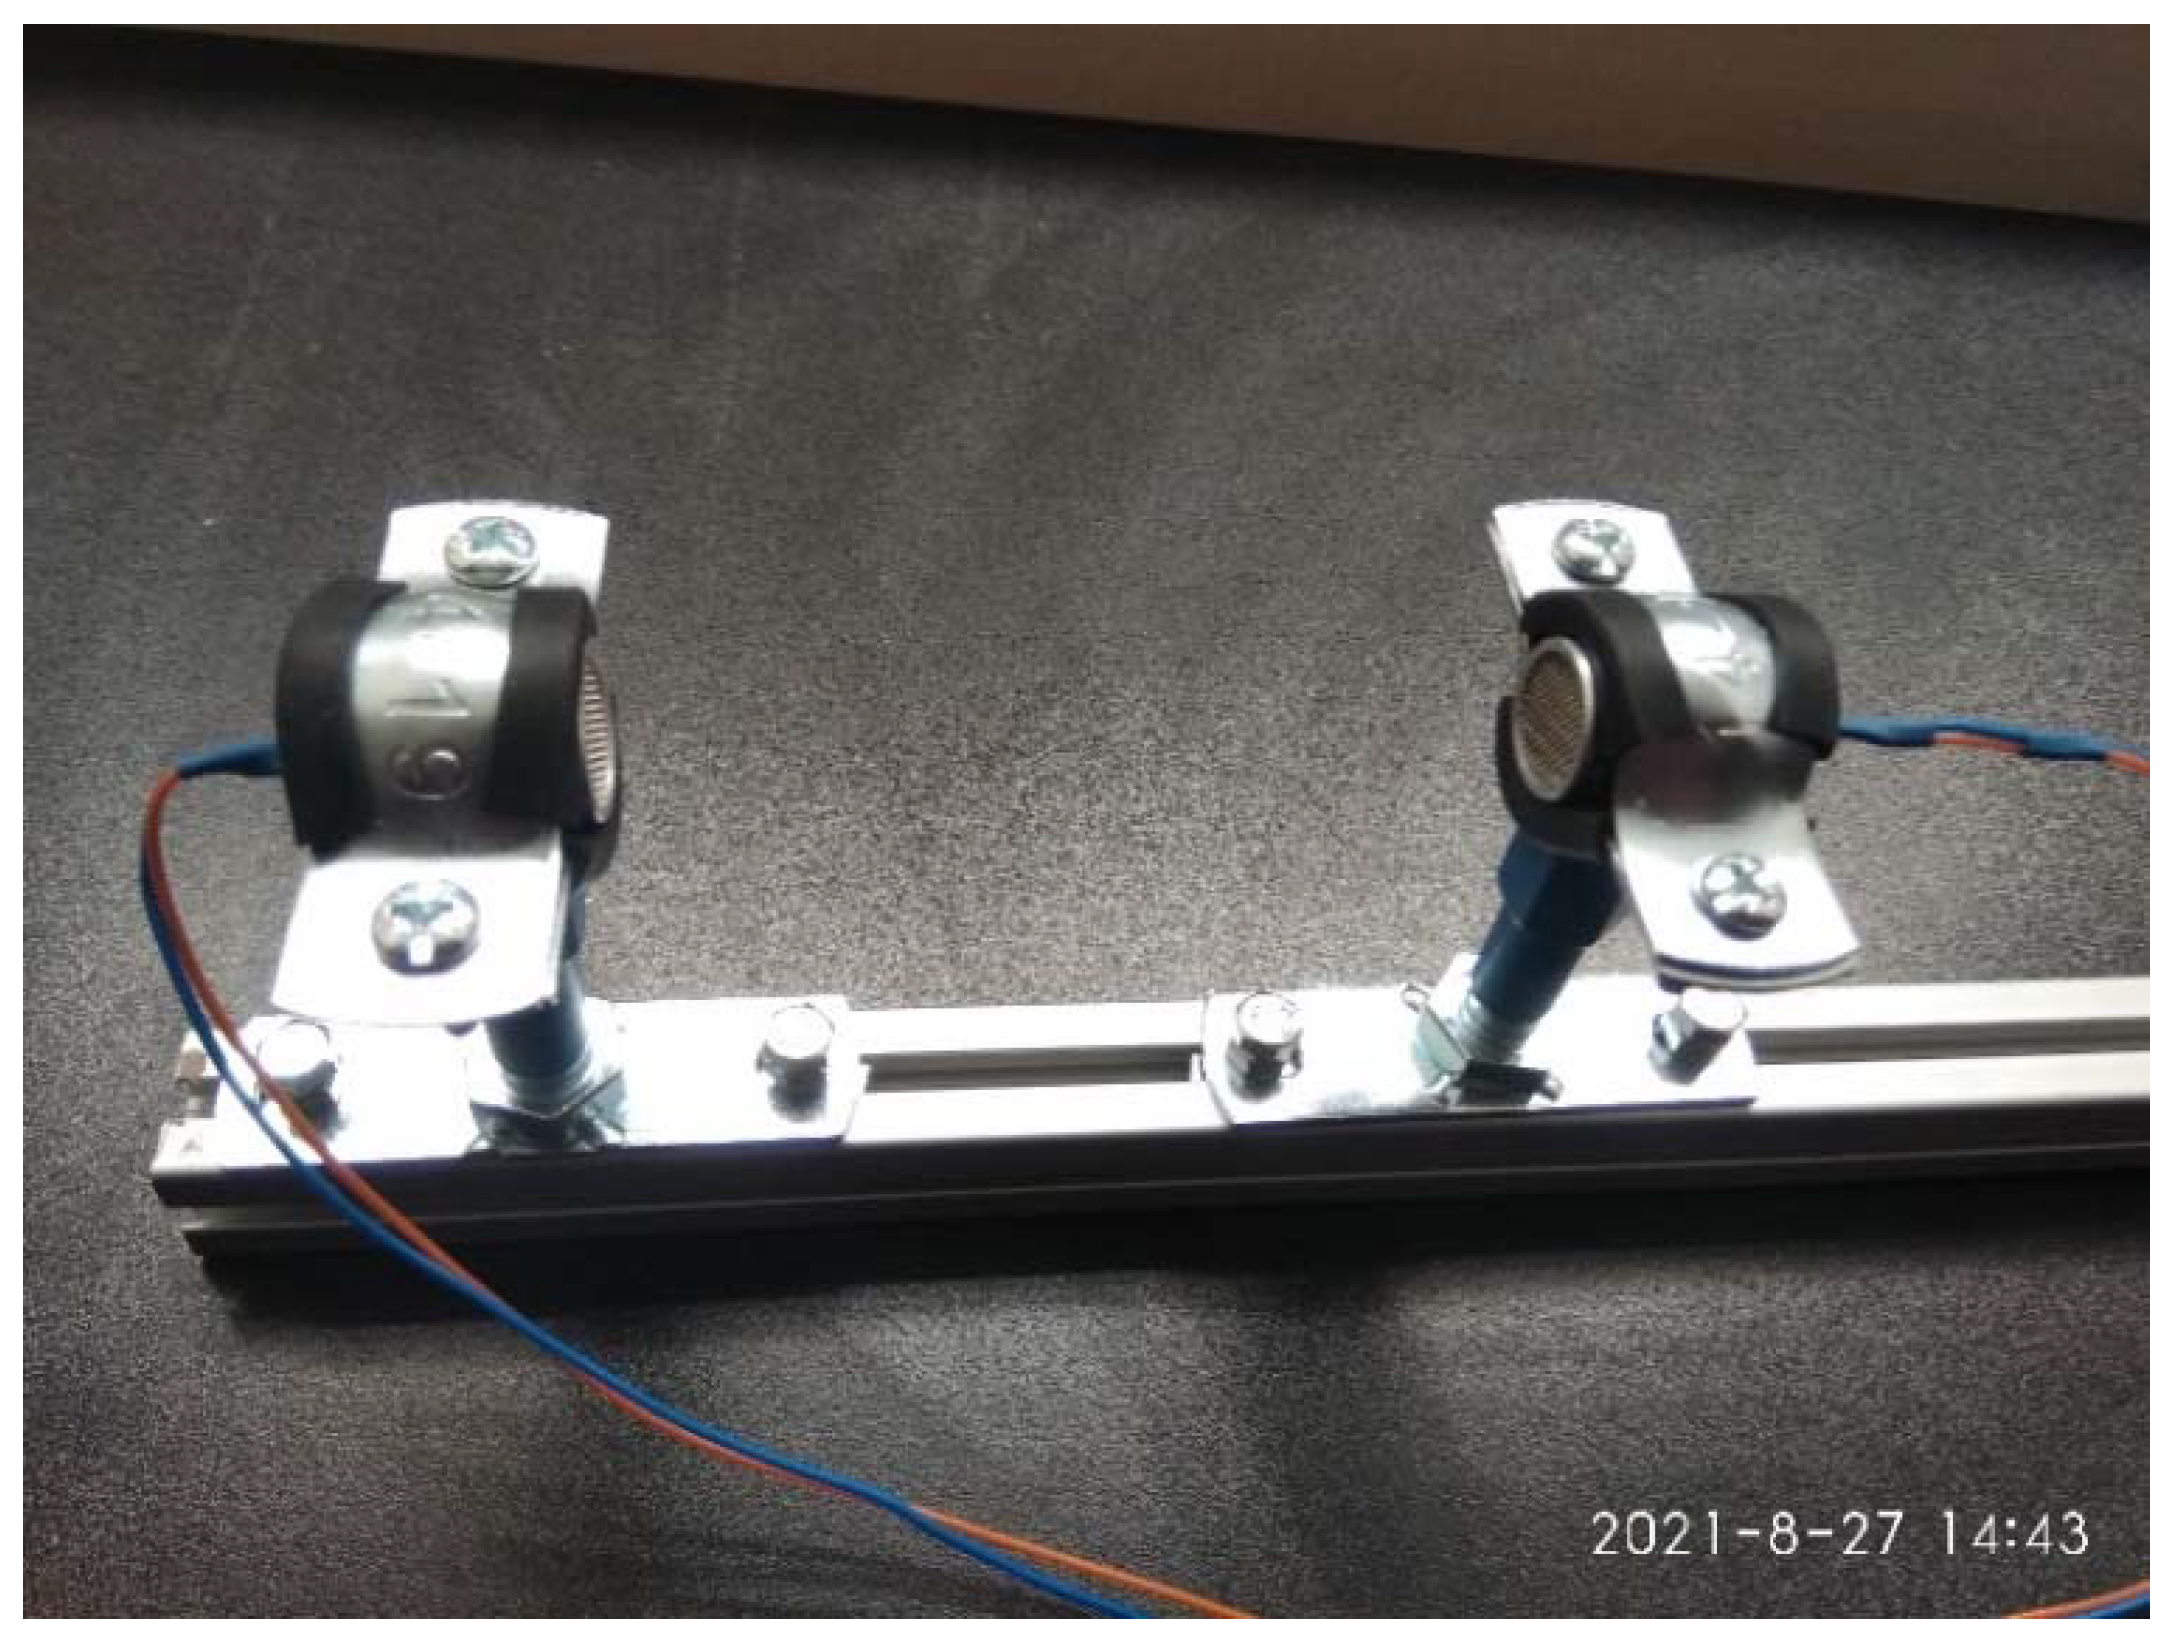
2. Experimental Equipment, Setup, and Procedure

A UOTS consists of a pair of ultrasonic transducers and an electronic driver, which form a closed signal loop [4]. The driver can consist of an amplifier—and may additionally include a phase shifter and/or a band-pass filter—and can be realised using various electronic components [5,6]. We used an amplifier assembled using a dual operational amplifier (opamp) (Figure 1), with U1 buffering the output signal of the UOTS before it reached the standalone eight-digit frequency counter, PLJ-8LED-C [7], and U2 compensating for acoustical and electrical losses in the signal loop. Using Munsen rings, 40 kHz air ultrasound transducers were attached to a standard 20 × 20 aluminium profile at a distance of 125 mm apart (Figure 2). The connected components of the UOTS are illustrated in Figure 3.
The air temperature was measured using conventional temperature sensors AHT20 and BMP280, which came mounted on the same circuit board. The board was connected via an I2C interface to a Seeeduino Xiao [8] with an expansion board and a USB power bank, as illustrated in Figure 4.
The experimental setup also included a domestic hair dryer rated at 2 kW, which provided step changes in temperature, and a cardboard enclosure to house the temperature sensors in a confined space (Figure 5 and Figure 6).
The experimental procedure was as follows:
-
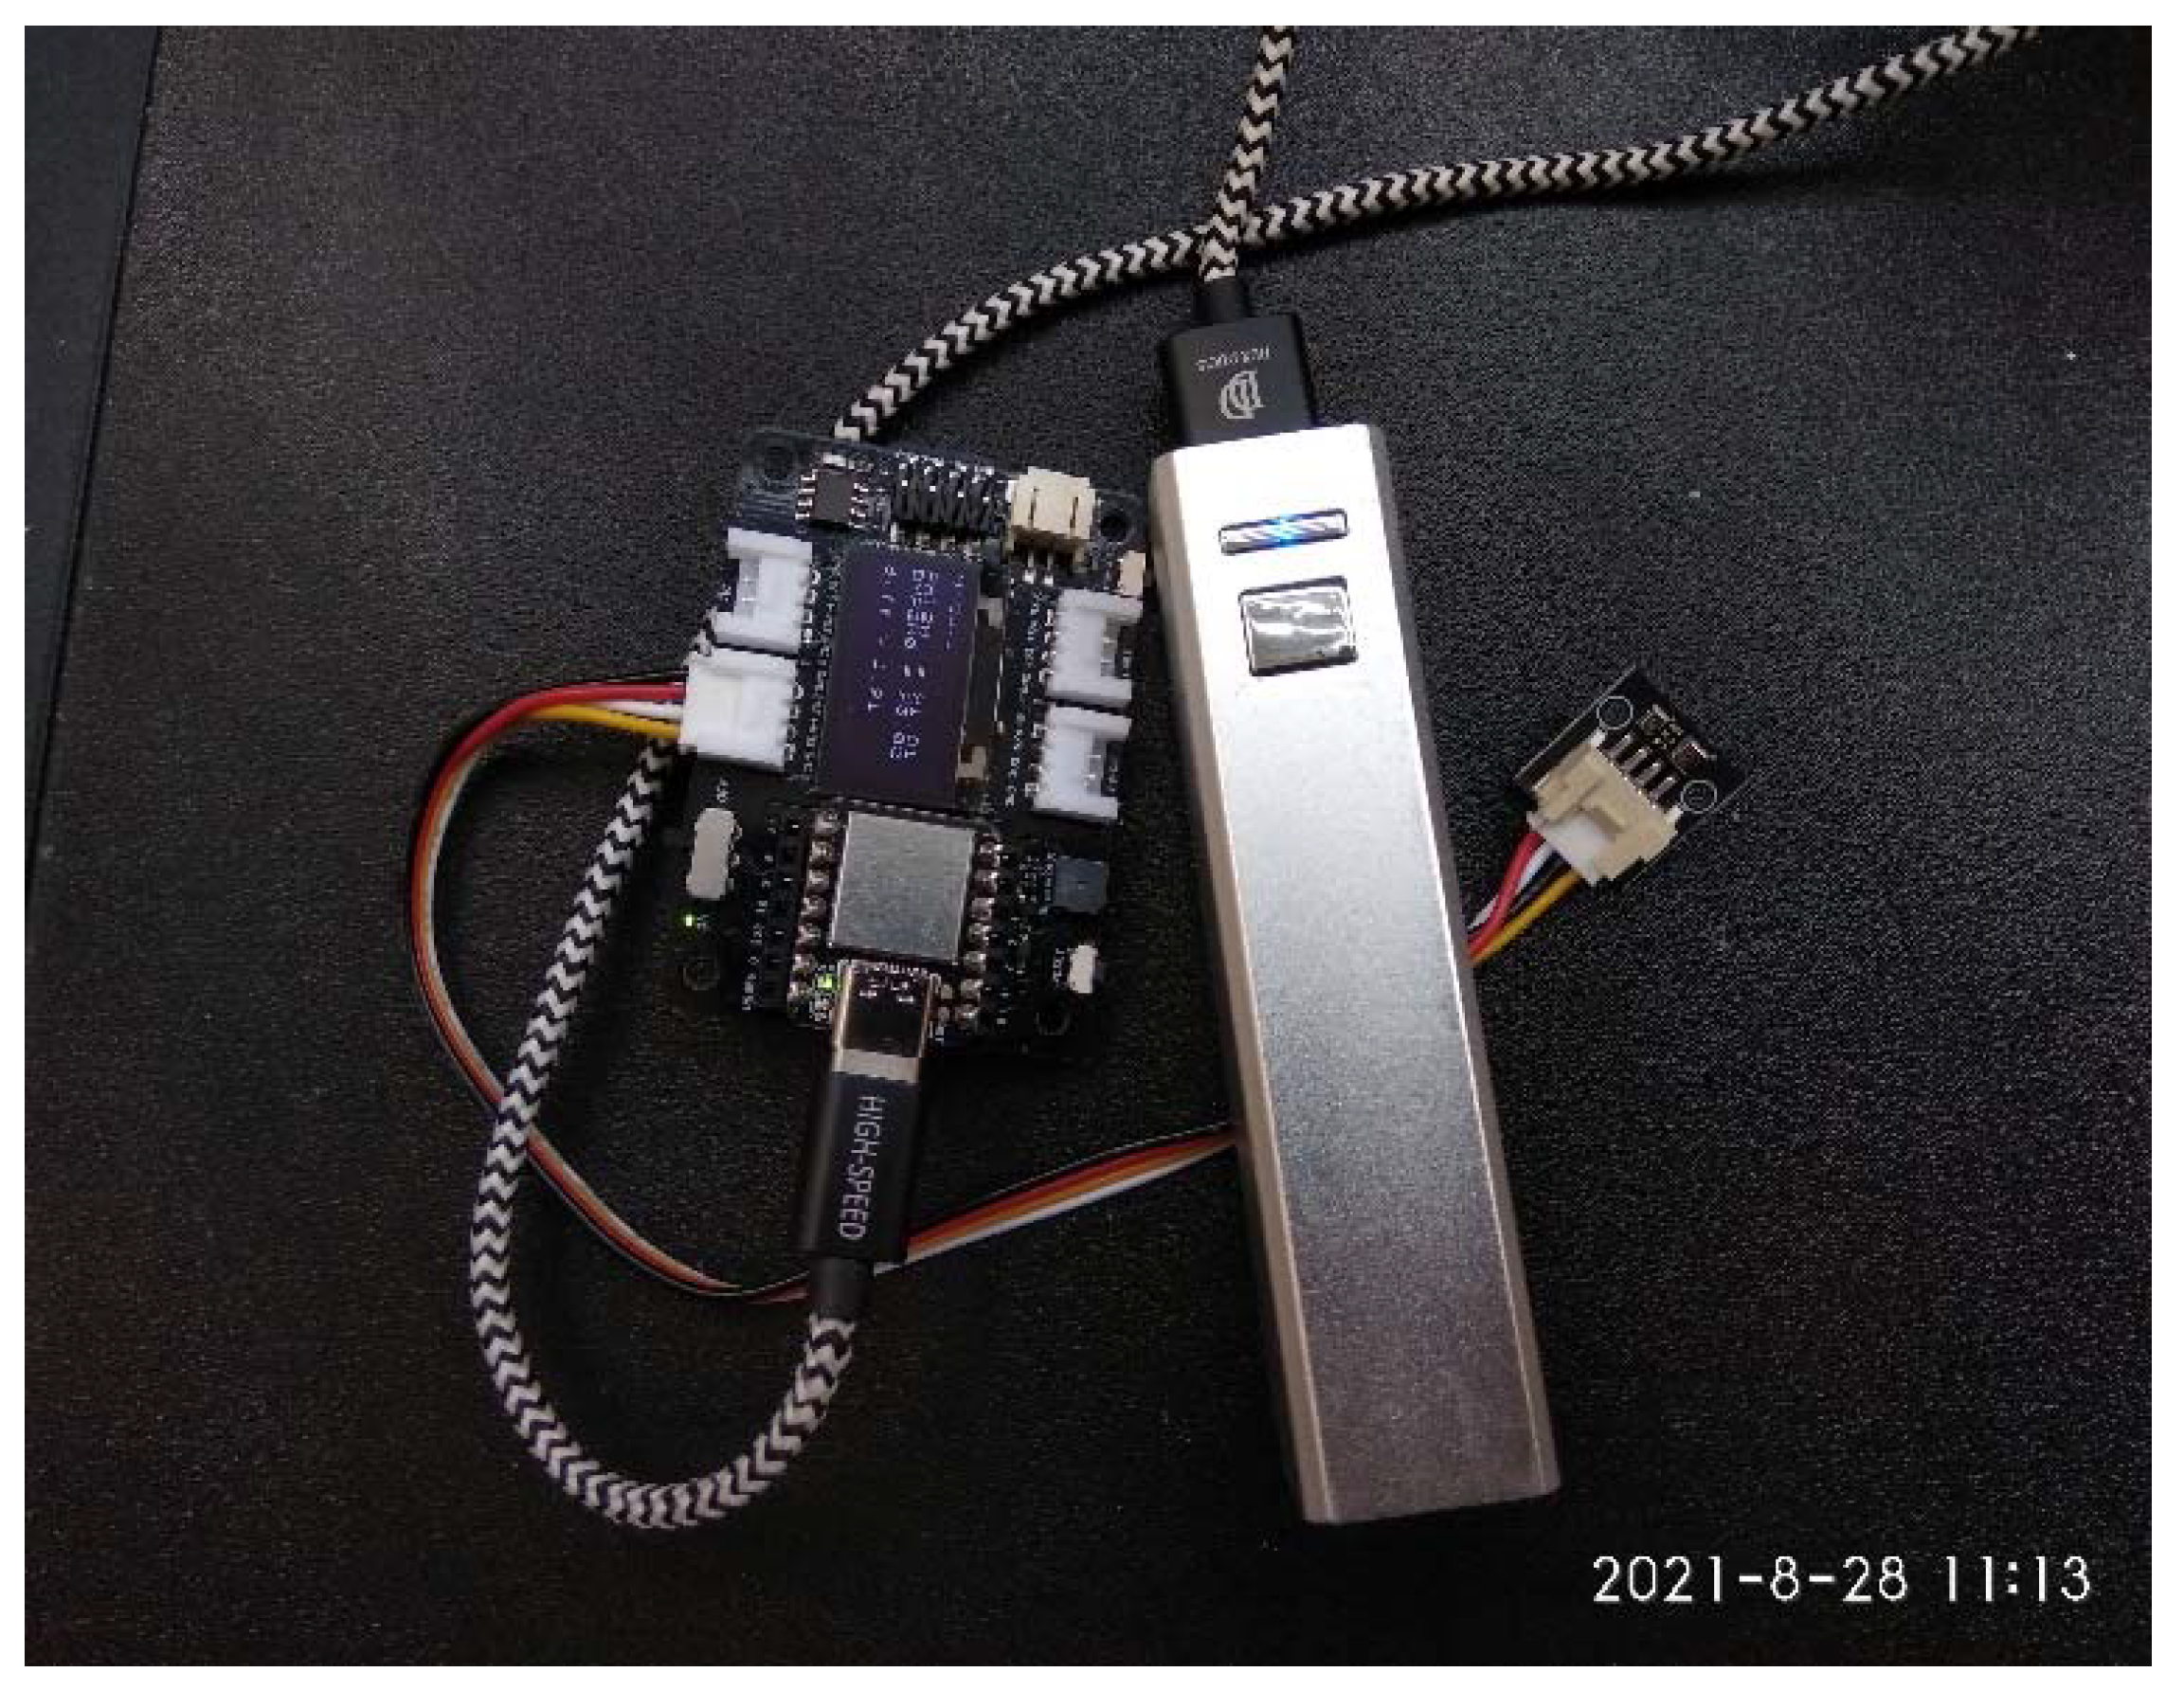
First, the power bank was switched on, and the readings of both the conventional temperature sensors were recorded to a secure digital (SD) card every second.
-
A video recording, made using a mobile phone that faced the frequency counter displaying the UOTS frequency every 1 s, was initiated.
-
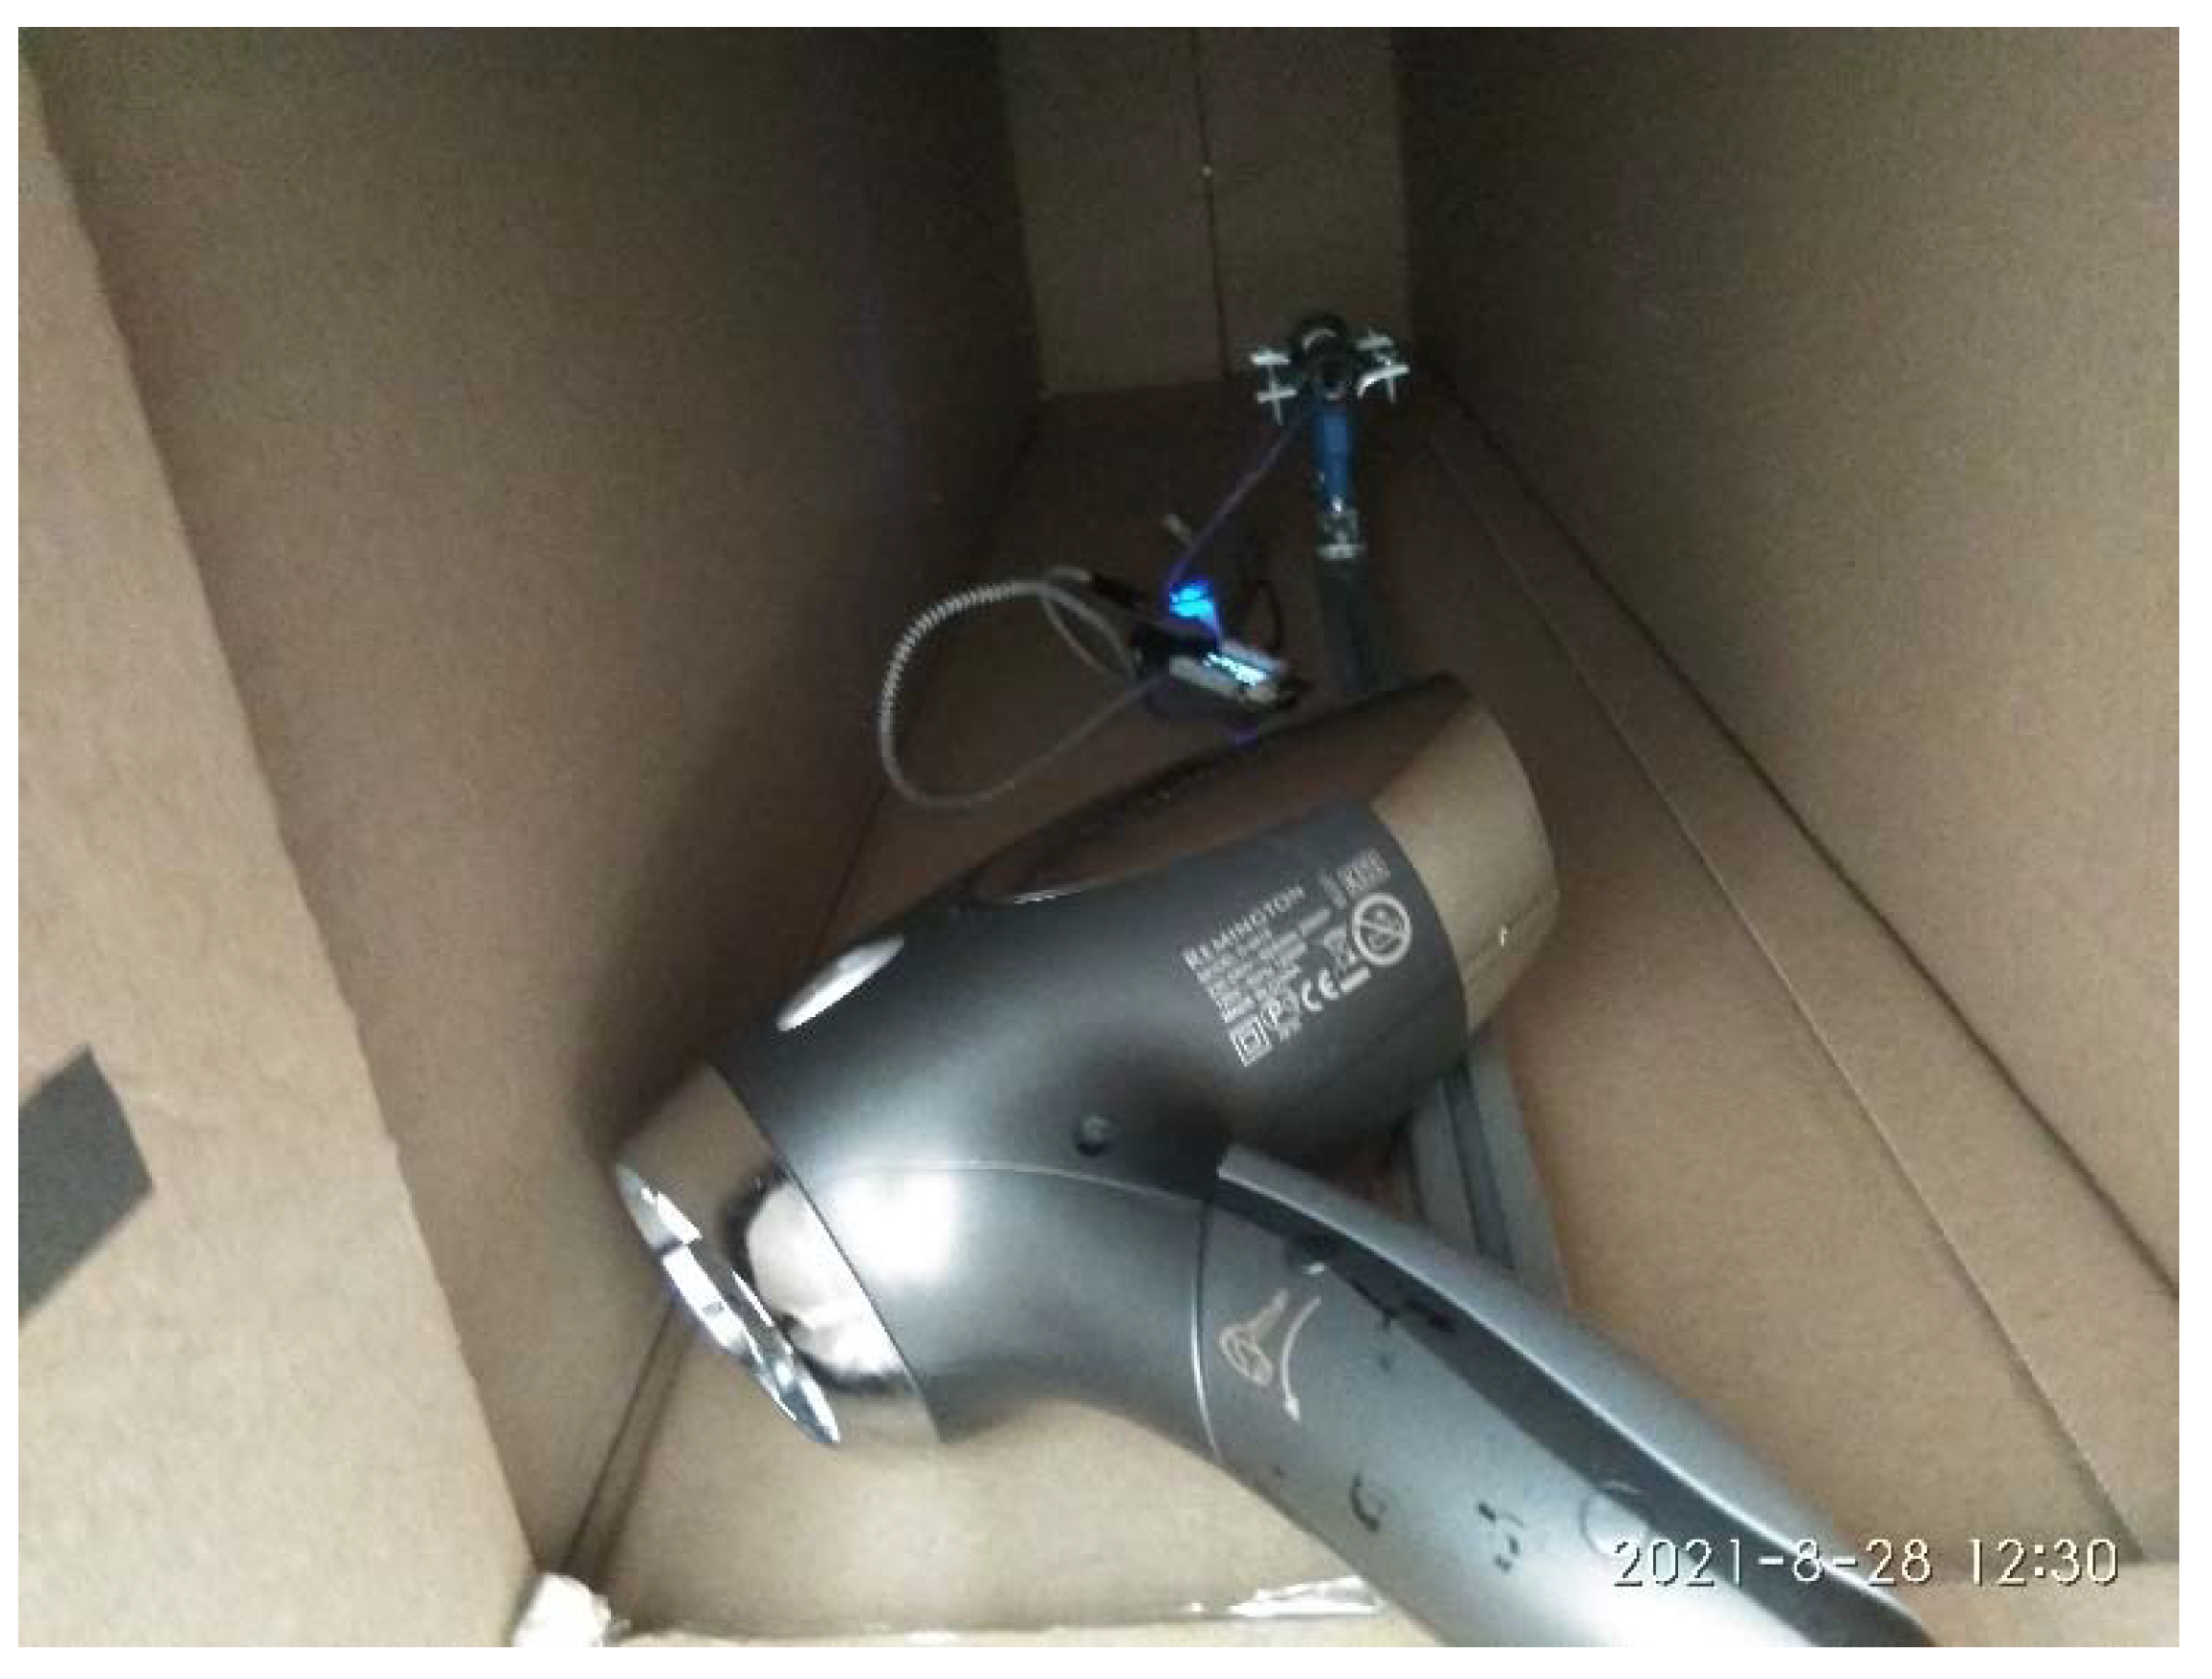
The hairdryer was switched on remotely for a few seconds. As the hairdryer was not attached to the aluminium profile, it moved slightly every time it was switched on.
-
After some time, the video recording was stopped.
-
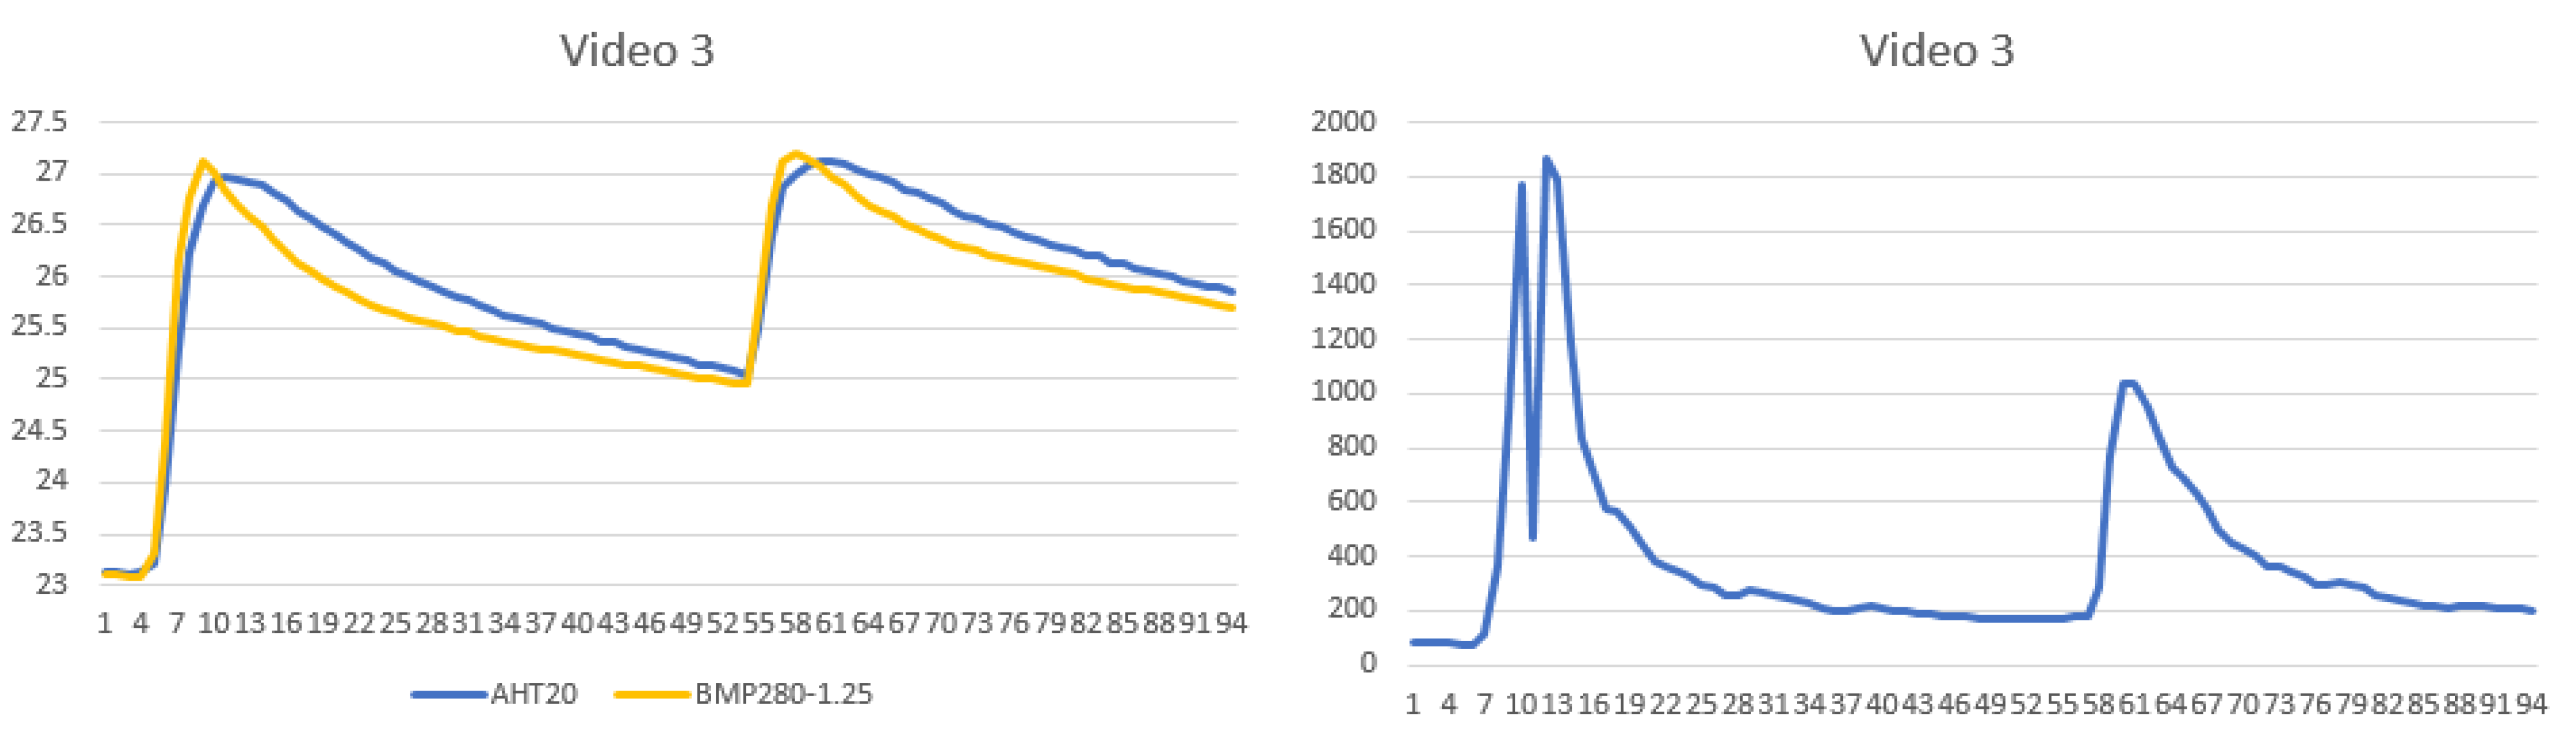
The hairdryer was switched on four times, twice after the air in the enclosure had cooled down to approximately the temperature of the room, and twice in quick succession.
-
The recorded temperatures were transferred from the SD card to a personal computer.
-
The recorded videos were transferred to a personal computer and played with frequent pauses to record the changing readings on the frequency counter. As it was very difficult if they were the same, the number of recorded points was about 5% less than the duration of the video in seconds.
-
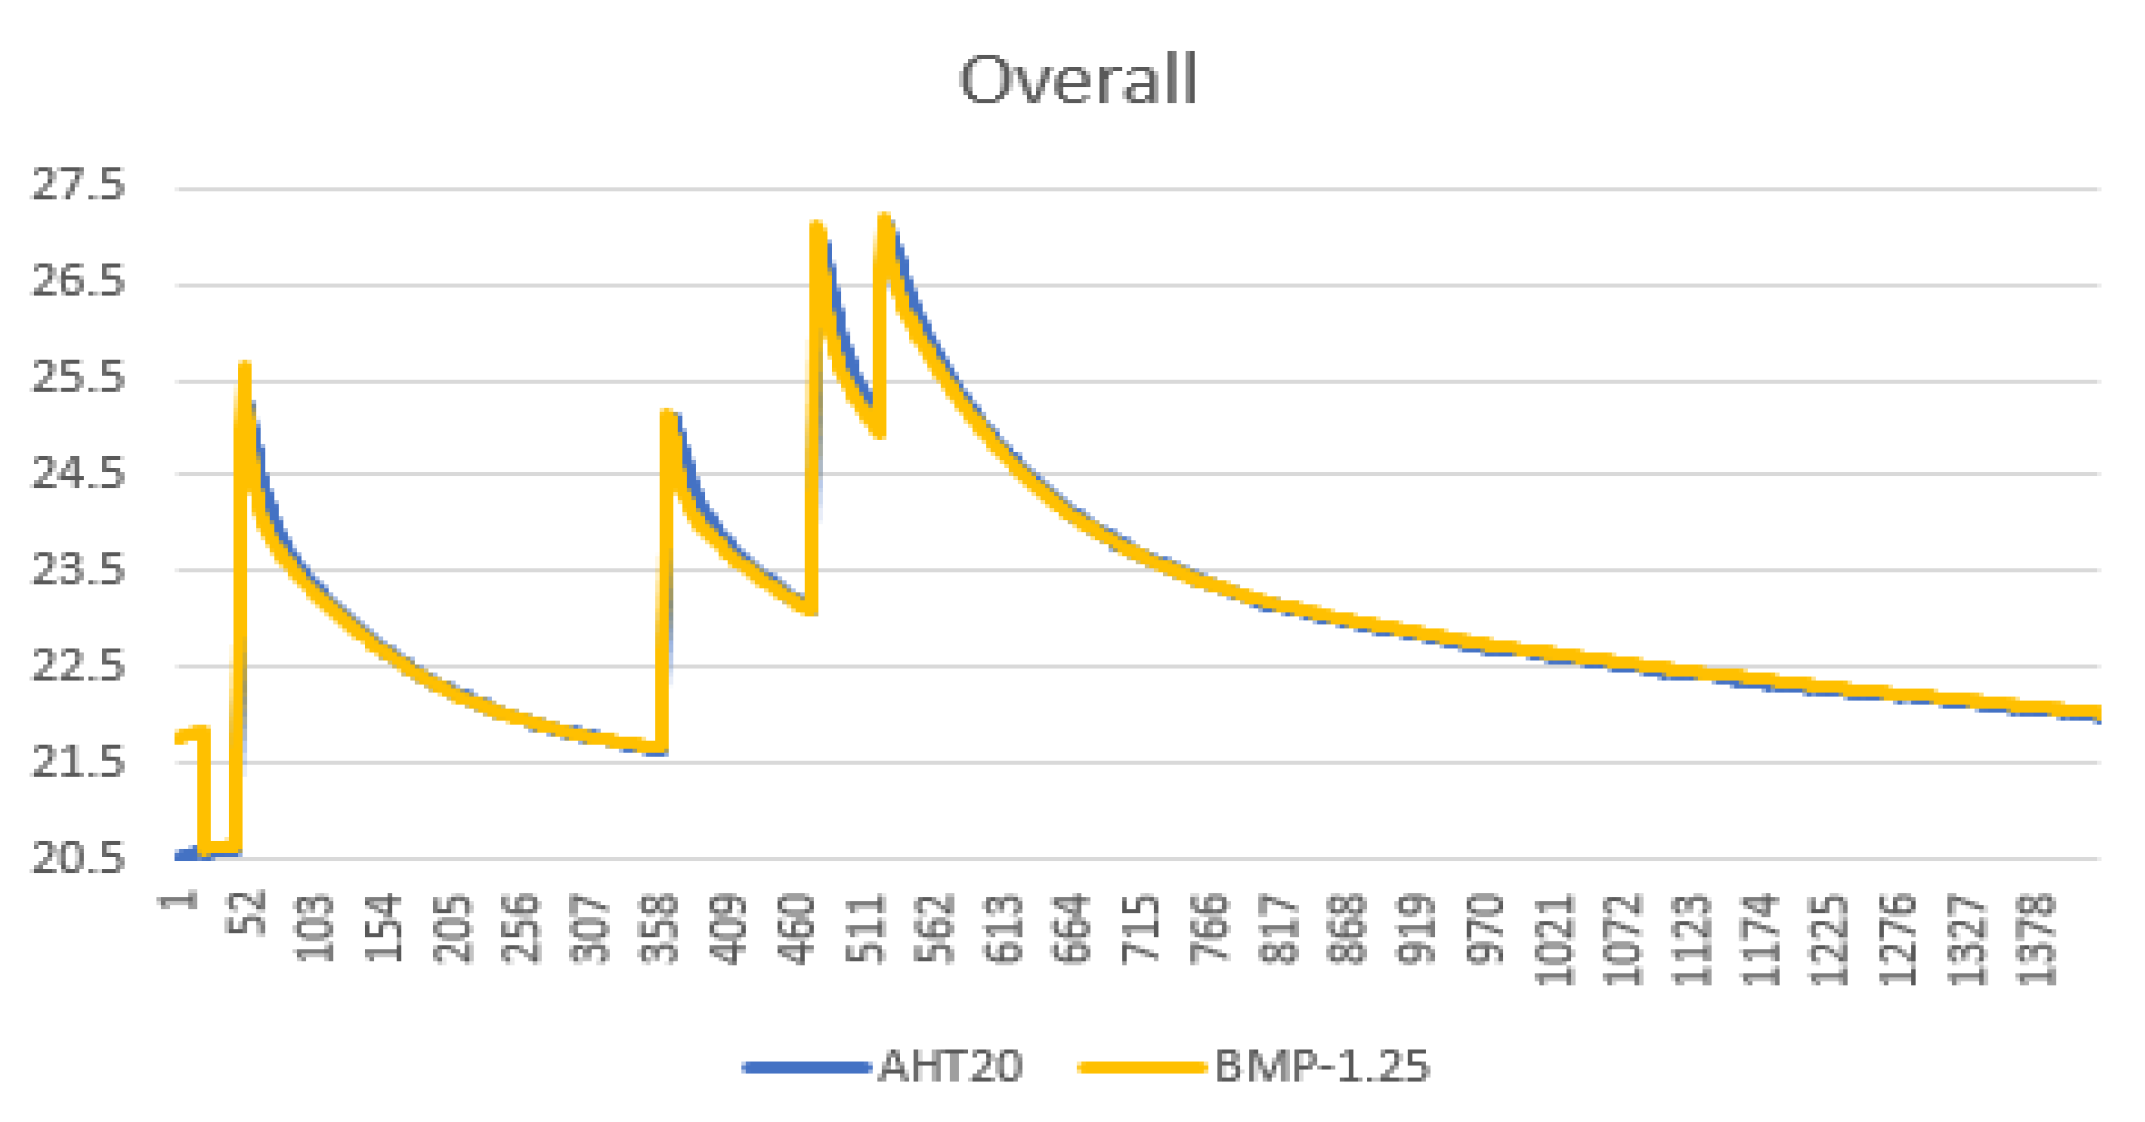
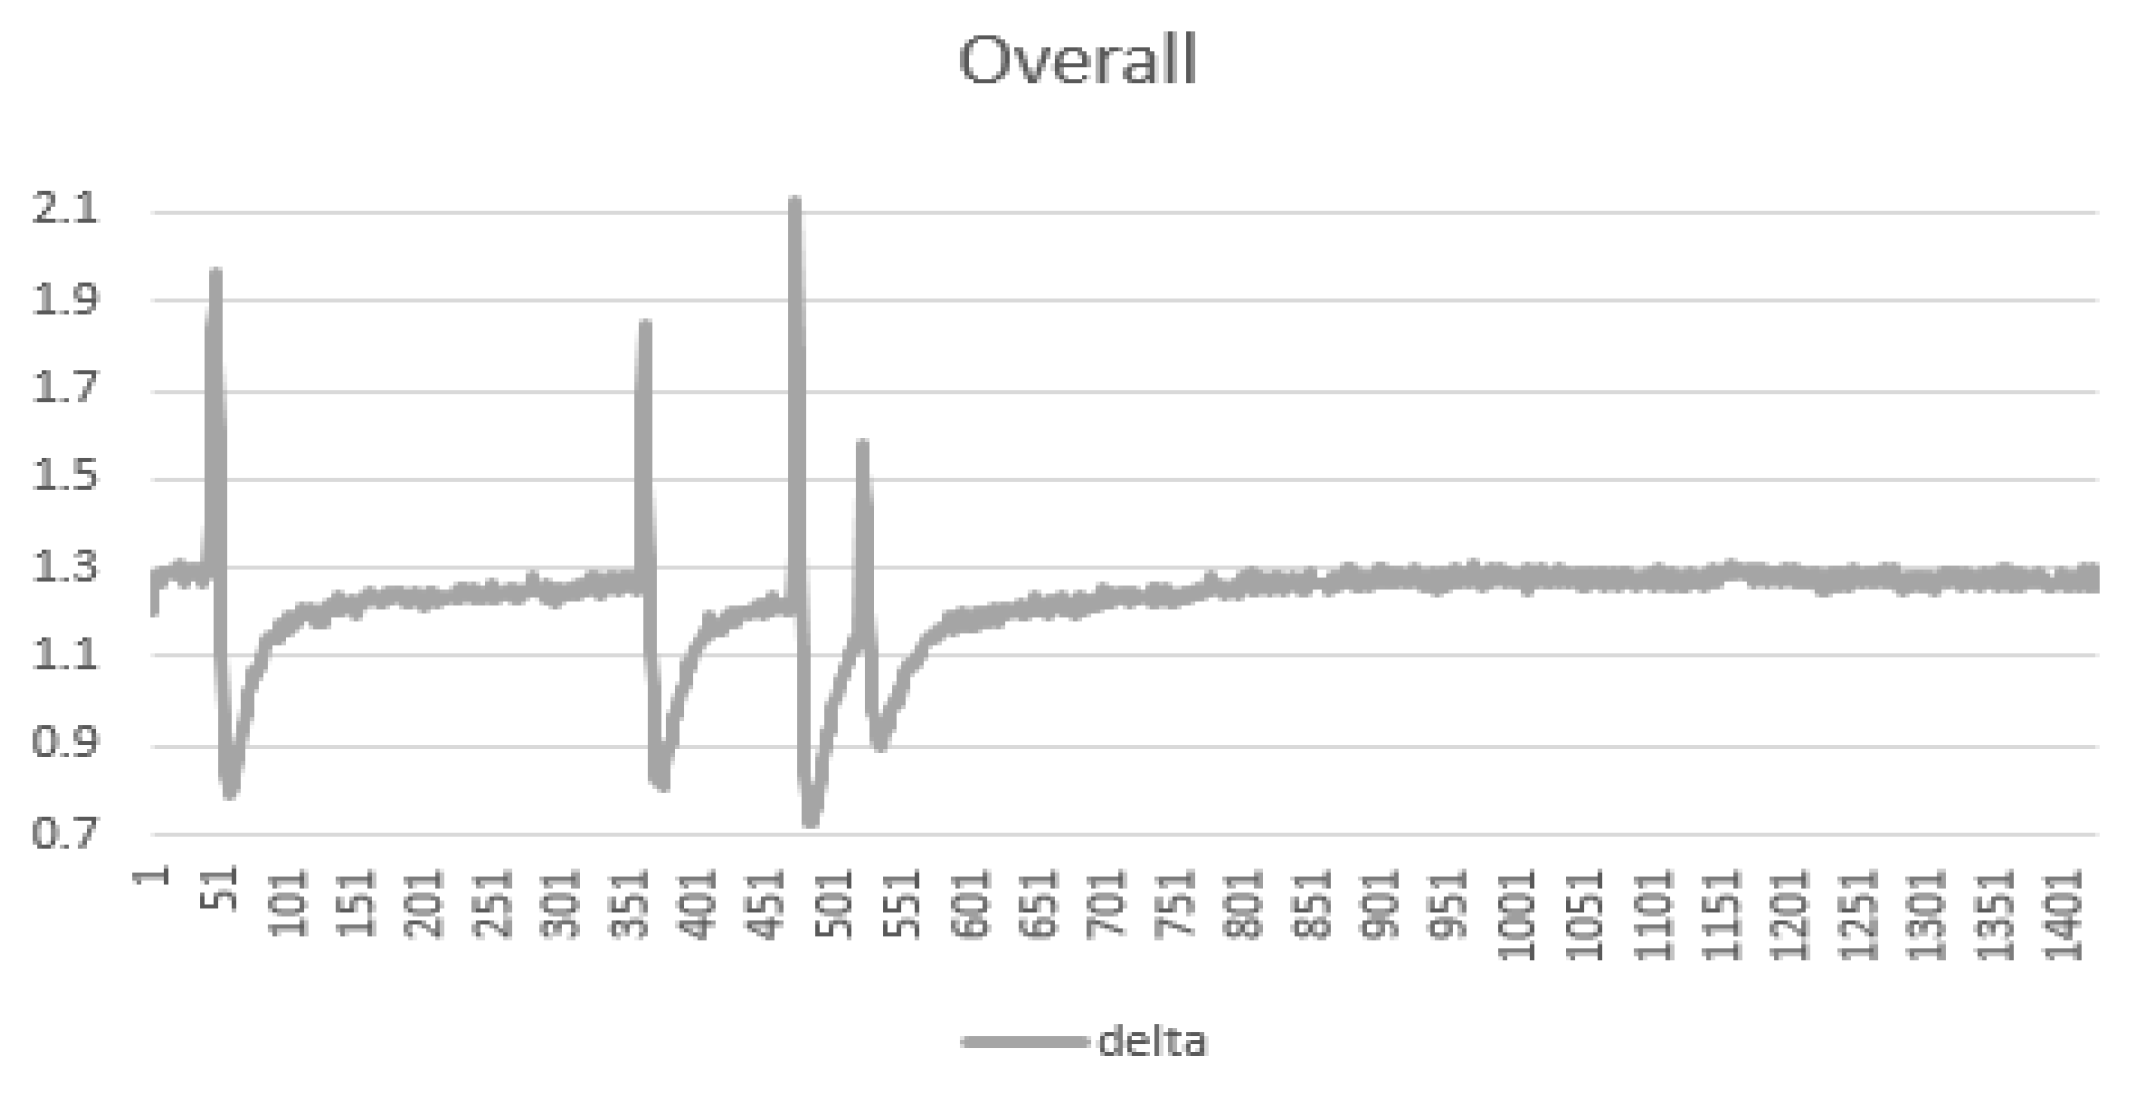
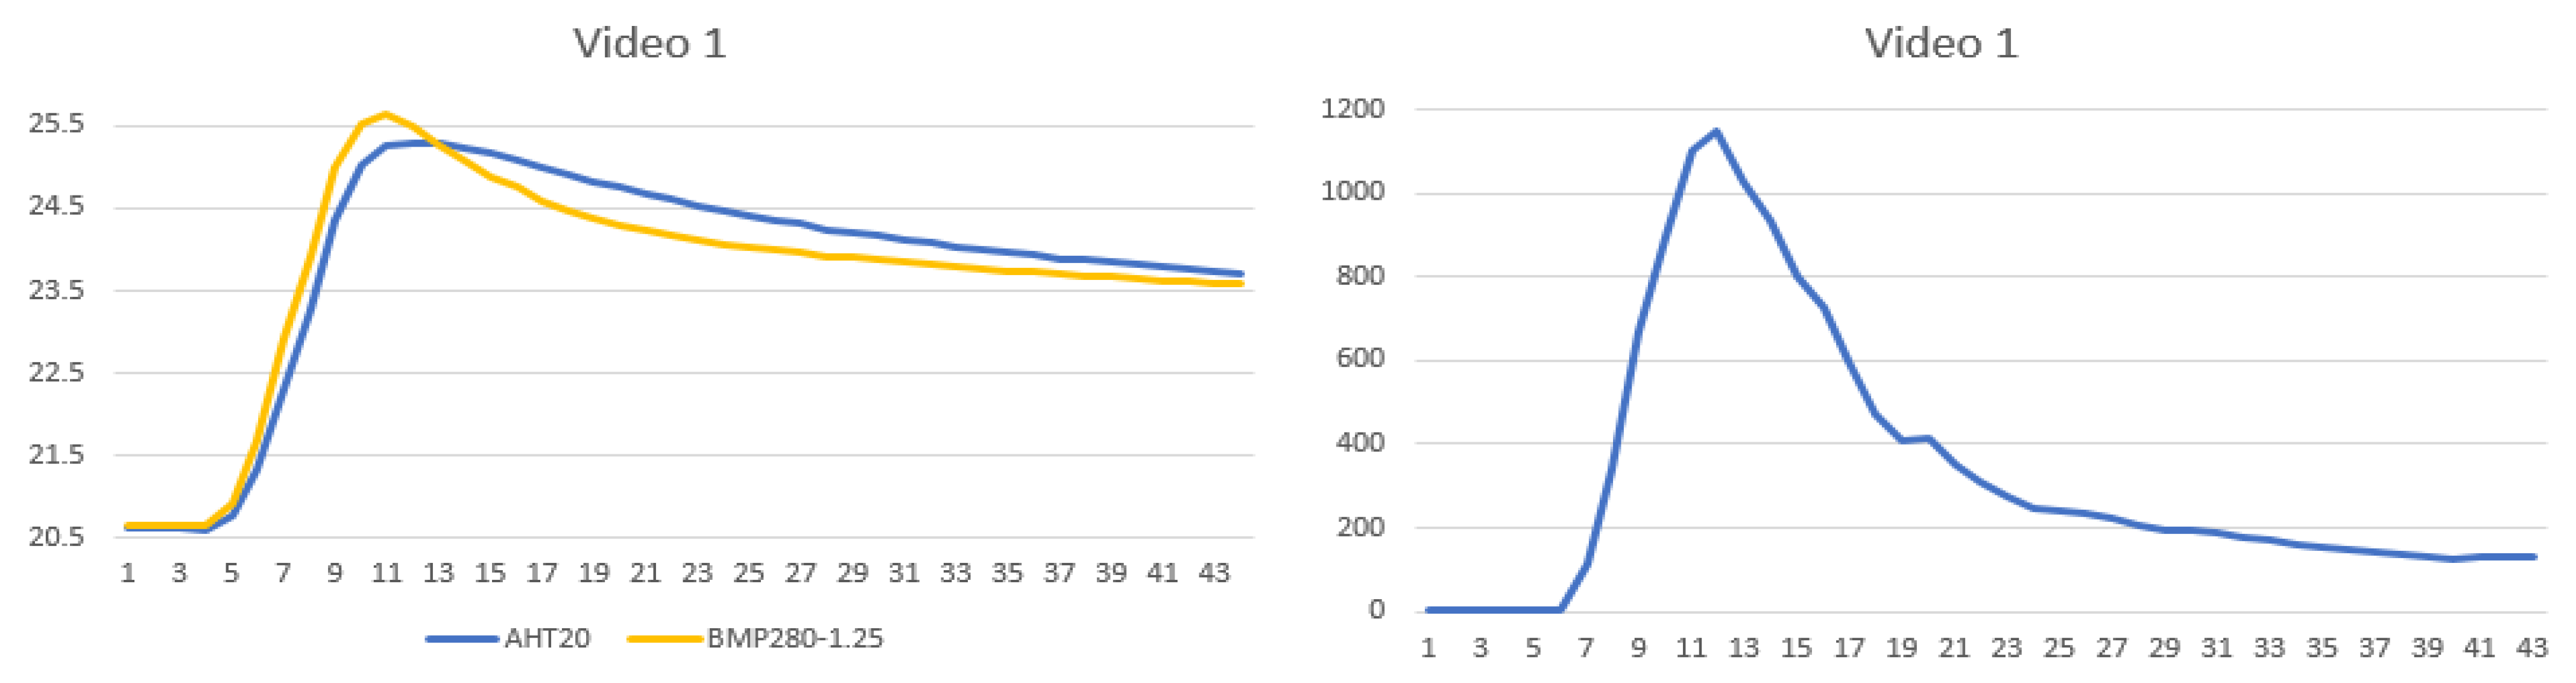
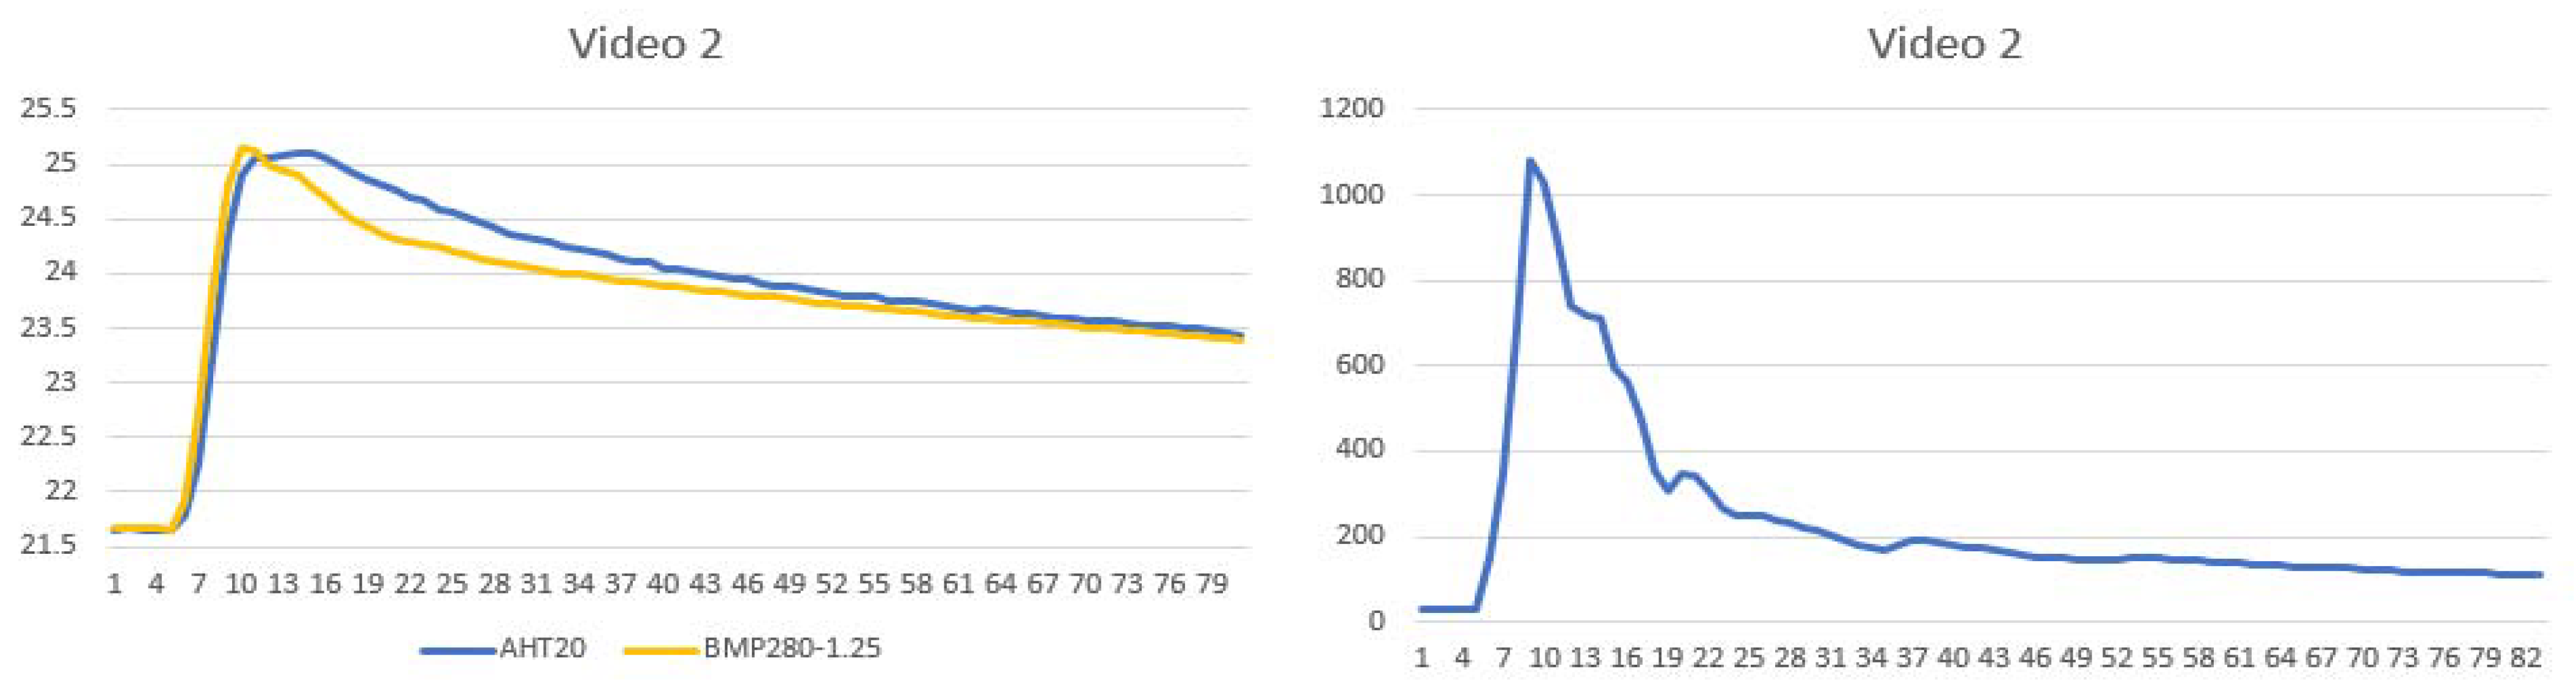
All the data was imported into a spreadsheet, and relevant graphs were plotted. The regions in the graphs with sharp peaks in the readings of the UOTS and the conventional air temperature sensors were identified. The data recorded via the BMP280 sensor was processed to remove a 1.25 °C bias that was observed both in our data and in the literature [9,10].

3. Experimental Results

The experimental results, which were collected and processed according to the procedures described in the preceding section, are presented in Figure 7, Figure 8, Figure 9, Figure 10 and Figure 11. Figure 7 presents temperature readings reported by the conventional temperature sensors throughout the experiment (minus the 1.25 °C bias for the BMP280). The graphs show that even 10 min after the last step change, the readings did not return to the levels observed before the step change. The readings of the different sensors are in good agreement, except for the instances of step temperature changes (Figure 8). We attribute these disparities to differences in the response times of the sensors.
Figure 9, Figure 10 and Figure 11 present changes in the readings of both the conventional air temperature sensors and the UOTS (less 38 kHz) for three distinct temperature step change regions. On all occasions, the readings rose speedily until the hairdryer was switched off, and then returned to the pre-step levels—quickly on the UOTS, but rather slowly on the conventional air sensors. On one occasion, the output frequency of the UOTS included a clear single point outlier (Figure 11, right). We checked this point several times and are confident that the value shown on the graph was displayed by the frequency counter. It could be merely an error (the only error of the frequency counter) or a rollover of the output frequency of the UOTS as the would-be oscillation frequency crossed over the passband of the closed signal loop.
The experimental results show that even properly thermally coupled conventional air temperature sensors placed on the same circuit board can record values that differ within a range of −0.55 °C to +0.85 °C if the air temperature changes rapidly. When the cause of the temperature step change was removed, it took considerable time for the readings to return to their pre-step levels. In contrast, the readings on the UOTS rose quickly on a step change and fell sharply when the step change ended.

4. Summary, Conclusions, and Future Research

We present a recently developed air UOTS, along with detailed equipment and experimental procedures for comparing its response time with the response time of two conventional air temperature sensors, AHT20 and BMP280. The experimental results qualitatively verify the much faster response time of the UOTS. However, this outcome could not be quantified at this stage.
It is important to note that a UOTS registers changes in the ultrasound velocity across the air pathway, which depend not only on the temperature, but also on humidity. However, the experimental data shows that the influence of humidity under tolerable room conditions is one order of magnitude lower than that of temperature [11].
Although the output frequency measurement procedure for the UOTS facilitated the obtaining of reliable results, its granularity of 1 s is insufficient for full characterisation of the properties of the UOTS. There is a need to develop a frequency metre that can measure the input frequency of the UOTS with high accuracy and at high resolution while recording the values multiple times per second. This can be implemented using a temperature-controlled crystal oscillator to provide the reference frequency and a microcontroller with a capture timer(s).
To calibrate the developed UOTS, it is necessary to develop a measurement network that records the temperatures across the complete ultrasonic pathway. If the temperatures along the pathway are altered in a controlled quasi-static manner, it becomes possible to associate the output frequencies of the UOTS with the aggregate air temperatures between the transducers, as required for domestic use.
A significantly large gain of 100 was required to operate the UOTS at a 125 mm distance between the transducers. As ultrasound energy spreads over a spherical surface in the far field, achieving the intended operating distance between the transducers of several metres may require a gain so large that it renders the UOTS unstable.

Supplementary Materials

The following are available online at https://www.mdpi.com/article/10.3390/ecsa-8-11276/s1.

Author Contributions

A.E. and A.N.K. contributed equally to this paper. All authors have read and agreed to the published version of the manuscript.

Funding

This research received no external funding.

Institutional Review Board Statement

Not applicable.

Conflicts of Interest

The authors declare no conflict of interests.

References

  1. Hashmi, A.; Kalashnikov, A.N. Sensor data fusion for responsive high resolution ultrasonic temperature measurement using piezoelectric transducers. Ultrasonics 2019, 99, 105969. [Google Scholar] [CrossRef] [PubMed]
  2. Cole, L. How to Cut Carbon Out of Your Heating. BBC Future. 17 November 2020. Available online: https://www.bbc.com/future/article/20201116-climate-change-how-to-cut-the-carbon-emissions-from-heating (accessed on 17 January 2022).
  3. Temperature Sensor Market by Product Type (Thermocouples, RTDs, Thermistors, Temperature Sensor ICs, Bimetallic, Infrared, and Fiber Optic Temperature Sensors). Output, End-User Industry, and Region–Global Forecast to 2027. Markets and Markets. March 2020. Available online: https://www.marketsandmarkets.com/Market-Reports/temperature-sensor-market-522.html (accessed on 17 January 2022).
  4. Alzebda, S.; Kalashnikov, A.N. Ultrasonic sensing of temperature of liquids using inexpensive narrowband piezoelectric transducers. IEEE Trans. Ultrason. Ferroelectr. Freq. Control 2010, 57, 2704–2711. [Google Scholar] [CrossRef] [PubMed]
  5. Popejoy, P.; Alzebda, S.; Hashmi, A.; Harriott, M.; Sonbul, O.; Kalashnikov, A.; Hayes-Gill, B. Comparison of implementations of driving electronics for ultrasonic oscillating sensors. In Proceedings of the 2012 IEEE International Ultrasonics Symposium, Dresden, Germany, 7–10 October 2012; pp. 2427–2430. [Google Scholar] [CrossRef]
  6. Hashmi, A.; Malakoutikhah, M.; Light, R.A.; Kalashnikov, A.N. Embedded supervisory control and output reporting for the oscillating ultrasonic temperature sensors. In Intelligent Systems in Cybernetics and Automation Theory; Silhavy, R., Senkerik, R., Kominkova, Z., Oplatkova, P.Z., Silhavy, P., Eds.; Springer: Berlin/Heidelberg, Germany, 2015; pp. 139–150. [Google Scholar]
  7. 8-Digit LED Frequency Counter Module. Model PLJ-8LED-C User Manual. Available online: https://www.manualslib.com/manual/1522425/Sanjian-Studio-Plj-8led-C.html (accessed on 17 January 2022).
  8. Seeeduino, X. Product Support Page. Available online: https://wiki.seeedstudio.com/Seeeduino-XIAO/ (accessed on 17 January 2022).
  9. Liutyi, O. Test i2c Humidity Sensors. V5 Sensors Board. Available online: https://wiki.liutyi.info/display/ARDUINO/v5+Sensors+Board+project (accessed on 17 January 2022).
  10. BME 280 Temp Offset/Self Heating. Adafruit’s Forum Discussion. Started November 2019. Available online: https://forums.adafruit.com/viewtopic.php?f=19&p=534525 (accessed on 17 January 2022).
  11. Speed of Sound in Air. Section 2.4.1 “The Speed and Attenuation of Sound”. Kaye and Laby Online. Available online: https://web.archive.org/web/20190508003406/http:/www.kayelaby.npl.co.uk/general_physics/2_4/2_4_1.html#speed_of_sound_in_air (accessed on 17 January 2022).
Figure 1. Schematic diagram of the electronic driver.
Engproc 10 00062 g001
Figure 2. Fixture for ultrasonic transducers.
Engproc 10 00062 g002
Figure 3. Connected components of the UOTS in operation.
Engproc 10 00062 g003
Figure 4. Temperature measurement setup with the conventional air temperature sensors AHT20 and BMP280 on the same board.
Engproc 10 00062 g004
Figure 5. Complete experimental setup in operation.
Engproc 10 00062 g005
Figure 6. Sensors and hairdryer inside a cardboard enclosure outside of a cardboard enclosure.
Engproc 10 00062 g006
Figure 7. Four temperature step changes recorded via the conventional air temperature sensors.
Engproc 10 00062 g007
Figure 8. Difference between readings of the conventional air temperature sensors.
Engproc 10 00062 g008
Figure 9. Sensor readings for each second of the first step change (left: AHT20 and BMP280, in centigrade; right: the UOTS, in Hz).
Engproc 10 00062 g009
Figure 10. Sensor readings for each second of the second step change (left: AHT20 and BMP280, in centigrade; right: the UOTS, in Hz).
Engproc 10 00062 g010
Figure 11. Sensor readings for each second of the third and fourth step changes (left: AHT20 and BMP280, in centigrade; right: the UOTS, in Hz).
Engproc 10 00062 g011
Publisher’s Note: MDPI stays neutral with regard to jurisdictional claims in published maps and institutional affiliations.

