1. Introduction
Micromechatronic vibration sensors are spring–mass-system-based sensors that show a frequency-dependent transfer behaviour due to resonance effects. The maximum operation frequency of such a sensor depends on the tolerable linearity error. Typically the maximum operation frequency is one order of magnitude below the first resonant frequency
of the involved spring–mass system. At frequencies below the resonance frequency, these sensors show nearly linear transfer behaviour between displacement and acceleration [
1]. Vibration sensors for frequencies
kHz are typically calibrated using either an impulse or a shaker with a continuous harmonic excitation in combination with a reference transducer [
2]. Current research investigates spring–mass-systembased sensors for dynamic displacements (
kHz), which are operated quasi-free (
) [
3]. Due to their dynamic behaviour, these sensors cannot be used for the acquisition of continuous signals, but can serve to resolve sinusoidal burst signals, as GUW used for SHM.
For ultrasonic signals, the common calibration approaches are not applicable since reference transducers are not available for this high frequency. However, to calibrate the sensor for typical GUW signals, a setup can be used, which generates a well-defined waveform at the sensor location. The sensor can then be calibrated on the basis of the known excitement.
The aim of this work is the creation of a test bed for a MEMS sensor under a structure-borne GUW excitation and addresses three challenges.
Firstly, material damping has an influence on the possible propagation path length of GUW. Since the particle velocity increases with frequency, the absorption effect increases linear with the frequency. This causes stronger damping effects for higher frequencies [
4] (p. 20).
Secondly, GUW show a frequency-dependent dispersive behaviour. When excited by a windowed sinusoidal burst signal, the wave packages distort in the course of wave propagation and show a different appearance in the wave field depending on the excitation signal’s bandwidth [
5]. Furthermore, the regarded frequency range of a considered wave mode might show different strong dispersive behaviours.
Thirdly, the structure’s size causes reflections from the edges due to high propagation velocities. The reflections superpose with the propagating waves and increase the complexity of the wave field. The distinction between the sensor’s structural behaviour and the forced vibration from the surrounding environment is crucial for a reliable characterisation process.
2. Materials and Methods
The ultrasound sensor, as presented in [
3], is supposed to be operated quasi-free in the frequency range from approximately 50 kHz–200 kHz. In reference to the challenges introduced in
Section 1, structural and dynamical parameters such as material damping, chosen excitation GUW mode and the test bed thickness and size are discussed.
2.1. Material and GUW Mode Selection
The authors chose rolled sheet aluminium as material for the test bed due to a lower material damping compared to epoxy resin used in fibre-reinforced polymers [
6] (p. 116). This ensured a high range of wave propagation inside the waveguide.
The MEMS sensor was designed as an out-of-plane vibration sensor. To generate a high signal-to-noise ratio, a sufficiently high out-of-plane component for the sensors’ excitation is required. Therefore, the
-mode was selected for the excitation, due to its higher out-of-plane component compared to the
-mode [
7] (p. 103).
The damping behaviour of the MEMS pickup needs to be identified. The authors’ aim was to generate the longest possible time span between the excited fundamental wave modes. This ensured that the excited MEMS sensor’s oscillation had declined before an excitation by a following wave package occurred.
2.2. Influence of the Structure’s Thickness on the Degree of Dispersion
The authors performed a parameter study on the influence of the aluminium structure’s thickness on the degree of dispersion of the
-mode. The dispersion relation for an aluminium plate was estimated for three different thicknesses (0.5 mm, 1 mm and 5 mm). The free software application GUIGUW was used to solve the dispersion relation, which leads to the solution of the frequency-dependent phase velocities, group velocities, wave numbers and wavelengths. The material parameters chosen for the simulation are listed in
Table 1.
The group velocity describes the propagation velocity of a wave package. In case of dispersive waves, it differs from the velocities of individual waves in the package due to different propagation speeds at different excitation frequencies. The degree of dispersion depends on the time span of the excitation signal, i.e., the number of cycles in the burst excitation. It decreases with an increase of cycles in the excitation burst since the excitation spectrum gets narrower and therefore excites less individual waves [
5] (p. 154).
The phase velocities in the range of 50 kHz–200 kHz were extracted and derived according to the frequency, to quantify the degree of dispersion. From this, the authors were able to deduce a possible plate thickness that showed the lowest degree of dispersion regarding the -mode.
2.3. Estimation of Wave Propagation Behaviour Regarding Mode Separation
An 800 mm × 800 mm wide aluminium plate of 1 mm thickness was used as a specimen. Sealant was glued to the edges all around the plate to minimise edge reflections. A round PZT-actuator was applied to the centre of the plate. As excitation signal, a 5-cycle Hanning-windowed sinusoidal burst of approximately 1.35 V was chosen, which was amplified 40 times by a power amplifier. Two burst centre frequencies were chosen, 50 kHz and 200 kHz, as limiting cases for the considered frequency range. The time between two burst pulses was 50 ms to avoid superposition with previously excited reflections. A laser Doppler vibrometer (LDV) from Polytec GmbH was used for recording the out-of-plane component of the wave field. Seventeen measurement points were aligned on the aluminium plate’s surface. The first measuring point was located approximately 13 mm away from the actuator’s centre. All the following points were at an equidistant distance of 22 mm from each other. For the measurement, the aluminium plate was leaned against a fixation that caused an angle between the laser beam and the specimen’s surface. The angle correction function of Polytec in the x- and y-direction was used to estimate the actual out-of-plane amplitude. A trigonometric compensation calculation was used to compensate angle errors due to a nonperpendicular impact of the laser beam on the plate’s surface. The signal was averaged 50 times. The displacement decoder was used to gain information about the absolute deflection amplitude of the structure’s surface as a measure of the later sensor excitation amplitude. No digital filtering of the LDV signal was used. The measurement time was set to 400 s. The measurement was triggered by an internal system trigger signal. For each measuring point, the time signal was examined for occurring modes, mode separation and possible reflections.
3. Results
In this section, the authors deduce the degree of dispersion from the phase velocities, as well as the wave propagation behaviour regarding the mode separation of the
- and
-mode obtained from an experimental setup. Criteria for the test bed preparation can be deduced from the requirements described in
Section 2.
3.1. Influence of the Structure’s Thickness on the Degree of Dispersion
Based on the different phase velocities for three different aluminium plate thicknesses, the authors deduced the changing rate of the phase velocities of the
-mode as a measure of the degree of dispersion. It lead to the overview shown in
Figure 1.
Regarding the frequency range of interest described in
Section 2, highest phase velocity changing rates were expected in the lower frequencies and an increase with the plate thickness. With increasing frequency, the phase velocity changing rates approached each other for all plate thicknesses. The authors conclude that, especially for lower frequencies, a thin plate should be chosen over a thicker plate. Therefore a 1 mm aluminium plate was used as a compromise between phase velocity changing rates and experimental manageability.
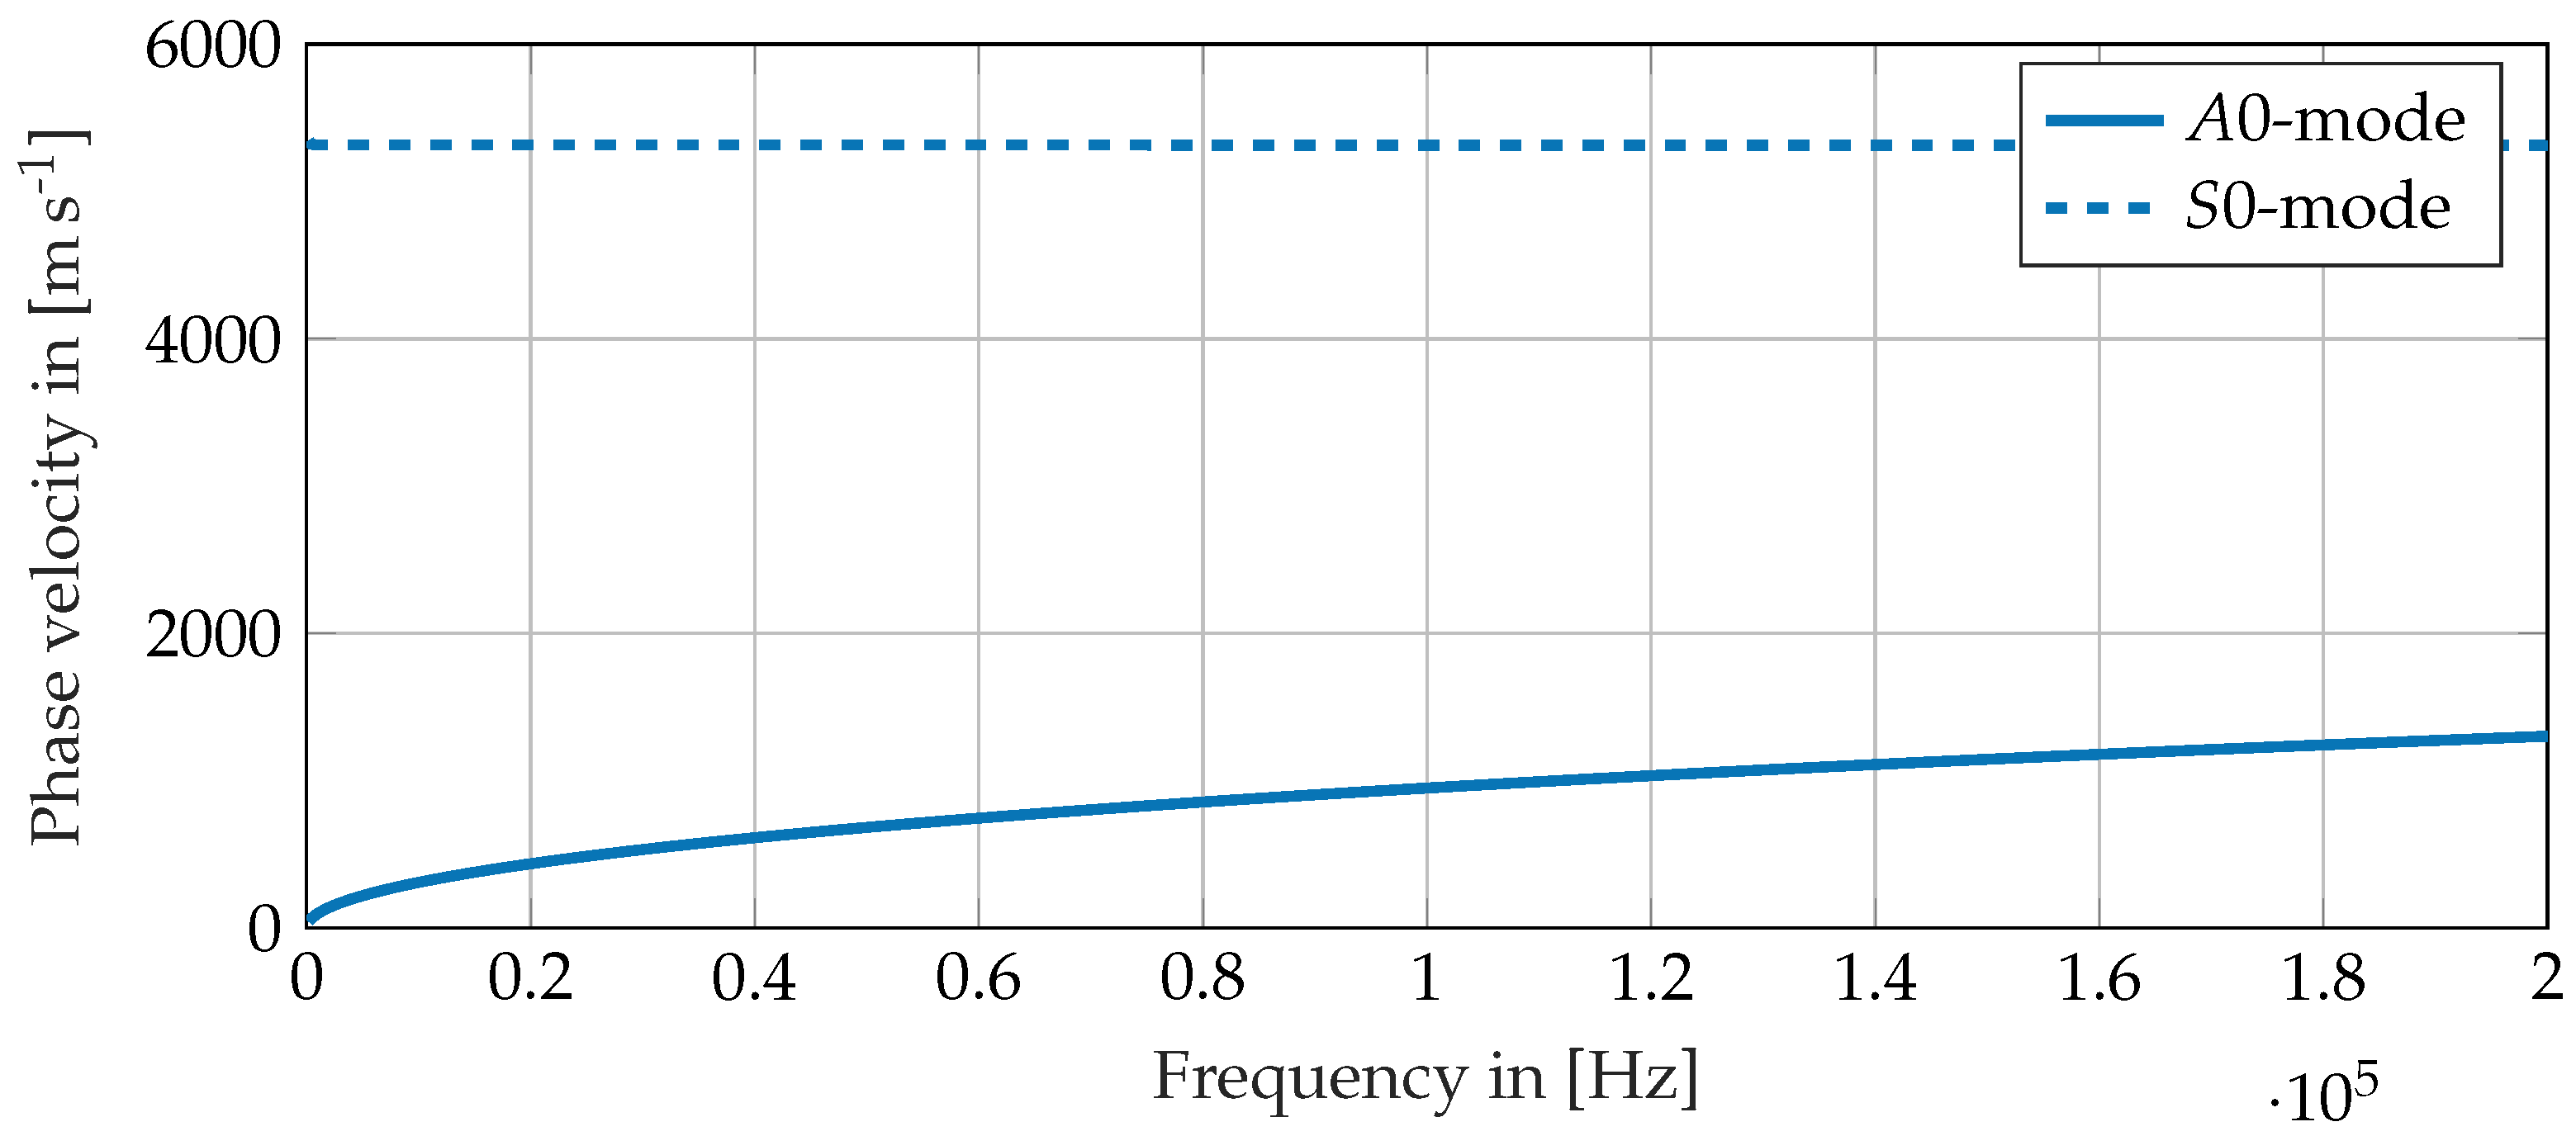
Figure 2 shows the dispersion diagram of the phase velocity of the two fundamental Lamb wave modes for the selected material. The phase velocity for the
-mode is nearly constant for the considered frequency range, while the phase velocity of the
-mode increases. From 50 kHz to 200 kHz, the phase velocity has approximately doubled.
3.2. Estimation of Wave Propagation Behaviour Regarding Mode Separation
In this subsection, we estimate how mode separation at the two different frequencies occur. For the purpose of sensor characterisation, it is desirable to separate the preferred -mode from the neglected -mode in the time domain, to avoid returning edge reflections due to the narrow specimen width dimensions.
Referring to the dispersion relation for a 1 mm thick aluminium plate of 800 mm × 800 mm area, the
-mode reflects at the edges of the specimen after
s for all excitation frequencies in the considered frequency range. The
-mode at 200 kHz starts to reflect after
s and at 50 kHz it reflects after
s, due to the higher degree of dispersion in this frequency range as can be seen from
Figure 1. Therefore the authors expect a
-mode reflection during the selected measurement time for wave propagation in the considered frequency range.
For this estimation, the time difference between the maximum of the excitation burst and the maximum of the considered wave package was assumed.
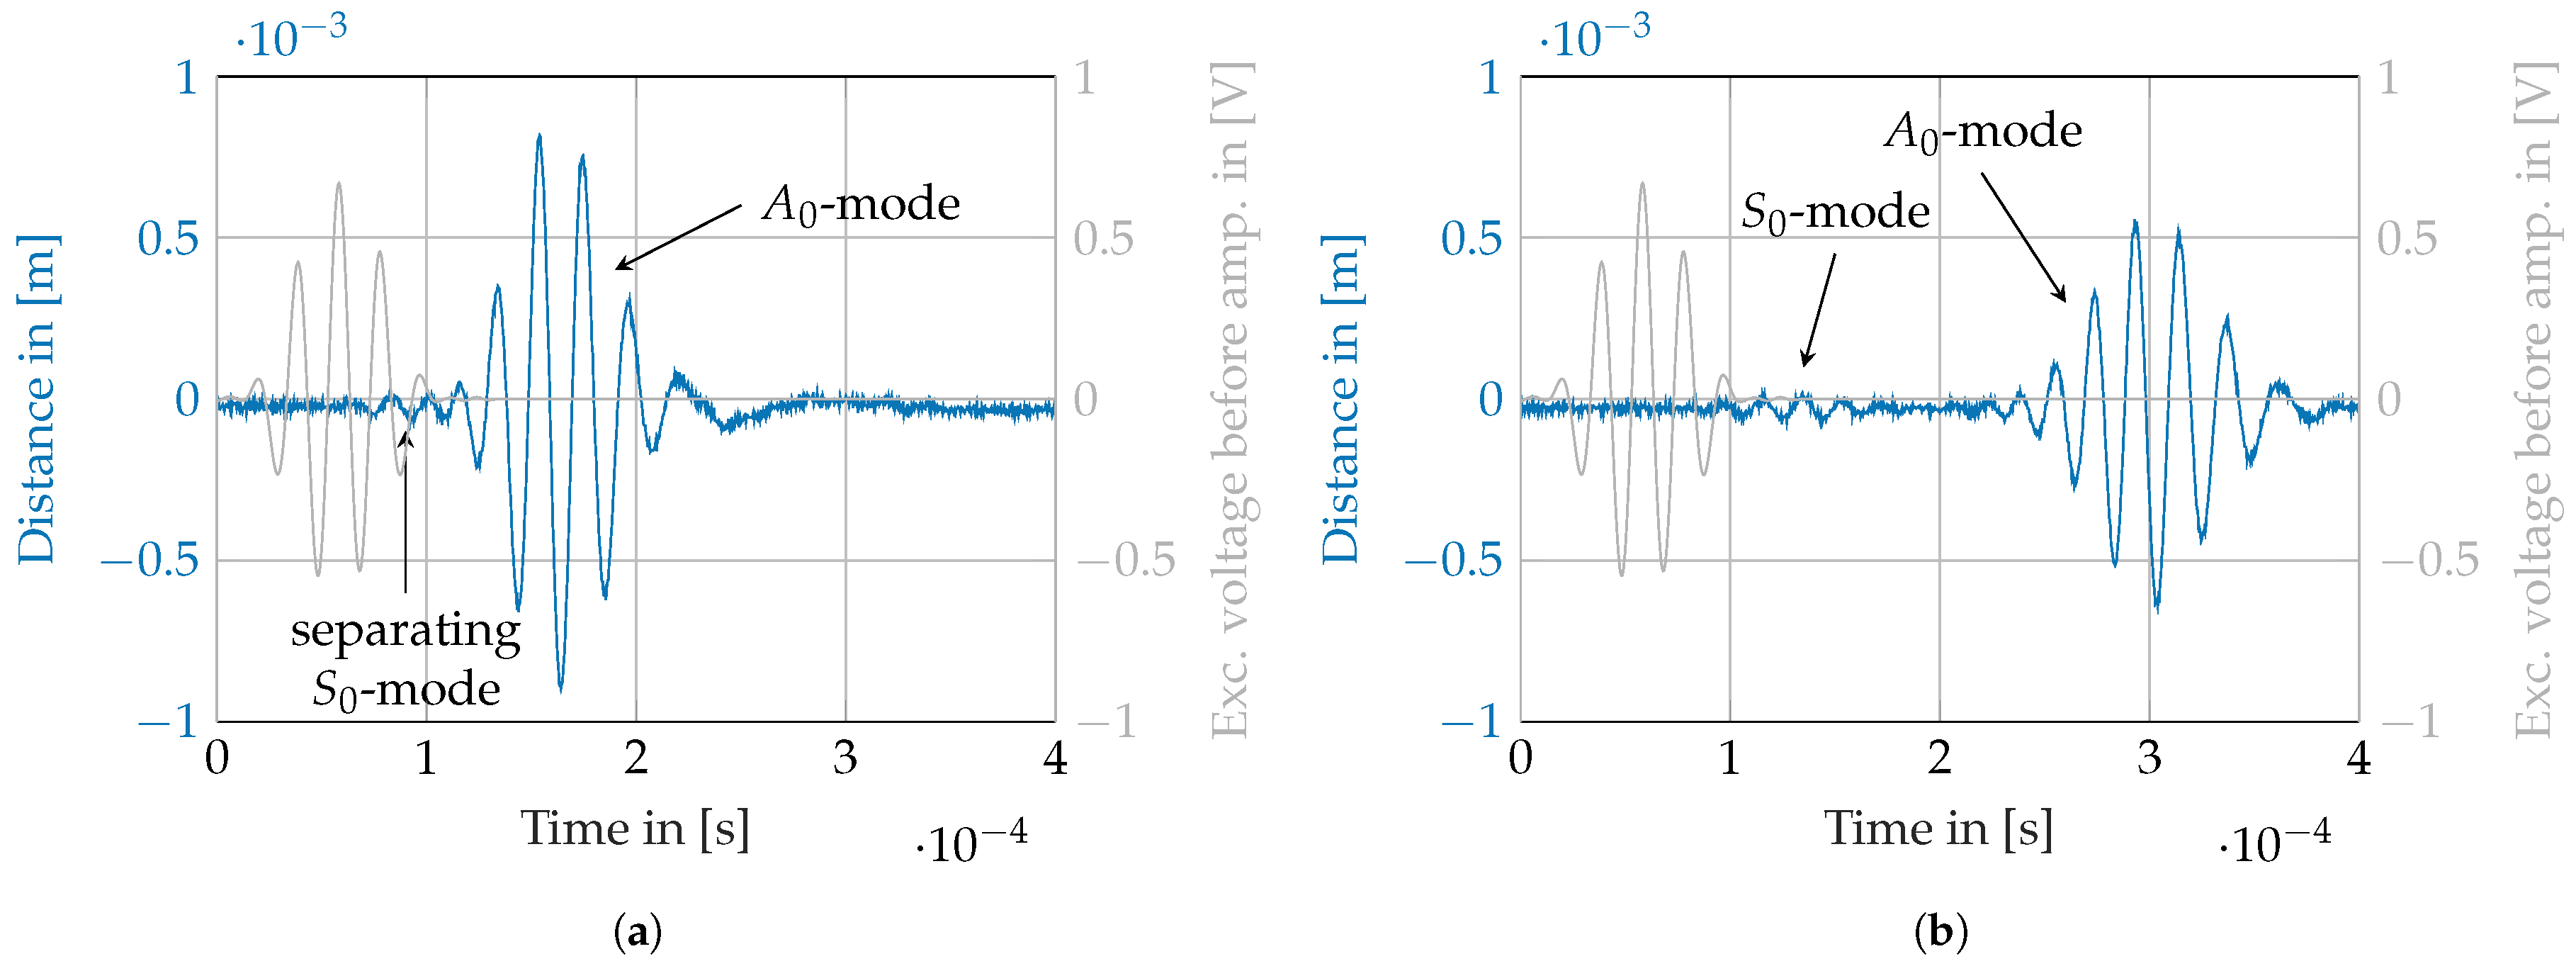
3.2.1. Mode Separation at 50 kHz
Figure 3 shows the wave propagation at two selected points for a burst centre frequency of 50 kHz. The mode separation starts to be visible at a running length of approximately 123 mm as shown in
Figure 3a. In the following course along the path, the
-mode shows a very low amplitude in comparison to the
-mode.
In
Figure 3b, the modes are separated. Along the following measurement path to the plate’s edge, it can not be clearly said if a
-reflection starts to be visible as a returning wave. Referring to the estimation of the reflection times described in
Section 3.2, a reflected
-mode should occur.
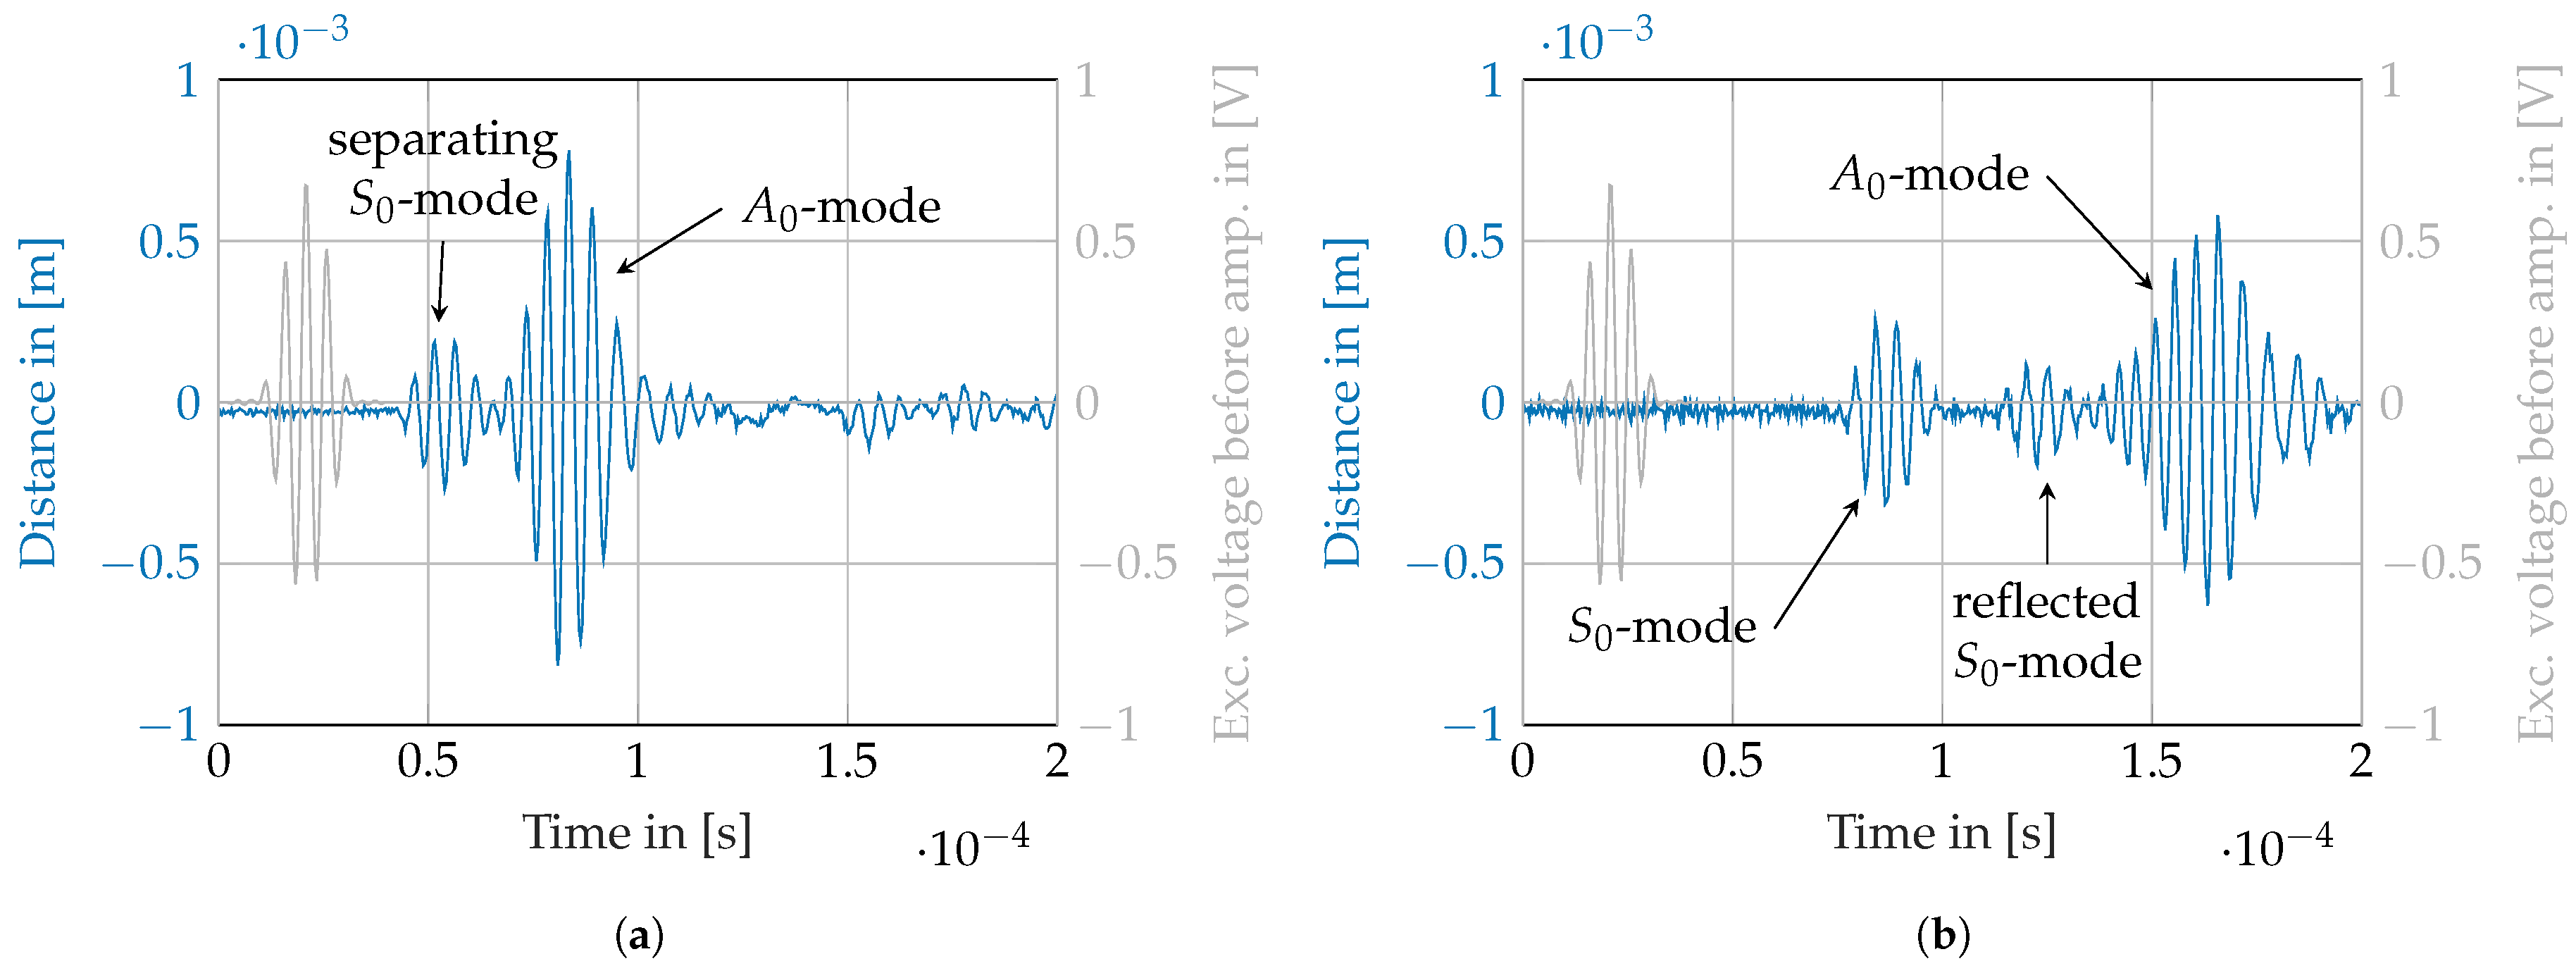
3.2.2. Mode Separation at 200 kHz
At 200 kHz at a distance of approximately 123 mm from the actuator, the
-mode and the
-mode start to separate due to their different propagation speeds, as visible in
Figure 4a. Following the path, the modes separate more in time. At a distance of approximately 300 mm from the actuator, another mode separates from the
-mode that the authors identified as an edge reflection of the
-mode.
Figure 4b shows the three occurring wave packages: the forward-propagating
-mode, the forward-propagating
-mode after their separation and the reflected
-mode. In the course of the path, this reflection starts to superpose with the forward-running
-mode at a distance of approximately 350 mm.
4. Discussion
The experimental study shows that edge reflections make it difficult to clearly separate the wave modes as defined input excitation signals for a later sensor calibration test bed. The authors conclude that mode selective excitation as well as a good damping at the specimen’s edges is required to be able to use a specimen of a limited width. Additionally, the structure’s dispersive behaviour should be taken into account. Ideally, the sensor characterisation is performed in a frequency range with low dispersion or dependent on the desired frequencies on a structure that shows a low degree of dispersion in the considered frequency range.
At 200 kHz, due to the edge reflection of the -mode, it was not possible to gain separated modes with sufficiently long time separation with the used plate specimen because the edge reflection started to superpose shortly after the separation of the -mode and -mode took place.
At a running length of approximately 303 mm, the comparison between the times of flight of the
-mode show that it doubles at 50 kHz in comparison to 200 kHz. This can be explained by the doubling of the phase velocity of the
-mode at 200 kHz (approximately 1300 ms
) in comparison to its phase velocity at 50 kHz (approximately 690 ms
) as shown in
Figure 2.
5. Conclusions
The authors conclude that for a test bed, a possibly thin aluminium plate should be used that is as large as possible in width. This helps prevent edge reflections. Additionally, -mode reflections can be suppressed in the first place when a mode-selective excitation for the -mode is realized, which minimises the -mode excitation. Referring to the evaluated distances in our setup at which mode separation starts to occur, no distances less than 300 mm to the actuator in the plate’s centre should be chosen for the acceleration sensor positioning. The complete mode separation at both evaluated frequencies took place after 300 mm of measurement path. In a wider aluminium plate, it can be assumed that the separated modes have sufficient time span between each other, so that the oscillation of an applied sensor excited by the -mode can be observed. A further forced excitation by reflected waves can be avoided.
The authors conclude that an adjusted setup can be realized if the requirements for sensor calibration are considered.
Author Contributions
Conceptualization, L.R.; methodology, L.R.; software, L.R.; validation, L.R., T.R. and J.N.H.; formal analysis, L.R., T.R., J.N.H.; investigation, L.R.; resources, L.R., T.R., J.N.H.; data curation, L.R., T.R.; writing—original draft preparation, L.R.; writing—review and editing, T.R., J.N.H.; visualization, L.R., T.R.; supervision, M.S.; project administration, M.S.; funding acquisition, M.S., A.D. All authors have read and agreed to the published version of the manuscript.
Funding
The authors expressly acknowledge the financial support for the research work on this article of the Research Unit 3022 “Ultrasonic Monitoring of Fibre Metal Laminates Using Integrated Sensors” (Project number: 418311604) by the German Research Foundation (Deutsche Forschungsgemeinschaft (DFG)).
Institutional Review Board Statement
Not applicable.
Informed Consent Statement
Not applicable.
Data Availability Statement
The raw data of the experiments can be requested from the authors.
Conflicts of Interest
The authors declare no conflict of interest. The funders had no role in the design of the study; in the collection, analyses, or interpretation of data; in the writing of the manuscript, or in the decision to publish the results.
References
- Büttgenbach, S.; Constantinou, I.; Dietzel, A. (Eds.) Case Studies in Micromechatronics: From Systems to Processes, 1st ed.; Springer: Berlin/Heidelberg, Germany, 2020. [Google Scholar]
- Veldman, C.S. ISO 16063; A comprehensive set of vibration and shock calibration standards. In Proceedings of the XVIII IMEKO World Congress Metrology for a Sustainable Development, Rio de Janeiro, Brazil, 17–22 September 2006; pp. 1–5. [Google Scholar]
- Haus, J.N. MEMS Ultrasound Sensor with Functional Compliance for Structural Health Monitoring in Fiber Metal Laminates. In Proceedings of the Micro and Nano Engineering Conference, Torino, Italy, 20–23 September 2021. [Google Scholar]
- Liebers, N. Ultraschallsensorgeführte Infusions- und Aushärteprozesse für Faserverbundkunststoffe. Ph.D. Thesis, German Aerospace Center, Braunschweig, Germany, 2018. [Google Scholar]
- Giurgiutiu, V. Structural Health Monitoring with Piezoelectric Wafer Active Sensors; Academic Press/Elsevier: Amsterdam, The Netherlands, 2008. [Google Scholar]
- Krautkrämer, J.; Krautkrämer, H. (Eds.) Werkstoffprüfung Mit Ultraschall; Springer: Berlin/Heidelberg, Germany, 1975. [Google Scholar]
- Gabbert, U.; Sinapius, M.; Schuster, T.; Wierach, P.; Lammering, R. Lamb-Wave Based Structural Health Monitoring in Polymer Composites, 1st ed.; Lehrbuch; Springer: Berlin/Heidelberg, Germany, 2017. [Google Scholar]
| Publisher’s Note: MDPI stays neutral with regard to jurisdictional claims in published maps and institutional affiliations. |
© 2021 by the authors. Licensee MDPI, Basel, Switzerland. This article is an open access article distributed under the terms and conditions of the Creative Commons Attribution (CC BY) license (https://creativecommons.org/licenses/by/4.0/).


