Proceeding Paper

Surface-Mounted Smart PZT Sensors for Monitoring Damage Using EMI-Based Multi-Sensing Technique †

by
Aditya Parpe
* and
Thiyagarajan Jothi Saravanan
School of Infrastructure, Indian Institute of Technology Bhubaneswar, Argul, Khordha 752050, India
*
Author to whom correspondence should be addressed.
Presented at the 8th International Electronic Conference on Sensors and Applications, 1–15 November 2021; Available online: https://ecsa-8.sciforum.net.
Eng. Proc. 2021, 10(1), 51; https://doi.org/10.3390/ecsa-8-11254
Published: 1 November 2021

Abstract

:
In this article, a multi-sensing technique on surface-mounted PZT sensors is proposed. The investigation was performed on concrete structures to detect and localize structural damage. Multiple smart sensing units (SSU) were adhesively bonded on the top surface of a concrete beam. As each PZT sensor features a small zone of influence, the use of multiple smart sensors is recommended for effective damage detection. The conductance signatures were obtained at different stages in the frequency range of 0–450 kHz. This article also presents an effective methodology for damage localization, which assumes the parallel connection of SSUs in MISO mode. The methodology adopted for structural damage detection is effective, as it is verified by the experimental results performed on concrete structures with multiple surface-mounted PZT sensors.

1. Introduction

Smart materials are known for their ability to couple between multiple physical domains. They are widely used for the effective monitoring of structures [1]. Lead Zirconate Titanate (PZT) is known as a self-sensing material as it can act as an actuator and sensor. PZT sensors involve electro-mechanical (EM) coupling. Based upon EM coupling between the sensor and the structure, the electro-mechanical impedance (EMI) technique is proven to be promising for effective structural health monitoring (SHM). The EMI measurements are obtained from adhesively bonded PZT sensors to examine the changes caused due to damage [2,3]. Damage diagnosis [4] is the main objective behind using the EMI technique. Furthermore, embedded PZT sensors are famous for monitoring the early-age strength of concrete structures [5,6].
Researchers have performed numerical [7] and analytical [8] studies based upon adhesively bonded PZT sensors. The numerical approach utilizes coupled field analysis (CFA) through Finite Element Modeling (FEM). Researchers have studied the sensitivity of PZT sensors for damage detection in concrete structures for studies based upon damage detection. Generally, structural damage is observed as cracks, deterioration, and holes in the structure. The conductance signatures obtained at various stages are compared in order to notice the changes caused due to damage [9] and to quantify changes among signatures, damage indices [10] are preferred. Whenever the external load exceeds threshold values, damage occurs. The presence of multiple PZT sensors bonded on the structure helps to monitor damage [11,12]. The availability of multiple PZT sensors also helps localize the damage in the structure. Therefore, researchers have proposed the idea of a multi-sensing technique to avoid ambiguity [13].
In previous research, the utilization of surface-mounted smart PZT sensors has helped scholars to perform studies for the purpose of damage detection, but the methodology for damage localization is not yet clear. It is important to localize damage in structures, as it is an important aspect of SHM. The current study focuses on damage detection and localization in concrete structures using the multi-sensing technique. The investigation of adhesively bonded smart PZT sensors was carried out using CFA through FEM. The parallel/serial connection of smart PZT sensors must be performed in MISO mode for the proposed localization method. Accordingly, the composite signatures of different combinations of SSUs were taken for the estimation of the approximate location of the damage. Furthermore, the methodology adopted for structural damage detection was validated by experimental studies. The trend of numerical and experimental results is compared to observe the correlation between them.

2. Methodology and Investigation

2.1. Introduction of Smart Sensing Units (SSUs)

The SSU consists of a PZT patch, adhesive layer (RS epoxy), and mild steel plate. For the current study, varying thicknesses of SSUs were taken. Steel plates sized 21 mm × 21 mm with varying thicknesses (0.75 mm, 1.5 mm, and 3 mm) were used. The PZT patch and adhesive layer size were 10 mm × 10 mm × 0.3 mm and 10 mm × 10 mm × 0.1 mm. The properties of PIC 151 were considered for the PZT patch. For the FE simulation of the SSUs, various in-built elements were used. The mesh size of the whole SSUs was taken as 1 mm. The top and bottom nodes of the PZT patch were given input voltages of 1 V and 0 V, respectively, and coupled with the ‘VOLT’ DOF to allow the current flow. These SSUs were harmonically excited in the high-frequency range of 0–450 kHz. The resonant frequencies of each SSU were distinct as different thick plates are used, as shown in Table 1.

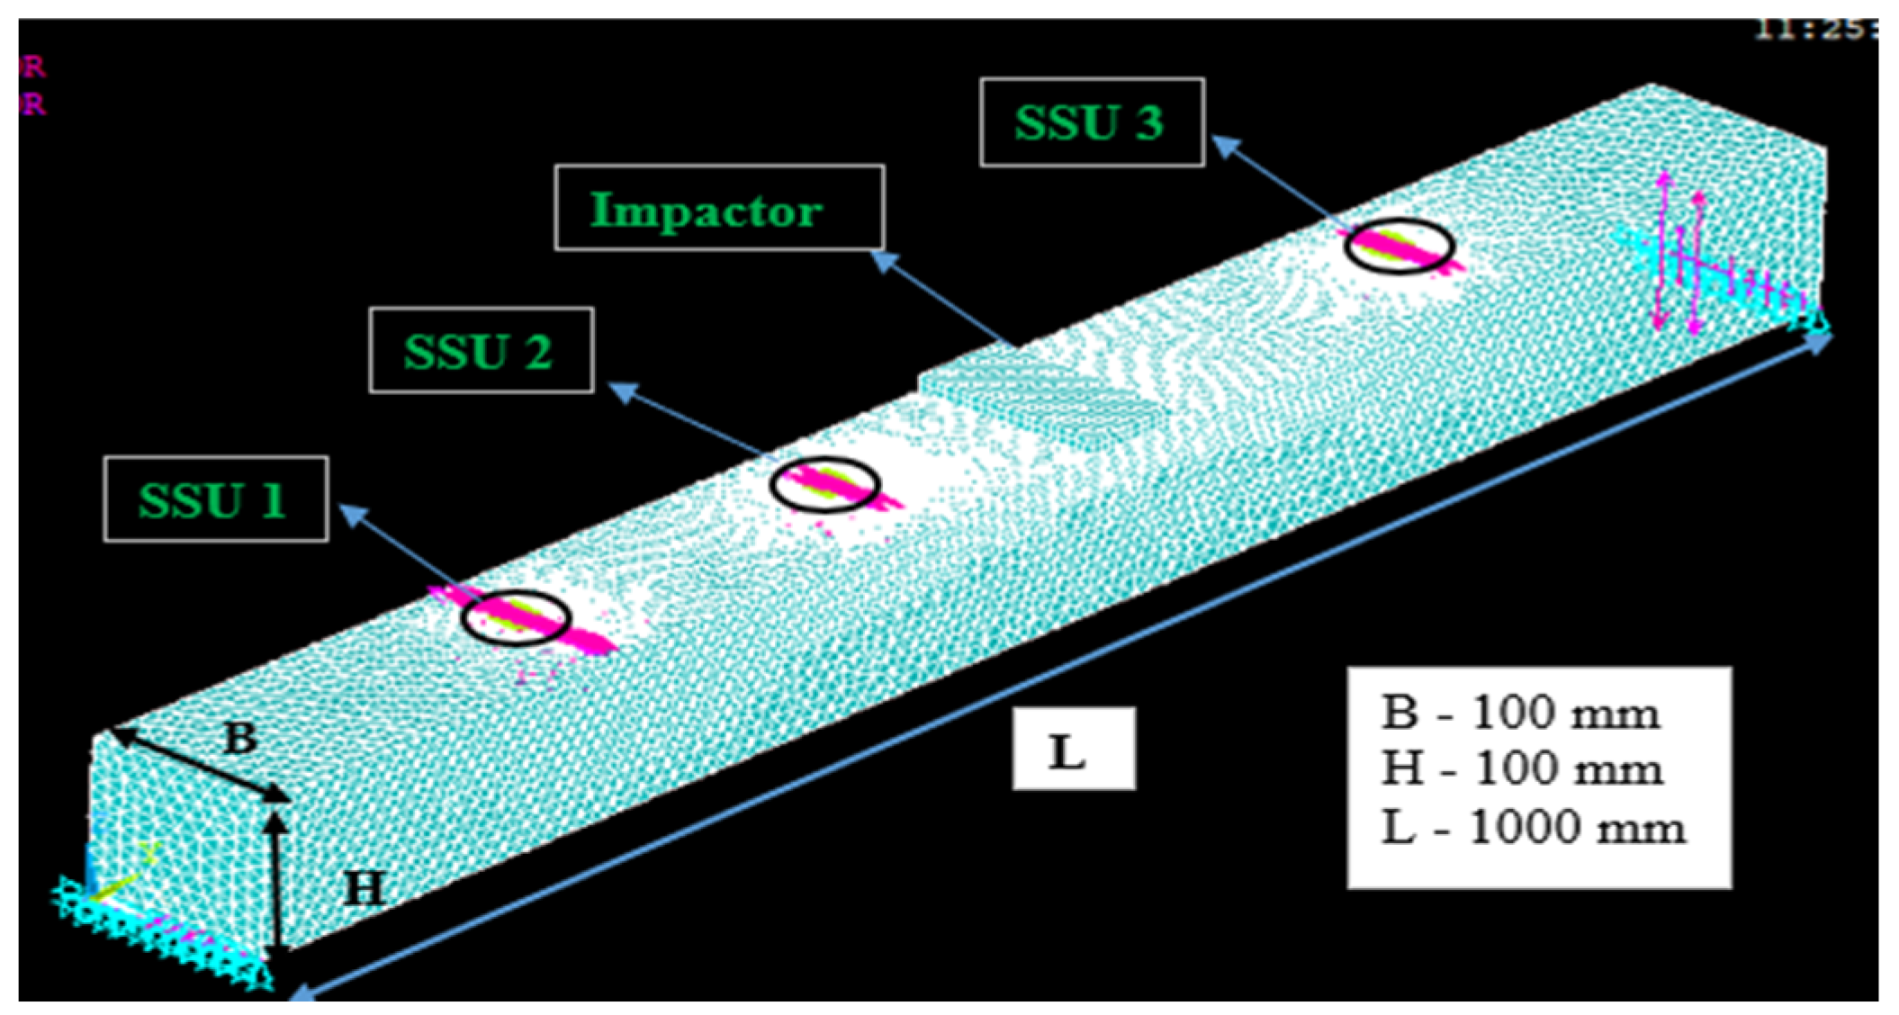
2.2. Investigation of the Concrete Beam with Multiple SSUs

A simply-supported concrete beam sized 100 × 100 × 1000 mm was taken. Multiple SSUs were surface-mounted on a concrete beam to monitor the structural performance. The beam was also subjected to external loading. The load impactor was used to apply point load at 530 mm away from support 1. Figure 1 shows the FE model of the concrete beam. Load magnitudes of 10 kN and 30 kN load were considered in the study. The damage (crack) was introduced at a location 300 mm away from support 1. The nodes of the lower part of the beam were merged to introduce a crack 20 mm in length.
Table 2 shows the data consisting of the distance of the load impactor and crack location from each SSU. The SSU-1 and SSU-2 are the farthest and nearest to the impactor, respectively. The SSU-1 is nearest to the crack location, and SSU-3 is the farthest. The mesh size for the beam and impactor is taken as 25 mm and 5 mm for the numerical simulation, respectively.

2.2.1. Methodology for Structural Damage Detection

For the given numerical model of the concrete beam, the SSUs were harmonically excited in the frequency range of 0–450 kHz. The conductance signatures were obtained from each SSU at different stages and compared to examine the possible changes caused. The various damage indices, namely the root mean square deviation (RMSD) and correlation coefficient (CC), quantified the changes among the signatures.

2.2.2. Methodology for Structural Damage Localization

The multi-sensing technique was implemented on the surface-mounted SSUs. For parallel connection of sensors, the equivalent impedance   ( Z ) and admittance   ( A ) are expressed as Z p = i = 1 n 1 Z i and A p = i = 1 n A i , respectively. Similarly, for the serial connection of sensors, the equivalent impedance and admittance are expressed as Z s = i = 1 n Z i and 1 A s = i = 1 n 1 A i , respectively. As observed, the equivalent admittance in parallel connection is relatively higher, making it easy to identify the peaks in the composite signature. Therefore, the parallel connection of SSUs is assumed to obtain composite signatures. The dynamic metrics, namely, moving RMSD and moving CC, were used for the localization process. These metrics were evaluated for the composite signatures obtained for a particular combination in the moving frame of 50 data points. The combinations as couplets (SSU 1–3, SSU 2–3) and triplet (SSU 1–2–3) were considered to obtain the approximate idea about damage location.

3. Results and Discussion

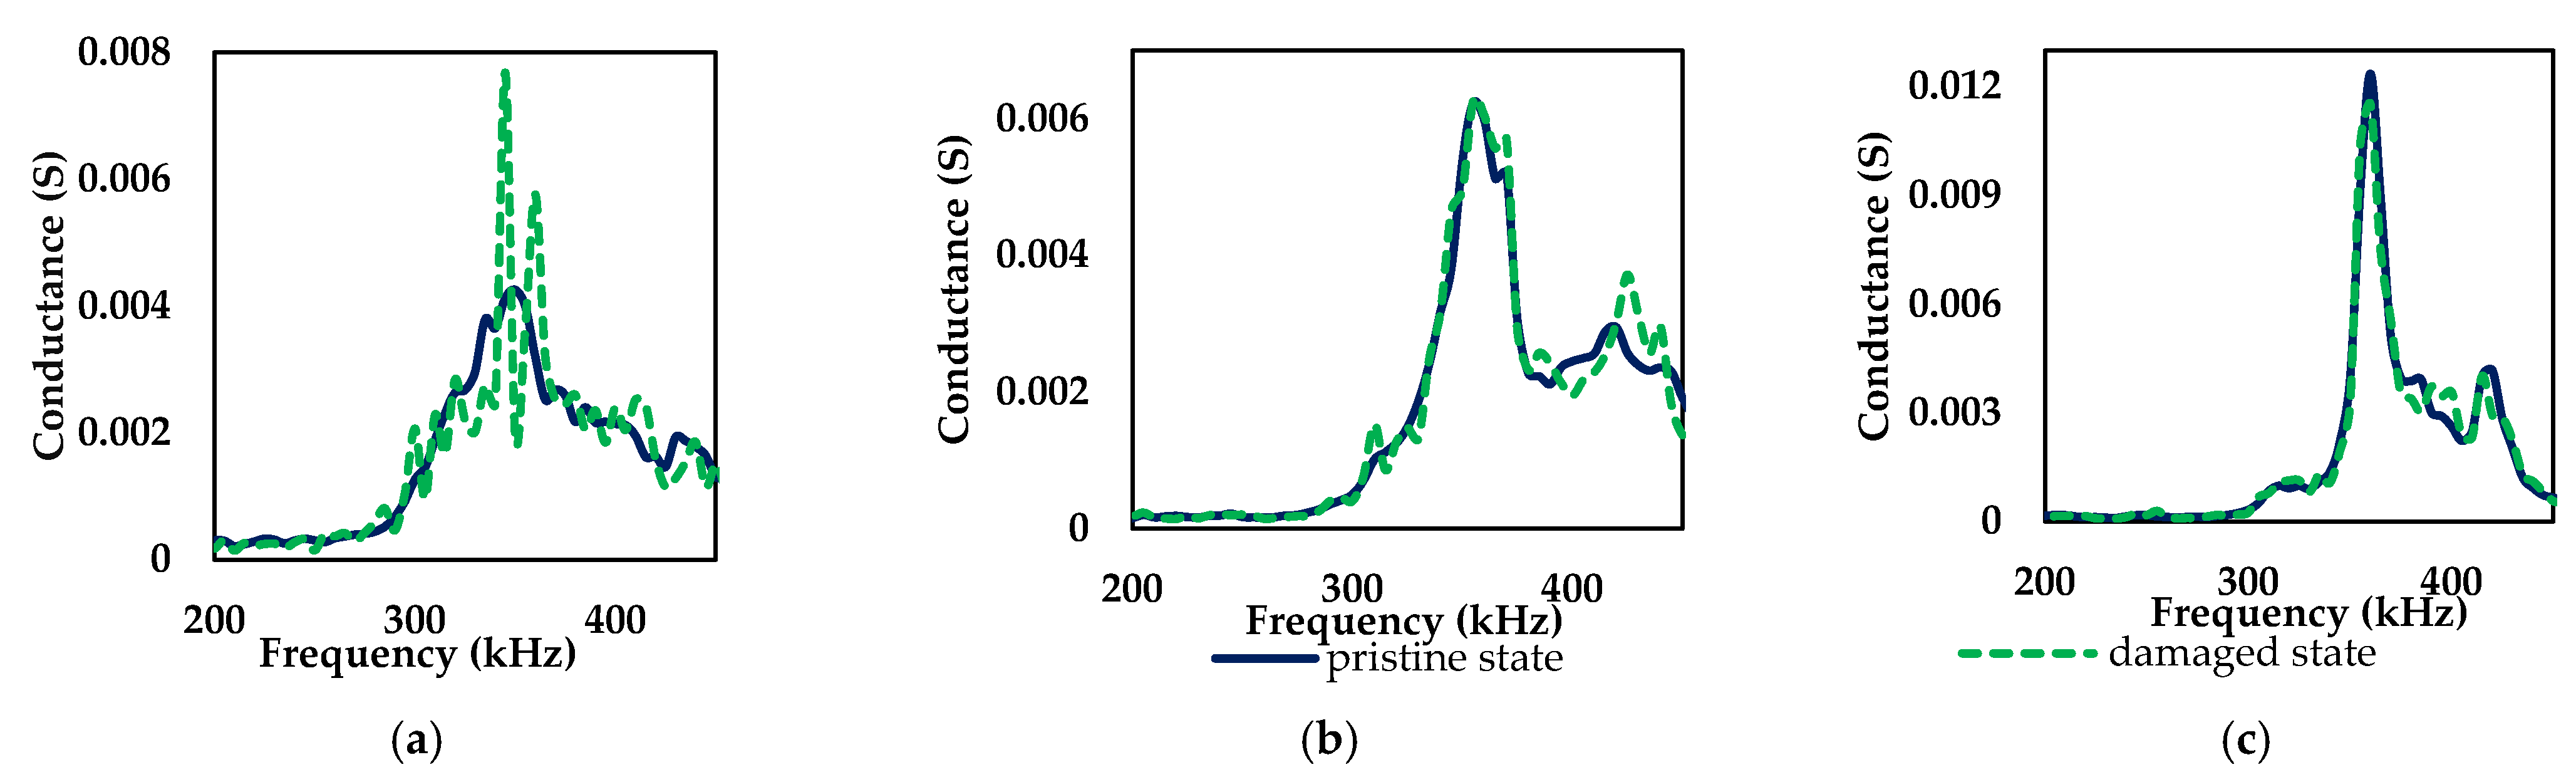
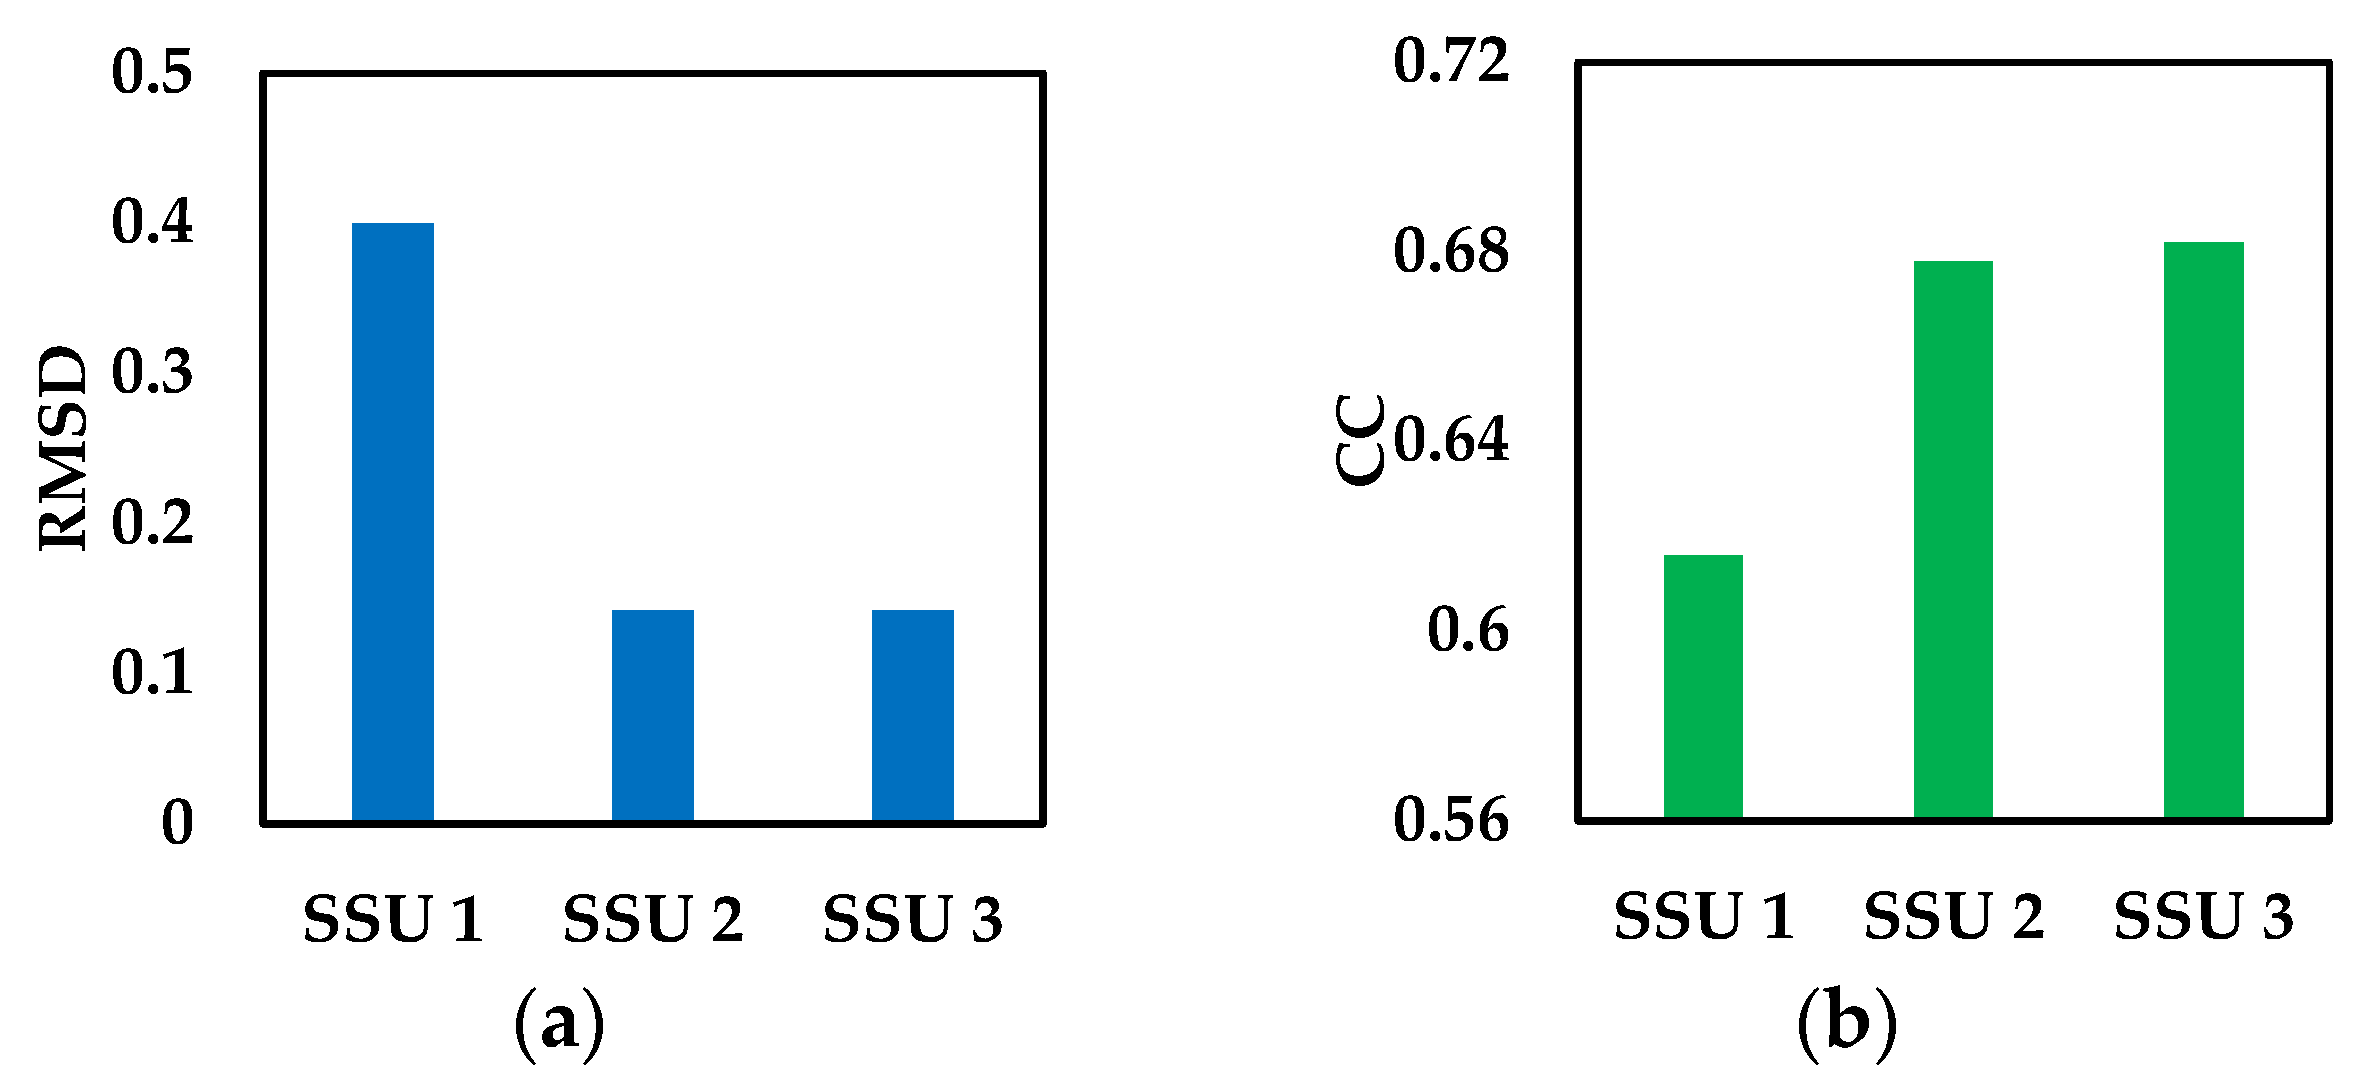
3.1. Detecting Structural Damage

The conductance signatures were obtained for the pristine and damaged state of the beam to examine the presence of damage. Figure 2 shows the signatures obtained from each SSU in the frequency range 200–450 kHz. Figure 2a shows that SSU-1 detected major changes caused due to the inclusion of crack. By comparison, SSU-2 and SSU-3 seemed to be insensitive to the damage, as observed in Figure 2b,c. Since the damage has occurred in the vicinity of SSU-1, that’s why SSU-1 was found to be sensitive to the damage. Figure 3 shows the various statistical metrics evaluated for each SSU concerning the damage state. These metrics also suggested that SSU-1 detected major changes.

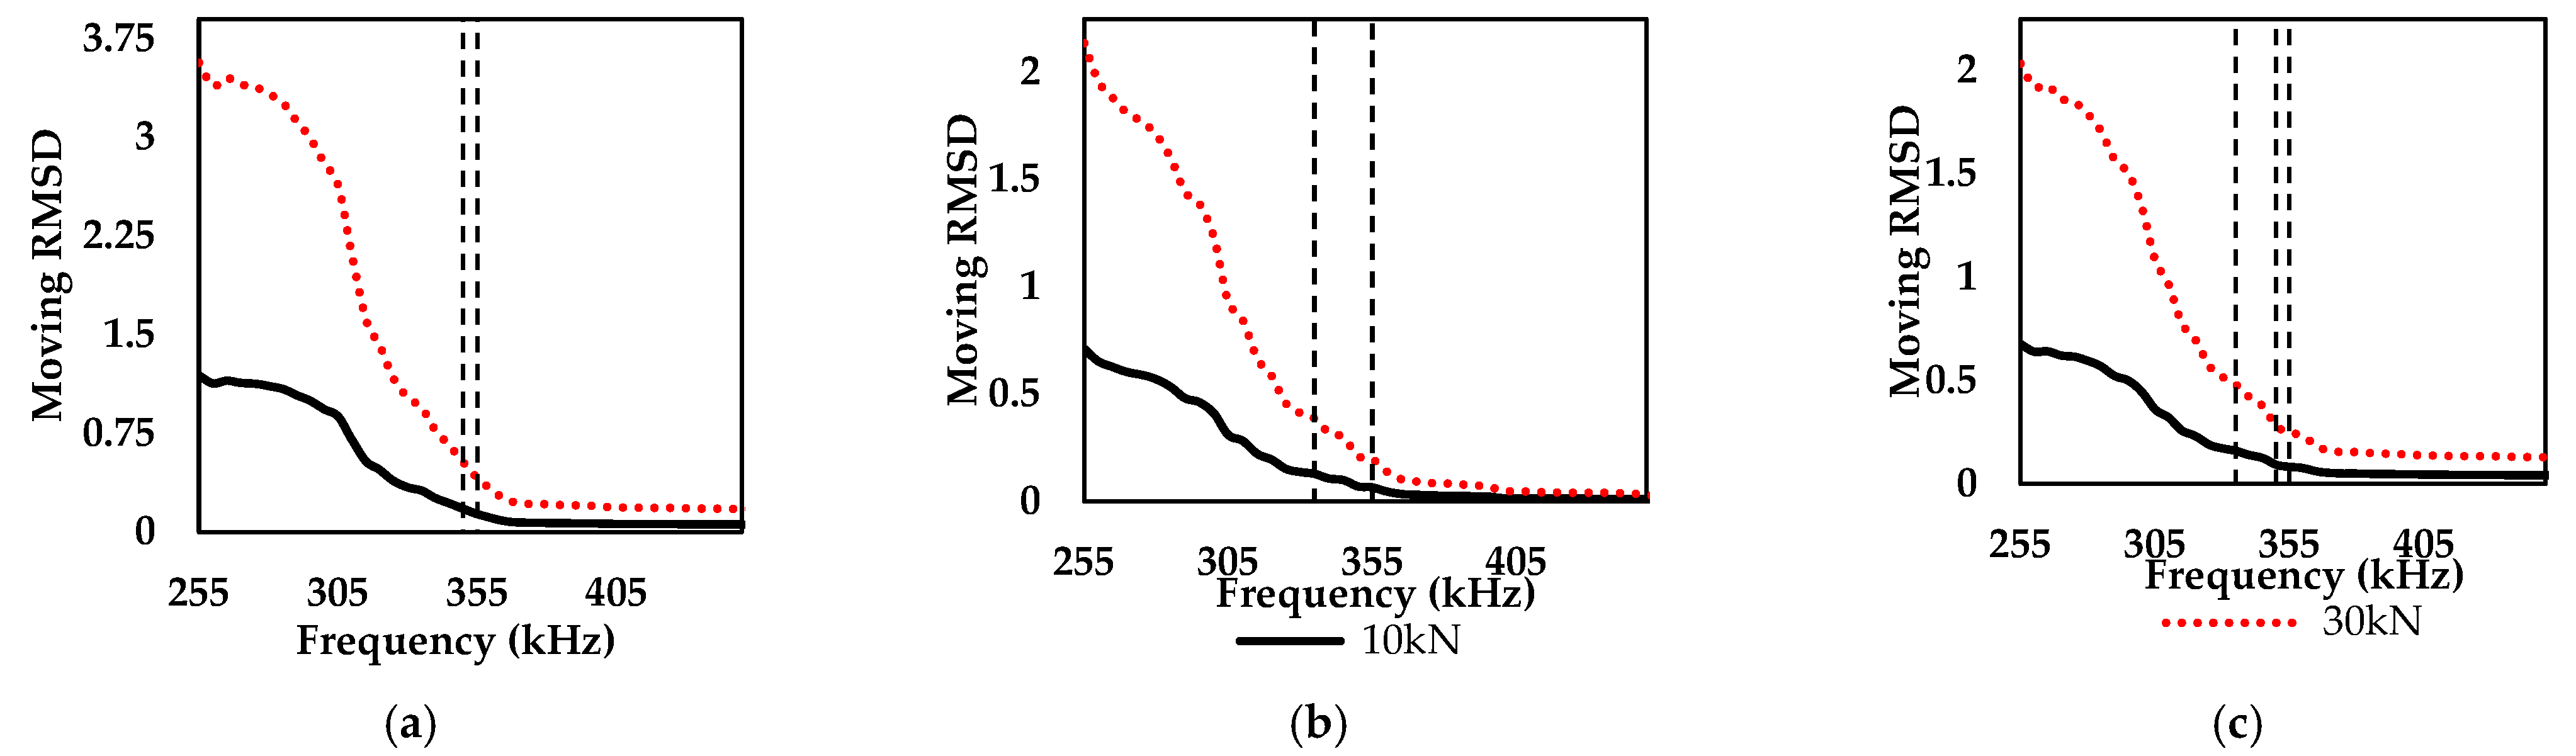
3.2. Localizing the Structural Damage

Figure 4 shows the moving RMSD plots for the different combinations of SSUs. For the combination SSU 2–3, the magnitude of moving RMSD was higher at 350 kHz (SSU-2) than at 355 kHz (SSU-3). This indicates that the conductance variation near SSU-2 was greater than SSU-3. It was found that the load impactor was near to the SSU-2, as demonstrated Table 2. Similarly, for the combination SSU 1–3, the magnitude of moving RMSD near SSU-1 was higher than SSU-3. As observed in the above statistical data, SSU-1 detected the influence of damage.
The moving RMSD plot for the triplet SSU 1–2–3 shows that neither the load impactor nor the damage location was near the SSU-3. To verify the inferences observed from the moving RMSD plots, another dynamic metric, i.e., moving CC, was evaluated for the different combinations of SSUs. Figure 5 shows the moving CC plots for different combinations of SSUs. Here, the magnitude of moving RMSD near SSU-2 is lower than SSU-3 for the combination SSU 2–3. At the same time, the moving CC variation near SSU-1 was lower than SSU-3. This verifies that the location of the load impactor was near SSU-2, whereas the damage location was near SSU-1. It also suggests that SSU-3 was not able to detect either load or damage. Therefore, the methodology for the damage detection and localization was adopted successfully on the concrete structures using the numerical approach. To support the inferences obtained from the numerical studies, it was important to validate the obtained trend of results with the experimental results. The next section discusses the experimental results with the numerical results and observes the correlation between them.

4. Experimental Validation

The experimental studies were performed on a plain concrete beam with a size of 100 mm × 200 mm × 2000 mm. As shown in Figure 6, the sensors PZT-1, PZT-2, and PZT-3 were surface-mounted at 135 mm, 790 mm, and 1600 mm from the left end of the beam, respectively. For the study based on damage detection, various damage cases were introduced on the beam. For the validation work, two damage cases were considered [9]. Damage Case 1 featured the inclusion of a 10 mm-long crack at 210 mm from the left end of the beam. Here, PZT-1 was nearest to the first crack location, whereas PZT-3 was the farthest. Damage Case 2 featured the inclusion of a 28 mm long crack at 858 mm from the left end of the beam. Here, the PZT-1, PZT-2, and PZT-3 were 723 mm, 68 mm, and 742 mm away from the second crack location, respectively. Using an impedance analyzer, all the PZT sensors were excited harmonically in the frequency range of 30–100 kHz. Accordingly, the conductance signatures were measured for various PZT sensors at different states. Figure 7 shows the conductance variation measured for all the PZT sensors. Here, PZT-1 detected the major changes caused due to the inclusion of the first crack, whereas other PZT sensors were insensitive to the first crack location. The statistical data are shown in Figure 8, which also suggests that the first and second crack were detected well by PZT-1 and PZT-2, respectively.

5. Conclusions

The sensors were connected in a parallel/serial connection in Multi-Input Single-Output mode. The trend of the experimental results showed a good correlation with the numerical results. The methodology for the damage localization could be verified if different PZT sensors were used. As the experimental studies were based upon a similar type of PZT sensor, the resonant frequencies of the PZT sensors could not be differentiated. Different resonant frequencies for each sensor would help localize the structural damage in the concrete structures, as observed in the proposed numerical work. The multi-sensing technique on surface-mounted PZT sensors is recommended for effective SHM.

Supplementary Materials

The poster presentation is available online at https://www.mdpi.com/article/10.3390/ecsa-8-11254/s1.

Author Contributions

Conceptualization, A.P.; methodology, A.P.; software, A.P.; validation, A.P.; formal analysis, A.P. and T.J.S.; investigation, A.P.; data curation, A.P.; writing—original draft preparation, A.P.; writing—review and editing, T.J.S.; visualization, A.P.; supervision, T.J.S. All authors have read and agreed to the published version of the manuscript.

Funding

This research received no external funding.

Institutional Review Board Statement

Not applicable.

Informed Consent Statement

Not applicable.

Data Availability Statement

Not applicable.

Conflicts of Interest

The authors declare no conflict of interest.

References

  1. Saravanan, T.J.; Gopalakrishnan, N.; Rao, N.P. Damage detection in structural element through propagating waves using radially weighted and factored RMS. Measurement 2015, 73, 520–538. [Google Scholar] [CrossRef]
  2. Lim, Y.Y.; Bhalla, S.; Soh, C.K. Structural identification and damage diagnosis using self-sensing piezo-impedance transducers. Smart Mater. Struct. 2006, 15, 987. [Google Scholar] [CrossRef]
  3. Annamdas, V.G.M.; Soh, C.K. Three-dimensional electro-mechanical impedance model. II: Damage analysis and PZT characterization. J. Aerosp. Eng. 2007, 20, 63–71. [Google Scholar] [CrossRef]
  4. Saravanan, T.J.; Balamonica, K.; Priya, C.B.; Reddy, A.L.; Gopalakrishnan, N. Comparative performance of various smart aggregates during strength gain and damage states of concrete. Smart Mater. Struct. 2015, 24, 085016. [Google Scholar] [CrossRef]
  5. Saravanan, T.J.; Balamonica, K.; Priya, C.B.; Gopalakrishnan, N.; Murthy, S.G.N. Piezoelectric EMI–based monitoring of early strength gain in concrete and damage detection in structural components. J. Infrastruct. Syst. 2017, 23, 04017029. [Google Scholar] [CrossRef]
  6. Saravanan, T.J.; Balamonica, K.; Priya, C.B.; Gopalakrishnan, N.; Murthy, S.G.N. Non-destructive piezo electric based monitoring of strength gain in concrete using smart aggregate. In Proceedings of the International Symposium Non-Destructive Testing in Civil Engineering (NDT-CE), Berlin, Germany, 5–17 September 2015; pp. 15–17. [Google Scholar]
  7. Bhalla, S.; Kumar, P.; Gupta, A.; Datta, T.K. Simplified Impedance Model for Adhesively Bonded Piezo-Impedance Transducers. J. Aerosp. Eng. 2009, 22, 373–382. [Google Scholar] [CrossRef] [Green Version]
  8. Yang, Y.; Hu, Y.; Lu, Y. Sensitivity of PZT impedance sensors for damage detection of concrete structures. Sensors 2008, 8, 327–346. [Google Scholar] [CrossRef] [PubMed] [Green Version]
  9. Wang, D.; Song, H.; Zhu, H. Numerical and experimental studies on damage detection of a concrete beam based on PZT admittances and correlation coefficient. Constr. Build. Mater. 2013, 49, 564–574. [Google Scholar] [CrossRef]
  10. Wang, T.; Tan, B.; Lu, M.; Zhang, Z.; Lu, G. Piezoelectric Electro-Mechanical Impedance (EMI) Based Structural Crack Monitoring. Appl. Sci. 2020, 10, 4648. [Google Scholar] [CrossRef]
  11. Balamonica, K.; Saravanan, T.J.; Priya, C.B.; Gopalakrishnan, N. Piezoelectric sensor-based damage progression in concrete through serial/parallel multi-sensing technique. Struct. Health Monit. 2020, 19, 339–356. [Google Scholar]
  12. Saravanan, T.J.; Gopalakrishnan, N.; Priya, C.B. Monitoring of early-age characteristics of concrete using EMI based embedded PZT transducers on varying plate thickness. Constr. Mater. Syst. 2017, 557–566. [Google Scholar]
  13. Priya, C.B.; Saravanan, T.J.; Balamonica, K.; Gopalakrishnan, N.; Rao, A.R.M. EMI-based monitoring of early-age characteristics of concrete and comparison of serial/parallel multi-sensing technique. Constr. Build. Mater. 2018, 191, 1268–1284. [Google Scholar] [CrossRef]
Figure 1. FE model of the simply-supported concrete beam with multiple SSUs.
Engproc 10 00051 g001
Figure 2. Conductance signatures obtained from (a) SSU-1; (b) SSU-2; (c) SSU-3 for the damaged concrete beam.
Engproc 10 00051 g002
Figure 3. Various statistical metrics (a) RMSD; (b) CC evaluated for each SSU.
Engproc 10 00051 g003
Figure 4. Moving RMSD plots for the combination (a) SSU 2–3; (b) SSU 1–3; (c) SSU 1–2–3 under different loading.
Engproc 10 00051 g004
Figure 5. Moving CC plots for the combination (a) SSU 2-3; (b) SSU 1-3; (c) SSU 1-2-3 under different loading.
Engproc 10 00051 g005
Figure 6. Plain concrete beam with multiple surface-mounted PZT sensors [9].
Engproc 10 00051 g006
Figure 7. Conductance variations measured for (a) PZT-1; (b) PZT-2; (c) PZT-3 bonded to concrete beam.
Engproc 10 00051 g007
Figure 8. Statistical metrics (a) RMSD; (b) CC evaluated for various PZT sensors.
Engproc 10 00051 g008
Table 1. Data showing resonant frequency for each SSU.
SSU No.123
Thickness (mm)0.751.53
Resonant frequency (kHz)335350355
Table 2. Data showing the distance of the load impactor and crack location from each SSU.
SSU No.123
Distance from impactor (mm)310110250
Distance from crack location (mm)70120480
Publisher’s Note: MDPI stays neutral with regard to jurisdictional claims in published maps and institutional affiliations.

