Abstract
This paper presents an initial and feasibility study of corona discharge characterization on HVDC systems using an alternative strategy based on digital signal processing techniques. In the corona discharge test, high voltages varying from ±30 to ±80 kV were applied through a DC high-voltage generator. In addition, corona discharges around the conductor were measured by means of a data acquisition prototype system equipped with a metal electrode device for the purpose of corona current measurement. The signals collected were subjected to digital signal processing parameters to extract the most relevant information related to corona discharge occurrence in specific frequency bands. The results reveal that the proposed method was able to detect the corona discharge characteristics following the changes in the signal content, especially, for narrow frequency ranges. The results indicate the feasibility of the proposed method to detect and characterize the corona discharge in a simple way, which expands the research field in corona discharge characterization in HVDC systems by means of digital signal processing and feature extraction.
1. Introduction
High-voltage direct-current (HVDC) systems are emerging as a promising technology for long-distance bulk power delivery due to their lower cost and reliability compared to high-voltage alternating-current (HVAC) systems [1,2,3,4]. In this context, the measurement of corona current plays an essential role within HVDC systems since it provides important information, such as corona discharge occurrence, electromagnetic interferences HV, and electrical current intensity, among other features [5,6,7,8,9]. Owing to that, researchers have made efforts to promote new strategies of monitoring and inspection of HVDC systems through the use of contact and non-contact measurement solutions. Accordingly, many approaches have been proposed to establish the HVDC detection based on the development of corona current measurement sensing devices [6,9,10,11], and electromagnetic field measurement sensing devices [4,5,7,12].
Concerning the corona discharge, it is an effect caused by the ionization of the air or other fluid surrounding a high-voltage conductor. The corona effect is common in HVDC transmission lines and can cause radio interference and electrical power loss. In view of this, when designing HVDC transmission lines, it is essential to predict the electric field generated by corona discharges to mitigate adverse effects caused by the increased magnitude of the electric field on the ground. However, it is difficult to calculate the electric field of HVDC lines due to the complexity of corona discharge mechanisms [13]. In this context, the corona effects have been the subject of many theoretical and experimental investigations, including the electric field distribution and electro-hydrodynamic flow of air at wire-cylinder electrode [14], measurement and analysis of monopolar ionized fields in bundled high-voltage direct-current (HVDC) conductors [15], HVDC corona current characteristics and audible noise during wet weather transitions [16], and field flow pattern and the electric field strength versus the distance [17].
On the other hand, the use of digital signal processing techniques for corona discharge pattern recognition has become popular due to the fact that it provides information for process optimization through the current signal features. From this, several researches have been conducted focusing mostly on corona identification of impulse voltage and current [18], identification of acoustic signals of corona discharges under different contamination levels using the wavelet transform [19], audiosonic acoustic detection of air corona discharge based on fast Fourier transform (FFT) [20], and separation techniques of partial discharges and electrical noise sources [21]. In contrast, the present research work performs an initial and feasibility study of the corona discharge characterization using an alternative strategy based on digital signal processing and feature extraction. Experimental tests were conducted by applying different high voltage values through a DC high-voltage generator. In addition, corona discharges around the conductor were measured utilizing an innovative data acquisition prototype system equipped with a metal electrode device. The signals collected were subjected to digital signal processing parameters, such as time-domain and frequency-domain analysis based on raw signals, fast Fourier transform (FFT), digital filters, and peak value, to extract the most relevant features related to the corona discharge in specific frequency bands. Although the popular use of digital signal processing techniques for corona discharge monitoring in electrical systems has been previously summarized, the literature clearly shows that there are no details for the combination of feature extraction and statistical analysis in specific frequency bands when applied to the HVDC systems. The proposed approach effectively contributes to the improvement of HVDC corona current measurement and corona discharge detection.
2. Experimental Setup
To assess the feasibility of the proposed approach, experimental tests were carried out under a controlled environment. The HV tests were conducted by applying voltages of ±30, ±50, and ±80 kV through a 110 kV PGK 110/HB Baur DC power supply. For the purpose of corona current measurement, an innovative data acquisition prototype system equipped with a metal electrode device was used. The corona detector device was mounted on an aluminum rod fixed at 60 cm and 90° in relation to the HVDC source, and the electrical measurements were carried out under load conditions with a fixed distance of 1.5 m between the positive and negative electrodes. The proposed experimental setup framework is shown in Figure 1. The data acquisition system is composed of an infrared communication that allows an interface between the measurement device and PC through an optical link (irDA2) and USB. The electrical current data were collected for each condition which was experimentally tested at a 2 MHz sampling rate. During the experiments, the environmental influences, such as temperature and humidity, were kept constant, allowing a proper comparison between the signals collected under different conditions (i.e., ±30, ±50, and ±80 kV).
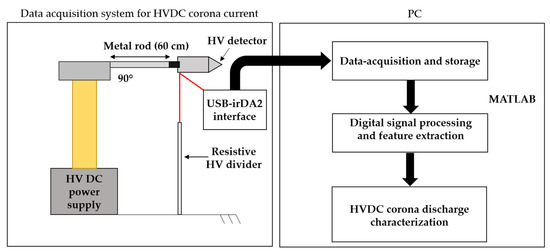
Figure 1.
Experimental setup and proposed framework.
Concerning the digital signal processing and feature extraction, the procedure was conducted according to Figure 1, from which the analyses were performed in both time and frequency domains using MATLAB® software. At first, a time-domain analysis was carried out based on the raw signals. Second, a spectral analysis was performed, using fast Fourier transform (FFT), to select the most appropriated frequency bands. Finally, a statistical analysis was performed through the application of Butterworth digital filters and peak values for each condition. The later analysis was supported by the coefficient of determination R2 (R-squared), whose values were used to determine the most appropriate frequency band.
3. Results and Discussion
3.1. Time-Domain Analysis
The raw signals, i.e., without any digital processing, corresponding to the electrical currents of ±30, ±50, and ±80 kV, are shown in Figure 2. This way, Figure 2a shows the current measurements at the positive pole and Figure 2b shows the current measurements at the negative pole.
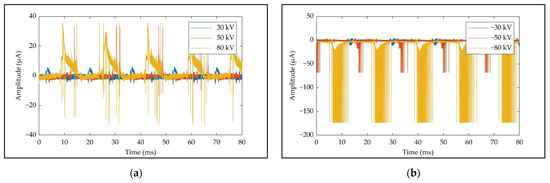
Figure 2.
Raw electrical current signals in time domain: (a) Positive pole; (b) negative pole.
It is possible to observe the trend of the signals in terms of amplitude and behavior over time. The time duration of 80 ms and the periodical occurrence of certain patterns, such as pulses, characterize the corona discharge events. Likewise, the signals present different patterns and trends between positive and negative poles, which was expected due to the HVDC source characteristics. In addition, it is possible to note the signal evolution in terms of intensity for the different measurements of ±30, ±50, and ±80 kV. This analysis was also important to determine the electrical current intensity variation, which was below 10 µA to the HV values of ±30 and ±50 kV, as well as above 30 µA to the HV of ±80 kV.
3.2. Frequency Domain Analysis
As previously mentioned, to analyze the frequency bands related to the corona discharge, an appropriate spectral analysis was conducted on the basis of the FFT calculation. The result is shown in Figure 3. This way, the frequency content of the signals corresponding to the electrical current under ±30, ±50, and ±80 kV is presented in Figure 3a (measurements at the positive pole) and 3b (measurements at the negative pole).
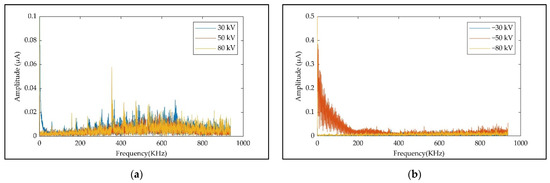
Figure 3.
Spectral content of the electrical current signals: (a) Positive pole; (b) negative pole.
It is possible to observe that the frequency spectrum is limited to the range of 0–937.5 kHz (Nyquist frequency). Therefore, it is possible to study the frequency ranges that are predominant in terms of the phenomena occurrence, as well as to determine the frequency range from which the signals are attenuated. A significant difference between the signals corresponding to each applied voltage (±30, ±50, and ±80 kV) is noticeable in Figure 3, as it can be seen through the difference among the amplitude values obtained over the frequency ranges. Differences between the voltages applied to the positive pole and those to the negative pole are also noticed. In addition, it is possible to note that the predominant activity related to the corona discharge occurrence is concentrated up to 200 kHz, from which an attenuation above 100 kHz is noticed. However, an analysis based only on the graphics of Figure 3 is insufficient to indicate the most appropriated narrow frequency bands since they present a considerable overlap between signals and conditions. To overcome this problem, a statistical analysis was conducted, whose results are presented in the next section.
3.3. Statistical Analysis
The purpose of the statistical analysis was to extract the optimal features related to the corona discharges with a particular focus, however, on specific and narrow frequency bands. To achieve this goal, digital filters were applied in several frequency bands to verify which is the most sensitive, in order to determine the occurrence of corona discharges in a simple way. Subsequently, the peak value was computed to the voltages of ±30, ±50, and ±80 kV based on the frequency range chosen. The selective criteria were based on the calculation of the coefficient of determination R2, to determine which trend was closest to a linear fit (45°). Therefore, the frequency band of 1–40 kHz was chosen, which proved to be adequate and representative. This way, the results of the peak values of the filtered signals corresponding to the voltages applied to the positive (Figure 4a) and negative (Figure 4b) poles are presented. The R² value was 0.77 to the positive voltages and 0.925 to the negative voltages. The latter was a more suitable result since the increasing trend was more appropriate and closest to a linear fit. However, it is possible to note similar trends between the signals corresponding to the positive and negative poles. Therefore, the results indicate that the frequency band of 1–40 kHz was suitable to determine the corona discharge. These results also indicate the feasibility of the proposed approach to detect and characterize the occurrence of corona discharge in a simple way.
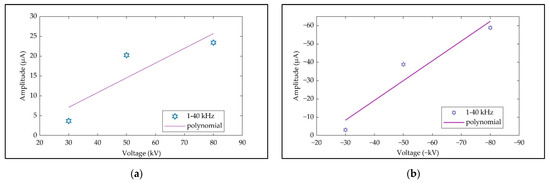
Figure 4.
Peak values of the filtered electrical current signals: (a) Positive pole; (b) negative pole.
4. Conclusions
In this work, an initial and feasibility study of corona discharge characterization on HVDC systems through the application of signal processing techniques was performed. The electrical current signals collected from experimental corona tests were subjected to digital signal processing parameters, such as time-domain and frequency-domain analysis based on raw signals, fast Fourier transform (FFT), digital filters, and peak value, to determine the most appropriated features related to the occurrence of corona discharges in HVDC systems. The analyses conducted in the present study were important to determine the electrical current intensity variation under different conditions (positive and negative voltage measurements) and different ranges of voltage values (±30, ±50, and ±80 kV). Moreover, the results indicated that the frequency band of 1-40 kHz was suitable to the corona discharge characterization. In addition, the results reveal that the proposed approach can be adequate for practical implementation in HVDC transmission lines due to its simplicity, low-cost low, and low-frequency range. Future research work will go deeper into the experimental conditions to include different environmental variations and test parameters, as well as the application of higher voltage values (e.g., ±600 and ±800 kV). Likewise, the effectiveness and reliability of the proposed approach can also be tested for corona current measurement in real HVDC transmission lines and equipment.
Author Contributions
Conceptualization, G.A.D. and P.O.C.J.; methodology and software, F.R.L.D.; validation and formal analysis, G.A.D., P.O.C.J., and F.R.L.D.; investigation, G.A.D.; resources, F.R.L.D. and B.R.S.; data curation, G.A.D. and P.O.C.J.; writing—original draft preparation, G.A.D.; writing—review and editing, P.O.C.J. and F.R.L.D.; visualization, F.R.L.D. and B.R.S.; supervision, P.O.C.J. and F.R.L.D.; project administration, P.O.C.J. and F.R.L.D.; funding acquisition, B.R.S. All authors have read and agreed to the published version of the manuscript.
Funding
This research was funded by Interligação Elétrica do Madeira S.A (IE MADEIRA), and the Brazilian Electricity Regulatory Agency (ANEEL), grant number PD-06957-0005/2020.
Institutional Review Board Statement
Not applicable.
Informed Consent Statement
Not applicable.
Data Availability Statement
Not applicable.
Acknowledgments
The authors are grateful to the anonymous reviewers for improving this paper.
Conflicts of Interest
The authors declare no conflict of interest.
References
- Ghislain Ogoulola, C.E.; Junqueira Rezek, A.J.; Fifatin, F.; Silva, V.Z.; Gonzatti, R.B.; de Oliveira, J.C.; Di Lorenzo Correa, R. An alternative proposal for HVDC transmission systems using 24-pulse AC/DC converters based on three-winding non-conventional transformers. Electr. Power Syst. Res. 2020, 182, 106230. [Google Scholar] [CrossRef]
- Alassi, A.; Bañales, S.; Ellabban, O.; Adam, G.; MacIver, C. HVDC Transmission: Technology Review, Market Trends and Future Outlook. Renew. Sustain. Energy Rev. 2019, 112, 530–554. [Google Scholar] [CrossRef]
- Tosatto, A.; Weckesser, T.; Chatzivasileiadis, S. Market Integration of HVDC Lines: Internalizing HVDC Losses in Market Clearing. IEEE Trans. Power Syst. 2020, 35, 451–461. [Google Scholar] [CrossRef]
- Cui, Y.; Yuan, H.; Song, X.; Zhao, L.; Liu, Y.; Lin, L. Model, Design, and Testing of Field Mill Sensors for Measuring Electric Fields under High-Voltage Direct-Current Power Lines. IEEE Trans. Ind. Electron. 2018, 65, 608–615. [Google Scholar] [CrossRef]
- Wijeweera, G.; Bahreyni, B.; Shafai, C.; Rajapakse, A.; Swatek, D.R. Micromachined Electric-Field Sensor to Measure AC and DC Fields in Power Systems. IEEE Trans. Power Deliv. 2009, 24, 988–995. [Google Scholar] [CrossRef]
- Xin, E.; Yuan, H. Development of a sensor for corona current measurement under high-voltage direct-current transmission lines. Int. J. Distrib. Sens. Netw. 2016, 12, 155014771666424. [Google Scholar] [CrossRef][Green Version]
- Suo, C.; Sun, H.; Zhang, W.; Zhou, N.; Chen, W. Adaptive Safety Early Warning Device for Non-contact Measurement of HVDC Electric Field. Electronics 2020, 9, 329. [Google Scholar] [CrossRef]
- Otto, A.J.; Reader, H.C. Wideband and Narrowband HVDC Conductor Corona Test Methods for Radio Noise Prediction. IEEE Trans. Power Deliv. 2010, 25, 2950–2957. [Google Scholar] [CrossRef]
- Yuan, H.; Yang, Q.; Liu, Y.; Lu, J.; Akhtar, S.A. Development and Application of High-Frequency Sensor for Corona Current Measurement under Ultra High-Voltage Direct-Current Environment. IEEE Trans. Instrum. Meas. 2012, 61, 1064–1071. [Google Scholar] [CrossRef]
- Zhu, L.; Liu, S.H.; Zhang, Y.; Huang, F.Y.; Zhu, H.J. Design of Sensor for Detecting Corona Discharge Signal in Specific Band. Appl. Mech. Mater. 2013, 336–338, 158–162. [Google Scholar] [CrossRef]
- Liu, Y.; Yuan, H.; Yang, Q.; Cui, Y. Design of the corona current measurement sensor with wide bandwidth under dc ultra-high-voltage environment. Meas. Sci. Technol. 2011, 22, 125202. [Google Scholar] [CrossRef]
- Zhu, K.; Lee, W.K.; Pong, P.W. Non-Contact Voltage Monitoring of HVDC Transmission Lines Based on Electromagnetic Fields. IEEE Sens. J. 2019, 19, 3121–3129. [Google Scholar] [CrossRef]
- Zou, Z.; Li, D.; Xu, J.; Cui, X.; Lu, T.; Bian, X. Impact of fine particles on the direct current electric field of the conductor due to corona discharge. J. Electrost. 2017, 88, 106–110. [Google Scholar] [CrossRef]
- Kantouna, K.; Ekonomou, L.; Fotis, G.P.; Chatzarakis, G.E. Finite element method analysis of an electric field in wire-cylinder electrode configuration during corona discharge. In Proceedings of the 11th WSEAS International Conference on System Science and Simulation in Engineering (ICOSSSE’12), Singapore City, Singapore, 11–13 May 2012; pp. 97–103. [Google Scholar]
- Abouelatta, M.A.; Ward, S.A.; Sayed, A.M.; Mahmoud, K.; Lehtonen, M.; Darwish, M.M. Measurement and assessment of corona current density for HVDC bundle conductors by FDM integrated with full multigrid technique. Electr. Power Syst. Res. 2021, 199, 107370. [Google Scholar] [CrossRef]
- Liu, Y.; Xv, J.; Liu, Y.; Yuan, H.; Cui, Y. A Method for the Indirect Detection of Audible Noise from High-Voltage Direct Current Transmission Lines. IEEE Trans. Instrum. Meas. 2020, 69, 4358–4369. [Google Scholar] [CrossRef]
- Kantouna, K.; Fotis, G.P.; Kiousis, K.N.; Ekonomou, L.; Chatzarakis, G.E. Analysis of a cylinder-wire-cylinder electrode configuration during corona discharge. In Proceedings of the Circuits, Systems, Communications, Computers and Applications (CSCCA), WSEAS, Iasi, Romania, 13–15 June 2012; pp. 204–208. [Google Scholar]
- Önal, E. Corona Identification of Impulse Voltage and Current. Electrica 2018, 18, 78–82. [Google Scholar] [CrossRef]
- Al-geelani, N.A.; Piah, M.A.M.; Abdul-Malek, Z. Identification of acoustic signals of corona discharges under different contamination levels using wavelet transform. Electr. Eng. 2018, 100, 1059–1067. [Google Scholar] [CrossRef]
- Wahyudi, M.; Tumiran, T.; Negara, I.M.Y.; Setiawan, N.A.; Sugiyantoro, B. Audiosonic Acoustic Detection of Air Corona Discharge based on Fast Fourier Transform. In Proceedings of the 2019 2nd International Conference on High Voltage Engineering and Power Systems (ICHVEPS), Bali, Indonesia, 1–4 October 2019; pp. 1–6. [Google Scholar]
- Ardila-Rey, J.A.; Cerda-Luna, M.P.; Rozas-Valderrama, R.A.; de Castro, B.A.; Andreoli, A.L.; Muhammad-Sukki, F. Separation techniques of partial discharges and electrical noise sources: A review of recent progress. IEEE Access 2020, 8, 199449–199461. [Google Scholar] [CrossRef]


Publisher’s Note: MDPI stays neutral with regard to jurisdictional claims in published maps and institutional affiliations. |
© 2021 by the authors. Licensee MDPI, Basel, Switzerland. This article is an open access article distributed under the terms and conditions of the Creative Commons Attribution (CC BY) license (https://creativecommons.org/licenses/by/4.0/).