1. Introduction
In the last few years, the development of microfluidic integrated platforms for analytical detection of fluids has been rapidly increasing with more and more researchers investigating low-cost solutions to develop smart miniaturized chips, able to perform fast and precise measurements. Among all the applications of microfluidic chips, the detection and sensing functions are widely used in many fields, from biochemical to environmental pollution detection, and from pharmaceuticals to the food and beverage industry [
1,
2,
3,
4,
5,
6,
7,
8,
9,
10,
11]. Microfluid sensor chips allow the performance of accurate measurements of small volumes of fluids, and many parameters of the sample can be estimated, such as refractive index, temperature, flow rate, etc. The combination of fluidic chips with an optical system is an excellent approach to perform contactless and remote detection. Among all optical techniques, near infrared (NIR) absorption spectroscopy is one of the most rapidly advancing analytical approaches. The detection of fluids is based on overtone and combination bands associated with the vibrational transition of molecules; each substance presents absorption peaks at specific wavelengths and the concentration dependence of absorbance is in accordance with the Lambert–Beer law.
In a previous work [
12], the detection and distinction of pure substances by exploiting NIR absorption spectroscopy was successfully demonstrated: we obtained different spectral absorption profiles for each tested solution in the wavelength region from 1 μm to 1.7 μm and they were in agreement with the prediction provided by the developed theoretical model. The microfluidic device was a rectangular glass microcapillary laid onto a bulk aluminum (Al) mirror so that light crossed the channel twice before being collected and analyzed by an optical spectrum analyzer (OSA).
As reported in the literature, it is important to differentiate isopropyl alcohol (also known as isopropanol) from ethylene glycol, which is more dangerous when ingested. Isopropyl alcohol does not cause renal failure as ethylene glycol does [
13]. Toward this aim, in this work, we extended our previous investigations by analyzing mixtures of ethylene glycol in isopropanol at different volume concentrations, exploiting a capillary provided with integrated reflectors, deposited by sputtering on the external surface of top and bottom glass layers; this low-cost technology allows for obtaining a more compact sensing platform. Light crosses the channel multiple times before being directed towards the OSA, thus increasing the total optical pathlength into the channel; the effect of absorption is enhanced. Moreover, a responsivity parameter is presented, in view of the design on a more compact, cost-effective and specific optical sensor based on amplitude detection.
2. Materials and Methods
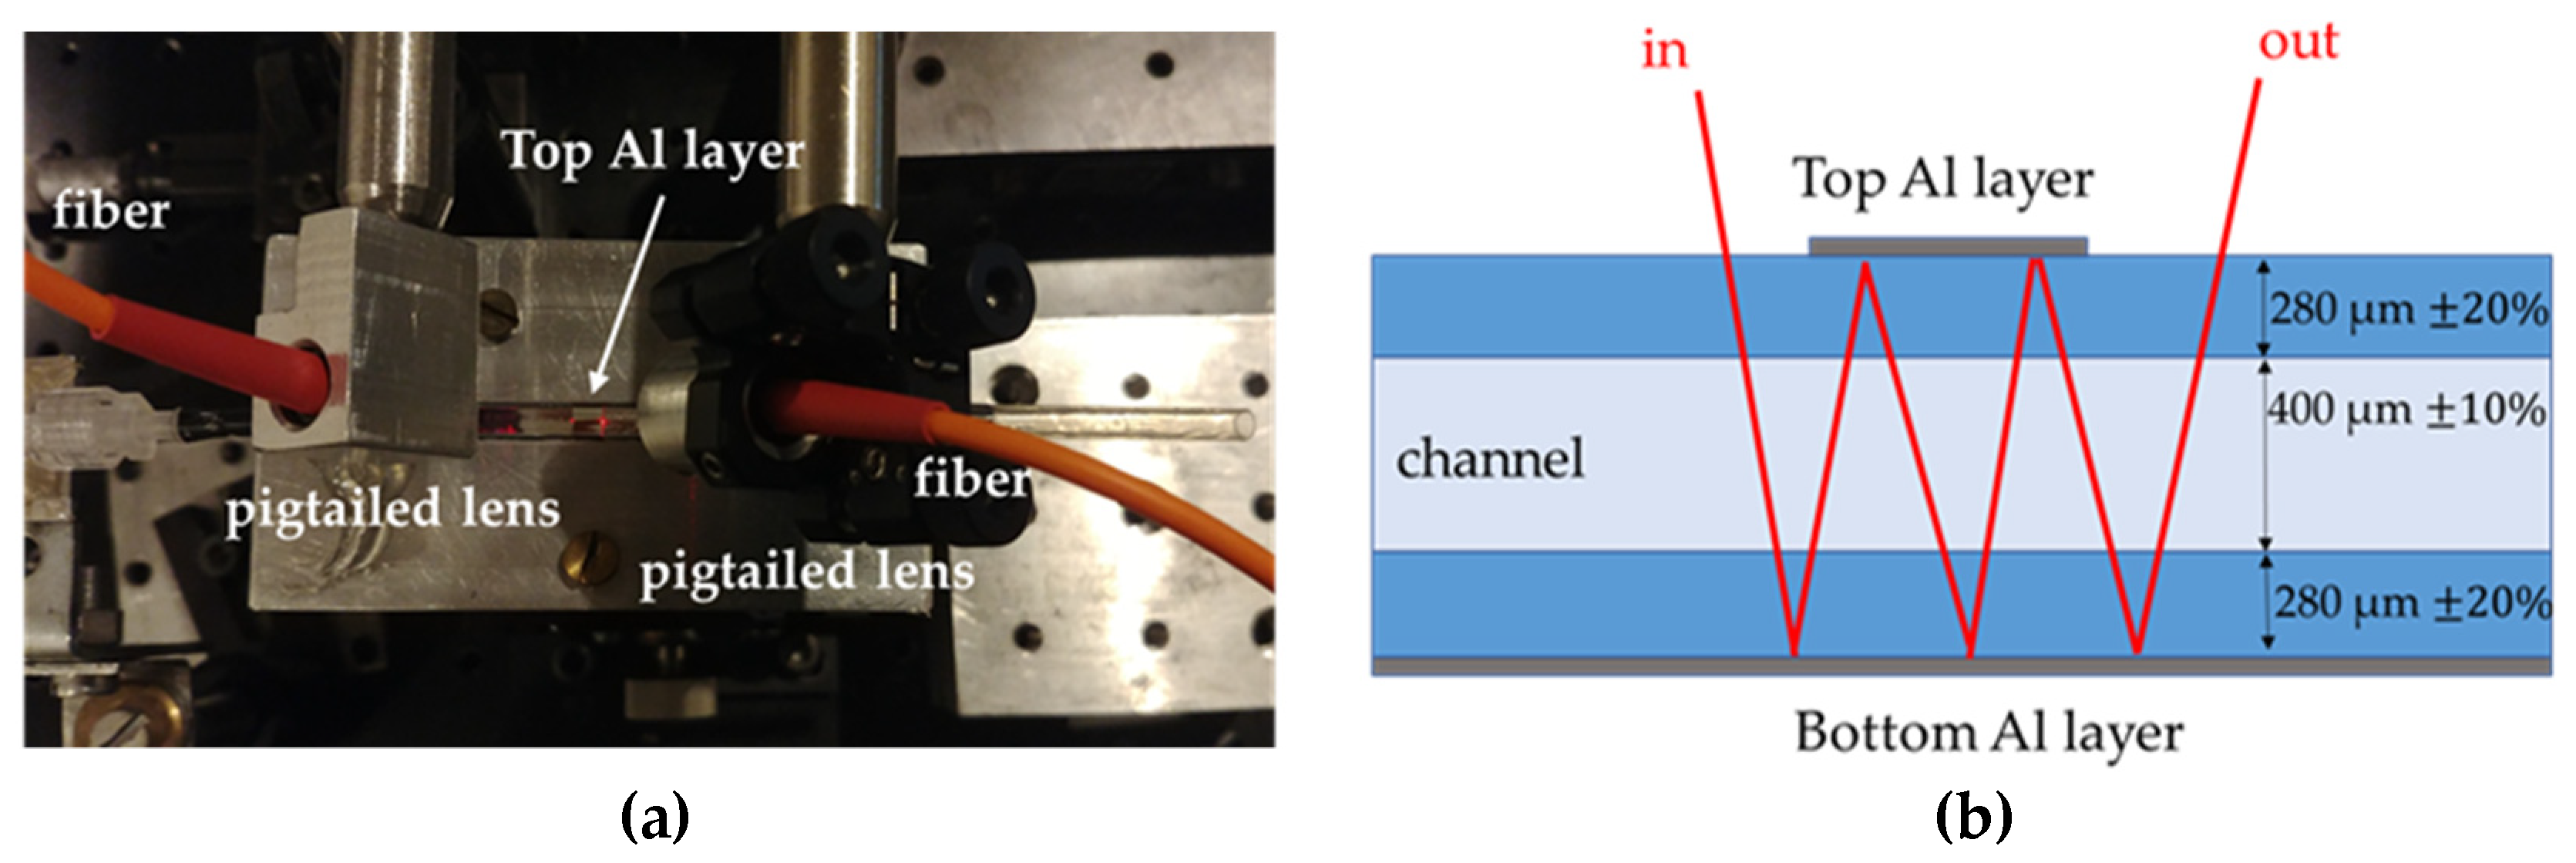
The instrumental configuration for contactless, label-free and remote sensing of fluids is shown in
Figure 1.
Figure 1a shows a picture of the capillary illuminated by red light provided by a He–Ne laser, used in the preliminary alignment phase and for illustrative purposes.
Figure 1b shows the schematic representation of the measurement system for optical detection (longitudinal view).
The broadband radiation provided by a tungsten lamp is fiber-coupled and shone on a rectangular glass microcapillary using a pigtailed lens at an angle of approximately 35°. The microcapillary investigated in this work, provided by Vitrocom (Mountain Lakes, NJ, USA), has nominal thickness of the walls of 280 μm, whereas the channel is 400 μm deep. It is particularly suitable for optical detection of fluids, since it is made of a biocompatible material and allows the contactless remote analysis of ultra-low volumes of samples. The extremities of the capillary are inserted in heat-shrink tubings provided with luer connections; the sample fluid can be easily injected into the channel using a syringe and ejected by flowing air into the capillary. The bottom layer of the capillary is coated along its entire length, equal to 5 cm, with a 50 nm thick aluminum (Al) layer, while the top layer presents a 5 mm long Al layer. These reflective layers act as mirrors, inducing zig-zag light propagation through the structure. In this way, incident light crosses the fluid multiple times (multiple bounce configuration). The output light is then collected by a lens, identical to the input one, and it is finally directed toward the monochromator input of an optical spectrum analyzer (OSA Agilent 86142B, Saratoga, CA, USA). A laptop is used for data collection. Signal processing is performed in a MATLAB environment.
3. Results and Discussion
3.1. Spectral Analysis
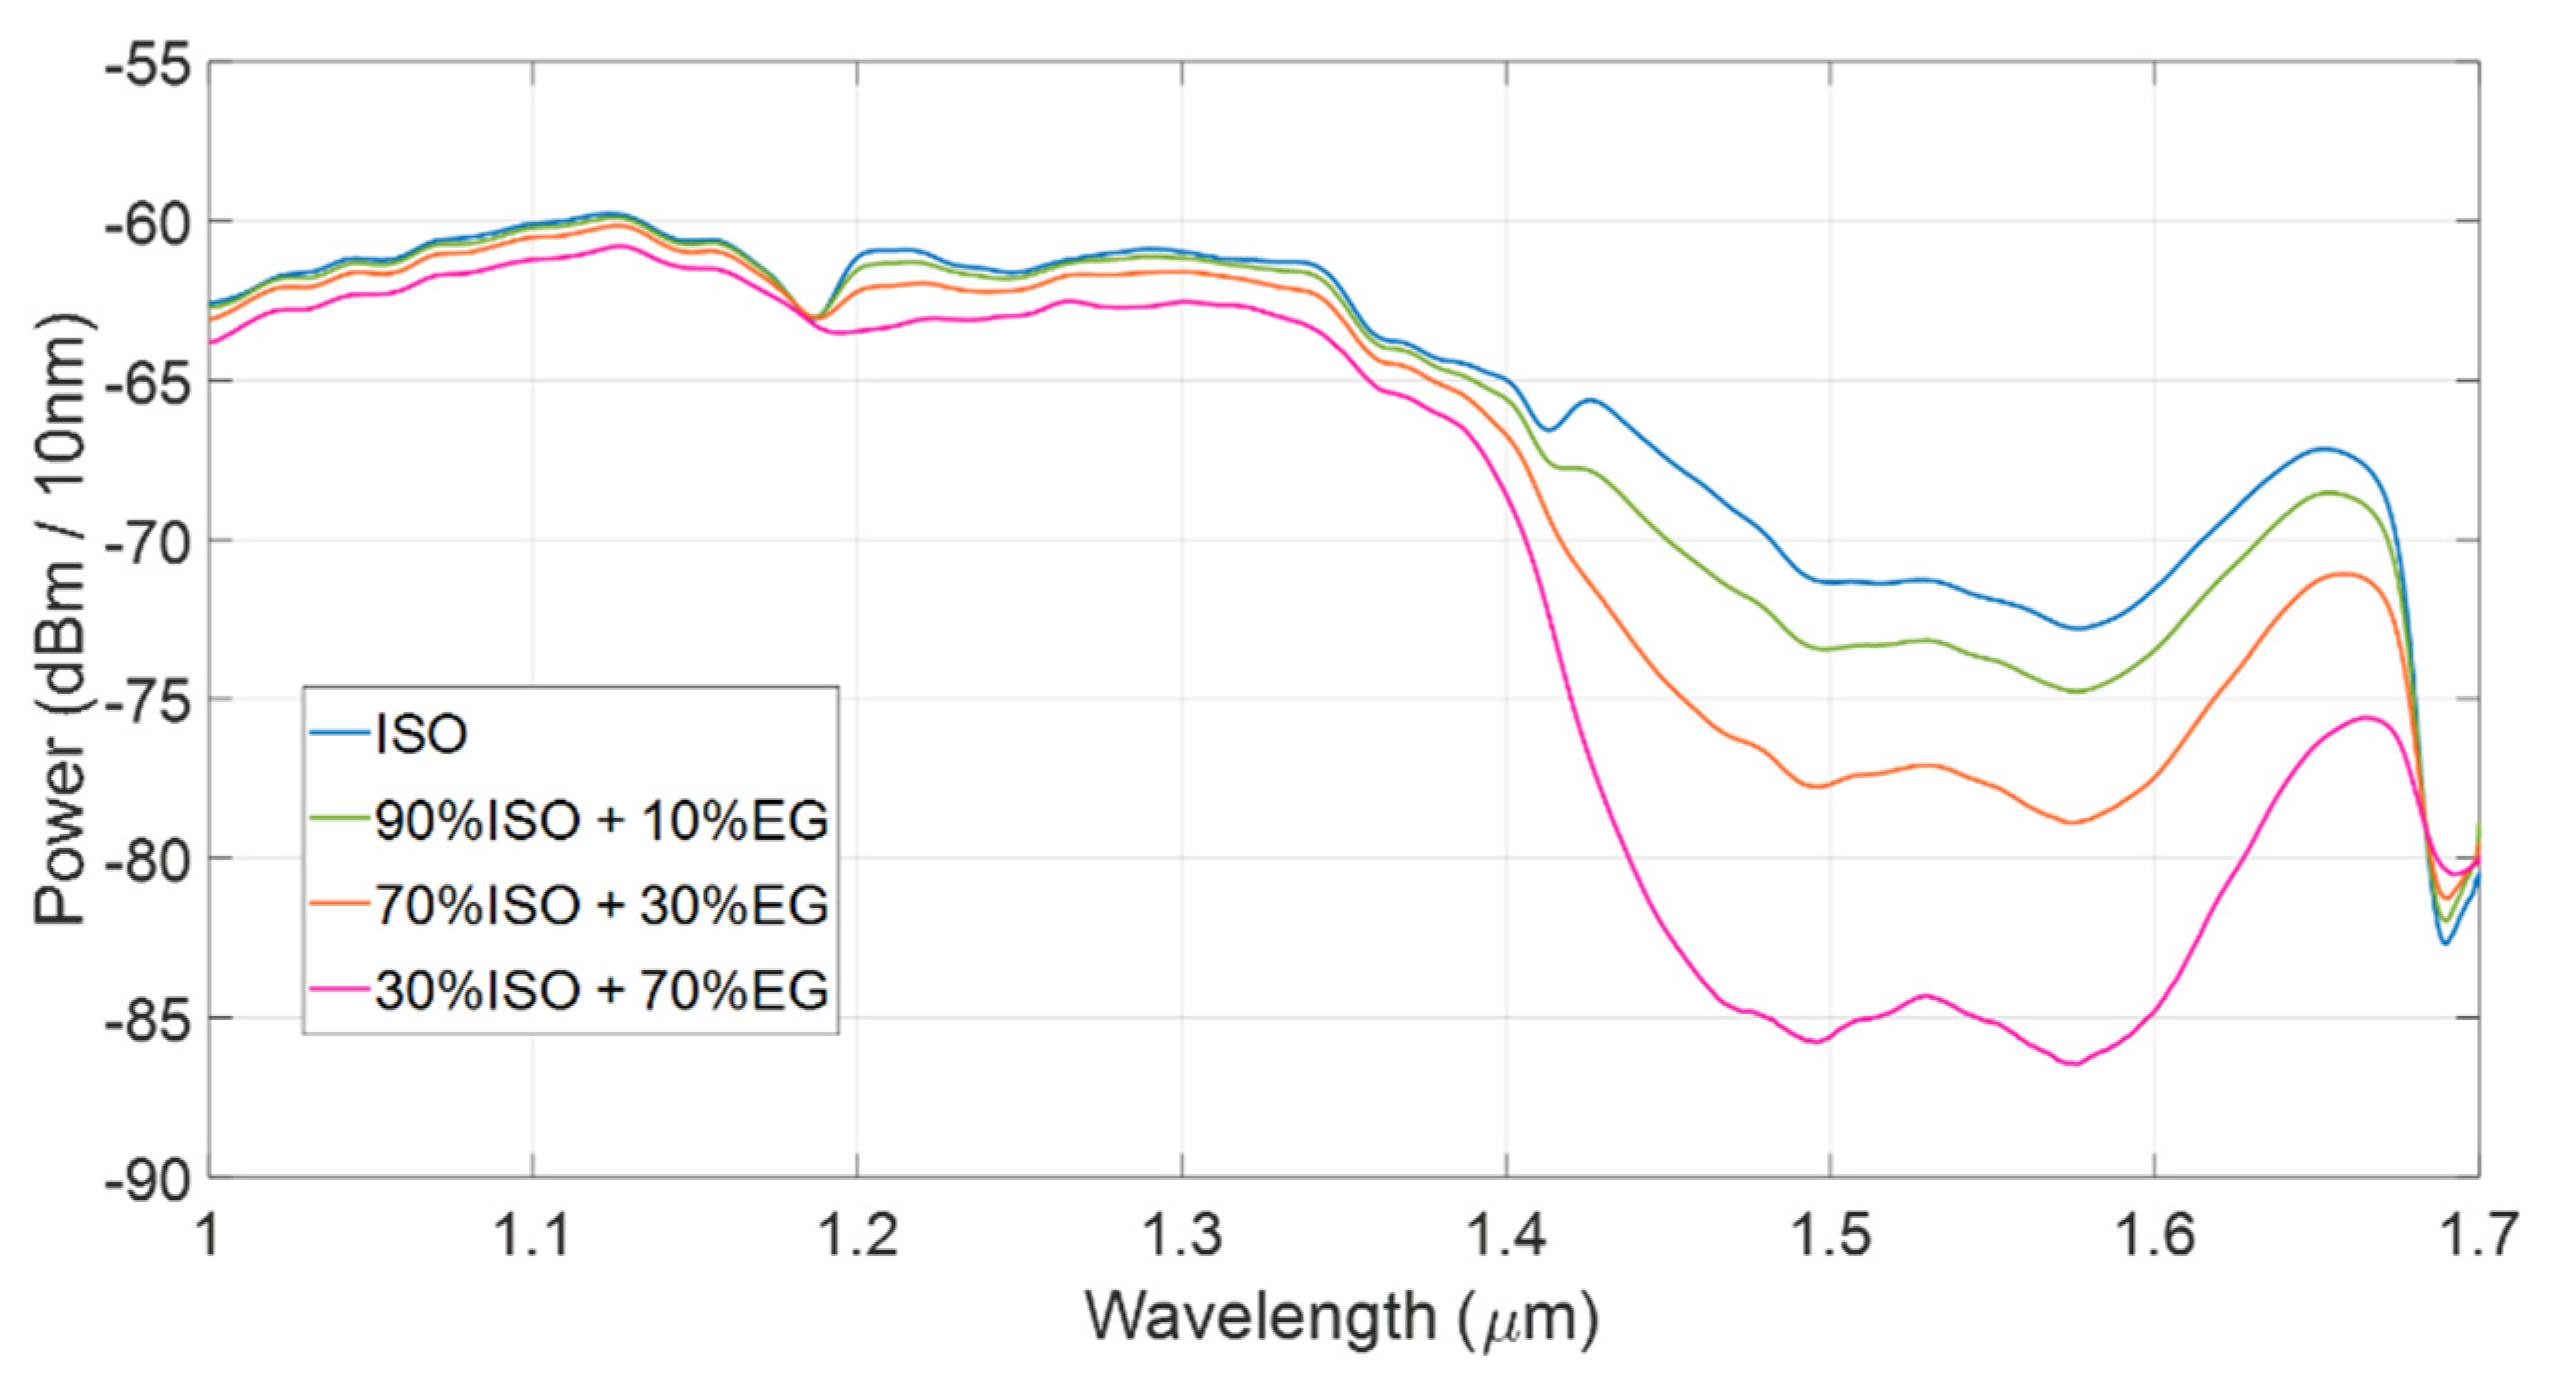
Experimental measurements were carried out by filling the channel with mixtures of ethylene glycol and isopropanol in different concentrations.
Figure 2 shows the transmitted power spectra collected by testing isopropanol (blue trace) and solutions of ethylene glycol in isopropanol in volume concentrations equal to 10% (green trace), 30% (orange trace) and 70% (pink trace). For increasing ethylene glycol concentration, the transmitted power between 1.4 μm and 1.6 μm decreases since ethylene glycol exhibits two absorption bands around 1.46 μm and 1.57 μm [
14].
To exploit this method for the extraction of the ethylene glycol content in the solution, the ratio between the transmitted power obtained for pure isopropanol (
PISO), thus playing the role of reference fluid of this experiment, and the transmitted power obtained by mixing ethylene glycol in isopropanol (
Pmix) was considered.
Figure 3 shows the spectral results
PISO/
Pmix for all tested solutions. The green, orange and pink traces are the ratios
PISO/
Pmix obtained for solutions of ethylene glycol in isopropanol in volume concentrations of 10%, 30% and 70%, respectively.
3.2. Responsivity and Sensitivity
In view of the design of a more compact and cost-effective optical sensor based on amplitude detection that does not require the use of the OSA, the ratio between the power transmissions at two different wavelengths was computed.
We defined the responsivity R
1.46/1.35 as the logarithmic value (base 10) of the ratio between the output power at 1.46 μm and 1.35 μm:
The wavelength λ = 1.46 μm corresponds to an absorption band peak of ethylene glycol, thus optical absorption of the solution is strongly dependent on ethylene glycol content. On the other hand, at λ = 1.35 μm both isopropanol and ethylene glycol are only weakly absorbing. Ethylene glycol and isopropanol are miscible with many polar solvents such as water, alcohols, glycol ethers and acetone, whereas they are slightly soluble in non-polar solvents. In case of dopands in the examined solutions, if presented in significant quantities, the absorption features, in particular the wavelengths corresponding to peaks of absorption, must be known. In general, the law of additivity of absorbance is applied: the total absorbance of a mixture is the sum of the absorbances of all the components of the solution, each multiplied by the corresponding concentration in volume.
By calculating the responsivity R
1.46/1.35 for all tested solutions as a function of the ethylene glycol content
C (%) and by linearly fitting the data, an experimental calibration curve was retrieved (see
Figure 4). The slope of the calibration curve determines the sensitivity of the sensor.
4. Conclusions
In conclusion, the functionality of a micro-opto-fluidic platform based on a rectangular glass microcapillary to detect alcoholic solutions by exploiting NIR absorption spectroscopy was demonstrated. The microfluidic configuration allows the investigation of mixtures of fluids in a totally safe, non-invasive, contactless and remote manner. The deposition of Al thin layers is a simple and low-cost technology that allows the fabrication of a smart device, suitable for several biomedical and chemical applications. The sensing platform based on amplitude detection is versatile and smart: it can be exploited to detect several solutions and substances in a specific way, simply modifying the wavelengths for the calculation of the responsivity parameter, on the basis of the absorption properties of the substance to detect.
Author Contributions
Conceptualization, E.B. and V.B.; methodology, E.B. and V.B.; software, E.B.; validation, V.B.; formal analysis, E.B. and V.B.; investigation, E.B. and V.B.; data curation, E.B. and V.B.; writing—original draft preparation, E.B.; writing—review and editing, E.B. and V.B.; visualization, E.B. and V.B.; supervision, V.B.; project administration, V.B. All authors have read and agreed to the published version of the manuscript.
Funding
This research received no external funding.
Acknowledgments
The authors express their gratitude to Professor Sabina Merlo of the Department of Electrical, Computer and Biomedical Engineering of the University of Pavia for her guidance and fruitful suggestions.
Conflicts of Interest
The authors declare no conflict of interest.
References
- Zhao, Y.; Hu, X.G.; Hu, S.; Peng, Y. Applications of fiber-optic biochemical sensor in microfluidic chips: A review. Biosens. Bioelectron. 2020, 166, 112447. [Google Scholar] [CrossRef] [PubMed]
- Yew, M.; Ren, Y.; Koh, K.S.; Sun, C.; Snape, C. A review of state-of-the-art microfluidic technologies for environmental applications: Detection and remediation. Glob. Chall. 2019, 3, 1800060. [Google Scholar] [CrossRef] [PubMed] [Green Version]
- Gao, H.; Yan, C.; Wu, W.; Li, J. Application of microfluidic chip technology in food safety sensing. Sensors 2020, 20, 1792. [Google Scholar] [CrossRef] [PubMed] [Green Version]
- Lefevre, F.; Chalifour, A.; Yu, L.; Chodavarapu, V.; Juneau, P.; Izquierdo, R. Algal fluorescence sensor integrated into a microfluidic chip for water pollutant detection. Lab Chip 2012, 12, 787–793. [Google Scholar] [CrossRef] [PubMed]
- Tahirbegi, I.B.; Ehgartner, J.; Sulzer, P.; Zieger, S.; Kasjanow, A.; Paradiso, M.; Strobl, M.; Bouwes, D.; Mayr, T. Fast pesticide detection inside microfluidic device with integrated optical pH, oxygen sensors and algal fluorescence. Biosens. Bioelectron. 2017, 88, 188–195. [Google Scholar] [CrossRef] [PubMed]
- Xiao, J.; Liu, Y.; Su, L.; Zhao, D.; Zhao, L.; Zhang, X. Microfluidic chip-based wearable colorimetric sensor for simple and facile detection of sweat glucose. Anal. Chem. 2019, 91, 14803–14807. [Google Scholar] [CrossRef] [PubMed] [Green Version]
- Luka, G.; Ahmadi, A.; Najjaran, H.; Alocilja, E.; DeRosa, M.; Wolthers, K.; Malki, A.; Aziz, H.; Althani, A.; Hoorfar, M. Microfluidics integrated biosensors: A leading technology towards lab-on-a-chip and sensing applications. Sensors 2015, 15, 30011–30031. [Google Scholar] [CrossRef] [PubMed] [Green Version]
- Liao, Z.; Wang, J.; Zhang, P.; Zhang, Y.; Miao, Y.; Gao, S.; Deng, Y.; Geng, L. Recent advances in microfluidic chip integrated electronic biosensors for multiplexed detection. Biosens. Bioelectron. 2018, 121, 272–280. [Google Scholar] [CrossRef] [PubMed]
- Weng, X.; Neethirajan, S. Ensuring food safety: Quality monitoring using microfluidics. Trends Food Sci. Tech. 2017, 65, 10–22. [Google Scholar] [CrossRef]
- Ashokkumar, P.; Bell, J.; Buurman, M.; Rurack, K. Analytical platform for sugar sensing in commercial beverages using a fluorescent BODIPY “light-up” probe. Sens. Actuators B Chem. 2018, 256, 609–615. [Google Scholar] [CrossRef]
- Yoon, S.G.; Park, B.J.; Chang, S.T. Highly sensitive microfluidic strain sensors with low hysteresis using a binary mixture of ionic liquid and ethylene glycol. Sens. Actuators A Phys. 2017, 254, 1–8. [Google Scholar] [CrossRef]
- Bello, V.; Bodo, E. A NIR-spectroscopy-based approach for detection of fluids in rectangular glass micro-capillaries. Eng. Proc. 2020, 2, 43. [Google Scholar] [CrossRef]
- Kraut, J.A.; Kurtz, I. Toxic alcohol ingestions: Clinical features, diagnosis, and management. Clin. J. Am. Soc. Nephrol. 2008, 3, 208–225. [Google Scholar] [CrossRef] [PubMed]
- Chen, Y.; Ozaki, Y.; Czarnecki, M.A. Molecular structure and hydrogen bonding in pure liquid ethylene glycol and ethylene glycol–water mixtures studied using NIR spectroscopy. Phys. Chem. Chem. Phys. 2013, 15, 18694–18701. [Google Scholar] [CrossRef] [PubMed] [Green Version]
| Publisher’s Note: MDPI stays neutral with regard to jurisdictional claims in published maps and institutional affiliations. |
© 2021 by the authors. Licensee MDPI, Basel, Switzerland. This article is an open access article distributed under the terms and conditions of the Creative Commons Attribution (CC BY) license (https://creativecommons.org/licenses/by/4.0/).


