
Targeting Desired Particle Size for Improved Dissolution and Manufacturability of Mefenamic Acid †


Abstract
:1. Introduction
2. Material and Experimental Method
2.1. Materials
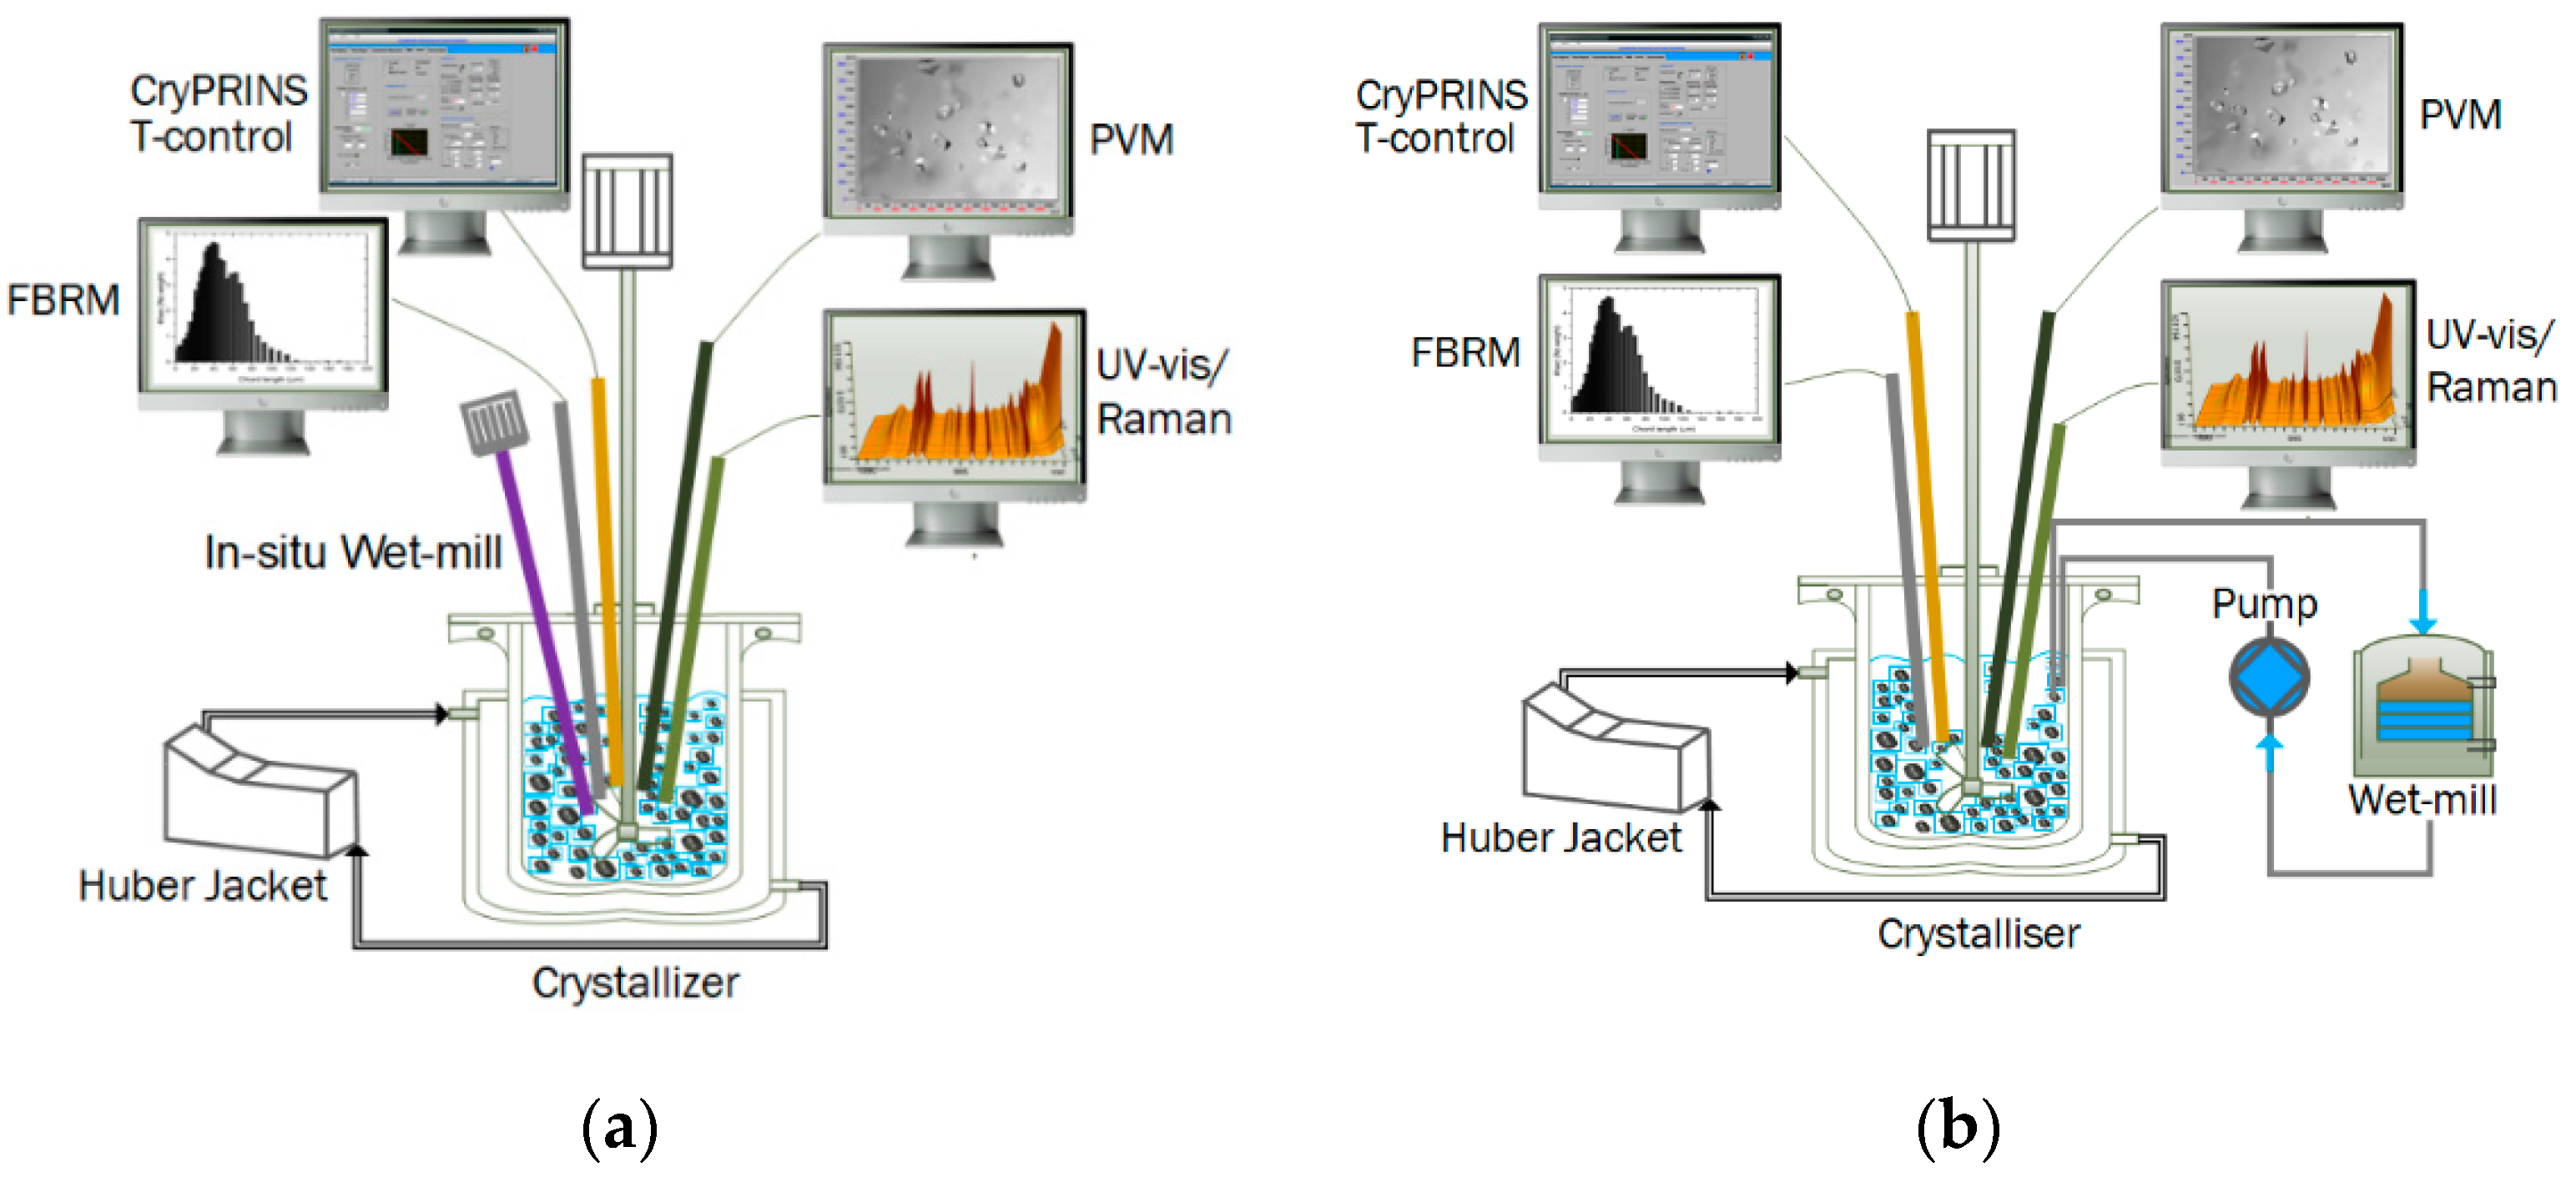
2.2. Experimental Setup
2.3. Experimental Methods
3. Results and Discussion
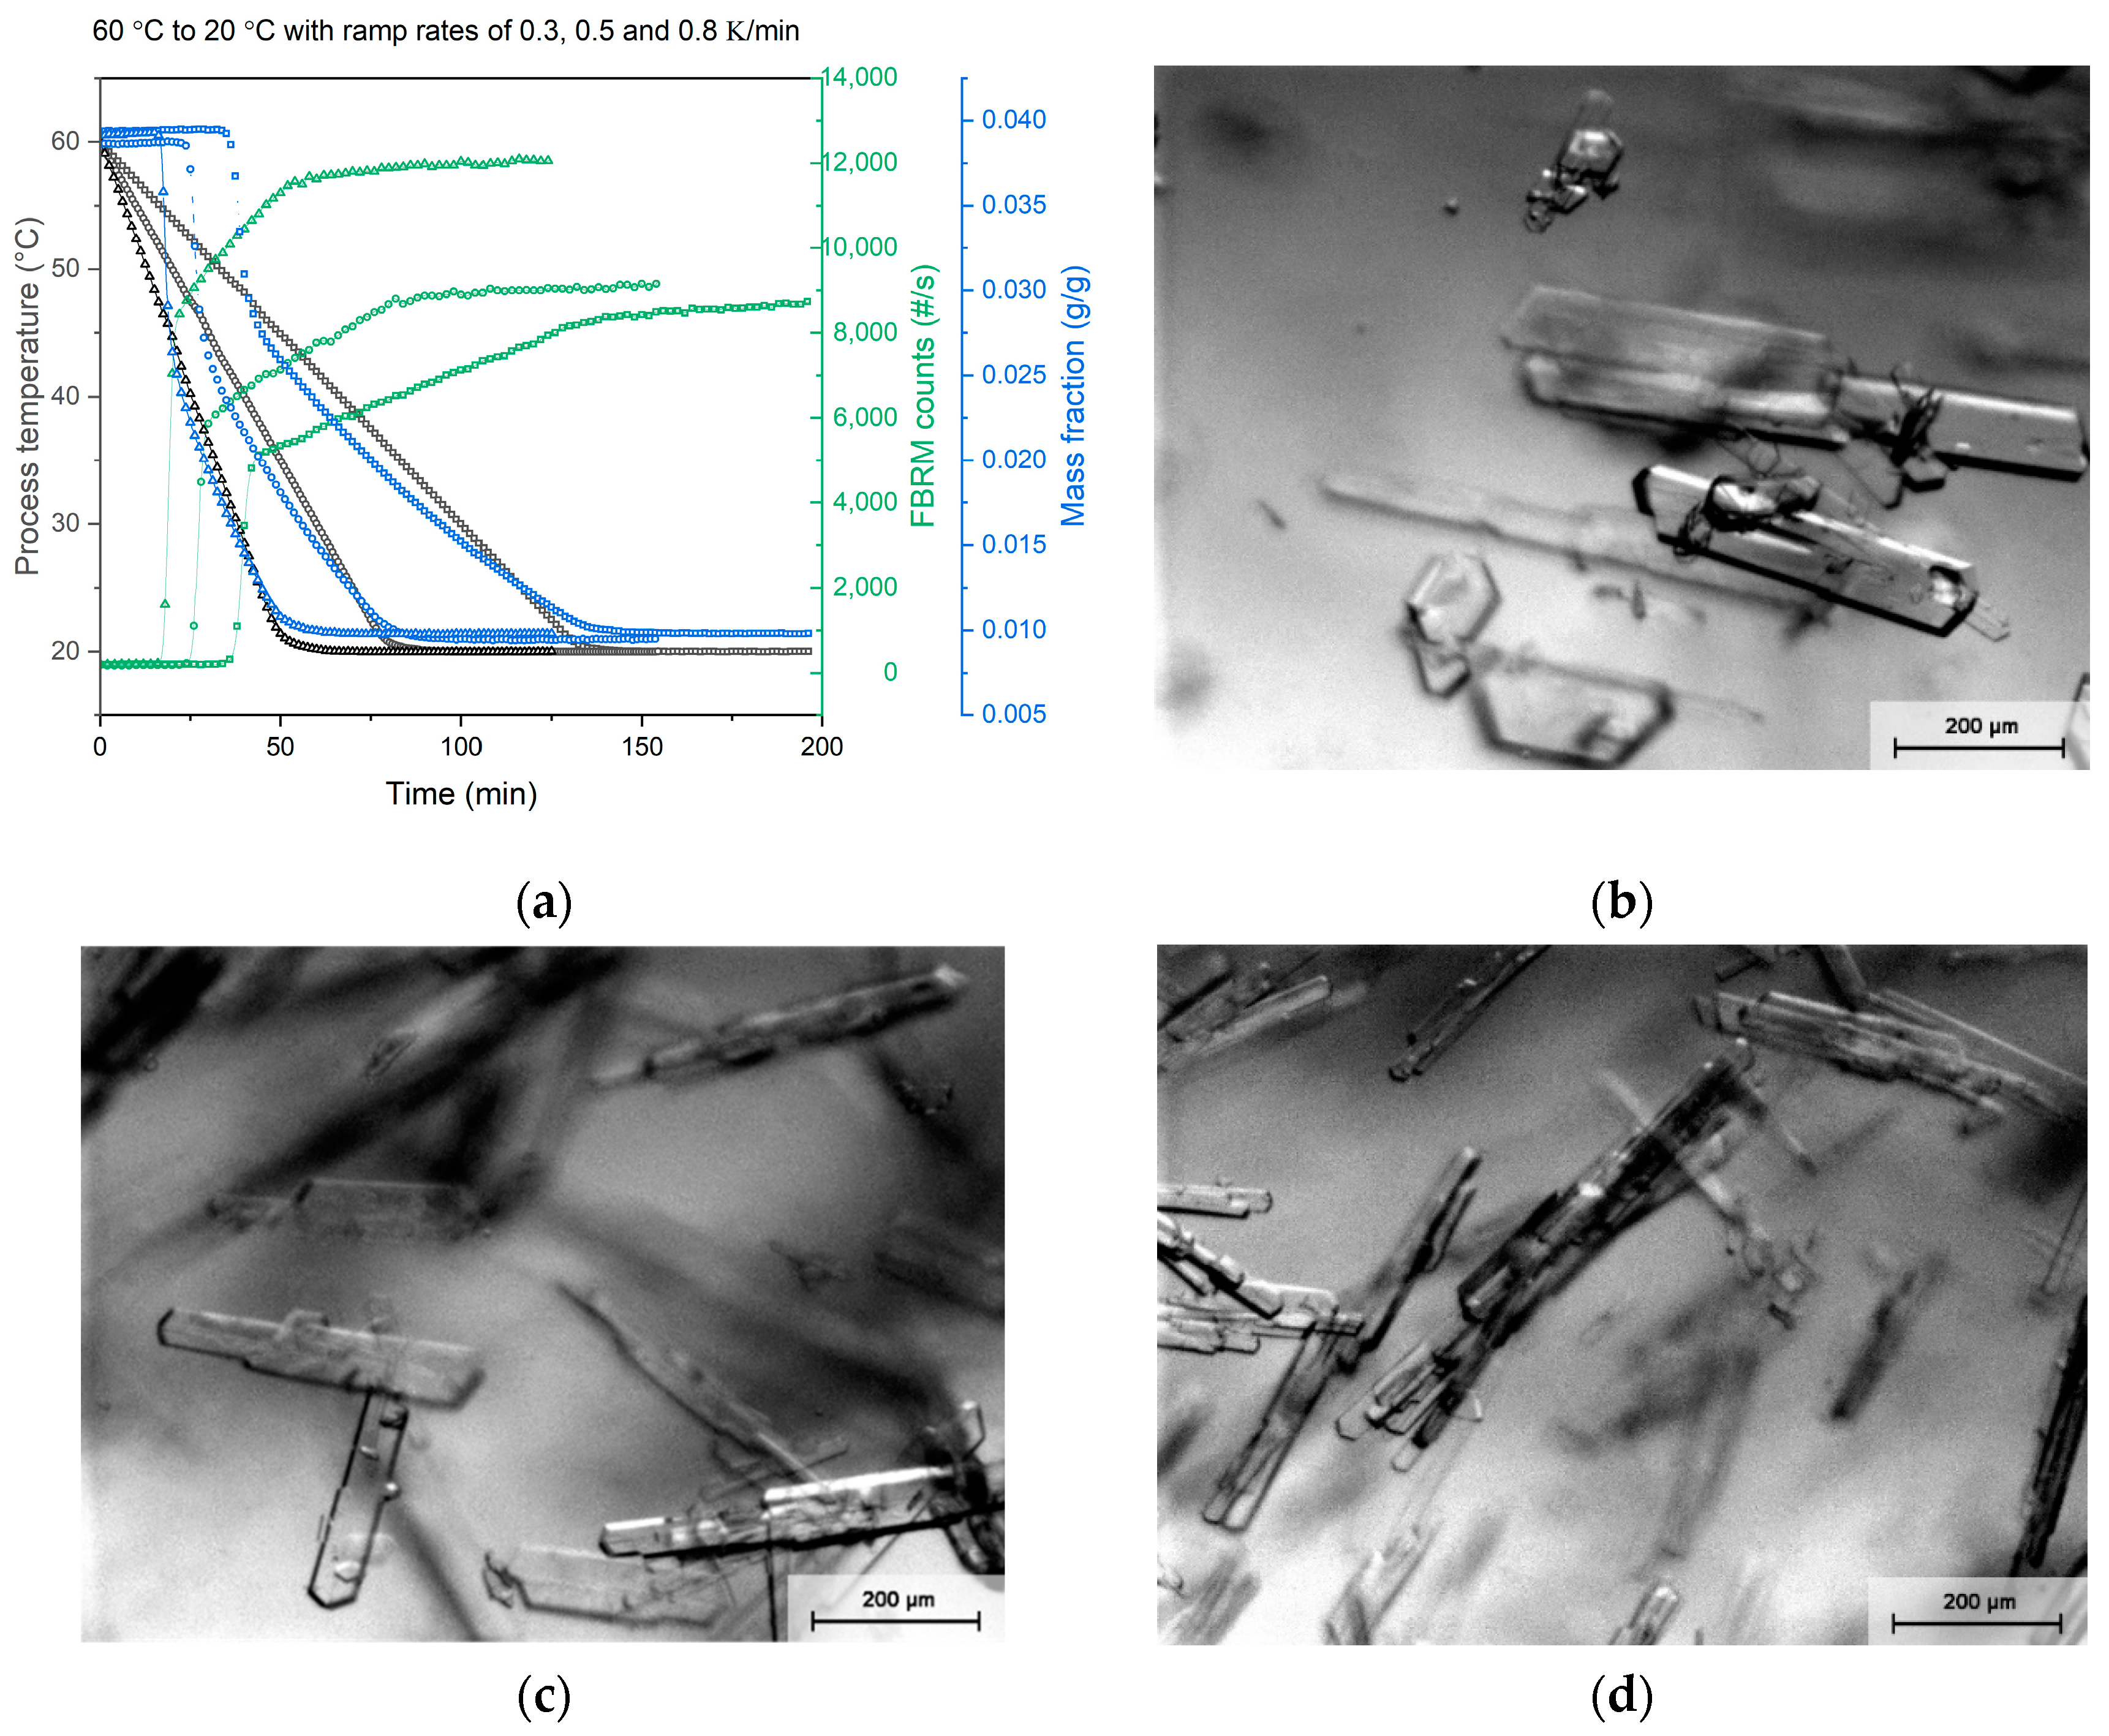
3.1. Batch Crystallization
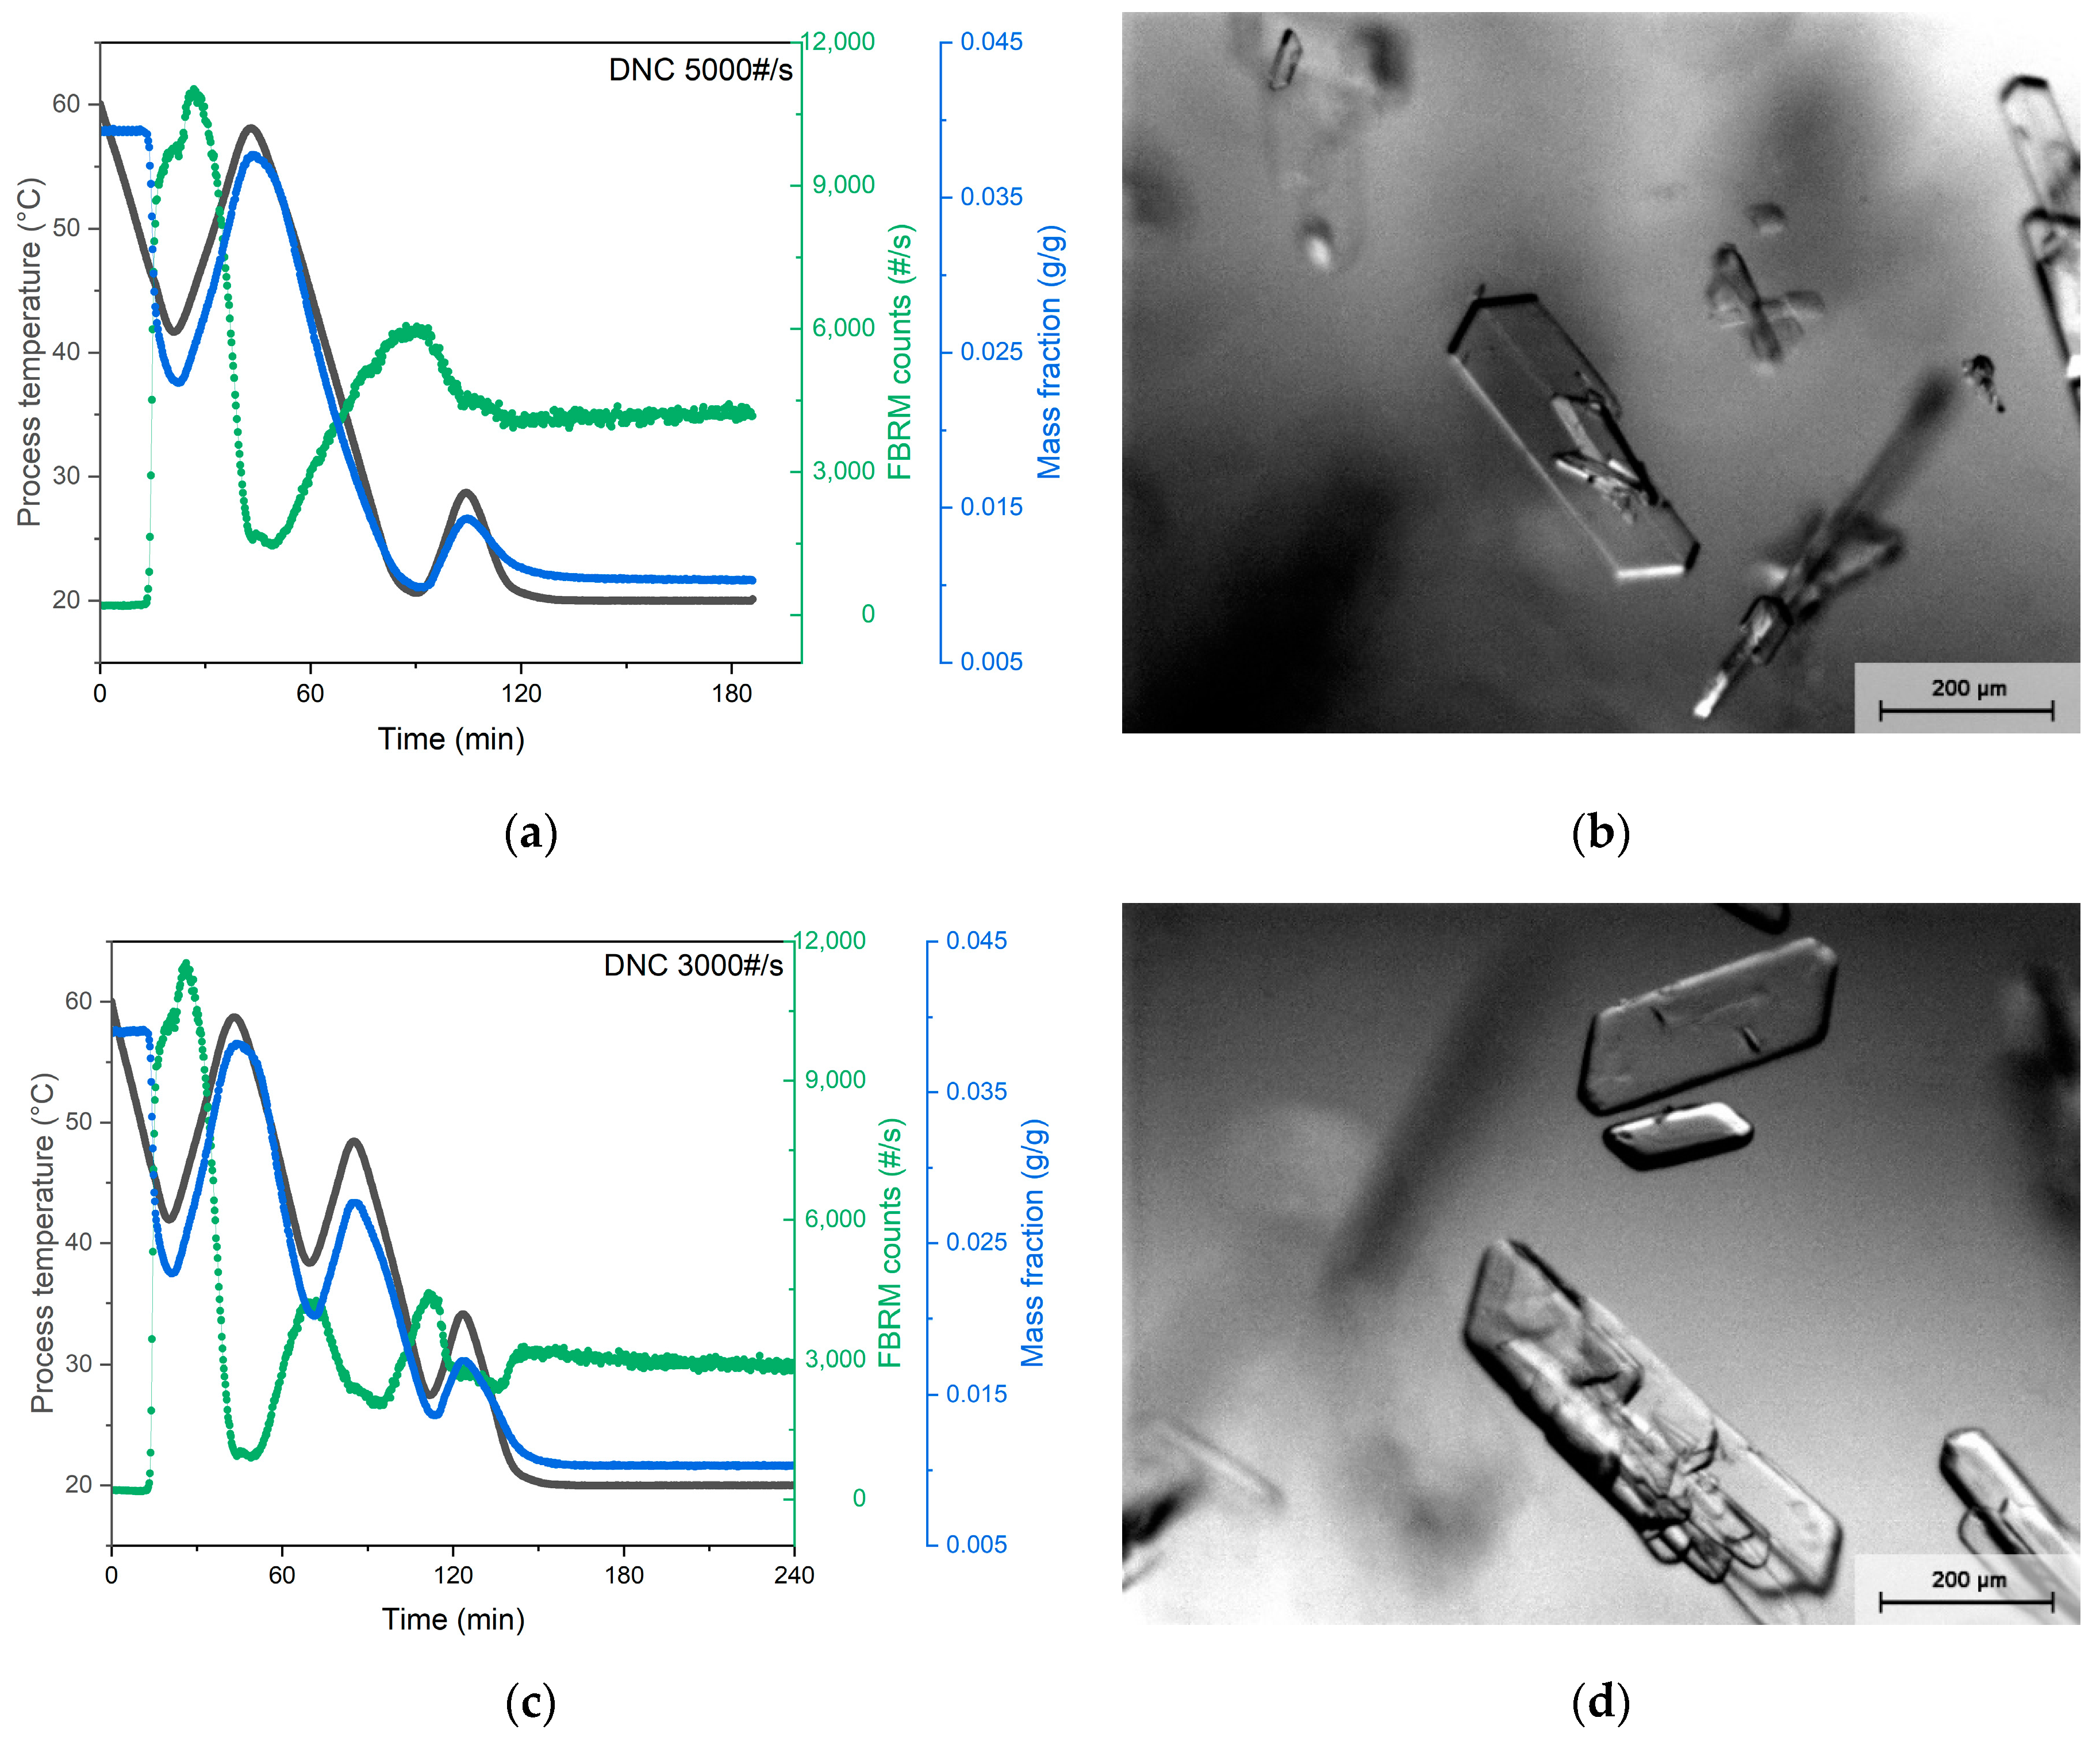
3.2. DNC
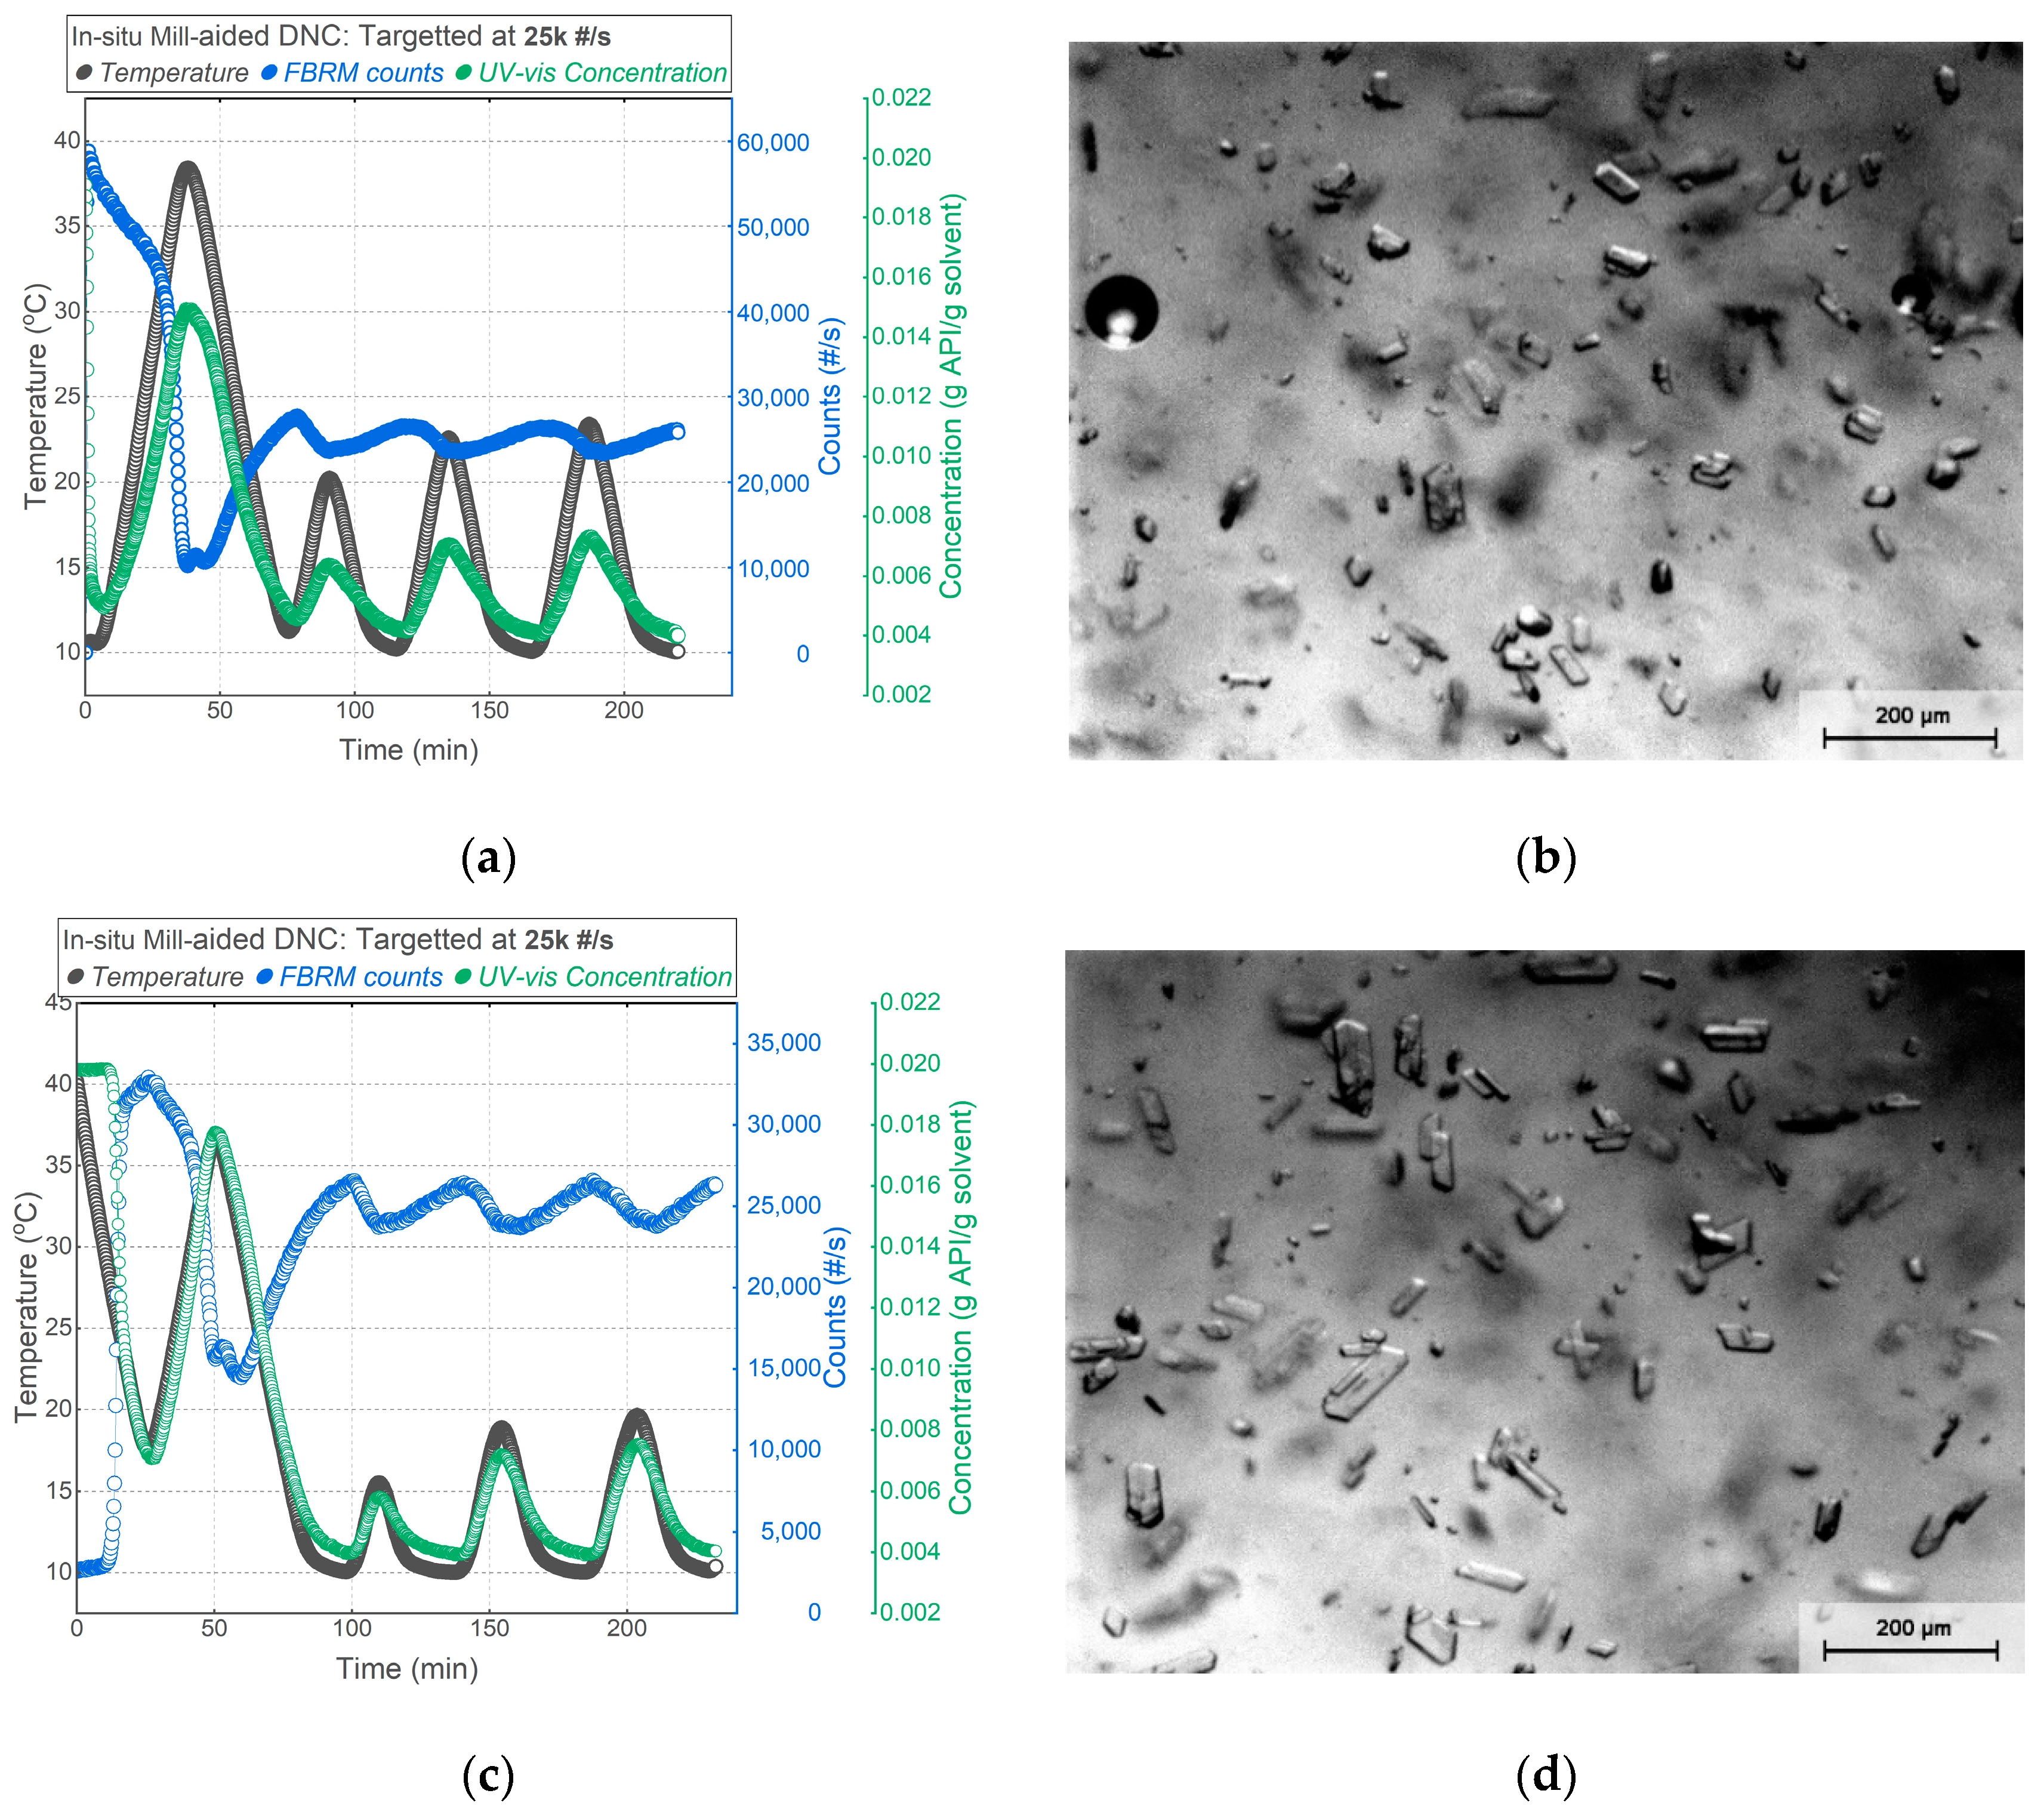
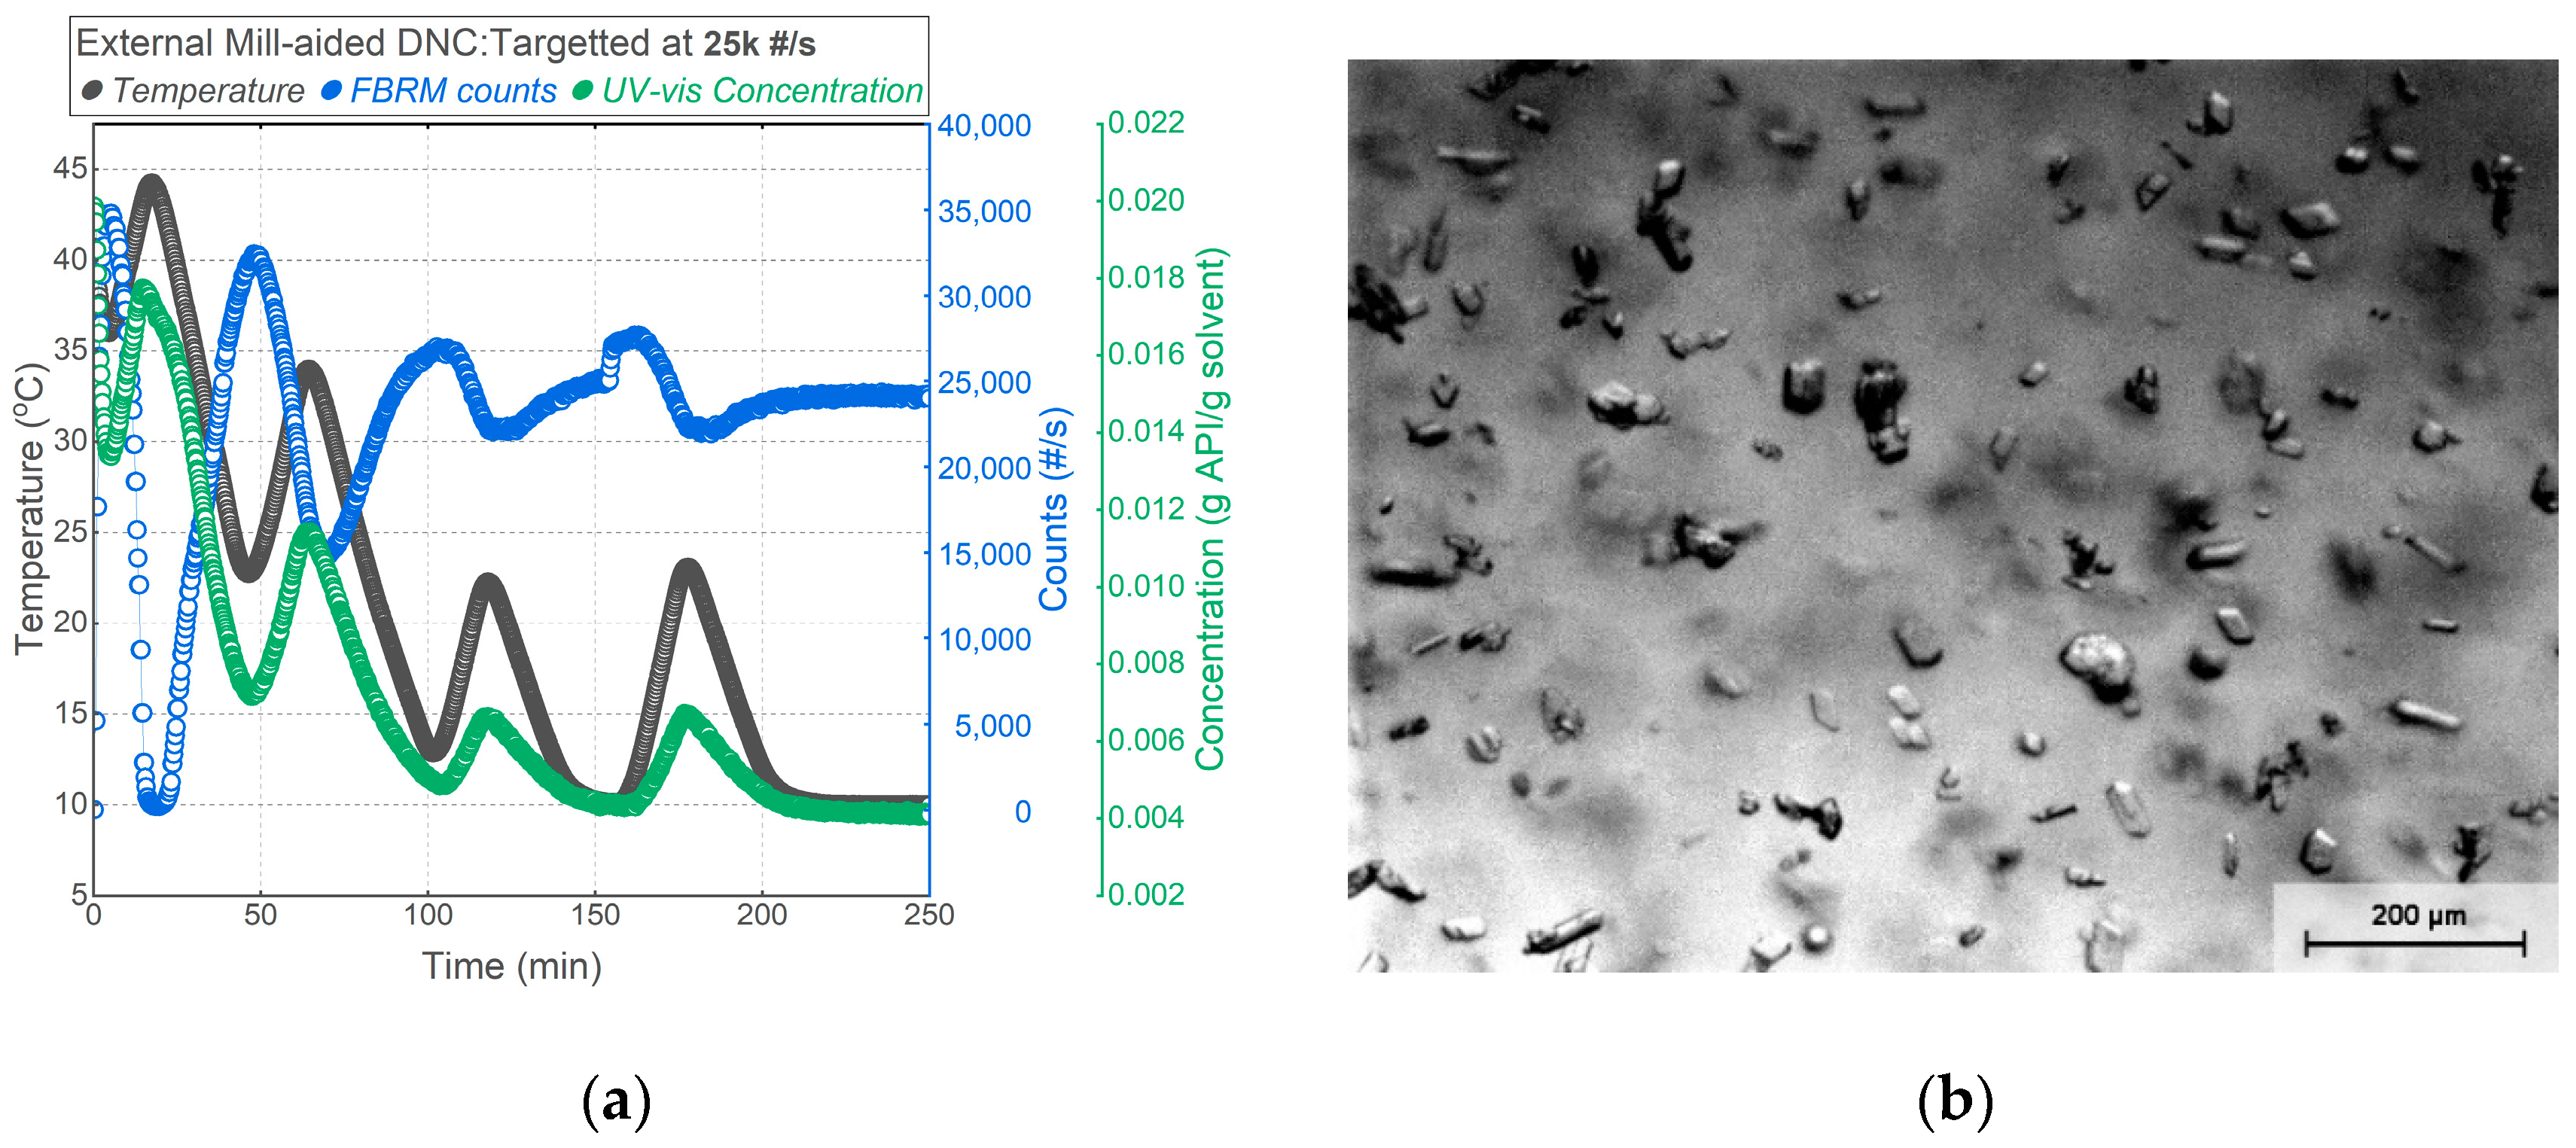
3.3. Mill-Aided DNC
4. Conclusions
Author Contributions
Funding
Institutional Review Board Statement
Informed Consent Statement
Data Availability Statement
Acknowledgments
Conflicts of Interest
References
- Su, Q.; Benyahia, B.; Nagy, Z.K.; Rielly, C.D. Mathematical Modeling, Design, and Optimization of a Multisegment Multiaddition Plug-Flow Crystallizer for Antisolvent Crystallizations. Org. Process Res. Dev. 2015, 19, 1859–1870. [Google Scholar] [CrossRef]
- Fysikopoulos, D.; Benyahia, B.; Borsos, A.; Nagy, Z.K.; Rielly, C.D. A framework for model reliability and estimability analysis of crystallization processes with multi-impurity multi-dimensional population balance models. Comput. Chem. Eng. 2019, 122, 275–292. [Google Scholar] [CrossRef]
- Zhou, L.; Su, M.; Benyahia, B.; Singh, A.; Barton, P.I.; Trout, B.L.; Myerson, A.S.; Braatz, R.D. Mathematical modeling and design of layer crystallization in a concentric annulus with and without recirculation. AIChE J. 2013, 59, 1308–1321. [Google Scholar] [CrossRef]
- Cesur, S.; Gokbel, S. Crystallization of mefenamic acid and polymorphs. Cryst. Res. Technol. 2008, 43, 720–728. [Google Scholar] [CrossRef]
- Bodnár, K.; Hudson, S.P.; Rasmuson, Å.C. Promotion of Mefenamic Acid Nucleation by a Surfactant Additive, Docusate Sodium. Cryst. Growth Des. 2019, 19, 519–603. [Google Scholar] [CrossRef]
- Borsos, Á.; Szilágyi, B.; Agachi, P.Ş.; Nagy, Z.K. Real-Time Image Processing Based Online Feedback Control System for Cooling Batch Crystallization. Org. Process Res. Dev. 2017, 21, 511–519. [Google Scholar] [CrossRef]
- Lovette, M.A.; Doherty, M.F. Predictive modeling of supersaturation-dependent crystal shapes. Cryst. Growth Des. 2012, 12, 656–669. [Google Scholar] [CrossRef]
- Shah, U.V.; Olusanmi, D.; Narang, A.S.; Hussain, M.A.; Gamble, J.F.; Tobyn, M.J.; Heng, J.Y.Y. Effect of crystal habits on the surface energy and cohesion of crystalline powders. Int. J. Pharm. 2014, 472, 140–147. [Google Scholar] [CrossRef] [PubMed]
- Hatcher, L.E.; Li, W.; Payne, P.; Benyahia, B.; Rielly, C.D.; Wilson, C.C. Tuning Morphology in Active Pharmaceutical Ingredients: Controlling the Crystal Habit of Lovastatin through Solvent Choice and Non-Size-Matched Polymer Additives. Cryst. Growth Des. 2020, 20, 5854–5862. [Google Scholar] [CrossRef]

| Experiment | Crystallization Method | Operating T (°C) | Ramp Rate (K/min) | Target Counts (#/s) |
|---|---|---|---|---|
| LC-1 | Linear cooling | 60–20 | 0.3 | - |
| LC-2 | Linear cooling | 60–20 | 0.5 | - |
| LC-3 | Linear cooling | 60–20 | 0.8 | - |
| DNC-1 | DNC | 60–20 | 1 | 5000 |
| DNC-2 | DNC | 60–20 | 1 | 3000 |
| IMDNC-1 | In situ Milling DNC | 40–10; initial T = 10 | 1 | 25,000 |
| IMDNC-2 | In situ Milling DNC | 40–10; initial T = 40 | 1 | 25,000 |
| EMDNC | External Milling DNC | 45–10; initial T = 45 | 1 | 25,000 |
| Experiment | LC-1 | LC-2 | LC-3 | DNC-1 | DNC-2 | IMDNC-1 | IMDNC-2 | EMDNC |
|---|---|---|---|---|---|---|---|---|
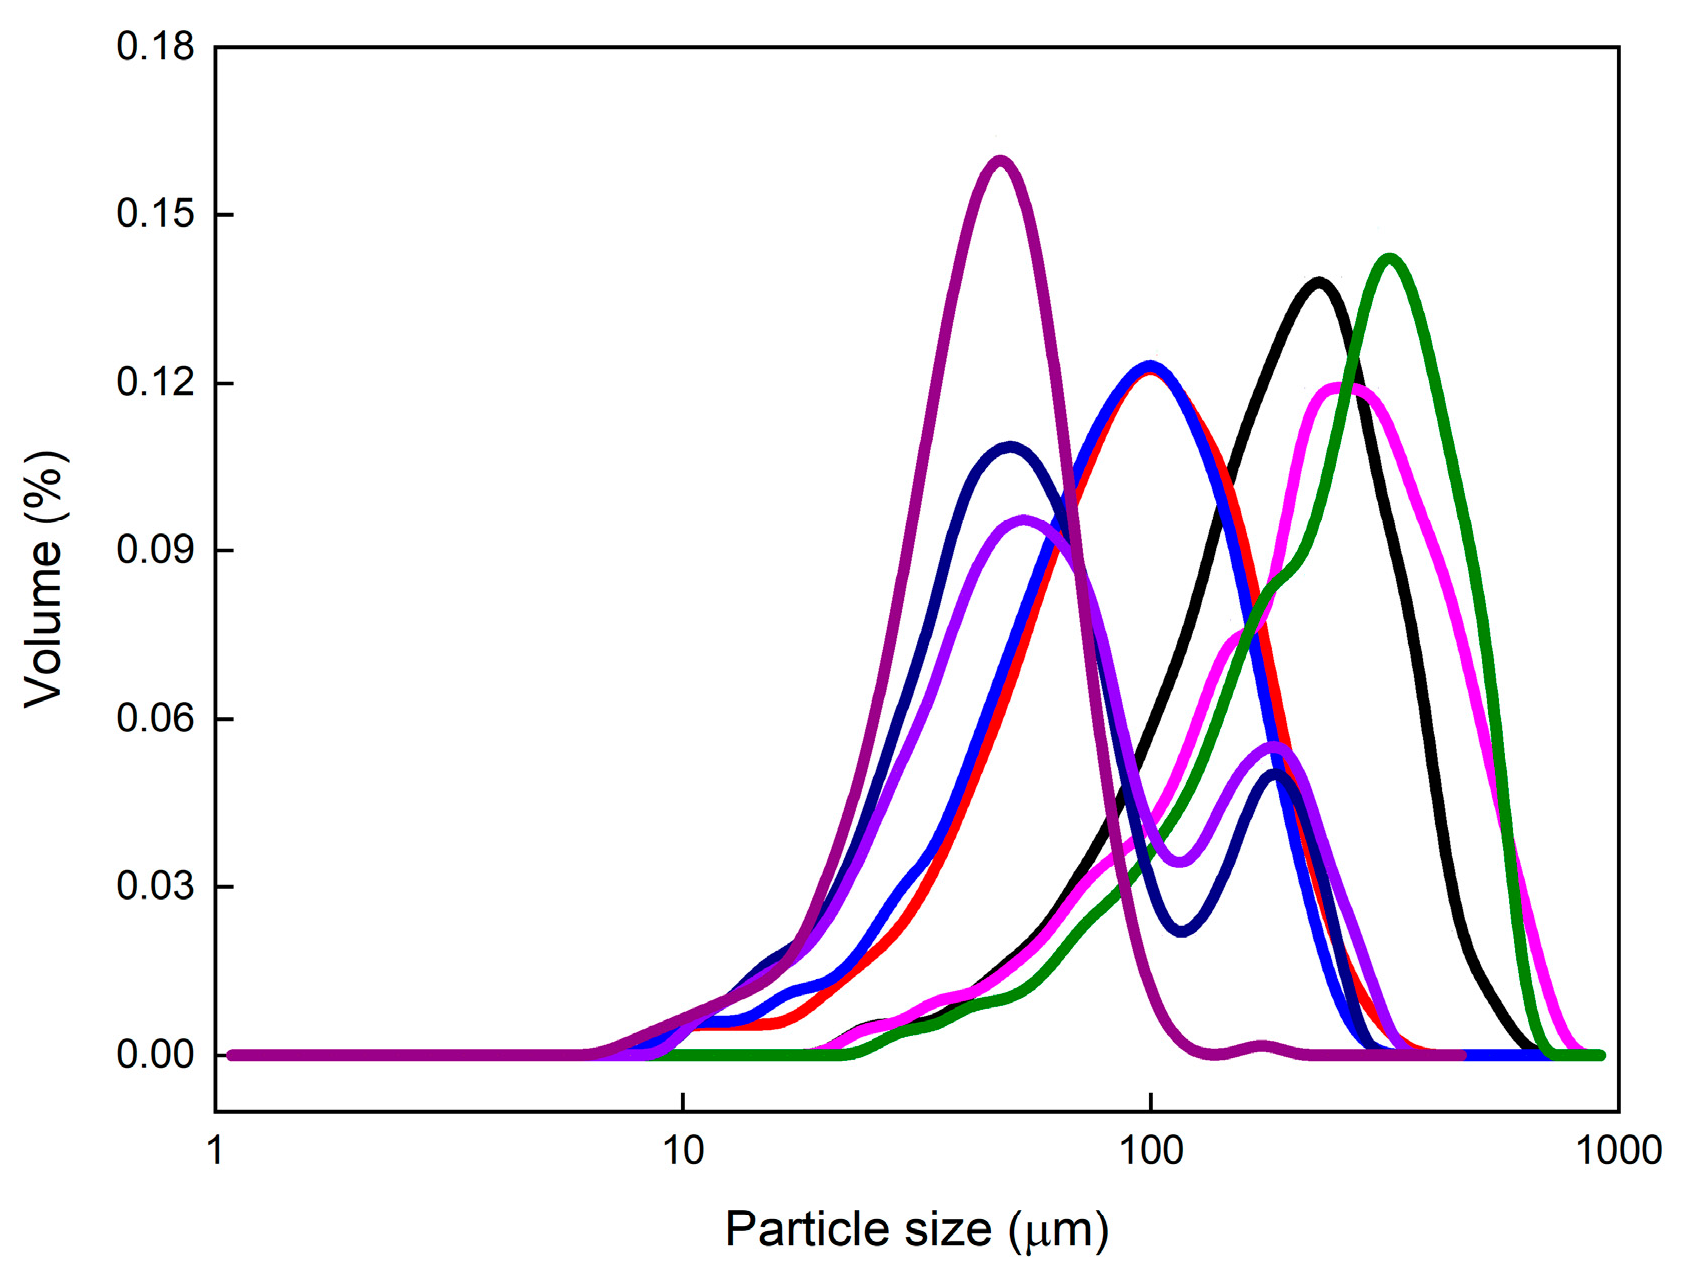
| D10 (μm) | 72 | 34 | 30 | 71 | 87 | 23 | 24 | 22 |
| D50 (μm) | 177 | 84 | 78 | 213 | 245 | 50 | 54 | 41 |
| D90 (μm) | 320 | 162 | 148 | 435 | 436 | 161 | 171 | 65 |
| AR | 2.3 | 2.8 | 3.0 | 2.7 | 2.5 | 1.9 | 2.0 | 1.9 |
Publisher’s Note: MDPI stays neutral with regard to jurisdictional claims in published maps and institutional affiliations. |
© 2022 by the authors. Licensee MDPI, Basel, Switzerland. This article is an open access article distributed under the terms and conditions of the Creative Commons Attribution (CC BY) license (https://creativecommons.org/licenses/by/4.0/).
Share and Cite
Li, W.; Rielly, C.D.; Benyahia, B. Targeting Desired Particle Size for Improved Dissolution and Manufacturability of Mefenamic Acid. Chem. Proc. 2022, 9, 21. https://doi.org/10.3390/IOCC_2022-12165
Li W, Rielly CD, Benyahia B. Targeting Desired Particle Size for Improved Dissolution and Manufacturability of Mefenamic Acid. Chemistry Proceedings. 2022; 9(1):21. https://doi.org/10.3390/IOCC_2022-12165
Chicago/Turabian StyleLi, Wei, Chris D. Rielly, and Brahim Benyahia. 2022. "Targeting Desired Particle Size for Improved Dissolution and Manufacturability of Mefenamic Acid" Chemistry Proceedings 9, no. 1: 21. https://doi.org/10.3390/IOCC_2022-12165
APA StyleLi, W., Rielly, C. D., & Benyahia, B. (2022). Targeting Desired Particle Size for Improved Dissolution and Manufacturability of Mefenamic Acid. Chemistry Proceedings, 9(1), 21. https://doi.org/10.3390/IOCC_2022-12165