Interspecies Quantitative Structure-Toxicity-Toxicity Relationships for Predicting the Acute Toxicity of Organophosphorous Compounds †
Abstract
:1. Introduction
2. Methods
2.1. Definition of Target Property and Structural Descriptors
2.2. Multiple Linear Regression Approach and Model Validation
3. Results and Discussion
4. Conclusions
Author Contributions
Funding
Institutional Review Board Statement
Informed Consent Statement
Data Availability Statement
Acknowledgments
Conflicts of Interest
References
- Katz, F.S.; Pecic, S.; Schneider, L.; Zhu, Z.; Hastings, A.; Luzac, M.; Macdonald, J.; Landry, D.W.; Stojanovic, M.N. New Therapeutic Approaches and Novel Alternatives for Organophosphate Toxicity. Toxicol. Lett. 2018, 291, 1–10. [Google Scholar] [CrossRef] [PubMed]
- Lerro, C.C.; Koutros, S.; Andreotti, G.; Friesen, M.C.; Alavanja, M.C.; Blair, A.; Hoppin, J.A.; Sandler, D.P.; Lubin, J.H.; Ma, X.; et al. Organophosphate insecticide use and cancer incidence among spouses of pesticide applicators in the Agricultural Health Study. Occup. Environ. Med. 2015, 72, 736–744. [Google Scholar] [CrossRef] [PubMed] [Green Version]
- Sultatos, L.G. Mammalian toxicology of organophosphorus pesticides. J. Toxicol. Environ. Health Part A 1994, 43, 271–289. [Google Scholar] [CrossRef] [PubMed]
- Fukuto, T.R. Mechanism of action of organophosphorus and carbamate insecticides. Environ. Health Persp. 1990, 87, 245–254. [Google Scholar] [CrossRef]
- Strickland, J.; Clippinger, A.J.; Brown, J.; Allen, D.; Jacobs, A.; Matheson, J.; Lowit, A.; Reinke, E.N.; Johnson, M.S.; Quinn, M.J., Jr.; et al. Status of acute systemic toxicity testing requirements and data uses by U.S. regulatory agencies. Regul. Toxicol. Pharmacol. 2018, 94, 183–196. [Google Scholar] [CrossRef]
- Minerali, E.; Foil, D.; Zorn, K.; Ekins, S. Evaluation of Assay Central Machine Learning Models for Rat Acute Oral Toxicity Prediction. ACS Sustain. Chem. Eng. 2020, 8, 16020–16027. [Google Scholar] [CrossRef]
- Kar, S.; Das, R.N.; Roy, K.; Leszczynski, J. Can Toxicity for Different Species be Correlated? The Concept and Emerging Applications of Interspecies Quantitative Structure-Toxicity Relationship (i-QSTR) Modeling. Int. J. Quant. Struct. -Prop. Relatsh. 2016, 1, 23–51. [Google Scholar] [CrossRef]
- Cronin, M.T. (Q)SARs to predict environmental toxicities: Current status and future needs. Environ. Sci. Processes Impacts 2017, 19, 213–220. [Google Scholar] [CrossRef]
- Cronin, M.T.D.; Dearden, J.C. QSAR in Toxicology. 2. Prediction of Acute Mammalian Toxicity and Interspecies Correlation. Quant. Struct. -Act. Relat. 1995, 14, 117–120. [Google Scholar] [CrossRef]
- Cronin, M.T.D. Biological read-across: Mechanistically based species-species and endpoint-endpoint extrapolations. In In Silico Toxicology: Principles and Applications; Cronin, M.T.D., Madden, J.C., Eds.; Royal Society of Chemistry: Cambridge, UK, 2010; pp. 446–477. [Google Scholar]
- Vermeire, T.G.; Baars, A.J.; Bessems, J.G.M.; Blaauboer, B.J.; Slob, W.; Muller, J.J.A. Toxicity Testing For Human Health Risk Assessment. In Risk Assessment of Chemicals, An Introduction, 2nd ed.; van Leeuwen, C.J., Vermeire, T.G., Eds.; Springer: Dordrecht, The Netherlands, 2007; pp. 227–280. [Google Scholar]
- Traas, T.P.; van Leeuwen, C.J. Ecotoxicological Effects. In Risk Assessment of Chemicals. An Introduction, 2nd ed.; van Leeuwen, C.J., Vermeire, T.G., Eds.; Springer: Dordrecht, The Netherlands, 2007; pp. 281–356. [Google Scholar]
- Das, R.N.; Roy, K.; Popelier, P.L.A. Interspecies quantitative structure–toxicity–toxicity (QSTTR) relationship modeling of ionic liquids. Toxicity of ionic liquids to V. fischeri, D. magna and S. vacuolatus. Ecotoxol. Environ. Saf. 2015, 122, 497–520. [Google Scholar] [CrossRef]
- Cassani, S.; Kovarich, S.; Papa, E.; Roy, P.P.; van der Wal, L.; Gramatica, P. Daphnia and fish toxicity of (benzo)-triazoles: Validated QSAR models, and interspecies quantitative activity–activity modelling. J. Hazard. Mater. 2013, 258–259, 50–60. [Google Scholar] [CrossRef]
- Furuhama, A.; Hasunuma, K.; Aoki, Y. Interspecies quantitative structure–activity–activity relationships(QSAARs) for prediction of acute aquatic toxicity of aromatic amines and phenols. SAR QSAR Environ. Res. 2015, 26, 301–323. [Google Scholar] [CrossRef] [PubMed]
- Roy, K.; Das, R.N.; Popelier, P.A. Predictive QSAR modelling of algal toxicity of ionic liquids and its interspecies correlation with Daphnia toxicity. Environ. Sci. Pollut. Res. 2015, 22, 6634–6641. [Google Scholar] [CrossRef] [PubMed]
- Hawkins, P.C.D.; Skillman, A.G.; Warren, G.L.; Ellingson, B.A.; Stahl, M.T. Conformer generation with OMEGA: Algorithm and validation using high quality structures from the Protein Databank and Cambridge Structural Database. J. Chem. Inf. Model. 2010, 50, 572–584. [Google Scholar] [CrossRef]
- Hawkins, P.C.D.; Nicholls, A. Conformer generation with OMEGA: Learning from the data set and the analysis of failures. J. Chem. Inf. Model. 2012, 52, 2919–2936. [Google Scholar] [CrossRef]
- Wold, S.; Dunn III, W.J. Multivariate quantitative structure-activity relationships (QSAR): Conditions for their applicability. J. Chem. Inf. Comput. Sci. 1983, 23, 6–13. [Google Scholar] [CrossRef]
- Chirico, N.; Sangion, A.; Gramatica, P.; Bertato, L.; Casartelli, I.; Papa, E. QSARINS-Chem standalone version: A new platform-independent software to profile chemicals for physico-chemical properties, fate, and toxicity. J. Comput. Chem. 2021, 42, 1452–1460. [Google Scholar] [CrossRef] [PubMed]
- Gramatica, P.; Chirico, N.; Papa, E.; Cassani, S.; Kovarich, S. QSARINS: A new software for the development, analysis, and validation of QSAR MLR models. J. Comput. Chem. 2013, 34, 2121–2132. [Google Scholar] [CrossRef]
- Todeschini, R.; Consonni, V.; Maiocchi, A. The K correlation index: Theory development and its application in chemometrics. Chemom. Intell. Lab. 1999, 46, 13–29. [Google Scholar] [CrossRef]
- Eriksson, L.; Johansson, E.; Kettaneh-Wold, N.; Wold, S. Multi and Megavariate Data Analysis: Principles and Applications; Umetrics AB: Umea, Sweden, 2001; pp. 92–97, 489–491. [Google Scholar]
- Goodarzi, M.; Deshpande, S.; Murugesan, V.; Katti, S.B.; Prabhakar, Y.S. Is Feature Selection Essential for ANN Modeling? QSAR Comb. Sci. 2009, 28, 1487–1499. [Google Scholar] [CrossRef]
- Gramatica, P. Principles of QSAR Modeling: Comments and Suggestions from Personal Experience. Int. J. Quant. Struct. -Prop. Relatsh. 2020, 5, 1–37. [Google Scholar] [CrossRef]
- Shi, L.M.; Fang, H.; Tong, W.; Wu, J.; Perkins, R.; Blair, R.M.; Branham, W.S.; Dial, S.L.; Moland, C.L.; Sheehan, D.M. QSAR models using a large diverse set of estrogens. J. Chem. Inf. Model. 2001, 41, 186–195. [Google Scholar] [CrossRef] [PubMed]
- Schüürmann, G.; Ebert, R.U.; Chen, J.; Wang, B.; Kühne, R. External validation and prediction employing the predictive squared correlation coefficient test set activity mean vs training set activity mean. J. Chem. Inf. Model. 2008, 48, 2140–2145. [Google Scholar] [CrossRef] [PubMed]
- Consonni, V.; Ballabio, D.; Todeschini, R. Comments on the definition of the Q2 parameter for QSAR validation. J. Chem. Inf. Model. 2009, 49, 1669–1678. [Google Scholar] [CrossRef]
- Chirico, N.; Gramatica, P. Real External Predictivity of QSAR Models: How To Evaluate It? Comparison of Different Validation Criteria and Proposal of Using the Concordance Correlation Coefficient. J. Chem. Inf. Model. 2011, 51, 2320–2335. [Google Scholar] [CrossRef]
- Chirico, N.; Gramatica, P. Real External Predictivity of QSAR Models. Part 2. New Intercomparable Thresholds for Different Validation Criteria and the Need for Scatter Plot Inspection. J. Chem. Inf. Model. 2012, 52, 2044–2058. [Google Scholar] [CrossRef]
- Roy, K.; Mitra, I. On the Use of the Metric as an Effective Tool for Validation of QSAR Models in Computational Drug Design and Pre-dictive Toxicology. Mini-Rev. Med. Chem. 2012, 12, 491–504. [Google Scholar] [CrossRef]
- Keller, H.R.; Massart, D.L.; Brans, J.P. Multicriteria decision making: A case study. Chemom. Intell. Lab. Syst. 1991, 11, 175–189. [Google Scholar] [CrossRef] [Green Version]
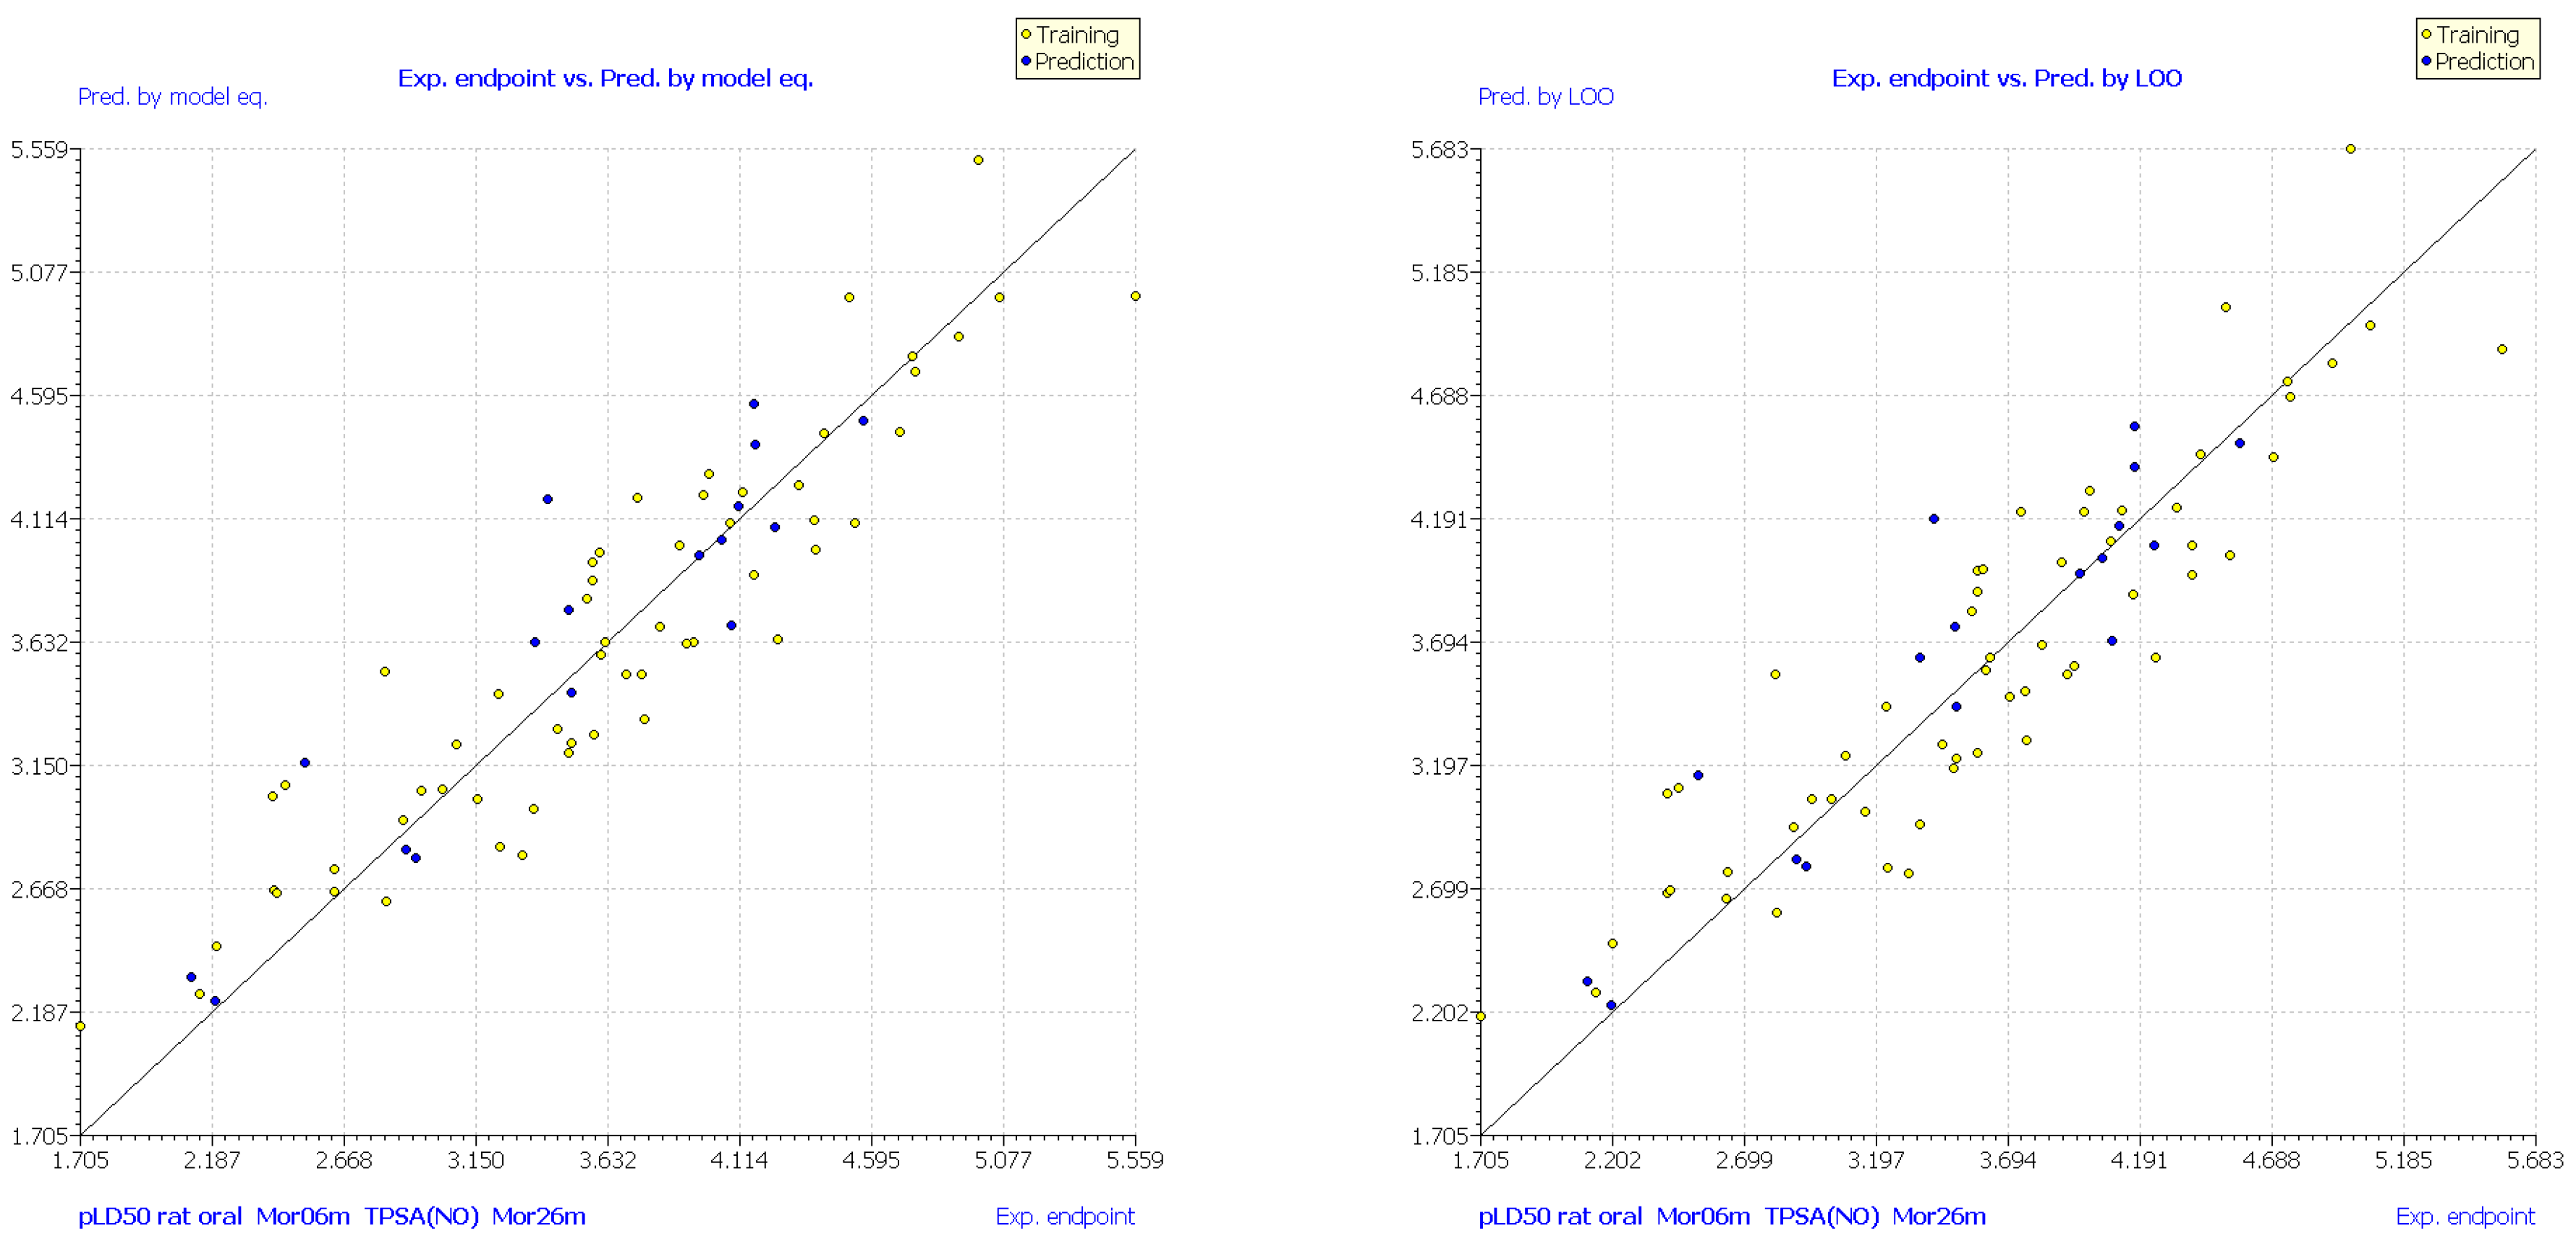
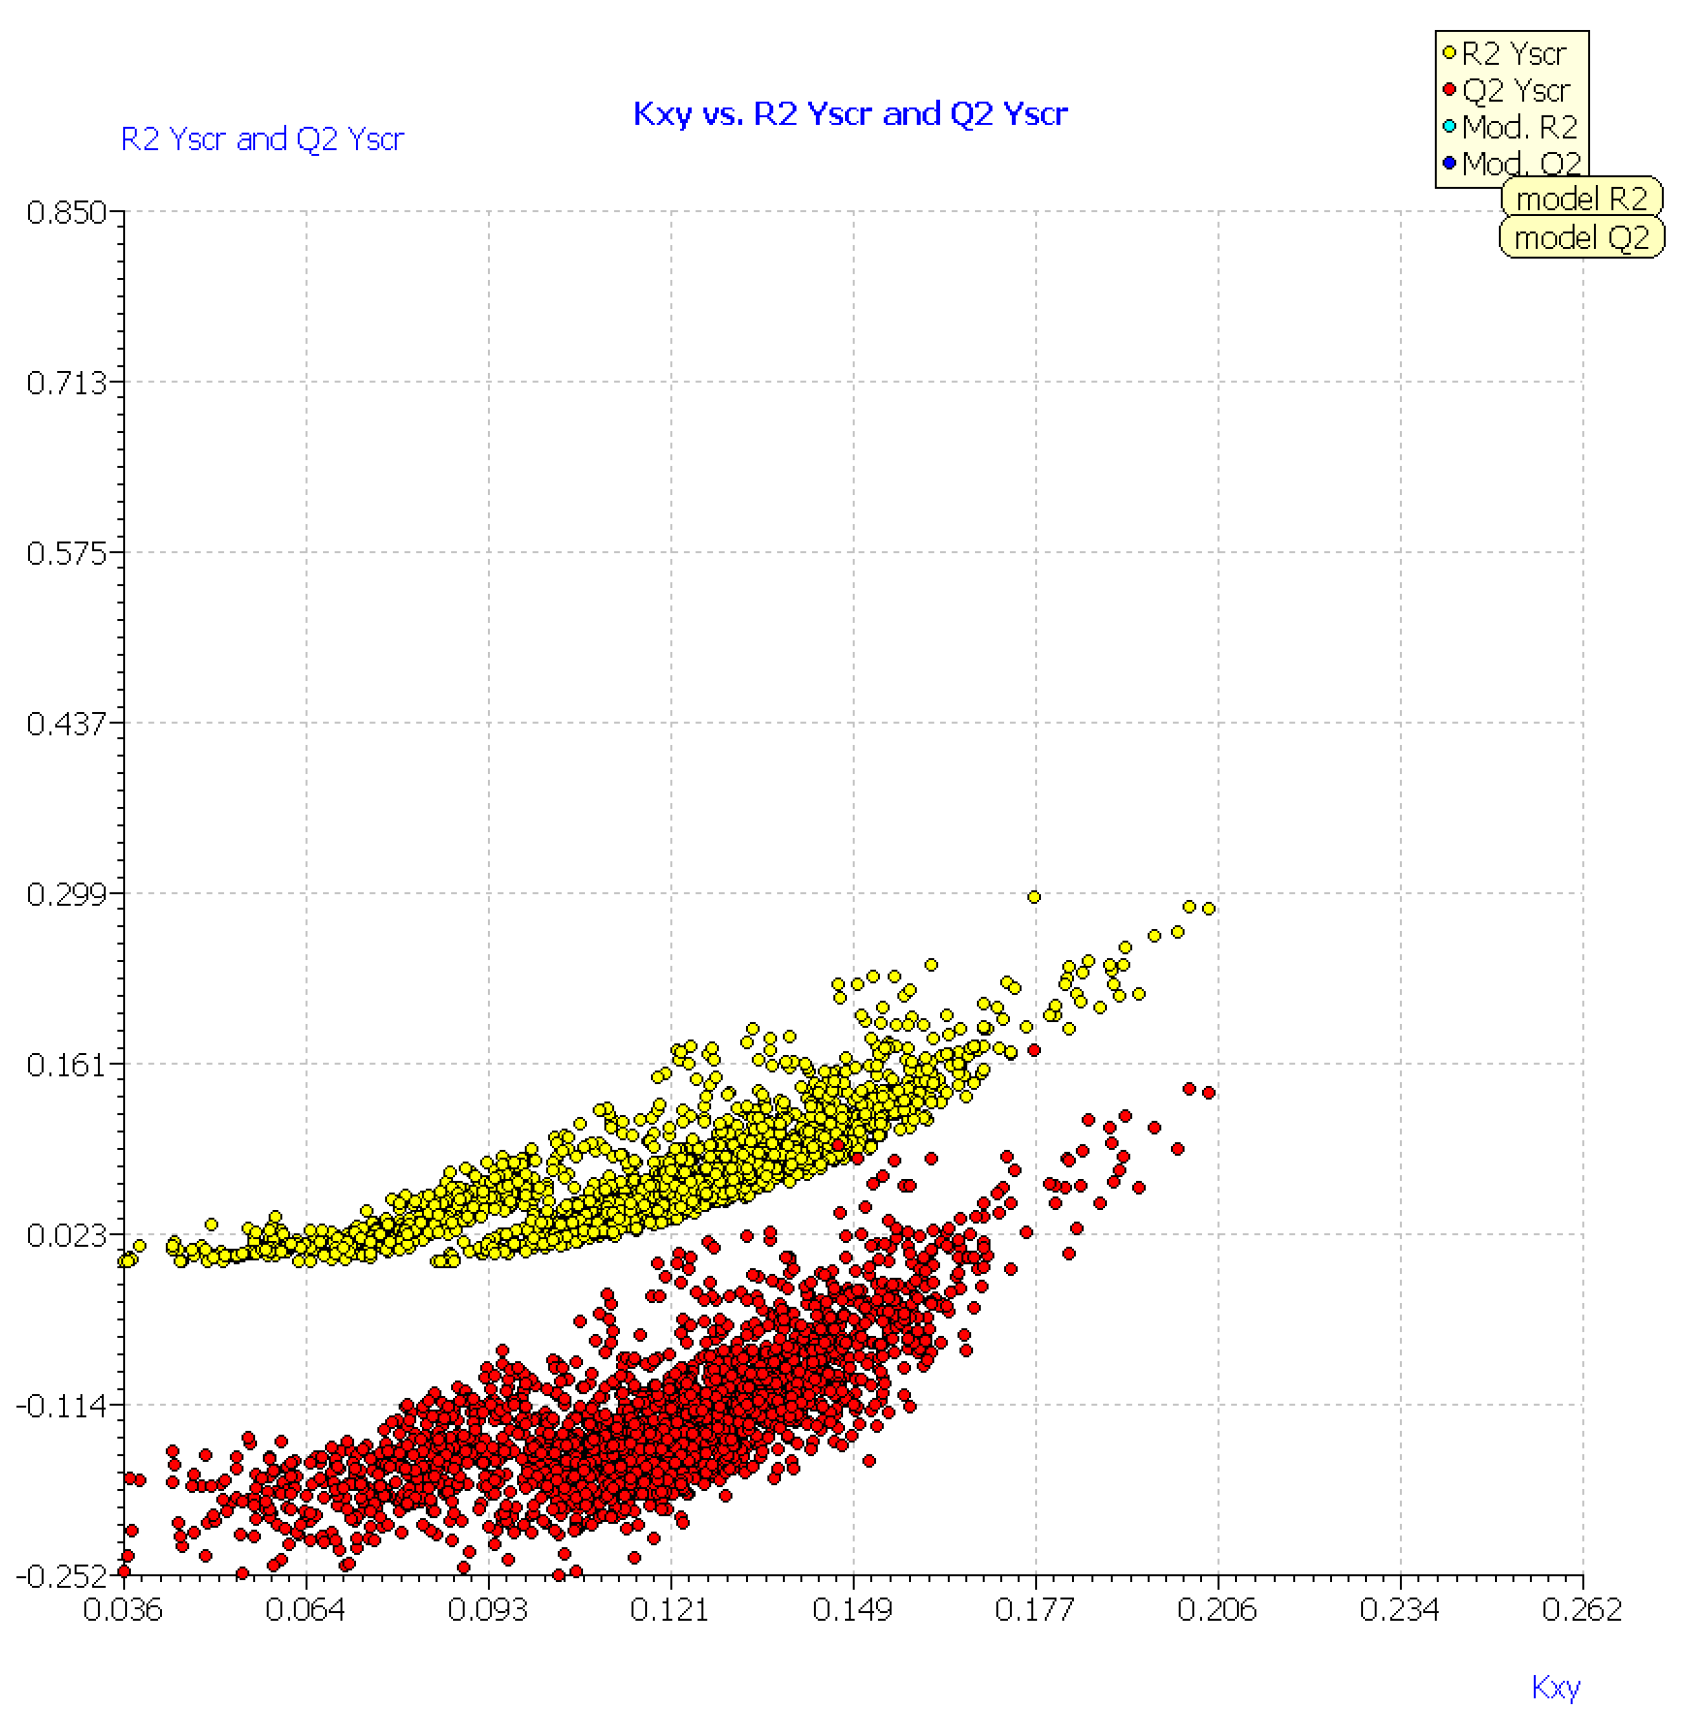
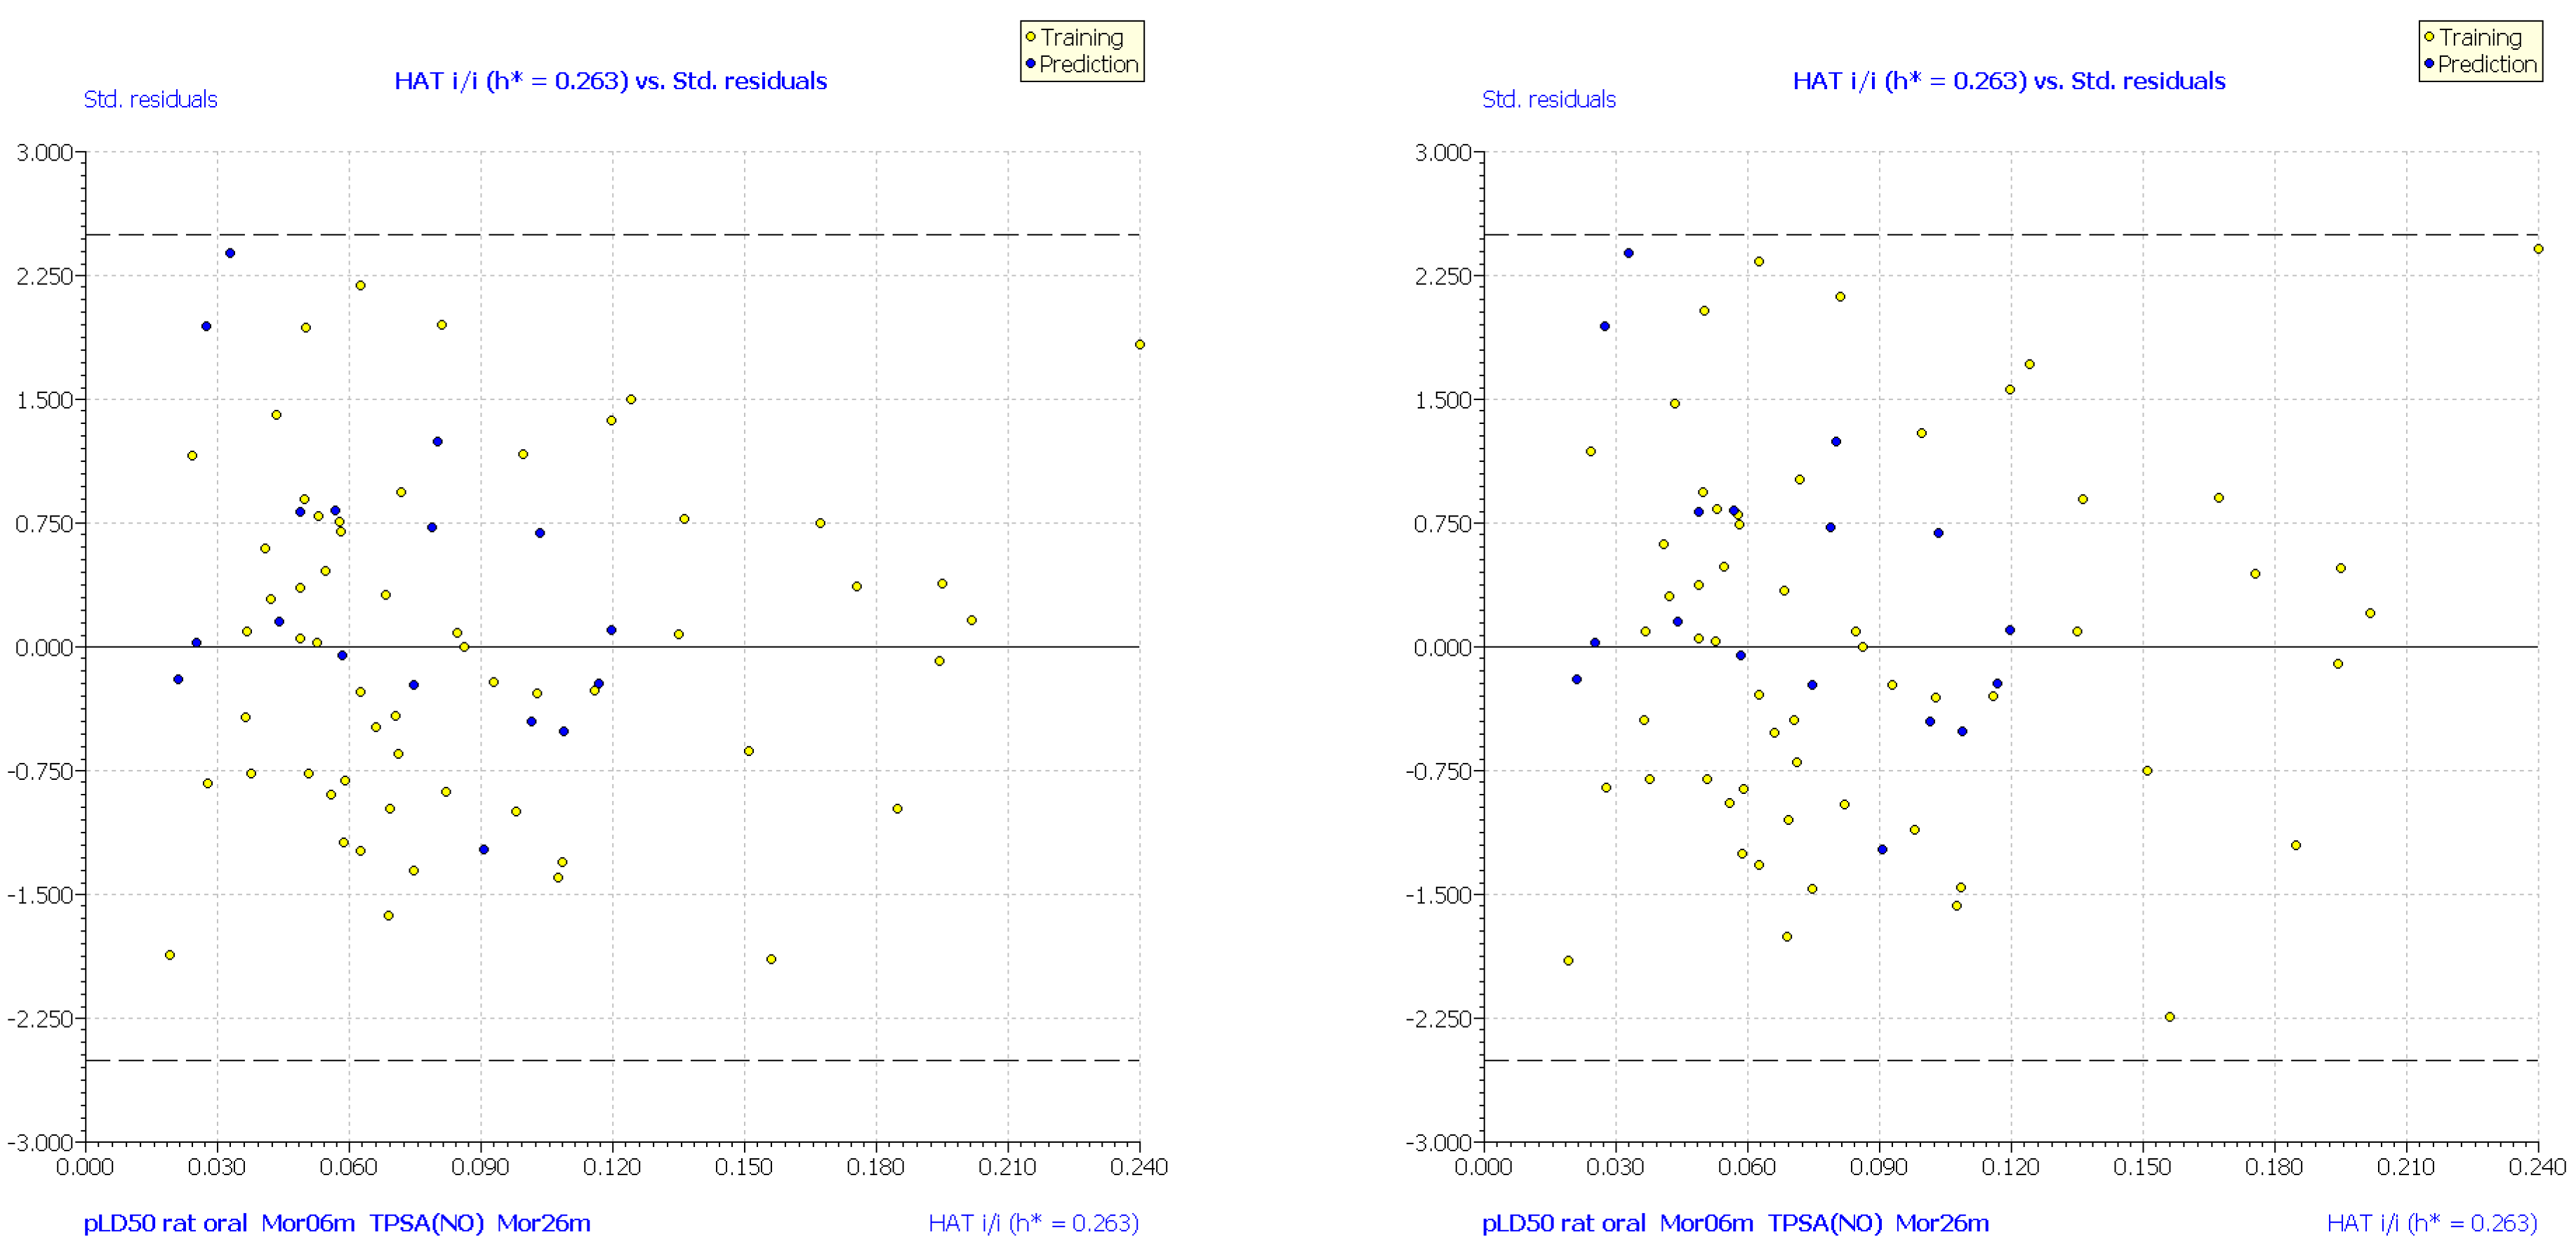
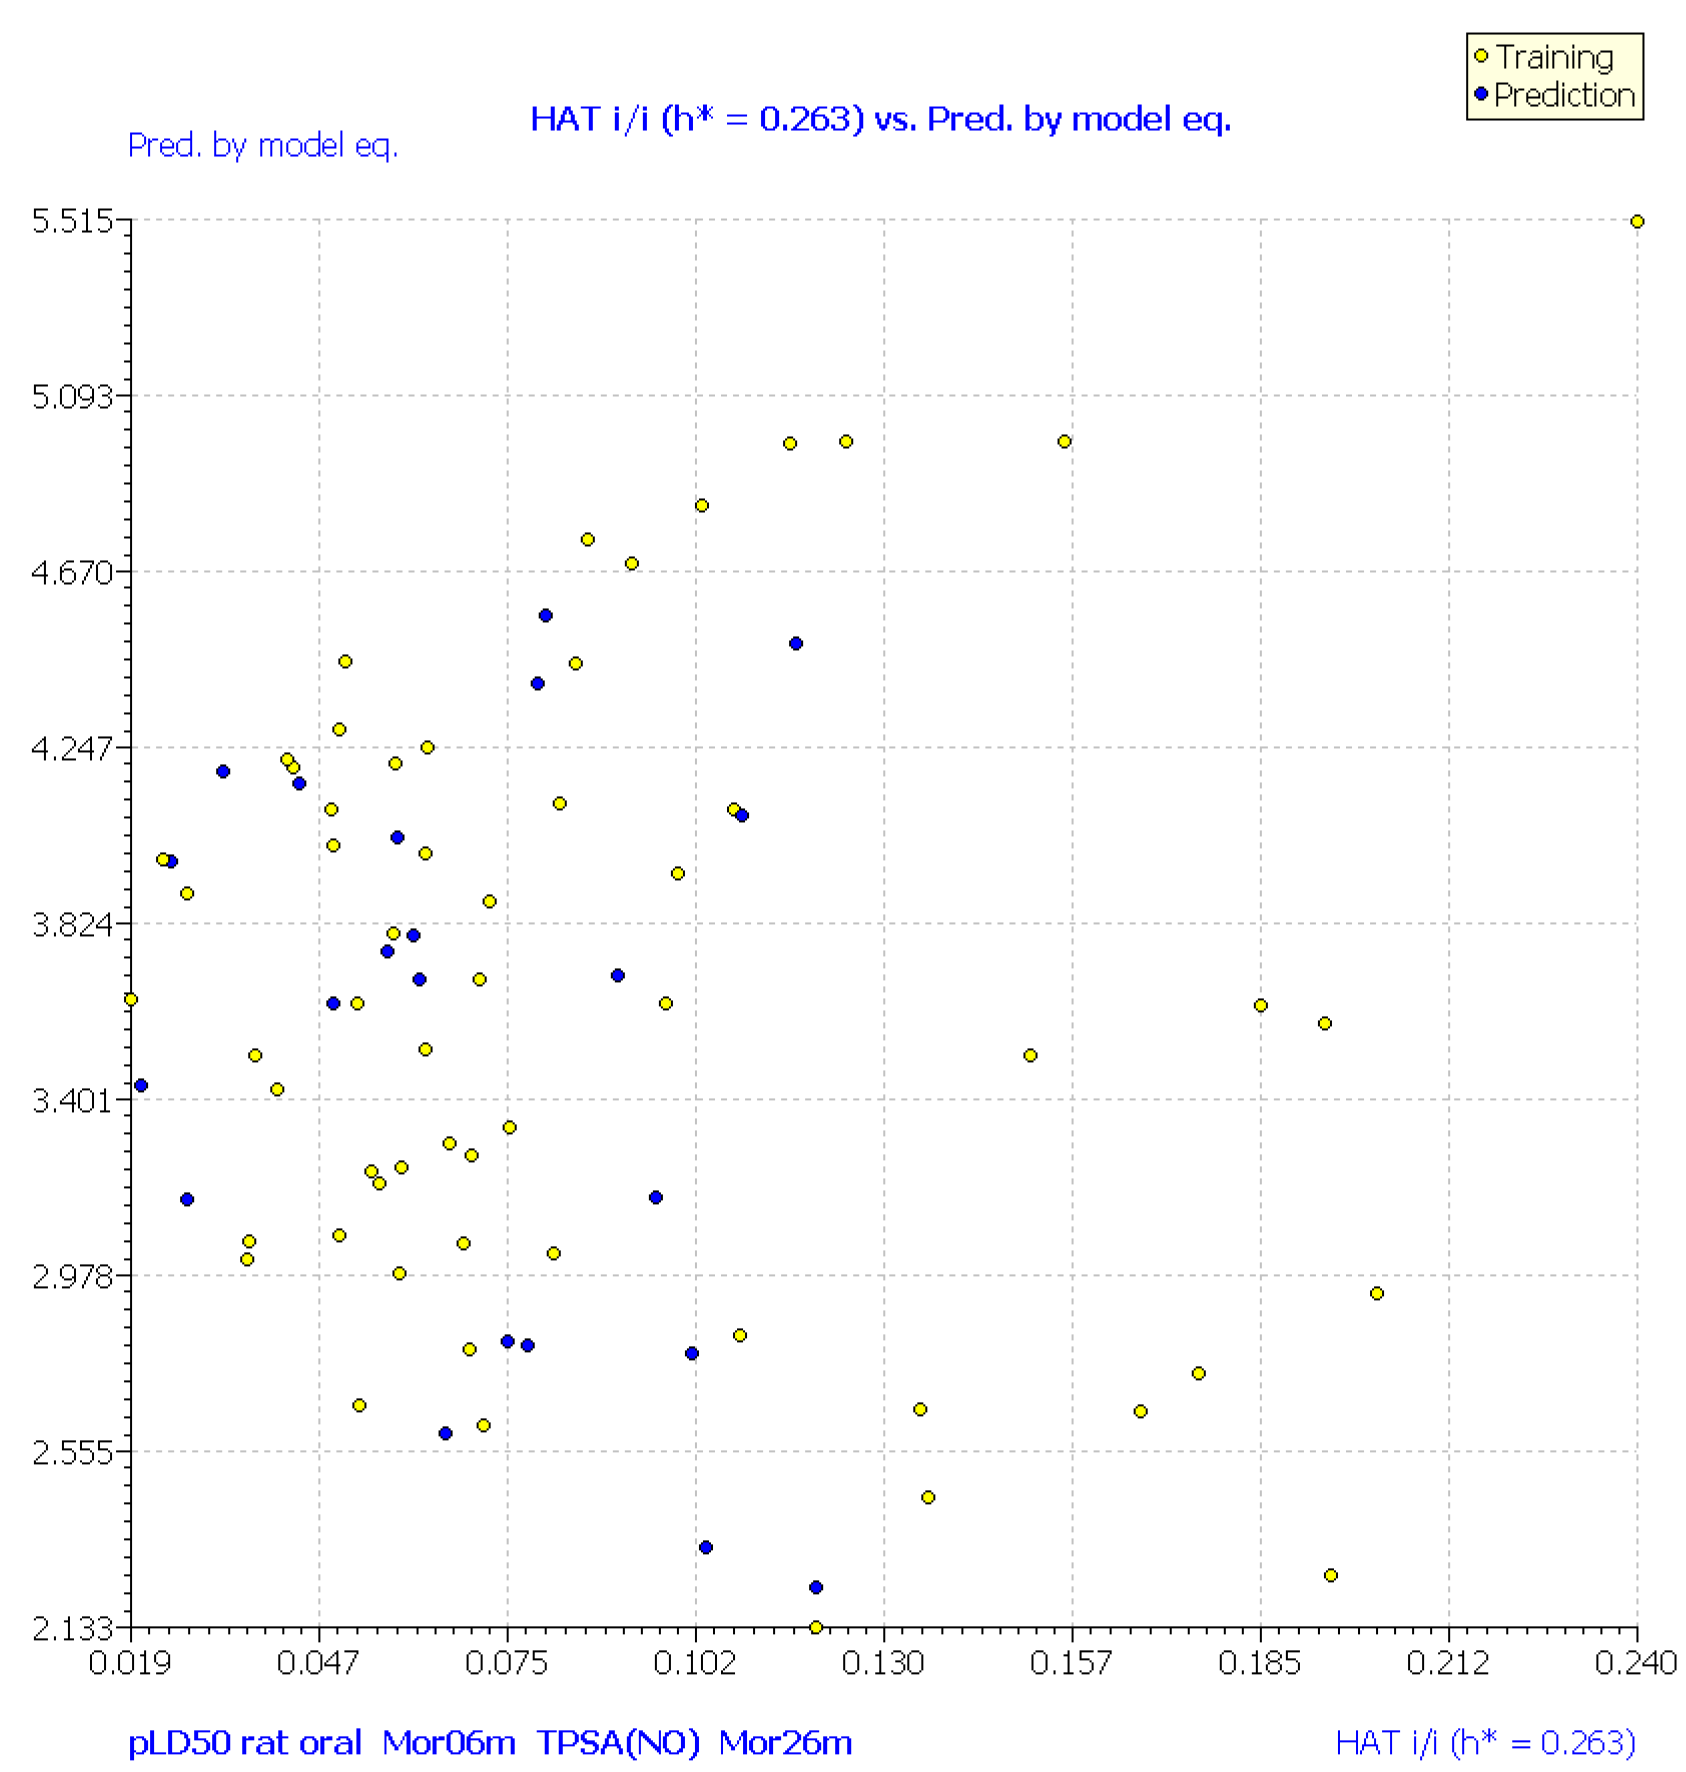
| No. | Structure | Experimental pLD50 (Oral Mouse, mole/kg) | Experimental pLD50 (Oral Rat, mole/kg) | CAS | Predicted pLD50 (Oral Mouse, MLR1) | Mor06m | TPSA(NO) | Mor26m |
|---|---|---|---|---|---|---|---|---|
| 1 * |  | 2.90 | 2.42 | 30560-19-1 | 2.82 | 1.069 | 55.4 | 0.119 |
| 2 | 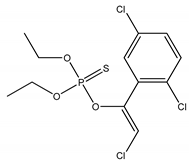 | 3.63 | 3.95 | 1757-18-2 | 3.64 | 4.117 | 27.69 | −0.127 |
| 3 * | 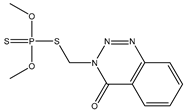 | 4.57 | 4.66 | 86-50-0 | 4.50 | 0.635 | 66.24 | −0.415 |
| 4 | 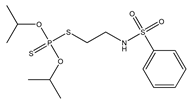 | 2.41 | 3.17 | 741-58-2 | 3.03 | 3.657 | 64.63 | −0.574 |
| 5 * |  | 2.11 | 2.36 | 2104-96-3 | 2.33 | 2.746 | 27.69 | −0.412 |
| 6 | 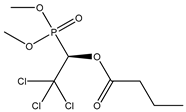 | 2.63 | 2.47 | 126-22-7 | 2.66 | 5.226 | 61.83 | 0.198 |
| 7 | 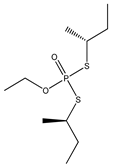 | 3.58 | 3.86 | 95465-99-9 | 3.95 | 0.352 | 26.3 | 0.242 |
| 8 ** |  | 3.20 | 4.70 | 786-19-6 | 1.971 | 18.46 | −0.202 | |
| 9 | 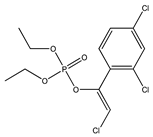 | 3.74 | 4.56 | 470-90-6 | 4.20 | 3.927 | 44.76 | −0.171 |
| 10 | 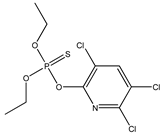 | 3.77 | 3.63 | 2921-88-2 | 3.34 | 5.254 | 40.58 | −0.2 |
| 11 * |  | 2.20 | 2.25 | 5598-13-0 | 2.23 | 4.958 | 40.58 | −0.215 |
| 12 * |  | 4.11 | 4.45 | 56-72-4 | 4.16 | 3.3 | 57.9 | −0.297 |
| 13 |  | 3.90 | 3.91 | 7700-17-6 | 4.01 | 1.554 | 71.06 | −0.032 |
| 14 * |  | 2.53 | 3.05 | 2636-26-2 | 3.16 | 2.025 | 51.48 | −0.119 |
| 15 |  | 3.61 | 3.32 | 78-48-8 | 3.59 | −0.997 | 17.07 | 0.328 |
| 16 |  | 4.52 | 5.18 | 8065-48-3 | 4.98 | 2.493 | 35.53 | 0.413 |
| 17 |  | 3.95 | 3.49 | 8022-00-2 | 3.63 | 2.357 | 35.53 | 0.44 |
| 18 | 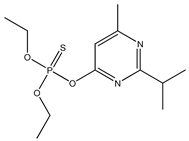 | 4.25 | 3.66 | 333-41-5 | 3.64 | 2.779 | 53.47 | −0.046 |
| 19 |  | 2.95 | 3.02 | 2463-84-5 | 3.06 | 2.854 | 73.51 | −0.452 |
| 20 |  | 3.56 | 4.11 | 62-73-7 | 3.80 | 4.86 | 44.76 | −0.117 |
| 21 |  | 4.33 | 4.26 | 141-66-2 | 4.25 | 3.276 | 65.07 | 0.206 |
| 22 |  | 3.58 | 3.06 | 60-51-5 | 3.27 | 0.159 | 47.56 | −0.115 |
| 23 * |  | 3.41 | 4.36 | 78-34-2 | 4.19 | 2.259 | 55.38 | −0.185 |
| 24 |  | 4.76 | 5.02 | 298-04-4 | 4.69 | 1.296 | 18.46 | 0.006 |
| 25 |  | 4.42 | 4.66 | 2104-64-5 | 4.45 | 1.519 | 64.28 | −0.386 |
| 26 |  | 1.70 | 1.63 | 16672-87-0 | 2.13 | 2.265 | 57.53 | 0.155 |
| 27 |  | 3.98 | 4.47 | 563-12-2 | 4.21 | 1.299 | 36.92 | −0.312 |
| 28 |  | 2.83 | 2.21 | 38260-54-7 | 2.62 | 1.709 | 62.7 | 0.046 |
| 29 |  | 4.53 | 4.53 | 52-85-7 | 4.10 | 4.272 | 65.07 | −0.572 |
| 30 | 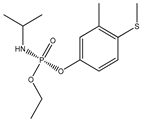 | 4.13 | 4.58 | 22224-92-6 | 4.22 | 3.577 | 47.56 | −0.254 |
| 31 |  | 3.08 | 3.04 | 122-14-5 | 3.23 | 1.626 | 73.51 | −0.253 |
| 32 |  | 3.50 | 3.19 | 55-38-9 | 3.24 | 2.117 | 27.69 | 0.107 |
| 33 * |  | 4.25 | 4.36 | 944-22-9 | 4.09 | 0.675 | 9.23 | −0.163 |
| 34 |  | 3.49 | 3.01 | 2540-82-1 | 3.20 | 0.689 | 55.84 | −0.205 |
| 35 * |  | 3.49 | 3.70 | 98886-44-3 | 3.76 | 2.941 | 46.61 | 0.29 |
| 36 |  | 2.64 | 2.05 | 77182-82-2 | 2.75 | 1.614 | 103.45 | 0.203 |
| 37 | 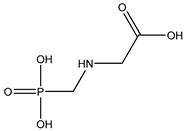 | 2.14 | 1.54 | 1071-83-6 | 2.26 | 1.958 | 106.86 | 0.012 |
| 38 * | 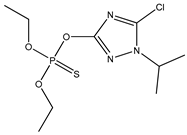 | 3.97 | 4.07 | 42509-80-8 | 3.97 | 2.877 | 58.4 | −0.074 |
| 39 | 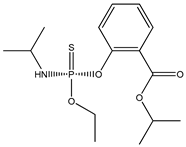 | 3.58 | 4.21 | 25311-71-1 | 3.88 | 3.176 | 56.79 | −0.558 |
| 40 | 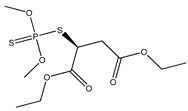 | 3.24 | 2.44 | 121-75-5 | 2.84 | 0.065 | 71.06 | −0.251 |
| 41 |  | 4.39 | 4.48 | 950-10-7 | 4.11 | 5.281 | 47.89 | −0.04 |
| 42 |  | 4.00 | 4.27 | 10265-92-6 | 4.29 | 1.373 | 52.32 | 0.133 |
| 43 | 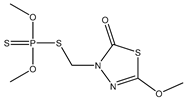 | 4.08 | 4.18 | 950-37-8 | 4.10 | 1.539 | 62.58 | −0.26 |
| 44 * |  | 4.17 | 4.64 | 298-00-0 | 4.57 | 1.592 | 73.51 | −0.142 |
| 45 |  | 3.45 | 3.45 | 953-17-3 | 3.30 | 1.83 | 18.46 | −0.227 |
| 46 | 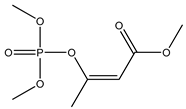 | 4.75 | 4.87 | 7786-34-7 | 4.75 | 3.042 | 71.06 | 0.115 |
| 47 * |  | 4.17 | 4.45 | 6923-22-4 | 4.40 | 3.444 | 73.86 | 0.151 |
| 48 |  | 3.23 | 3.62 | 300-76-5 | 3.43 | 2.549 | 44.76 | −0.431 |
| 49 * |  | 4.05 | 3.85 | 1113-02-6 | 4.03 | 1.321 | 64.63 | 0.187 |
| 50 |  | 4.39 | 3.91 | 301-12-2 | 4.00 | 2.645 | 52.6 | 0.327 |
| 51 | 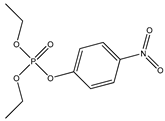 | 5.56 | 5.18 | 311-45-5 | 4.98 | 3.204 | 90.58 | −0.132 |
| 52 ** | 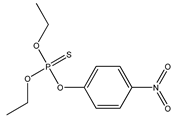 | 3.13 | 5.16 | 56-38-2 | 1.716 | 73.51 | −0.178 | |
| 53 * |  | 3.37 | 3.65 | 2597-03-7 | 3.63 | 0.859 | 44.76 | −0.27 |
| 54 |  | 5.06 | 5.42 | 298-02-2 | 4.98 | 1.123 | 18.46 | −0.092 |
| 55 |  | 3.70 | 3.64 | 2310-17-0 | 3.51 | 0.394 | 53.6 | −0.728 |
| 56 | 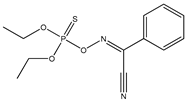 | 2.89 | 3.31 | 115-78-6 | 2.94 | 5.51 | 0 | −0.023 |
| 57 * | 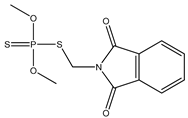 | 4.09 | 3.54 | 732-11-6 | 3.70 | −0.344 | 57.53 | −0.204 |
| 58 |  | 4.70 | 4.57 | 13171-21-6 | 4.45 | 2.695 | 65.07 | −0.006 |
| 59 | 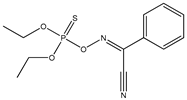 | 2.45 | 3.00 | 14816-18-3 | 3.08 | 1.994 | 63.84 | −0.376 |
| 60 |  | 3.03 | 3.04 | 24151-93-7 | 3.06 | 2.041 | 38.77 | −0.191 |
| 61 * | 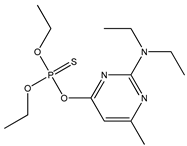 | 3.50 | 3.38 | 23505-41-1 | 3.44 | 2.436 | 56.71 | −0.074 |
| 62 |  | 2.41 | 2.39 | 29232-93-7 | 2.67 | 2.257 | 56.71 | −0.034 |
| 63 |  | 3.36 | 3.02 | 41198-08-7 | 2.99 | 3.894 | 35.53 | 0.002 |
| 64 | 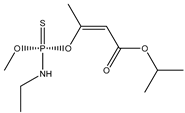 | 3.76 | 3.65 | 31218-83-4 | 3.51 | 2.805 | 56.79 | −0.401 |
| 65 | 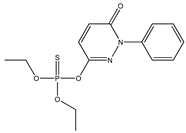 | 3.16 | 2.90 | 119-12-0 | 3.02 | 2.433 | 62.58 | −0.244 |
| 66 | 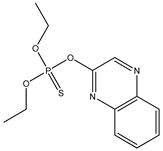 | 3.60 | 4.06 | 13593-03-8 | 3.98 | 2.744 | 53.47 | −0.003 |
| 67 |  | 2.21 | 2.71 | 299-84-3 | 2.45 | 3.929 | 27.69 | −0.645 |
| 68 | 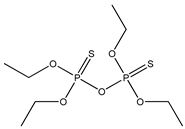 | 4.17 | 4.11 | 3689-24-5 | 3.90 | 3.596 | 46.15 | −0.094 |
| 69 | 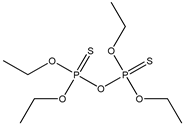 | 2.82 | 3.70 | 35400-43-2 | 3.52 | 1.671 | 18.46 | −0.186 |
| 70 |  | 3.32 | 2.67 | 3383-96-8 | 2.80 | 4.163 | 55.38 | 0.058 |
| 71 |  | 4.99 | 5.76 | 107-49-3 | 5.52 | 4.48 | 80.29 | 0.365 |
| 72 |  | 4.92 | 5.26 | 13071-79-9 | 4.83 | 1.284 | 18.46 | −0.124 |
| 73 | 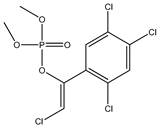 | 2.42 | 2.88 | 22248-79-9 | 2.65 | 6.699 | 44.76 | −0.215 |
| 74 |  | 3.82 | 3.79 | 640-15-3 | 3.69 | 1.159 | 18.46 | −0.027 |
| 75 * |  | 2.93 | 2.76 | 52-68-6 | 2.79 | 5.269 | 55.76 | 0.034 |
| 76 |  | 3.92 | 4.35 | 327-98-0 | 3.63 | 4.043 | 18.46 | −0.859 |
| 77 *** | 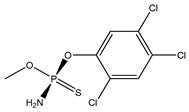 | - | 2.64 | 2591-66-4 | 2.60 | 3.29 | 44.48 | −0.41 |
| 78 *** |  | - | 3.03 | 2633-54-7 | 2.81 | 3.767 | 27.69 | −0.393 |
| 79 *** |  | - | 3.50 | 5745-14-2 | 3.17 | 3.196 | 9.23 | −0.325 |
| 80 *** | 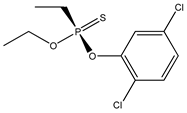 | - | 4.20 | 7260-35-7 | 3.80 | 3.435 | 18.46 | −0.219 |
| 81 *** |  | - | 4.08 | 1593-27-7 | 3.69 | 3.065 | 18.46 | −0.303 |
| Model | RMSEtr | MAEtr | CCCtr | SEE | F | ||||||
|---|---|---|---|---|---|---|---|---|---|---|---|
| MLR1 | 0.850 | 0.819 | 0.810 | 0.839 | 0.316 | 0.260 | 0.919 | 0.072 | −0.119 | 0.33 | 73.93 |
| MLR2 | 0.833 | 0.811 | 0.805 | 0.823 | 0.334 | 0.272 | 0.909 | 0.053 | −0.098 | 0.35 | 87.86 |
| MLR3 | 0.820 | 0.801 | 0.795 | 0.814 | 0.346 | 0.284 | 0.901 | 0.035 | −0.076 | 0.36 | 123.20 |
| MLR4 | 0.800 | 0.786 | 0.782 | 0.796 | 0.365 | 0.301 | 0.889 | 0.017 | −0.056 | 0.37 | 219.85 |
| Model | RMSEext | MAEext | CCCext | |||
|---|---|---|---|---|---|---|
| MLR1 | 0.826 | 0.822 | 0.857 | 0.309 | 0.223 | 0.910 |
| MLR2 | 0.814 | 0.810 | 0.847 | 0.319 | 0.238 | 0.904 |
| MLR3 | 0.780 | 0.775 | 0.819 | 0.347 | 0.273 | 0.875 |
| MLR4 | 0.795 | 0.790 | 0.831 | 0.336 | 0.262 | 0.878 |
| Model | MCDM All | Descriptors Included in the MLR Models * | |
|---|---|---|---|
| MLR1 | 0.827 | 0.851 | pLD50 mouse, Mor06m, TPSA(NO), Mor26m |
| MLR2 | 0.851 | 0.842 | pLD50 mouse, Mor06m, TPSA(NO) |
| MLR3 | 0.749 | 0.825 | pLD50 mouse, R4v+ |
| MLR4 | 0.758 | 0.822 | pLD50 mouse |
| pLD50 Rat Oral | Mor06m | TPSA(NO) | Mor26m | Std. Coeff. | |
|---|---|---|---|---|---|
| pLD50 rat oral | 1.0000 | 0.931 | |||
| Mor06m | 0.1866 | 1.0000 | −0.121 | ||
| TPSA(NO) | −0.2652 | −0.0508 | 1.0000 | 0.126 | |
| Mor26m | −0.2929 | −0.3333 | 0.1990 | 1.0000 | 0.134 |
Publisher’s Note: MDPI stays neutral with regard to jurisdictional claims in published maps and institutional affiliations. |
© 2021 by the authors. Licensee MDPI, Basel, Switzerland. This article is an open access article distributed under the terms and conditions of the Creative Commons Attribution (CC BY) license (https://creativecommons.org/licenses/by/4.0/).
Share and Cite
Ilia, G.; Borota, A.; Funar-Timofei, S. Interspecies Quantitative Structure-Toxicity-Toxicity Relationships for Predicting the Acute Toxicity of Organophosphorous Compounds. Chem. Proc. 2022, 8, 32. https://doi.org/10.3390/ecsoc-25-11672
Ilia G, Borota A, Funar-Timofei S. Interspecies Quantitative Structure-Toxicity-Toxicity Relationships for Predicting the Acute Toxicity of Organophosphorous Compounds. Chemistry Proceedings. 2022; 8(1):32. https://doi.org/10.3390/ecsoc-25-11672
Chicago/Turabian StyleIlia, Gheorghe, Ana Borota, and Simona Funar-Timofei. 2022. "Interspecies Quantitative Structure-Toxicity-Toxicity Relationships for Predicting the Acute Toxicity of Organophosphorous Compounds" Chemistry Proceedings 8, no. 1: 32. https://doi.org/10.3390/ecsoc-25-11672
APA StyleIlia, G., Borota, A., & Funar-Timofei, S. (2022). Interspecies Quantitative Structure-Toxicity-Toxicity Relationships for Predicting the Acute Toxicity of Organophosphorous Compounds. Chemistry Proceedings, 8(1), 32. https://doi.org/10.3390/ecsoc-25-11672


