
Hydroponics Monitoring through UV-Vis Spectroscopy and Artificial Intelligence: Quantification of Nitrogen, Phosphorous and Potassium †

 ,
,  ,
,  ,
,  and
and 
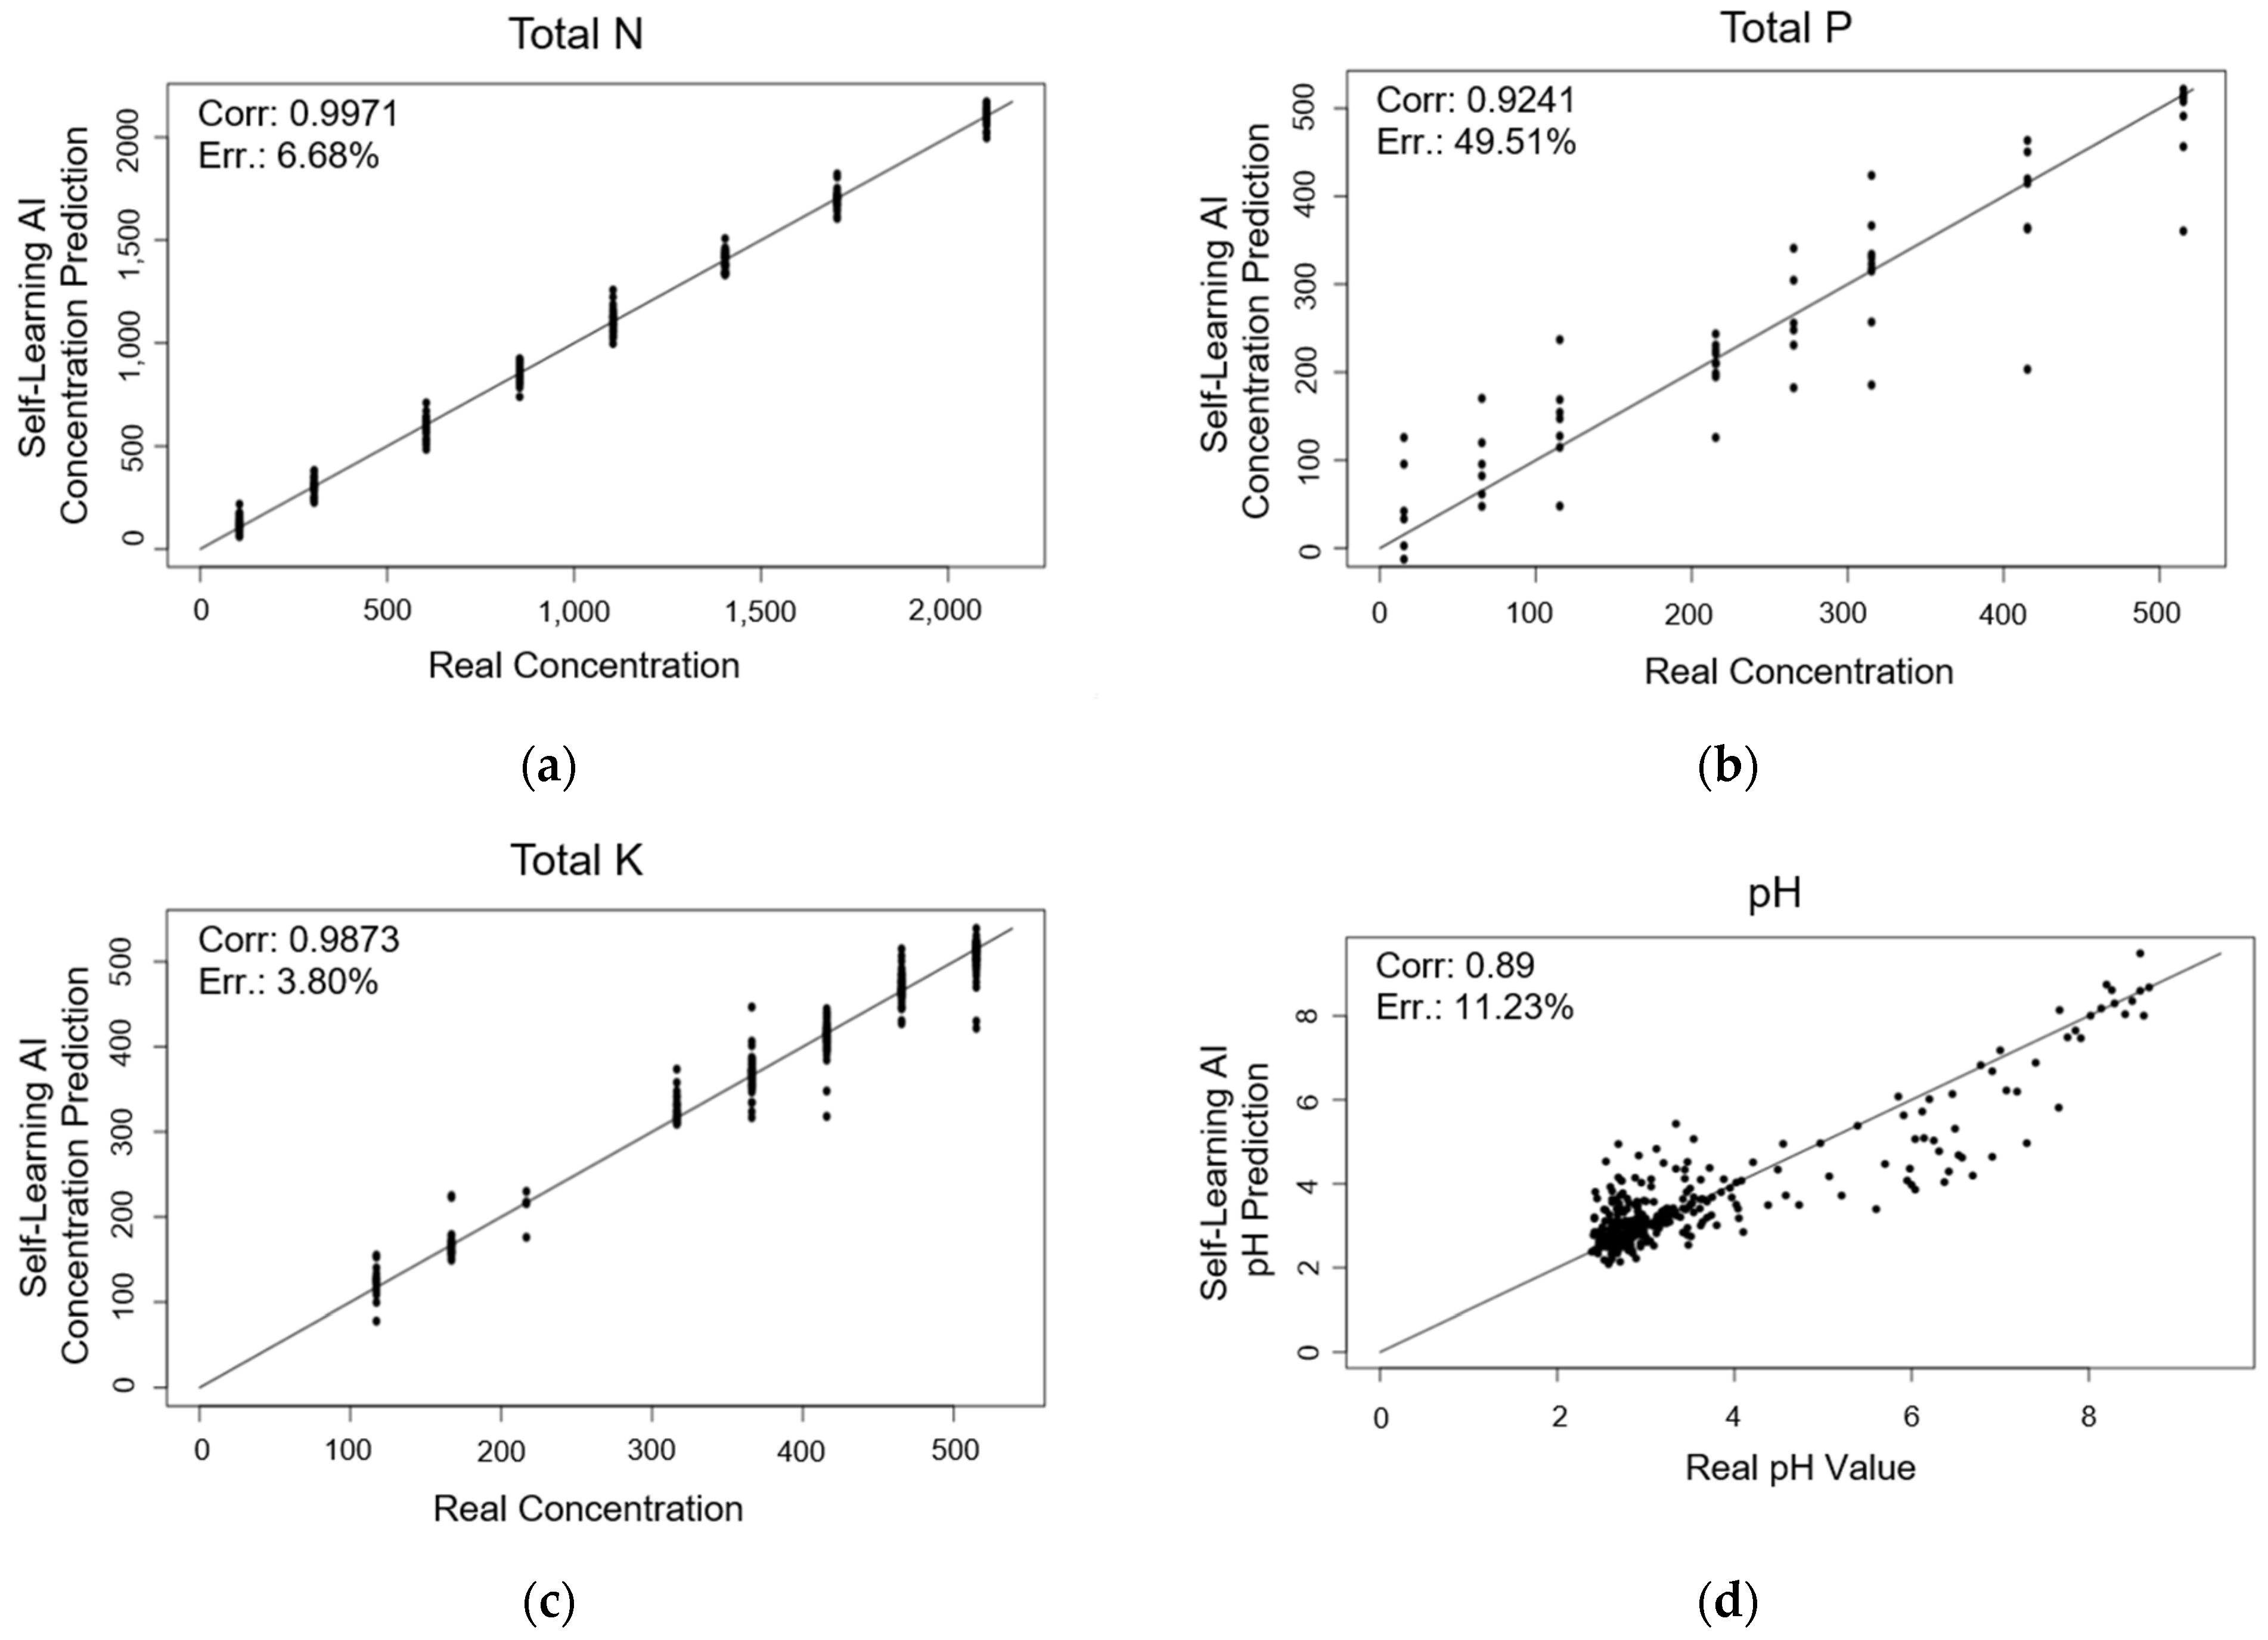
Abstract
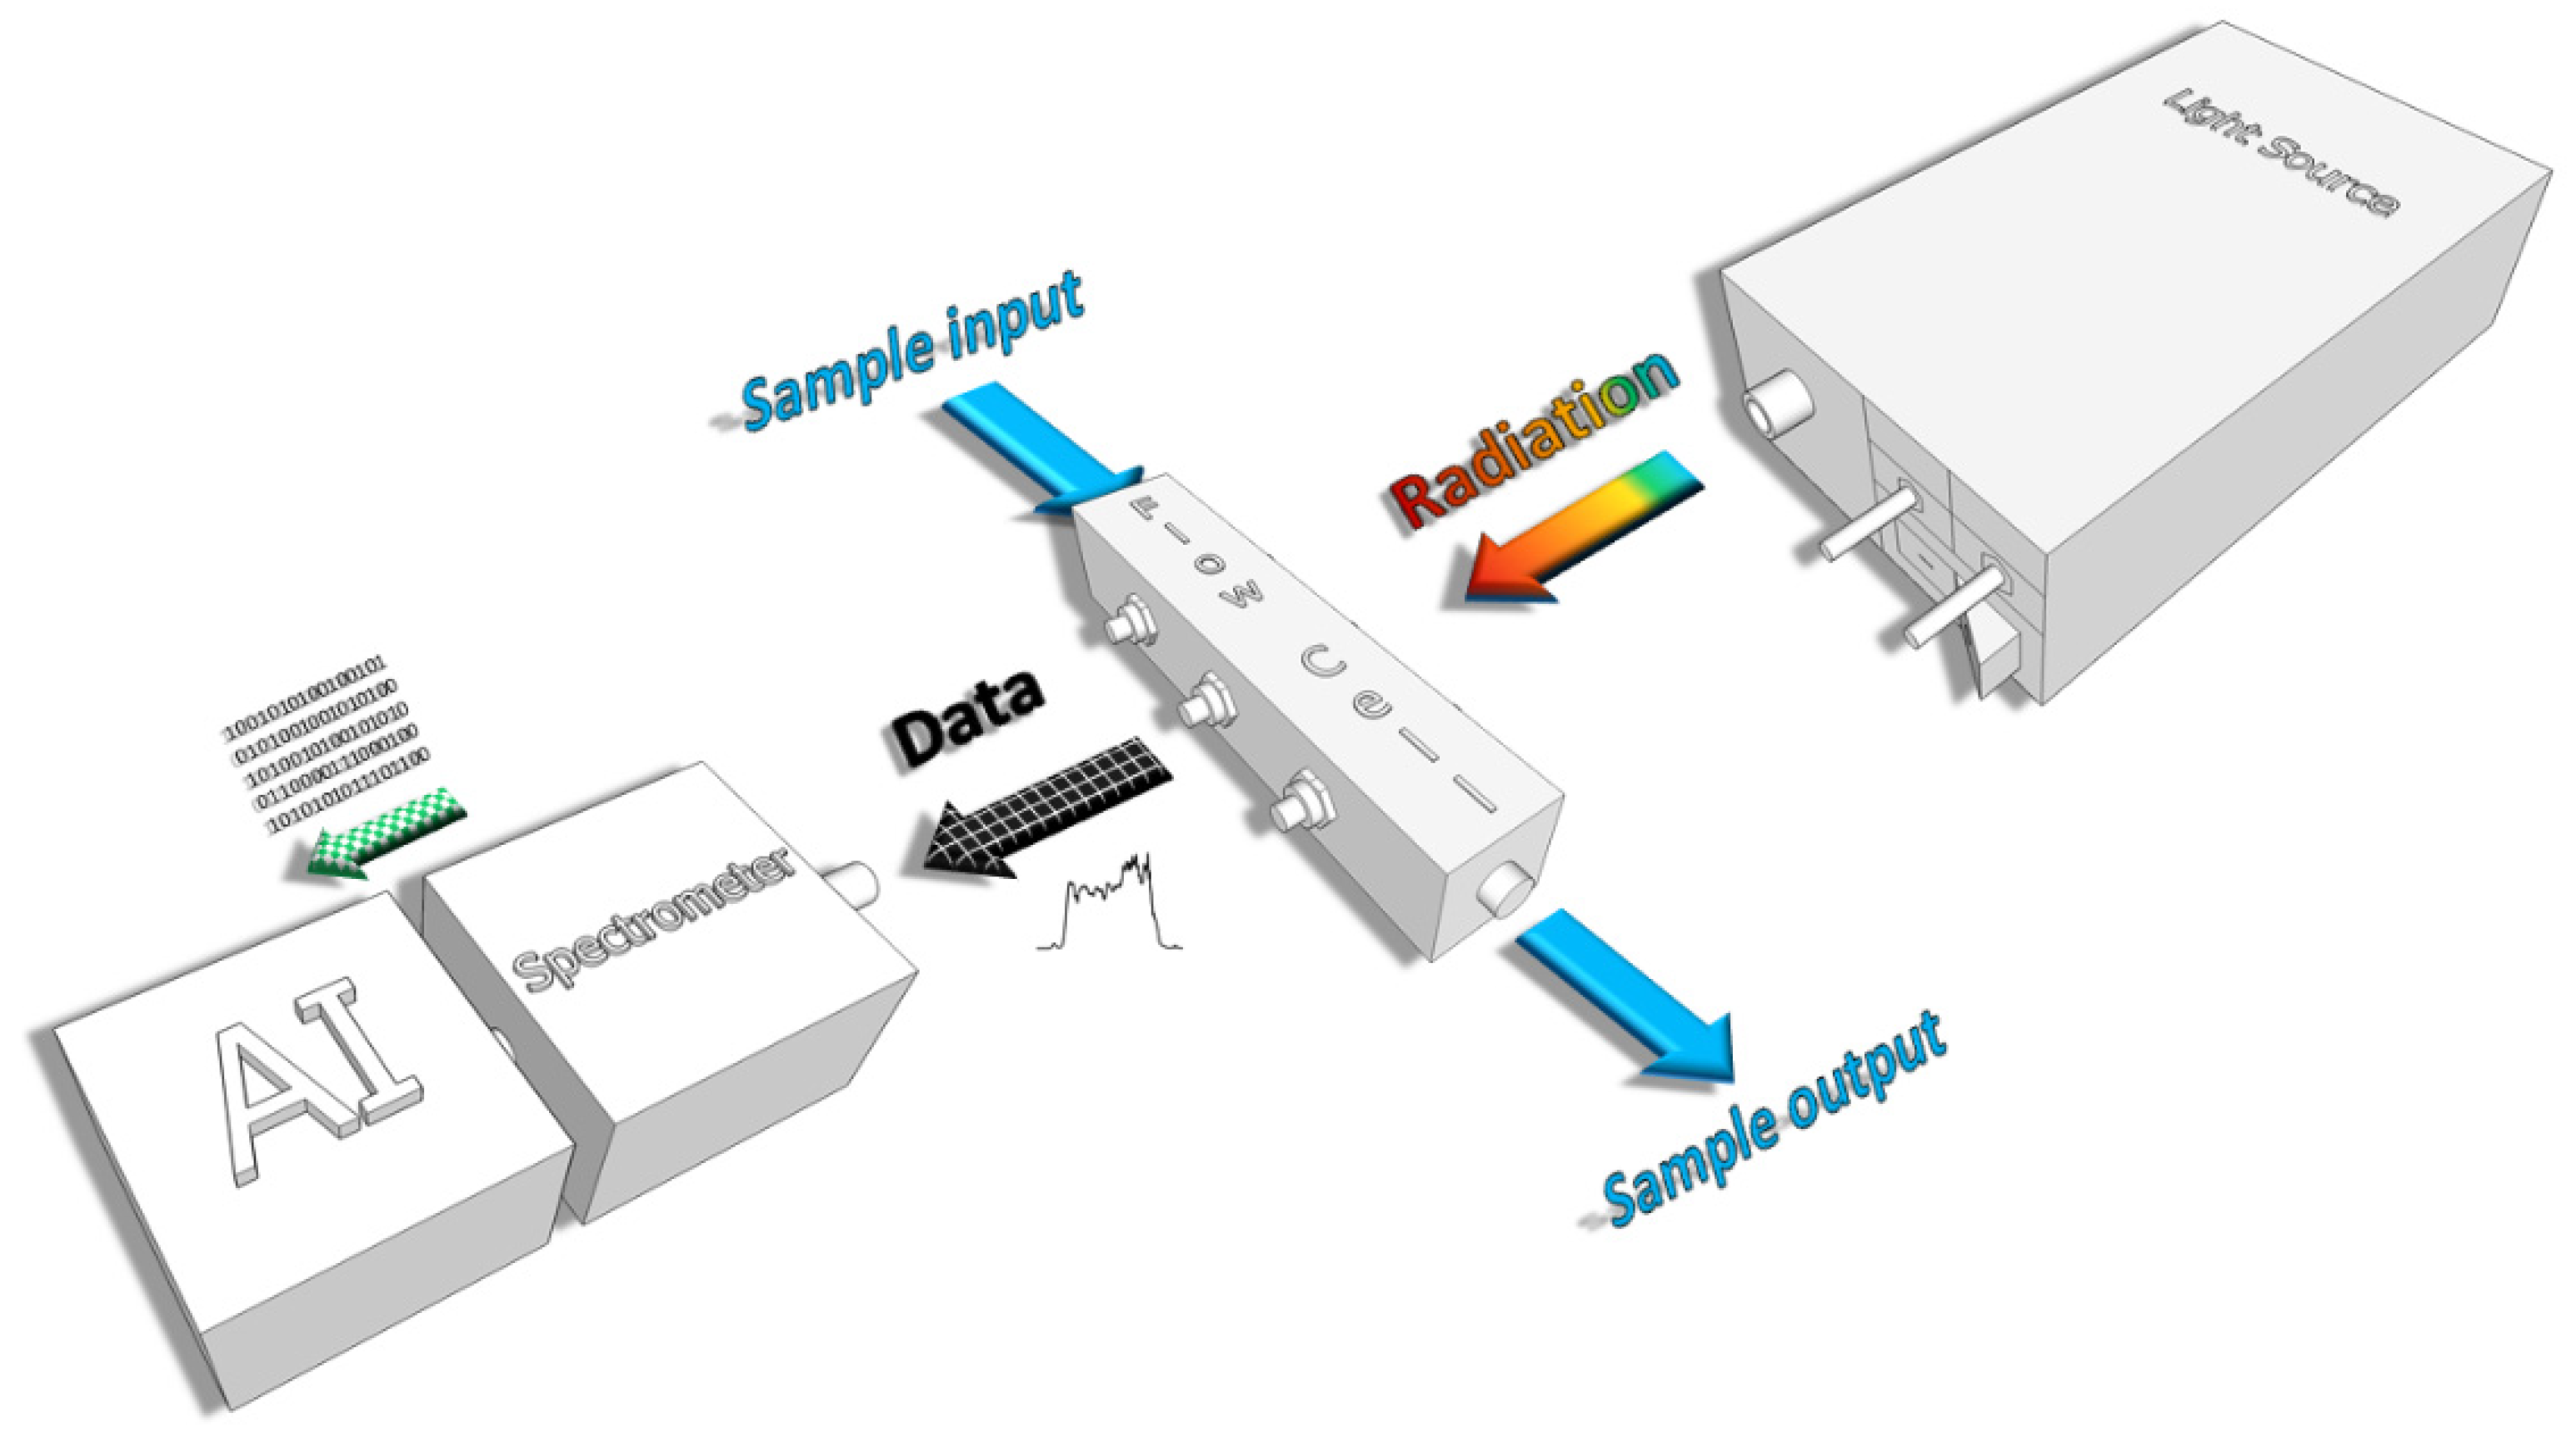
:1. Introduction
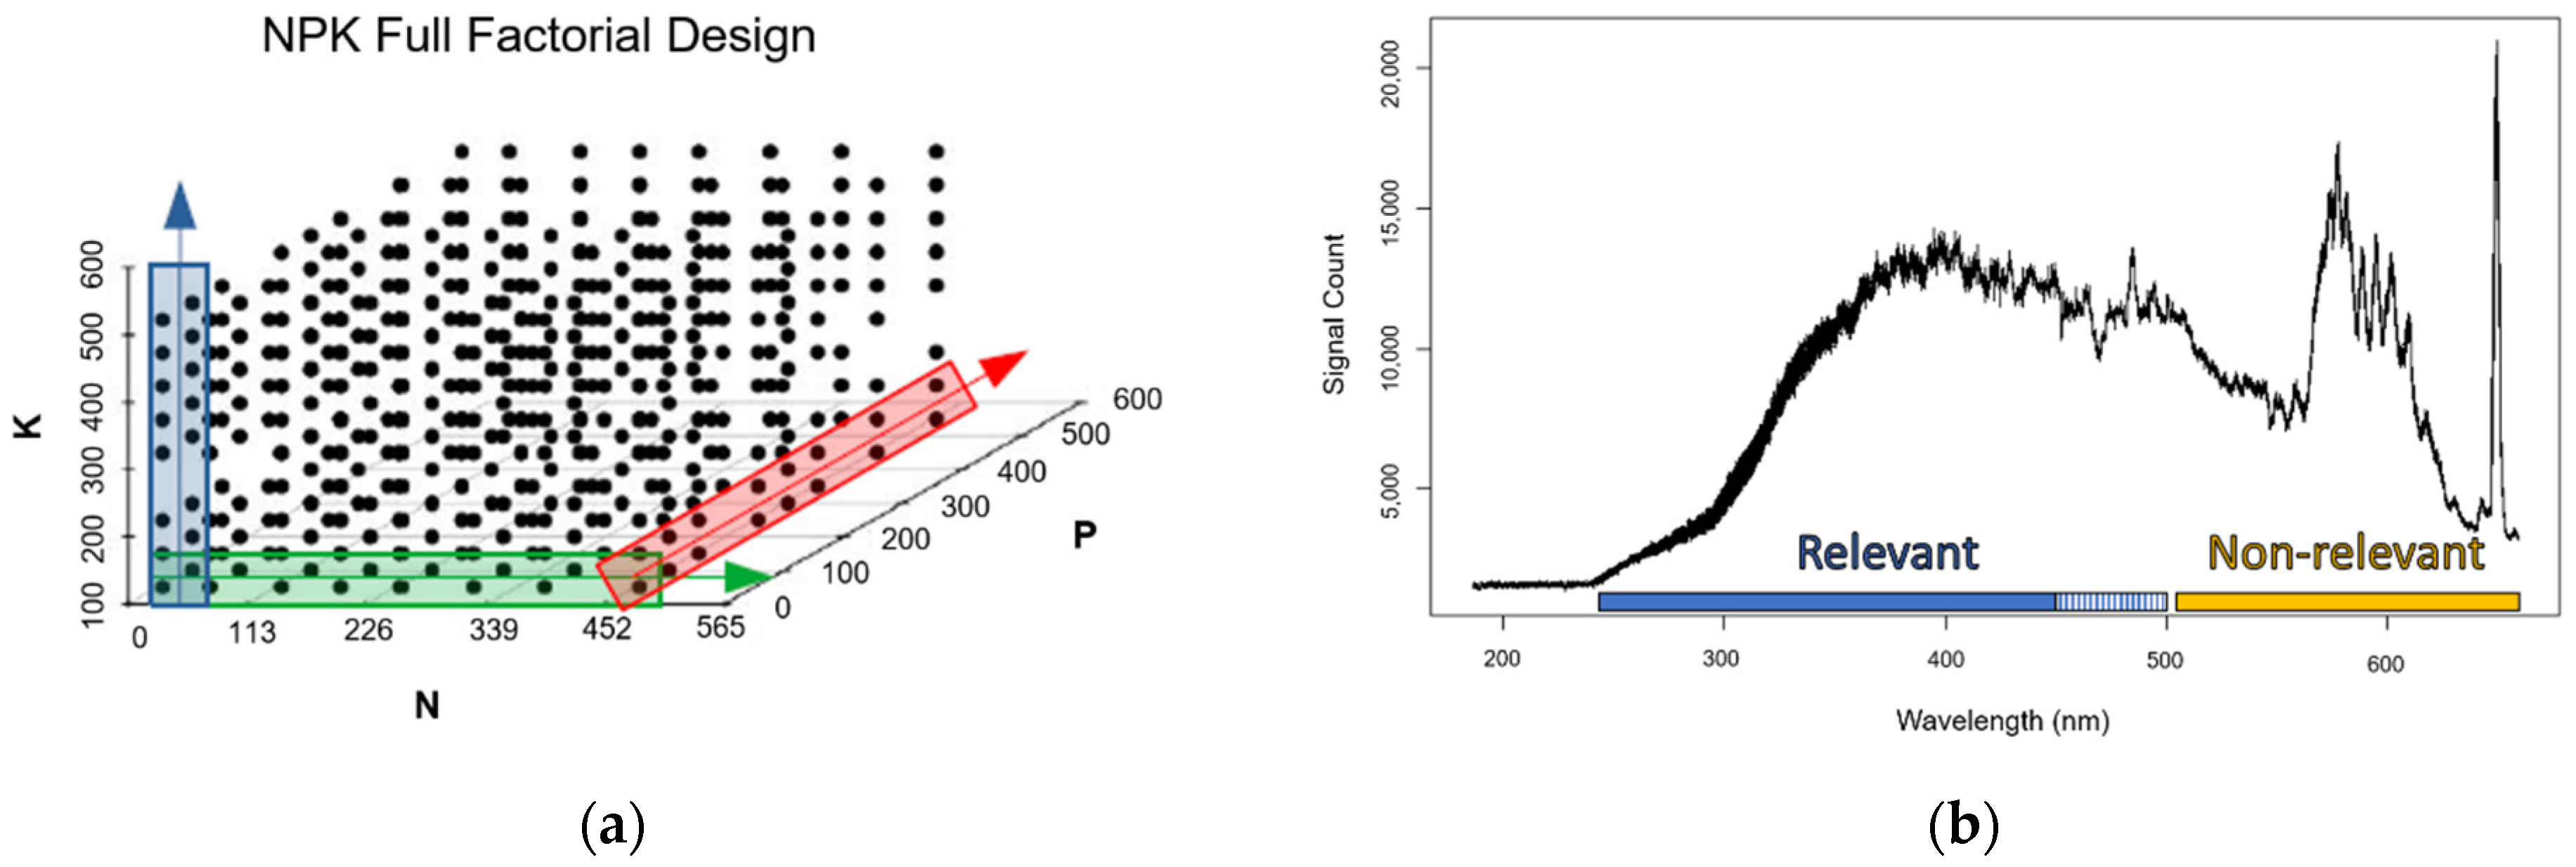
2. Materials and Methods
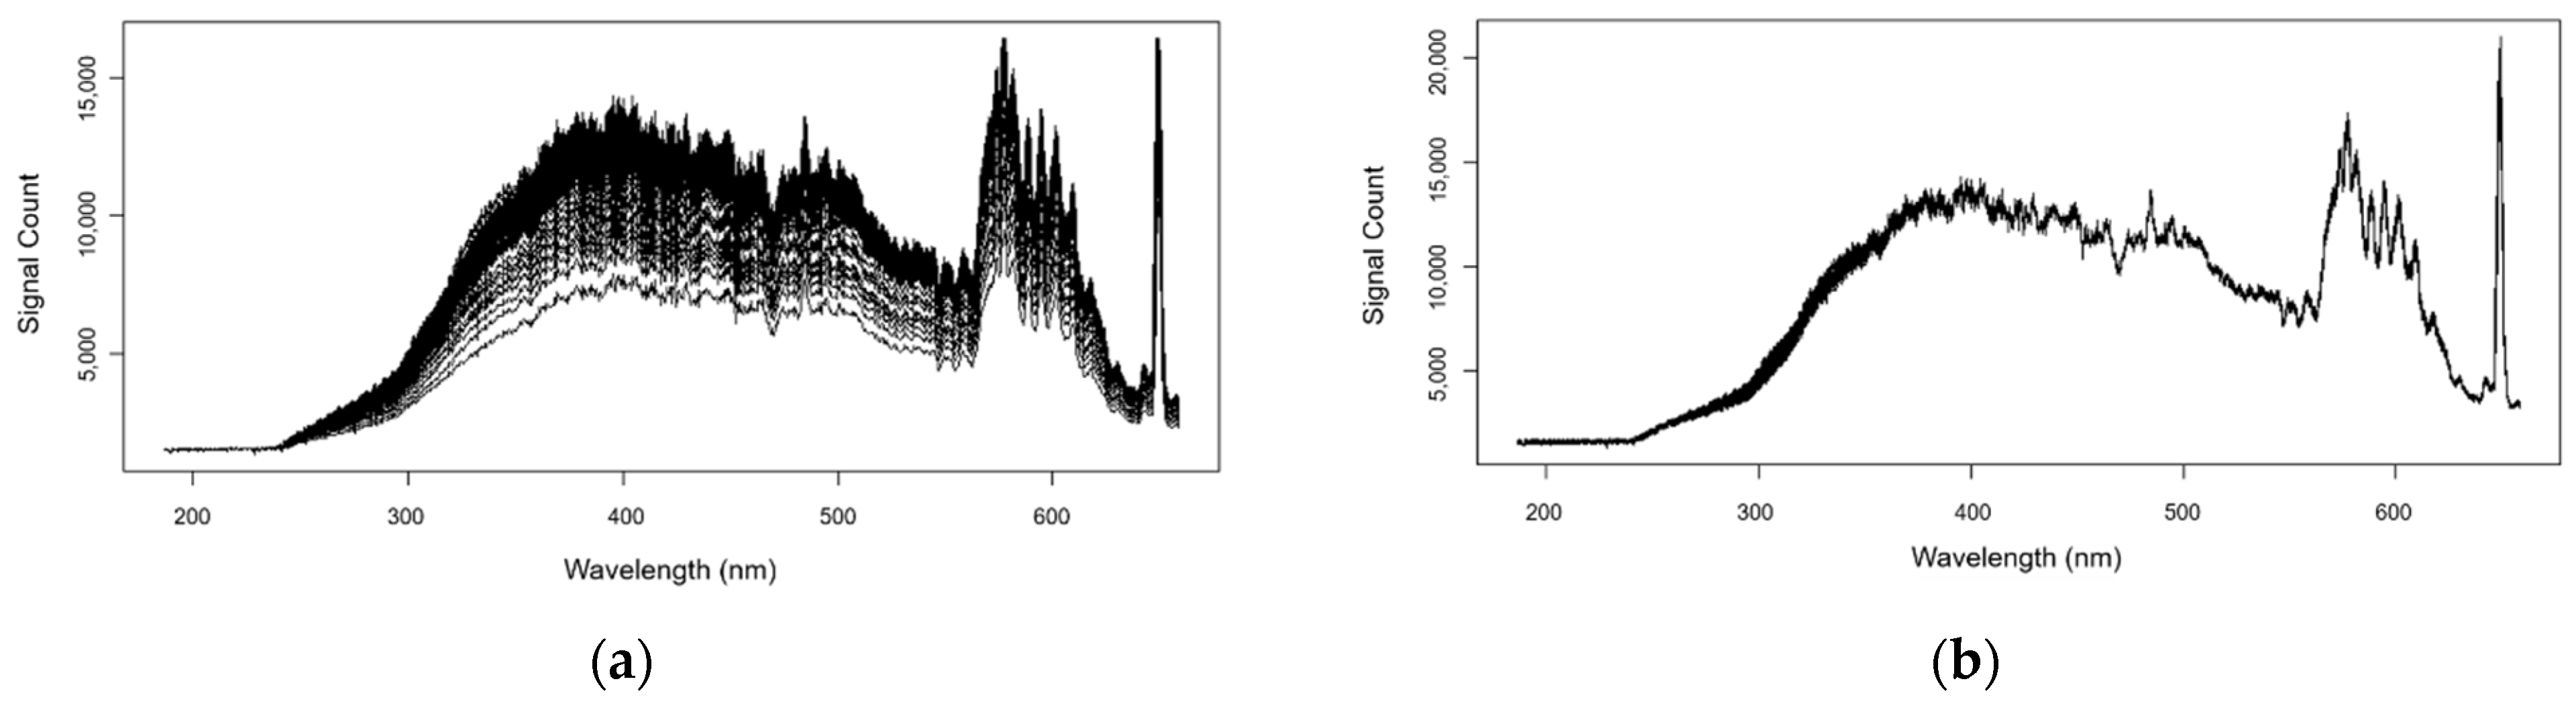
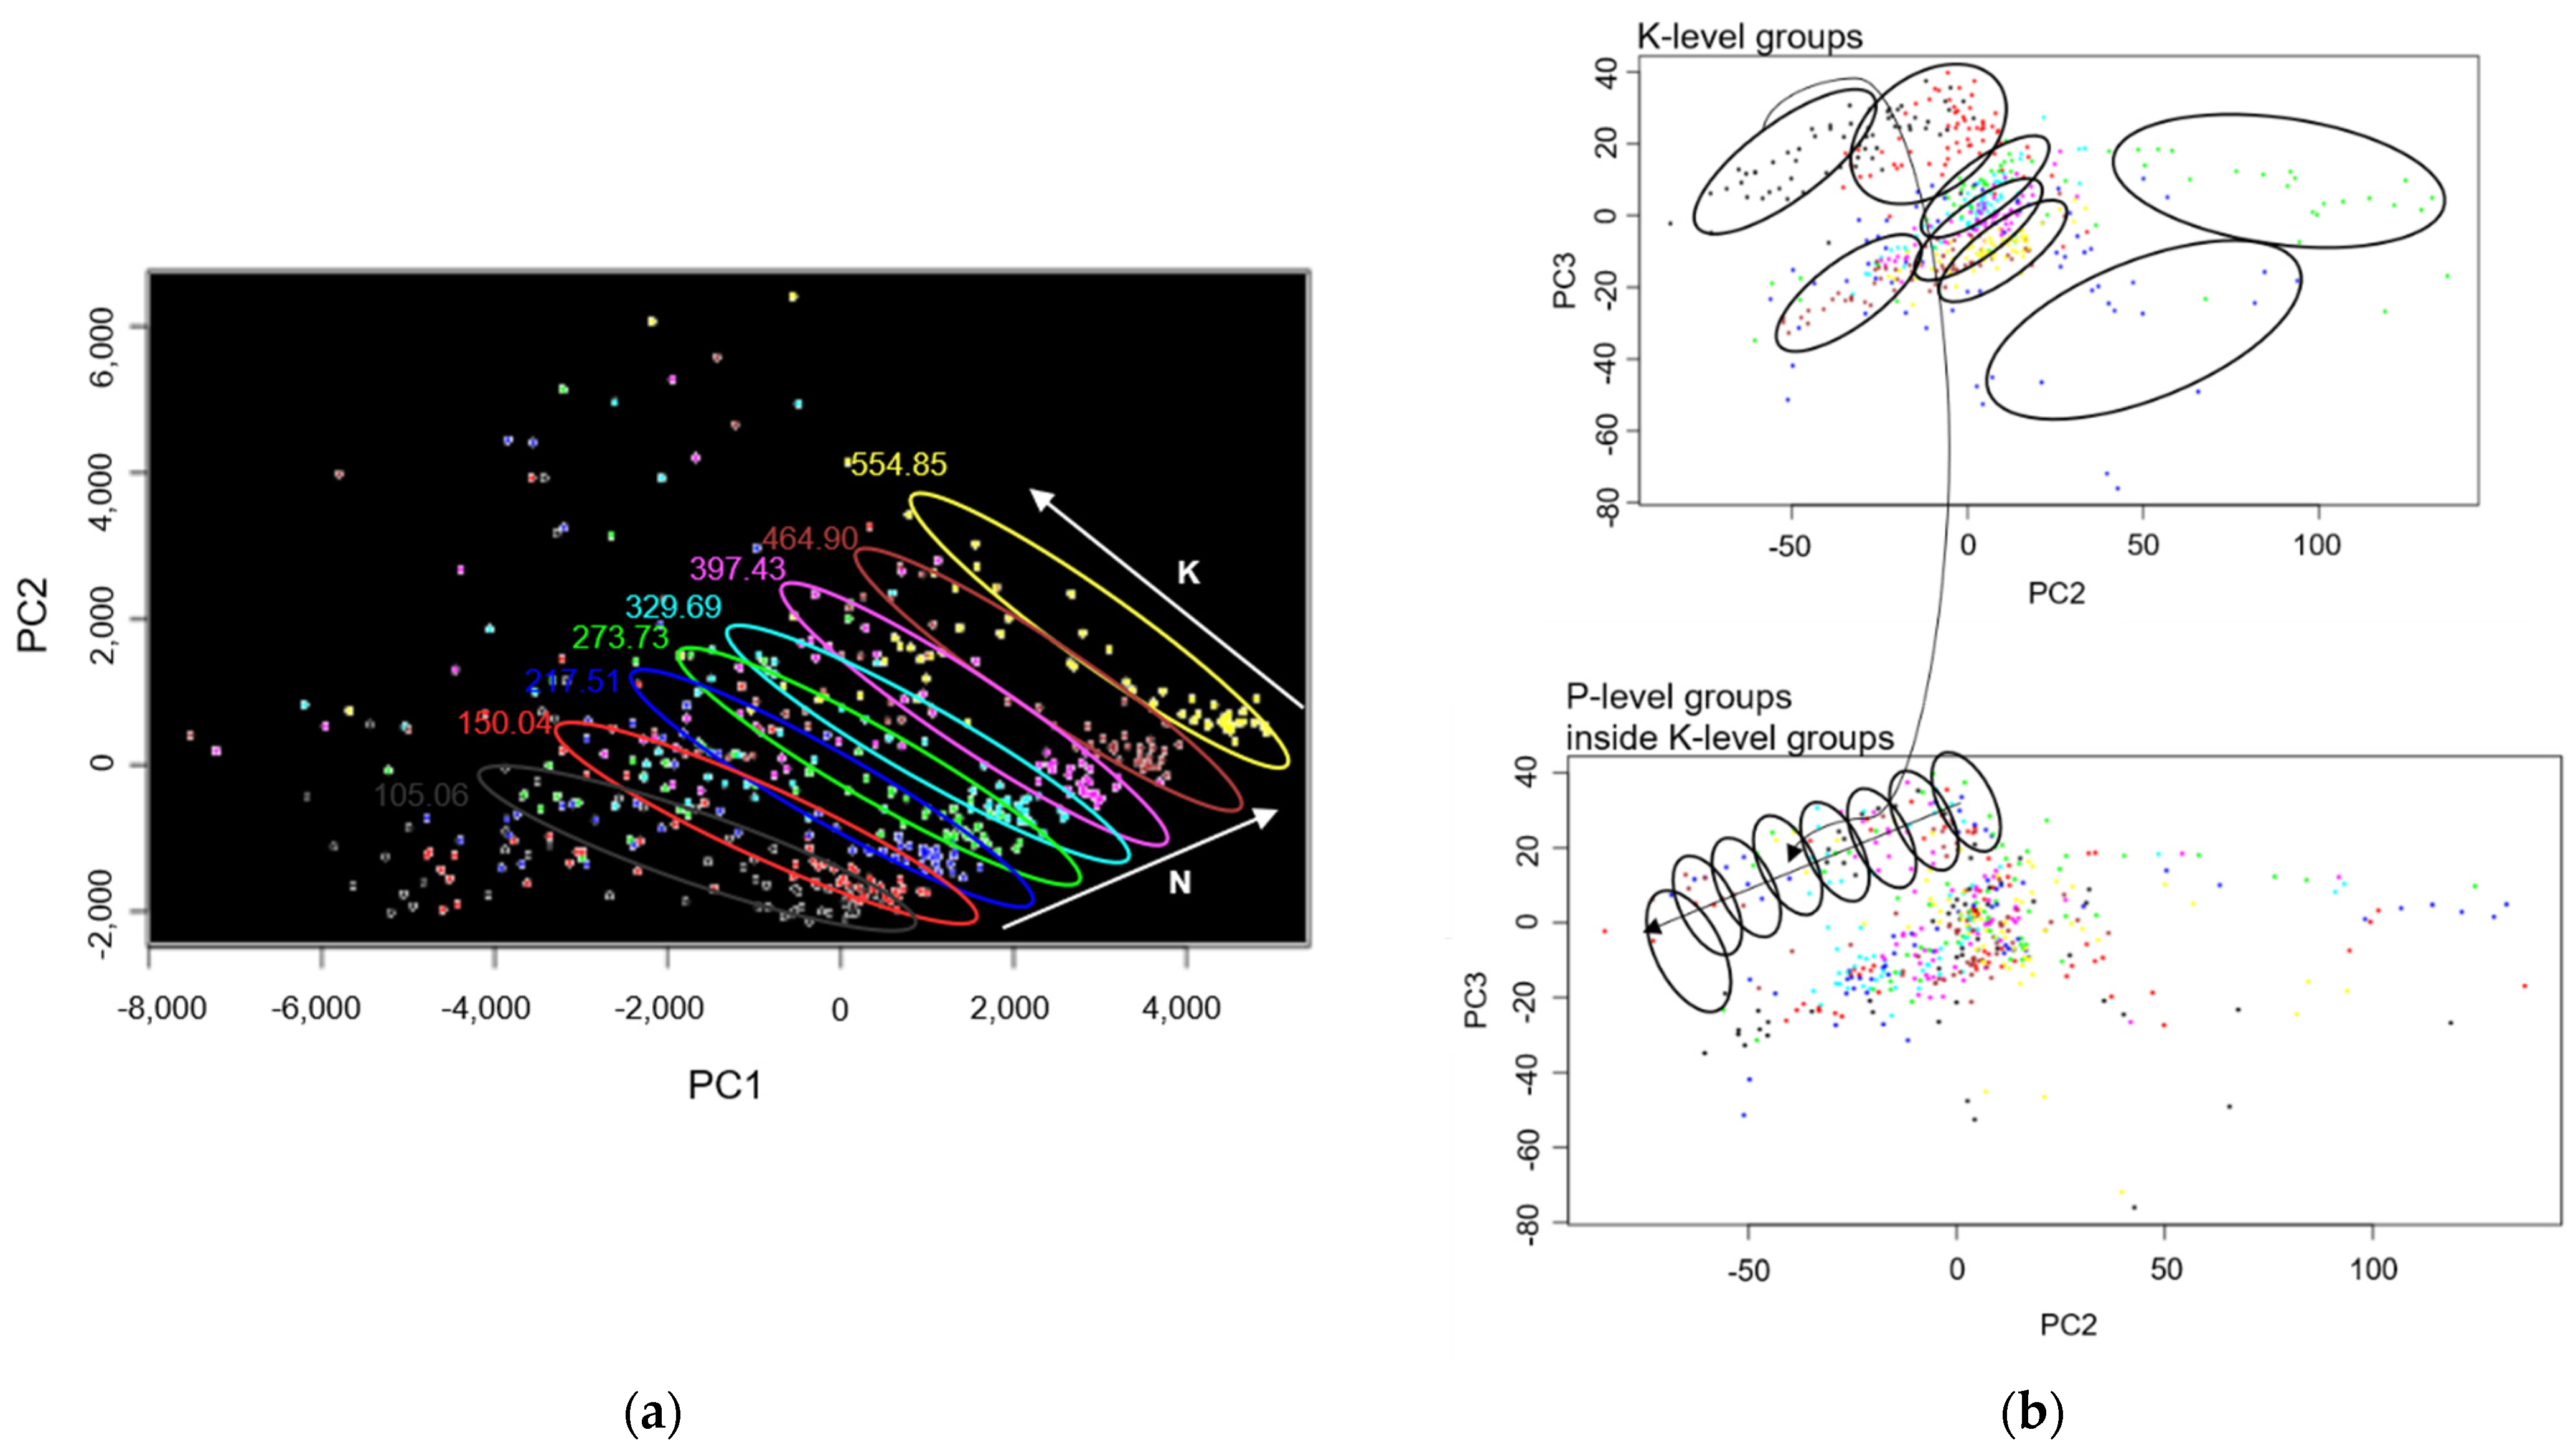
3. Results
4. Conclusions
Author Contributions
Funding
Institutional Review Board Statement
Informed Consent Statement
Data Availability Statement
Conflicts of Interest
References
- FAO. The Future of Food and Agriculture—Trends and Challenges; FAO: Rome, Italy, 2017. [Google Scholar]
- FAO. The Future of Food and Agriculture—Alternative Pathways to 2050; FAO: Rome, Italy, 2018. [Google Scholar]
- United Nations. Transforming Our World: The 2030 Agenda for Sustainable Development; United Nations: San Francisco, CA, USA, 2015. [Google Scholar]
- Lambert, J.H. Photometry, or, on the Measure and Gradations of Light Intensity, Colors, and Shade; Eberhardt Klett: Augsburg, Germany, 1760. [Google Scholar]
- Bouguer, P. Optics Essay on the Attenuation of Light; Claude Jombert: Paris, France, 1729. [Google Scholar]
- Beer, A. Determination of the absorption of red light in colored liquids. Ann. Phys. Chem. 1852, 162, 11. [Google Scholar]
- Martins, R.C. Big Data Self-Learning Artificial Intelligence Methodology for the Accurate Quantification and Classification of Spectral Information under Complex Variability and Multi-Scale Interference. WO Patent WO2018060967, 5 April 2018. [Google Scholar]
- Barroso, T.G.; Ribeiro, L.; Gregório, H.; Santos, F.; Martins, R.C. Point-of-care Vis-SWNIR spectroscopy towards reagent-less hemogram analysis. Sens. Actuators B Chem. 2021, 343, 130138. [Google Scholar] [CrossRef]
- Monteiro-Silva, F.; Jorge, P.A.S.; Martins, R.C. Optical Sensing of Nitrogen, Phosphorus and Potassium: A Spectrophotometrical Approach Toward Smart Nutrient Deployment. Chemosensors 2019, 7, 51. [Google Scholar] [CrossRef] [Green Version]

| Element | Ionic Form | C (ppm) | C (mM) |
|---|---|---|---|
| Macronutrients | |||
| Potassium (K) | K+ | 117.29 | 3.00 |
| Calcium (Ca) | Ca2+ | 80.16 | 2.00 |
| Magnesium (Mg) | Mg2+ | 24.31 | 1.00 |
| Nitrogen (N) | Total N | 105.06 | 7.50 |
| N(NH4+) | 7.01 | 0.50 | |
| N(NO3−) | 98.05 | 7.00 | |
| Phosphorus (P) | Total P (HPO42−; H2PO4) * | 15.49 | 0.50 |
| Sulphur (S) | SO42− | 32.08 | 1.00 |
| Micronutrients | |||
| Chlorine (Cl) | Cl− | 0.324 | 9.15 |
| Boron (B) | BO33- | 0.250 | 23.12 |
| Manganese (Mn) | Mn2+ | 0.251 | 4.57 |
| Zinc (Zn) | Zn2+ | 0.025 | 0.38 |
| Copper (Cu) | Cu2+ | 0.0102 | 0.16 |
| Molybdenum (Mo) | MoO4− | 0.0053 | 0.06 |
| Iron (Fe) | Fe2+; Fe3+ ** | 2.500 | 44.77 |
| Sodium (Na) | Na+ | 1.029 | 44.77 |
| Concentration (ppm) | Concentration (mM) | |||||
|---|---|---|---|---|---|---|
| N | P | K | N | P | K | |
| Minimum | 103.17 | 15.06 | 113.78 | 7.37 | 0.49 | 2.91 |
| Maximum | 554.85 | 515.35 | 516.45 | 39.61 | 16.64 | 13.21 |
Publisher’s Note: MDPI stays neutral with regard to jurisdictional claims in published maps and institutional affiliations. |
© 2021 by the authors. Licensee MDPI, Basel, Switzerland. This article is an open access article distributed under the terms and conditions of the Creative Commons Attribution (CC BY) license (https://creativecommons.org/licenses/by/4.0/).
Share and Cite
Silva, A.F.; Löfkvist, K.; Gilbertsson, M.; Os, E.V.; Franken, G.; Balendonck, J.; Pinho, T.M.; Boaventura-Cunha, J.; Coelho, L.; Jorge, P.; et al. Hydroponics Monitoring through UV-Vis Spectroscopy and Artificial Intelligence: Quantification of Nitrogen, Phosphorous and Potassium. Chem. Proc. 2021, 5, 88. https://doi.org/10.3390/CSAC2021-10448
Silva AF, Löfkvist K, Gilbertsson M, Os EV, Franken G, Balendonck J, Pinho TM, Boaventura-Cunha J, Coelho L, Jorge P, et al. Hydroponics Monitoring through UV-Vis Spectroscopy and Artificial Intelligence: Quantification of Nitrogen, Phosphorous and Potassium. Chemistry Proceedings. 2021; 5(1):88. https://doi.org/10.3390/CSAC2021-10448
Chicago/Turabian StyleSilva, Aníbal Filipe, Klara Löfkvist, Mikael Gilbertsson, Erik Van Os, Geert Franken, Jos Balendonck, Tatiana M. Pinho, José Boaventura-Cunha, Luís Coelho, Pedro Jorge, and et al. 2021. "Hydroponics Monitoring through UV-Vis Spectroscopy and Artificial Intelligence: Quantification of Nitrogen, Phosphorous and Potassium" Chemistry Proceedings 5, no. 1: 88. https://doi.org/10.3390/CSAC2021-10448
APA StyleSilva, A. F., Löfkvist, K., Gilbertsson, M., Os, E. V., Franken, G., Balendonck, J., Pinho, T. M., Boaventura-Cunha, J., Coelho, L., Jorge, P., & Martins, R. C. (2021). Hydroponics Monitoring through UV-Vis Spectroscopy and Artificial Intelligence: Quantification of Nitrogen, Phosphorous and Potassium. Chemistry Proceedings, 5(1), 88. https://doi.org/10.3390/CSAC2021-10448