Abstract
This work demonstrates a hydrogen (H2) sensor at room temperature made of tapered optical fibers coated with a polyaniline (PANI) nanofiber. A transducing platform was constructed using a multimode optical fiber (MMF) with a 125 µm cladding and a 62.5 µm core diameter. In order to enhance the light evanescent field surrounding the fiber, the fibers were tapered from 125 µm in diameter to 20 µm in diameter with 10 mm waist and coated PANI using the drop casting technique. Various characterization techniques, such as field emission scanning electron microscopy (FESEM), energy dispersive X-ray (EDX), differential X-ray (XRD), and atomic force microscopy, have been used to establish the PANI’s properties. When H2 is subtracted, the optical properties of the PANI layer change, resulting in a change in light absorption. The fabricated sensor was tested by exposing it to H2 at different concentration from 0.125% to 1%. In this case, the sensitivity, response, and recovery times were 15.928/vol%, 110 s, and 160 s, respectively. The improved hydrogen sensor holds great promise for environmental and industrial applications due to its ability to operate at room temperature.
1. Introduction
Hydrogen (H2), due to its high fuel efficiency, abundance, uncontaminated character, and sustainability, is one of the possible solutions to the impending energy crisis [1]. It is also a reliable gas for misdiagnosis in power transformers [2,3]. H2 has also been used in other sectors, such as aerospace engineering, mineral refineries, oil exploration, chemical processing, cryogenic refrigeration, and many more [4]. However, the high diffusion coefficient (0.16 cm2/s in air), low ignition energy (0.018 mJ), wide explosion concentration range (4–75%), and high heat of combustion (285.8 kJ/mol) convert them to gases, which are explosive and potentially dangerous for use, transport, and storage [5].
On the other hand, optical sensors rely on optical fibers, which have unique characteristics such as lightness, small size, electromagnetic interference resistance, instability, and stiffness in harsh environments [6]. Due to their peculiar properties, optical fibers are perfect candidates for detection in harsh environments [7].
Recently, the scientific community has made significant progress on the synthesis and application of conducting polymers [8,9,10]. One of the promising materials for gas sensing is polyaniline (PANI), which among polymers has peak environmental stability. It is currently known as the only conducting polymer that is stable in air [11]. As a sensor, PANI is particularly helpful because it is sensitive at room temperature [12,13], and it can be applied to detect a range of gases in combination with additional nanomaterials [14].
Several optical hydrogen sensors using PANI as an energy transformer have been reported in recent years. Most of them rely on fiber gratings (FBGs) [15] and plastic optical fiber [16]. To make fiber optic sensors sensitive to their surroundings, most of them must be functionalized [17]. In this research, PANI coated with dissolved, tapered optical fibers is used to detect hydrogen gas.
2. Experiments
2.1. Tapered Optical Fiber Fabrication
The H2 gas sensor was developed using a multimodal tapered fiber optic (MMF) with cladding and core dimensions of 125 m and 62.5 m, respectively, as a transducing platform. For reduction, the Vytran glass processing system (Vytran GPX-3400, Thorlabs, Inc., Trenton, NJ, USA) was employed. The machine operates on a heating and pulling principle, with a graphite filament acting as a heating source to create the desired tapered profile geometry. The MMF had a 125 mm cladding diameter that tapered to a 20 mm waist diameter, a 10 mm waist length, and a 5 mm tapering top. The picture of the tapered optical fiber created with the tapered area is shown in Figure 1.
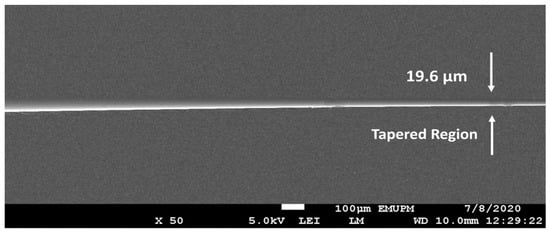
Figure 1.
Scanning electron microscopy (SEM) micrograph of a tapered multimode optical fiber’s transition area (MMF).
2.2. PANI Functionalization on Tapered Optical Fiber
Aniline was purified by distillation before polymerization. The purified aniline (0.16 M) was instantly dissolved in pre-prepared 0.05 M perchloric acid (HClO4) [18,19] (Merck, 70–72%) to avoid atmospheric oxidation. In another volumetric flask, 0.16 M of ammonium peroxodisulfate was also dissolved in HClO4, and both mixtures were rested overnight. Ammonium peroxodisulfate solution was carefully added to the aniline solution with continuous stirring at room condition. The oxidative polymerization reaction of the mixture was left stirring for 24 h. The obtained PANI (dark green precipitate) was filtered and washed with ethanol (EtOH) until a colorless supernatant liquid can be observed in order to minimize the amount of unreacted monomers and oligomers [20]. It is then dried at 60 °C until a constant weight is obtained. A drop casting technique was used to coat the tapered optical fibers. To guarantee full evaporation of the aqueous medium, a drop of mixture (about 20 µL) was placed into the base of the tapered optical fiber by using a micropipette, and the sample was heated in the oven at 80 °C for 40 min.
A light source (tungsten halogen, HL-2000, Ocean Optics, Dunedin, FL, USA) with a coverage wavelength of 360 nm to 2500 nm and a spectrophotometer (USB 4000, Ocean Optics) comprised the experimental phase of the gas optical sensing system. It can detect anything between 200 and 1100 times per second. The optical gas detection system’s experimental setup includes a customized gas chamber for measuring the optical absorption spectrum. The PANI-coated sensor was placed in a close gas unit and purged with a centrifuge at a gas flow rate of 200 sccm from a computer managed mass flow controller. Figure 2 depicts the H2 sensor’s experimental setup.
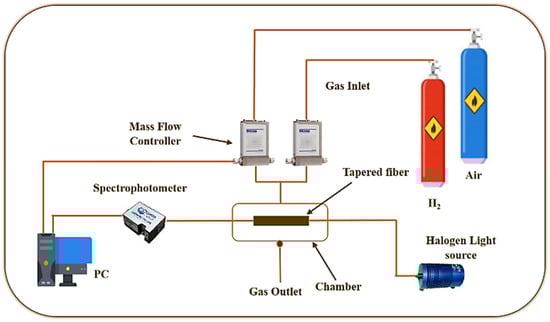
Figure 2.
H2 sensor experimental setup.
2.3. Materials Characterization
FESEM (JSM-7600F, Musashino, Akishima, Tokyo, 8558, Japan) was used to examine the films’ morphology, while EDX analysis was used to assess their original composition. XRD examination indicated material identification, crystallization, and the PANI phase transition (APD 2000). FESEM images of PANI nanoparticles are shown in Figure 3. The PANI is mostly made up of uneven grains and chips with sharp edges, as can be observed. Furthermore, the structure seems to be completely porous, creating very small polyaniline particles that can expand the liquid–solid interface [21,22].
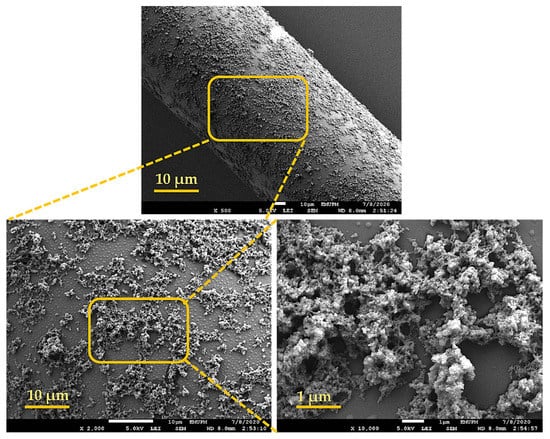
Figure 3.
FESEM micrograph of Polyaniline (PANI).
Figure 4a shows the XRD pattern of the PANI, which shows an amorphous nature in a partly crystalline condition with a diffraction peak at 22.34°. (200). Due to the repeating of benzenoid and quinoid rings in the PANI chains, this pattern displays poor conductive polymer crystallinity.
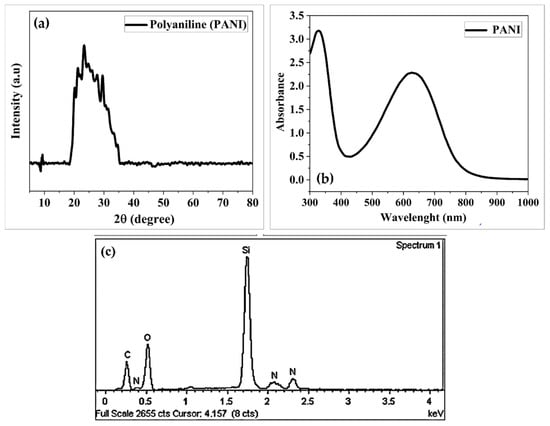
Figure 4.
(a) XRD pattern of PANI; (b) shows the UV–vis spectra of PANI structures; and (c) shows the EDX measurement of PANI.
Figure 4b shows the UV–vis spectra of PANI structures. Spectroscopic scanning was performed at a wavelength range from 300 to 1000 nm. The UV–vis spectrum is useful for measuring the amount of conjugation, and for this reason, conductive polyaniline samples exhibit a broad absorbance, referred to as a free carrier tail, at wave lengths greater than about 800 nm. As the conjugation length becomes longer, the peak shifts to broader wavelengths and becomes extremely large [23].
Figure 4c shows the EDX pattern of PANI, which revealed that the key elements in PANI film are C, N, O, and Si, as observed by their peaks. A silica fiber was employed as the substrate shared the silicon (Si) peak.
The atomic force microscope (AFM) can verify the average surface roughness and thicknesses of PANI. A 10 × 10 µm section of the boundary area was scanned for AFM analysis. The average surface roughness values of the PANI were ≈23.4 nm, as shown in Figure 5a,b. As part of this study, the thicknesses of the PANI coatings were measured. As shown in Figure 5c, measurements were taken by surrounding parts of fiber with aluminum tape and then assessing the thickness differences between coated and uncoated fiber. The average thickness of the PANI coatings was 690 nm.
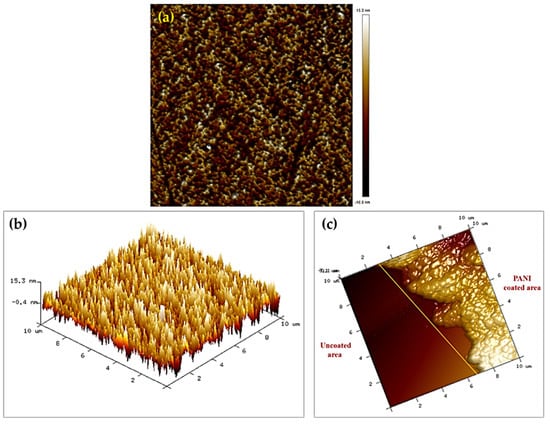
Figure 5.
Two-dimensional topography AFM images (a) PANI; (b) 3D topography AFM images of PANI; and (c) 3D topography AFM images of the boundary area between the uncoated and coated fiber for PANI sensing layer.
3. Results and Discussion
The absorption spectra of the developed sensor coated with PANI relative to synthetic air and 1.00% H2 at room temperature were observed. As shown in Figure 6a, the PANI-coated sensor shows notable changes in absorption, particularly in the wavelength range of 550 to 850 nm. The sensor performance of the PANI-coated sensor was monitored in terms of cumulative absorbance, which is the product of a combination of response curves over a particular wavelength range. Figure 6b shows the dynamic response of PANI-coated based sensors to H2 concentrations in air ranging from 0.125% to 1.00% at room temperature. The response and recovery times of the developed PANI-coated based sensor were 110 s and 160 s, respectively. The absorbance change was approximately 4% at 0.125% H2 and 19% higher with 1.00% H2. Compared with the results of previous studies [24,25], the PANI-coated based sensor showed greater H2 absorbance and recovery, as well as advanced compromise differences.
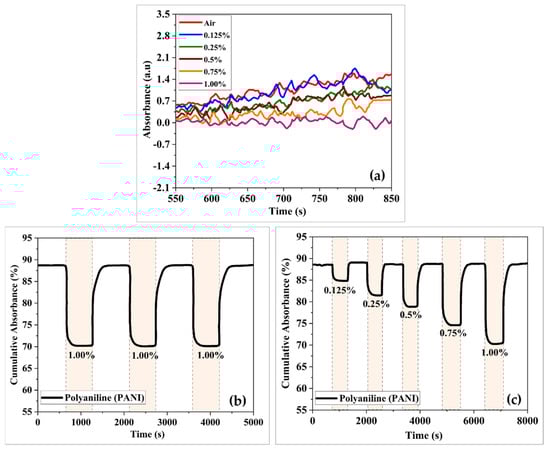
Figure 6.
(a) Absorbance versus optical wavelength, (b) dynamic absorbance curves, and (c) repeatability of PANI-coated based sensor towards H2.
The repeatability of the PANI-coated based sensor was tested by exposing it to three cycles of 1.00% H2. Overall, the PANI-coated based sensor showed a strong and stable absorbance response as well as high repeatability towards H2.
Figure 7a shows the absorption versus H2 concentration for PANI-coated based sensors. The PANI-coated based sensors had a sensitivity of 15.928/vol% and a linearity slope of 98%. When measuring gas-sensing properties, selectivity is an important key to consider. As shown in Figure 7b, the sensor’s absorption properties toward ammonia (NH3) and methane gas (CH4) at a concentration of 1.00% were investigated. The PANI-coated based sensor had a very high NH3 absorption response but a substantially lower response for the other gases. Furthermore, the adsorption of PANI based materials was highly selective for polar molecules such as NH3, whereas sensitivity was low for non-polar molecules such as H2 and CH4 [26].
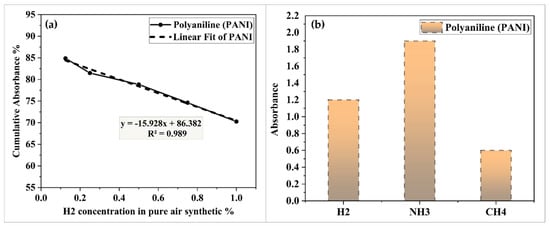
Figure 7.
(a) Absorbance changes at different H2 concentration for PANI-coated based sensor and (b) the selectivity of PANI-coated based sensor.
4. H2 Mechanism of PANI Coated on Tarped Optical Fiber
The H2 sensor with PANI mechanism consists of two parts, as illustrated in Figure 8. The first is the physical absorption of gas molecules in the PANI, which causes changes in the refractive index of the optical fiber’s surface, which in turn will result in changes in the amount of light transmitted in the fiber. A higher RI would allow more light to escape, lowering the intensity of light detected by the spectrophotometer. The charge transfer between the adsorbent and the PANI molecules is the second step. The charge transfer from the electron donating H2 gas to PANI changes the surface chemistry of the sensor layer as it is absorbed into the walls and sides of PANI. This involves changes in the sensor layer’s optical properties, as the light that traveled through the fiber is absorbed by environmental changes, causing spectrum shifts.
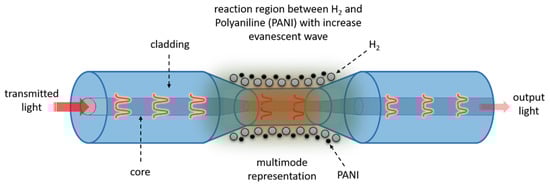
Figure 8.
Hydrogen PANI-sensing mechanism.
5. Conclusions
By using a drop casting technique, this study proved that optical fiber sensors could be fabricated from Polyaniline (PANI). The response of the established sensor to various concentrations of H2 gas at room temperature was used to measure its efficiency. When exposed to 1.00 % H2 in synthetic air, the PANI-coated based sensor enhanced its ab-sorption response by 19%, according to these findings. The selectivity investigation indicated that the PANI-based optical sensor responded strongly towards ammonia, methane, and hydtogen chemicals. The findings suggest that an affordable and easy methodology may be utilized to enhance an effective, accurate, and repeatable H2 sensor in real-world atmospheric conditions.
Supplementary Materials
The poster presentation is available online at https://www.mdpi.com/article/10.3390/CSAC2021-10415/s1.
Author Contributions
Conceptualization, M.M.A., and M.H.Y.; methodology, M.M.A., S.H.G., A.H.I., and M.H.Y.; writing—original draft preparation, M.M.A.; review and editing, M.H.Y., M.A.M., S.P., and N.A. All authors have read and agreed to the published version of the manuscript.
Funding
Universiti Putra Malaysia funded this research, grant number GP-IPS/2019/9674900.
Institutional Review Board Statement
Not applicable.
Informed Consent Statement
Not applicable.
Data Availability Statement
Not applicable.
Conflicts of Interest
The authors declare no conflict of interest.
References
- Hübert, T.; Detjens, M.; Tiebe, C. Response Time Measurement of Hydrogen Sensors. In Proceedings of the 7th International Conference on Hydrogen Safety, Hamburg, Germany, 11–13 September 2017; pp. 1–11. [Google Scholar]
- Bychkov, A.L.; Korobeynikov, S.M.; Ryzhkina, A.Y. Determination of the Hydrogen Diffusion Coefficient in Transformer Oil. Tech. Phys. 2011, 56, 421–422. [Google Scholar] [CrossRef]
- Islam, M.M.; Lee, G.; Hettiwatte, S.N. A Review of Condition Monitoring Techniques and Diagnostic Tests for Lifetime Estimation of Power Transformers. Electr. Eng. 2018, 100, 581–605. [Google Scholar] [CrossRef]
- Staffell, I.; Scamman, D.; Velazquez Abad, A.; Balcombe, P.; Dodds, P.E.; Ekins, P.; Shah, N.; Ward, K.R. The Role of Hydrogen and Fuel Cells in the Global Energy System. Energy Environ. Sci. 2019, 12, 463–491. [Google Scholar] [CrossRef]
- Singh, A.P.; Kumar, D.; Agarwal, A.K. Particulate Characteristics of Laser Ignited Hydrogen Enriched Compressed Natural Gas Engine. Int. J. Hydrogen Energy 2020, 45, 18021–18031. [Google Scholar] [CrossRef]
- Pospíšilová, M.; Kuncová, G.; Trögl, J. Fiber-Optic Chemical Sensors and Fiber-Optic Bio-Sensors. Sensors 2015, 15, 25208–25259. [Google Scholar] [CrossRef] [PubMed]
- Rajan, G. Optical Fiber Sensors: Advanced Techniques and Applications; CRC Press: Boca Raton, FL, USA, 2015; ISBN 1482228297. [Google Scholar]
- Zou, Y.; Pisciotta, J.; Baskakov, I.V. Nanostructured Polypyrrole-Coated Anode for Sun-Powered Microbial Fuel Cells. Bioelectrochemistry 2010, 79, 50–56. [Google Scholar] [CrossRef] [PubMed]
- Wang, M.; Wang, D.N.; Yang, M.; Cheng, J.; Li, J. In-Line Mach-Zehnder Interferometer and FBG with Pd Film for Simultaneous Hydrogen and Temperature Detection. Sens. Actuators B Chem. 2014, 202, 893–896. [Google Scholar] [CrossRef]
- Yu, L.; Gan, M.; Ma, L.; Huang, H.; Hu, H.; Li, Y.; Tu, Y.; Ge, C.; Yang, F.; Yan, J. Facile Synthesis of MnO2/Polyaniline Nanorod Arrays Based on Graphene and Its Electrochemical Performance. Synth. Met. 2014, 198, 167–174. [Google Scholar] [CrossRef]
- Cichosz, S.; Masek, A.; Zaborski, M. Polymer-Based Sensors: A Review. Polym. Test. 2018, 67, 342–348. [Google Scholar] [CrossRef]
- Zhang, Y.; Wen, F.; Jiang, Y.; Wang, L.; Zhou, C.; Wang, H. Layer-by-Layer Construction of Caterpillar-like Reduced Graphene Oxide–Poly (Aniline-Co-o-Aminophenol)–Pd Nanofiber on Glassy Carbon Electrode and Its Application as a Bromate Sensor. Electrochim. Acta 2014, 115, 504–510. [Google Scholar] [CrossRef]
- Zheng, Z.; Du, Y.; Feng, Q.; Wang, Z.; Wang, C. Facile Method to Prepare Pd/Graphene–Polyaniline Nanocomposite and Used as New Electrode Material for Electrochemical Sensing. J. Mol. Catal. A Chem. 2012, 353, 80–86. [Google Scholar] [CrossRef]
- Nazemi, H.; Joseph, A.; Park, J.; Emadi, A. Advanced Micro-and Nano-Gas Sensor Technology: A Review. Sensors 2019, 19, 1285. [Google Scholar] [CrossRef] [PubMed]
- Ahad, I.Z.M.; Harun, S.W.; Gan, S.N.; Phang, S.W. Application of Fiber Bragg Grating Sensor Coated with Polyaniline as an Optical Sensor for Chloroform Detection. Polym. Polym. Compos. 2017, 25, 555–562. [Google Scholar] [CrossRef]
- Khalaf, A.L.; Mohamad, F.S.; Arasu, P.T.; Shabaneh, A.A.; Abdul Rahman, N.; Lim, H.N.; Paiman, S.; Yusof, N.A.; Mahdi, M.A.; Yaacob, M.H. Modified Plastic Optical Fiber Coated Graphene/Polyaniline Nanocompositefor Ammonia Sensing. In Proceedings of the 2016 IEEE 6th International Conference on Photonics, ICP 2016, Kuching, Malaysia, 14–16 March 2016; pp. 31–33. [Google Scholar] [CrossRef]
- Alkhabet, M.M.; Girei, S.H.; Paiman, S.; Arsad, N.; Mahdi, M.A.; Yaacob, M.H. Highly Sensitive Hydrogen Sensor Based on Palladium-Coated Tapered Optical Fiber at Room Temperature. Eng. Proc. 2020, 2, 8. [Google Scholar]
- Andika, A.I.W.; Hafizah, M.A.E.; Manaf, A. Electrical Conductivity and Microwave Characteristics of HCl and HClO4-Doped Polyaniline Synthesized through Chemical Oxidative Continuous Polymerization Process at Various Polymerization Temperatures. In Proceedings of the AIP Conference Proceedings; AIP Publishing LLC: Depok, Indonesia, 2018; Volume 2023, p. 20027. [Google Scholar]
- Mogre, P. Synthesis and Characterization Studies of Polyaniline Nano Fibres. Adv. Mater. Proc. 2018, 3, 178–180. [Google Scholar] [CrossRef][Green Version]
- Deng, J.; Wang, X.; Guo, J.; Liu, P. Effect of the Oxidant/Monomer Ratio and the Washing Post-Treatment on Electrochemical Properties of Conductive Polymers. Ind. Eng. Chem. Res. 2014, 53, 13680–13689. [Google Scholar] [CrossRef]
- Jarad, A.N. Synthesis and Characterization of Conductive Polyaniline Using 24 Hours Chemical Oxidative Process for Organic Solar Cells. Ph.D. Thesis, Universiti Sains Malaysia, George Town, Malaysia, 2017. [Google Scholar]
- Al-Daghman, A.N.J. Optical Characteristics of Conductive Polymer Polyaniline PANI-EB. Int. J. Res. Appl. Sci. Eng. Technol. 2018, 6, 1555–1560. [Google Scholar] [CrossRef]
- Karaoğlan, N.; Bindal, C. Synthesis and Optical Characterization of Benzene Sulfonic Acid Doped Polyaniline. Eng. Sci. Technol. Int. J. 2018, 21, 1152–1158. [Google Scholar] [CrossRef]
- Arasu, P.T.; Noor, A.S.M.; Khalaf, A.L.; Yaacob, M.H. Highly Sensitive Plastic Optical Fiber with Palladium Sensing Layer for Detection of Hydrogen Gas. In Proceedings of the 2016 IEEE Region 10 Symposium, TENSYMP 2016, Bali, Indonesia, 9–11 May 2016; pp. 390–393. [Google Scholar] [CrossRef]
- González-Sierra, N.E.; Gómez-Pavón, L.d.C.; Pérez-Sánchez, G.F.; Luis-Ramos, A.; Zaca-Morán, P.; Muñoz-Pacheco, J.M.; Chávez-Ramírez, F. Tapered Optical Fiber Functionalized with Palladium Nanoparticles by Drop Casting and Laser Radiation for H2 and Volatile Organic Compounds Sensing Purposes. Sensors 2017, 17, 2039. [Google Scholar] [CrossRef] [PubMed]
- Li, Z.F.; Blum, F.D.; Bertino, M.F.; Kim, C.S. Amplified Response and Enhanced Selectivity of Metal-PANI Fiber Composite Based Vapor Sensors. Sens. Actuators B Chem. 2012, 161, 390–395. [Google Scholar] [CrossRef]
Publisher’s Note: MDPI stays neutral with regard to jurisdictional claims in published maps and institutional affiliations. |
© 2021 by the authors. Licensee MDPI, Basel, Switzerland. This article is an open access article distributed under the terms and conditions of the Creative Commons Attribution (CC BY) license (https://creativecommons.org/licenses/by/4.0/).