1. Introduction
When designing a new methodology for the routine analysis of biological samples, significant attention is paid to reducing systematic errors linked to the changing properties of measuring devices. Control over external conditions (temperature and humidity) is determined by the nature of the working elements in the device. Thus, in gas analyzers of the sorption type, the signal is defined by the interaction of phases of modifiers with vapours and gases in the pre-sensory space; in reusable sensors, the stability of sorption surfaces, which defines the sorption–desorption processes, constitutes the main requirement. Since temperature changes the volatility of substances and the sorption properties of substances and sorbents, operating sorption-type sensors at a normal temperature and relative humidity is a critical factor. The development of approaches to ensure the stability of measurements during long-term operation is paramount in portable and mobile analytical systems [
1] as this provides time minimization from the moment of sample selection to that of measurement, which is vital for biosample analysis.
It is well known that the drift of sensor signals influences classification solutions and the quantitative determination of components in a mixture [
2,
3,
4]. The short-term drift of basic lines in sorption-type piezoelectric sensors is caused by malfunctions of electric schemes and an abrupt change in the external conditions of the experiment. As a rule, such mistakes are fixed immediately during the measurement and discarded as outliers. Essentially, a long-term drift relates to a change in the sensitive coatings of sensors during operation. Currently, two ways of decreasing the drift impact of a sensor array on analysis results exist: applying extremely stable sensitive sensor coatings [
5,
6,
7,
8] and mathematical algorithms of drift compensation [
9,
10,
11,
12,
13]. These approaches increase accuracy while classifying samples. The mathematical algorithms based on multivariate analysis of the drift correction of sensor signals are difficult to implement in practice for out-of-laboratory analysis, since they require additional computational costs, software changes, or the application of additional programs along with the operator’s modelling skills. The most critical component in mathematical processing implementation is valid information selection, obtained over a long period of time, for a single measurement but not for a data set. The goal of the investigation, the nature of the biosample, and the operating conditions are the factors that determine the choice of drift compensation approach.
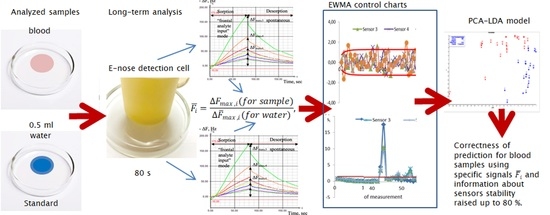
In this study, we present a technique for drift compensation for the signal of mass-sensitive piezoelectric quartz sensors during operation in the open detection cell and frontal input of the gaseous phase over biosamples with significant water content. The technique consists of piezoelectric sensor signal correction in a portable e-nose as part of a lengthy routine analysis of water and blood samples, combined with a simple algorithm for assessing system instability, in order to increase the quality of measurement and decrease first- and second-order classification errors. This technique can be used for real sample analysis, including biological samples (blood, secretions, mucus, exhaled breath condensate, perspiration, urine, and saliva), with minor a modification of the device software for out-of-laboratory analysis.
2. Methods and Analysis
A gaseous phase analysis of distilled water and blood samples was conducted on the gas analyzer Diagnost-Bio-8 (LLC SenSino, Kursk, Russia) using frontal analyte input mode [
14]. The sensor array consisted of eight piezoelectrical quartz BAW-type resonators with a 10.0 MHz basic oscillation frequency, with coatings from solid nanostructured sorbents (‘living system’ set): Sensor 1 and 8 are carboxylated carbon nanotubes of different masses, marked in the tables and text as MCNT1, MCNT2; Sensor 2 and 7 are phases of nitrate of zirconium oxide of different masses (Zr1, Zr2); Sensor 3 is dicyclohexano-18-crown-6 (DCH18C6); Sensor 4 and 5 are biohydroxyapatite phases of different masses (HA1, HA2); and Sensor 6 is polyethylene glycol succinate (PEGsc). This study describes sensor manufacturing [
15]. Moreover, the work [
16] presents the sorption characteristics of the sensor array from the ‘living system’ set. The basic lines of the sensors were observed to remain stable (±1 Hz) during an 80 s blank measurement before the sample analysis.
The blood or water sample (volume: 0.5 cm
3) was placed on a glass petri plate and then covered by a detection cell of Diagnost-Bio-8. The measurement mode involved combined 80 s sorption and 120 s spontaneous desorption [
14].
For the analysis of work stability and drift correction of the sensor array signal, a 3 month period (October–December 2019) of device operations (656 measurements) was chosen, during which 75 water samples and 31 blood samples of somatically healthy people, with indicators of general and biochemical analysis of blood within normal limits, were tested. As part of the training set of the samples, sensor array data for 64 samples (19 blood samples and 45 water samples) were selected for the first 1.5 months of operation (October–November). The sensor array data for 42 samples (12 blood samples and 30 water samples) were selected as the test set of samples for the next period of operation (November–December). During the experiment, external factors showed variation: the room temperature changed from 20 to 25 °C, the humidity was 45–55%, and the slight changes in room smell (background) per day corresponded to disinfection and ventilation schedule of the laboratory. Measurements were not performed during disinfection and ventilation and 90 min after these processes. Regarding the original sensor data for each sample, a special software determined maximum sensor responses (ΔFmax,i, Hz), which corresponded to 80 s of measurement (sorption time).
We suggested the correction of the sensor signals in an array based on daily internal standardization. The distilled water was chosen as the standard. We calculated the specific signals
via the following formula:
where Δ
Fmax,i, Hz are values of the original signal of
i-th sensor during the biosample analysis and
is the average signal of the
i-th sensor for three or five analyses of water samples on the same day.
For specific signals calculated for the water samples, we applied a statistical process control method, namely the exponentially weighted moving average (EWMA) control chart, for uni- and multivariate data [
17], in order to assess the stability of the sensor arrays. We investigated the statistical quantity
in the sensor arrays, for each sensor–parameter z
i, and exponentially weighted the mean square (EWMS) error s
i during 3 months of operation. Before the computation of the statistical criteria, the specific signals obtained were standardized by the average value equal to 1.00 for all the sensor signals. The standard deviation for each sensor was determined according to the data obtained for the first 25 days of operation.
As an alternative method of drift compensation for sensor signals, component correction by principal component analysis (CC-PCA) was employed in order to remove a part of the information. This described the sensor signal drift corresponding to the first principal component from the data matrix [
18].
As variables for designing the classification models, we used original maximum sensor responses and specific signals. The results of the water and blood gaseous phase analysis by sensor array were classified into two classes—‘water’ and ‘blood’—using linear discriminant analysis with preliminary processing by principal component analysis (PCA-LDA) with a significance level of 0.05. A CAMOSoftware Unscrambler (v.10.0.0, Oslo, Norway) was employed to assess the effectiveness of the drift compensation techniques.
3. Results and Discussion
The following are the significant factors determining the drift of sensor signals in the device with an open detection cell: the changes in the sorption properties of sensitive coatings during operation and the external factors of the experiment (temperature, humidity, air composition in the laboratory [(background)). Frequently, these factors act together, which makes it difficult to estimate and predict the contribution of an individual factor to the total signal change. The other internal factors, such as the malfunctions in the oscillating scheme of the device and the change in the features of utilized quartz and electrodes, and the problems linked to signal transmission into software for our devices, lead to no more than 5% variation in sensor signals [
19]. The algorithm of multivariate data processing for the drift compensation of the sensor signals was limited by the pilot experiment conditions for the model design. It cannot always contain all the factor combinations influencing the system’s signals.
A daily internal standardization may perform a simple accounting of the external factors that influence sensor signals during long-term operation. As the standard, we proposed to use the substance whose content was dominant in the analyzed samples. For biosamples, such as blood, urine, exhaled breath condensate and saliva, distilled water is an appropriate standard. During the 3 months of the experiment, the value of the original signals of the sensors in water vapour varied from 20 to 27%; moreover, the dispersions of the original sensor signals were non-homogeneous, according to Cochran’s C-test. The application of the daily standardization reduced the variation to 12%, and the dispersions of all the signals became homogeneous. The average specific signals of all the sensors throughout the total operation period equalled 1.00. The implementation of the specific signals considers the changes in biosamples as well as the sorption properties of sensor coatings, depending on external factors, and thereby reduces the errors of sample classification. However, more accurate classification results could be obtained using information about the stability of sensors.
3.1. Stability Assessment of Piezoelectric Sensor Array Using Specific Signals
The application of multivariate EWMA control charts by specific signals helps to discover only abrupt changes in external conditions (caused by the measurement of a contaminated standard, which can be classified as operator error). Therefore, detailed information about stability sensor arrays describes EWMA control charts for individual signals of the sensor array (
Figure 1).
According to multiple excesses of control limits, the high instability of Sensor 6 with the PEGsc film was established because of the excellent water impact on the properties of polymer films. The control limits of the sensor with the DCH18C6 film (Sensor 3) featured the most significant values (
Table 1). This is explained by the nature of the modifier, which consisted of solvated crown-ether macromolecules. This type of structure is less stable and varies more depending on external conditions.
The parameters zi for the sensors with hypersensitive nanostructured films of carboxylated nanotubes (Sensor 8) and hydroxyapatite (Sensor 4) were almost always within the control limits. The exceptions were the day of synchronous change of the zi parameters of all the sensors and the following three days (41–51 measurements); these exceptions were related to the changes in the coating properties during the sorption of the contaminated standard vapours and their subsequent reactivation by purging with laboratory air and repeated measurements of pure standard samples. The data from the biosample analysis obtained on these days may have been unreliable and may have contributed to error in the classification model.
To decide on the exclusion of the sensor signals from the classification data and to assess the sensor regeneration level after poisoning, an analysis of the changes to the signal variability was required. Here, the evaluation of the sample generalized variance for sensor array was not informative, since its values throughout the total studied period were either negative or extremely low (less than 10
−60). Therefore, we considered the EWMS errors s
i of specific sensor signals (
Figure 2). On the day of the abrupt change in external conditions (measurements of the contaminated sample of the standard; measurement No. 41–43), variation for all the sensors and z
i exceeded the upper limit control (UCL) of 1.45. Therefore, in the case of the synchronous increase in control limits by parameters z
i and s
i for all the sensors, it was necessary to terminate measurements, verify compliance with the conditions for the measurement procedure and reactivate the sensor array’s coatings. When calculating the EWMS for each subsequent day after conducting the reactivation of coatings, EWMS s
0 = 1 was accepted as the initial point for all the sensors. In the following eight days (measurement No. 44–65), the EWMS of all the sensors, except for Sensors 1 and 8, which featured carbon nanotube coatings, exceeded the UCL. This probably indicated the sorption quality changes in the hydrophilic modifiers following the sorption of contaminated standard vapor and their gradual recovery when measuring the pure standard or slight inertia of the surface reactivation process of nanostructured mineral coatings, such as hydroxyapatite.
The average run length (ARL) and time to signal (ATS) were calculated according to EWMA theory. The ARL was equal to three measurements to detect three σ shifts in signals and the ATS was 2.5 h. After a long break or recovering of the sorption properties of coatings, the ARL was five measurements, whereas ATS was 1.5 h.
General recommendations for sensor data analysis of biosamples, accounting for their stability, were formulated as a scheme that could be implemented in the device’s software. The purpose was to monitor the stability sensor array with minimal control by the operator, which is essential for out-of-laboratory analysis. The proposed approach was implemented for different forms biosample analysis, such as blood analysis.
3.2. Blood and Water Sample Classification
To ensure the orthogonality of the data for the discriminant analysis, we performed the principal component analysis of original and specific sensor signals. For further analysis, we used the first four principal components with 98% explained variance, which allowed us to consider all the information from the sensor array during the sample classification. In the first stage, we estimated the possibility of water and blood sample classification using original signals of sensors. The accuracy of this classification model for the training set of samples was 90.4% (
Table 2).
The misclassification of blood samples as ‘water’ class was observed. This signifies that during the analysis of the gaseous phase over the blood samples, the sample matrix influences sensors and that over a period of time, differences within the gaseous composition in the samples become less noticeable for the sensors. The highest value for the accuracy and correctness of the blood sample classification belonged to the model constructed by specific sensor signals, which accounted for sensor stability information (
Table 2). Consequently, the drift compensation of the sensor signals using specific signals with combination sensor stability monitoring by EWMA control charts could be applied, along with the routine sensor array operation in the laboratory and out-of-laboratory analyses. Furthermore, the correct classification of the samples considering the impact of the dominant component allows us to suggest that this approach can provide a more accurate classification of slight differences in the composition of gaseous phases of blood with pathologies.
4. Conclusions
We proposed a fast and efficient compensation method for sensor signal drift based on daily standardization (dividing sensor signals for biosamples into corresponding average signals for standard samples (measured thrice during the day)). Distilled water was suggested as a standard for blood samples and other biofluids (urine, perspiration, exhaled breath condensate, and saliva). EWMA control charts were applied for sensor array stability monitoring as an additional module in the device software for routine analysis. The coating of carboxylated carbon nanotubes of small mass (Sensor 8) was the most stable within the studied sensor array when measuring the water and blood samples based on the statistical quantities of the EWMA charts. The effectiveness of applying for drift compensation by daily standardization, with a combination of sensor stability monitoring, was proven by significantly improving the blood samples’ classification accuracy. Similarly, it is possible to compensate for the drift of sensor signals when analysing other biosamples using appropriate standards. The additional parameters of sorption or features of sensor output curves after standardization could be used to improve the correctness of the classification during the long-term operation of the sensor array.
Author Contributions
Conceptualization, T.K.; methodology, T.K. and A.S.; validation, D.M. and A.S.; investigation, D.M.; data curation, A.S.; writing—original draft preparation, D.M.; writing—review and editing, A.S.; supervision, T.K.; project administration, T.K.; funding acquisition, T.K. All authors have read and agreed to the published version of the manuscript.
Funding
This research was partly funded by the Russian Science Foundation, grant number 18-76-10015.
Institutional Review Board Statement
The study was conducted according to the guidelines of the Declaration of Helsinki, and approved by Ethics Committee of Voronezh State University of Engineering Technologies (protocol code No. 2 from 21 February 2021).
Informed Consent Statement
Informed consent was obtained from all subjects involved in the study. Written informed consent has been obtained from the patients to publish this paper.
Conflicts of Interest
The authors declare no conflict of interest. The funders had no role in the design of the study; in the collection, analyses, or interpretation of data; in the writing of the manuscript, or in the decision to publish the results.
References
- Di Carlo, S.; Falasconi, M. Drift Correction Methods for Gas Chemical Sensors in Artificial Olfaction Systems: Techniques and Challenges. In Advances in Chemical Sensors, 1st ed.; Wang, W., Ed.; IntechOpen: London, UK, 2011; pp. 305–326. [Google Scholar]
- Ahmadou, D.; Laref, R.; Losson, E.; Siadat, M. Reduction of drift impact in gas sensor response to improve quantitative odor analysis. In Proceedings of the 2017 IEEE International Conference on Industrial Technology (ICIT), Toronto, ON, Canada, 22–25 March 2017; pp. 928–933. [Google Scholar]
- Wang, Y.F.; Yin, Y.; Ge, F.; Yu, H.C. A drift correction method of E-nose data based on wavelet packet decomposition and no-load data: Case study on the robust identification of Chinese spirits. Sens. Actuators B-Chem. 2019, 292, 217–224. [Google Scholar] [CrossRef]
- Yin, Y.; Bai, Y.; Ge, F.; Yu, H.C.; Liu, Y.H. Long-term robust identification potential of a wavelet packet decomposition based recursive drift correction of E-nose data for Chinese spirits. Measurement 2019, 139, 284–292. [Google Scholar] [CrossRef]
- Ushimi, Y.; Ito, Y.; Horiuchi, H.; Kadota, M.; Nozaki, Y.; Hotta, Y.; Shiratori, S. Quartz Crystal Microbalance Sensor for NH3 Gas with Compensation of Humidity Drift. Electron. Commun. Jpn. 2015, 98, 1–7. [Google Scholar] [CrossRef]
- Tolentino, M.A.K.P.; Albano, D.R.B.; Sevilla, F.B. Piezoelectric sensor for ethylene based on silver(I)/polymer composite. Sens. Actuators B-Chem. 2018, 254, 299–306. [Google Scholar] [CrossRef]
- Haghighi, E.; Zeinali, S. Nanoporous MIL-101(Cr) as a sensing layer coated on a quartz crystal microbalance (QCM) nanosensor to detect volatile organic compounds (VOCs). RSC Adv. 2019, 9, 24460–24470. [Google Scholar] [CrossRef] [Green Version]
- Aleixandre, M.; Nakamoto, T. Study of Room Temperature Ionic Liquids as Gas Sensing Materials in Quartz Crystal Microbalances. Sensors 2020, 20, 4026. [Google Scholar] [CrossRef] [PubMed]
- Liu, B.; Zeng, X.P.; Tian, F.C.; Zhang, S.Y.; Zhao, L.L. Domain Transfer Broad Learning System for Long-Term Drift Compensation in Electronic Nose Systems. IEEE Access 2019, 7, 143947–143959. [Google Scholar] [CrossRef]
- Liu, T.; Chen, Y.B.; Li, D.Q.; Yang, T.; Cao, J.H.; Wu, M.Y. Drift Compensation for an Electronic Nose by Adaptive Subspace Learning. IEEE Sens. J. 2020, 20, 337–347. [Google Scholar] [CrossRef]
- Liu, T.; Li, D.Q.; Chen, J.J.; Chen, Y.B.; Yang, T.; Cao, J.H. Active Learning on Dynamic Clustering for Drift Compensation in an Electronic Nose System. Sensors 2019, 19, 3601. [Google Scholar] [CrossRef] [PubMed] [Green Version]
- Rehman, A.U.; Bermak, A. Heuristic Random Forests (HRF) for Drift Compensation in Electronic Nose Applications. IEEE Sens. J. 2019, 19, 1443–1453. [Google Scholar] [CrossRef]
- Rehman, A.U.; Bermak, A.; Hamdi, M. Shuffled Frog-Leaping and Weighted Cosine Similarity for Drift Correction in Gas Sensors. IEEE Sens. J. 2019, 19, 12126–12136. [Google Scholar] [CrossRef]
- Kuchmenko, T.; Shuba, A.; Umarkhanov, R.; Chernitskiy, A. Portable Electronic Nose for Analyzing the Smell of Nasal Secretions in Calves: Toward Noninvasive Diagnosis of Infectious Bronchopneumonia. Vet. Sci. 2021, 8, 74. [Google Scholar] [CrossRef] [PubMed]
- Shuba, A.; Kuchmenko, T.; Umarkhanov, R.; Chernitskiy, A. Portable E-nose for Diagnostic of Inflammation and Diverse Variation in Health Status of Humans and Animals. In Proceedings of the Fifth International Conference on Advances in Sensors, Actuators, Metering and Sensing (ALLSENSORS 2020), Valencia, Spain,, 21–25 November 2020; pp. 56–62. [Google Scholar]
- Kuchmenko, T.; Shuba, A.; Umarkhanov, R.; Lvova, L. The New Approach to a Pattern Recognition of Volatile Compounds: The Inflammation Markers in Nasal Mucus Swabs from Calves Using the Gas Sensor Array. Chemosensors 2021, 9, 116. [Google Scholar] [CrossRef]
- Montgomery, D. Introduction to Statistical Quality Control, 6th ed.; Wiley: Jefferson City, MO, USA, 2009; pp. 419–424, 509–518. [Google Scholar]
- Artursson, T.; Eklöv, T.; Lundström, I.; Mårtensson, P.; Sjöström, M.; Holmberg, M. Drift correction for gas sensors using multivariate methods. J. Chemometr. 2000, 14, 711–723. [Google Scholar] [CrossRef]
- Kuchmenko, T.A.; Shuba, A.A.; Umarkhanov, R.U.; Drozdova, E.V.; Chernitskii, A.E. Application of a Piezoelectric Nose to Assessing the Respiratory System in Calves by Volatile Compounds. J. Anal. Chem. 2020, 75, 645–652. [Google Scholar] [CrossRef]
| Publisher’s Note: MDPI stays neutral with regard to jurisdictional claims in published maps and institutional affiliations. |
© 2022 by the authors. Licensee MDPI, Basel, Switzerland. This article is an open access article distributed under the terms and conditions of the Creative Commons Attribution (CC BY) license (https://creativecommons.org/licenses/by/4.0/).


