Proceeding Paper

Locally Linear Embedding as Nonlinear Feature Extraction to Discriminate Liquids with a Cyclic Voltammetric Electronic Tongue †

by
Jersson X. Leon-Medina
1,*,
Maribel Anaya
2 and
Diego A. Tibaduiza
3
1
Departamento de Ingeniería Mecánica y Mecatrónica, Universidad Nacional de Colombia, Cra 45 No. 26-85, Bogota 111321, Colombia
2
MEM (Modelling-Electronics and Monitoring Research Group), Faculty of Electronics Engineering, Universidad Santo Tomás, Bogota 110231, Colombia
3
Departamento de Ingeniería Eléctrica y Electrónica, Universidad Nacional de Colombia, Cra 45 No. 26-85, Bogota 111321, Colombia
*
Author to whom correspondence should be addressed.
Presented at the 1st International Electronic Conference on Chemical Sensors and Analytical Chemistry, 1–15 July 2021; Available online: https://csac2021.sciforum.net/.
Chem. Proc. 2021, 5(1), 56; https://doi.org/10.3390/CSAC2021-10426
Published: 30 June 2021

Abstract

:
Electronic tongues are devices used in the analysis of aqueous matrices for classification or quantification tasks. These systems are composed of several sensors of different materials, a data acquisition unit, and a pattern recognition system. Voltammetric sensors have been used in electronic tongues using the cyclic voltammetry method. By using this method, each sensor yields a voltammogram that relates the response in current to the change in voltage applied to the working electrode. A great amount of data is obtained in the experimental procedure which allows handling the analysis as a pattern recognition application; however, the development of efficient machine-learning-based methodologies is still an open research interest topic. As a contribution, this work presents a novel data processing methodology to classify signals acquired by a cyclic voltammetric electronic tongue. This methodology is composed of several stages such as data normalization through group scaling method and a nonlinear feature extraction step with locally linear embedding (LLE) technique. The reduced-size feature vector input to a k-Nearest Neighbors (k-NN) supervised classifier algorithm. A leave-one-out cross-validation (LOOCV) procedure is performed to obtain the final classification accuracy. The methodology is validated with a data set of five different juices as liquid substances.Two screen-printed electrodes voltametric sensors were used in the electronic tongue. Specifically the materials of their working electrodes were platinum and graphite. The results reached an 80% classification accuracy after applying the developed methodology.

1. Introduction

Discriminating between different types of liquid substance is a daily task in the food industry. This procedure can be used to preserve the flavor of a product, identify adulterations, confirm the presence of a specific liquid, among others [1]. Generally, the analysis of liquid food products is carried out using a panel of previously trained experts [2] who allow tasting and identifying a specific flavor. This through the training of the human sense of taste. However, over time this ability may be deteriorated and human reliability may be a risk factor for the process. Another method used in the analysis of liquids is high-performance liquid chromatography (HPLC) [3], but this type of analysis is expensive and must be performed in laboratories with specialized equipment. As an alternative to the two mentioned methods, the electronic tongue sensor array has emerged because its advantages such as portability, reliability and low price [4]. Inspired by the human sense of taste and the behavior of taste buds, electronic tongues use an array of non-selective sensors to capture signals from a specific liquid. An electronic tongue uses sensors of different materials and subsequently a sensor data fusion analysis based on pattern recognition algorithms to perform classification tasks of different liquids.
One of the applications of electronic tongue is the discrimination of different fruit juices. For example, in 2011 Dias et al. [5] developed a potentiometric electronic tongue using linear discriminant analysis (LDA) to differentiate four beverage groups including juices of orange, pineapple, mango and peach. In other work, eleven fruit juice varieties were correctly classified by a potentiometric electronic tongue using a Fuzzy ARTMAP neural network [6]. Several sensors composed the electronic tongue sensor arrays; thus, the datasets acquired are very large in size. To deal with this inconvenience, in 2012, Kiranmayee et al. [7] developed a method based on segmentation of the voltammetric signal with the objective to reduce the size of the signal maintaining meaningful information to discriminate the analyzed classes. The developed method was satisfactorily applied to an eight-juices dataset, reducing the data size by 78.94%. A common problem observed in the previous works is that the signals acquired with the electronic tongue have a high dimensionality. This work presents a novel methodology to correctly classify the signals acquired from a cyclic voltammetric electronic tongue.
In this work, the cyclic voltammetry technique was used to perform experiments on five different juices; two screen-printed electrodes (SPE) voltametric sensors were used. The working electrode materials were platinum and graphite. The amount of data captured when performing cyclic voltammetry experiments is high; therefore, these data have high dimensionality. This work uses the Locally Linear Embedding (LLE) [8] method to perform a dimensionality reduction of the original data. This dimensionality reduction serves as feature extraction method that is used as input of a k-Nearest Neighbor (k-NN) [9] classifier used as supervised machine learning method. In order to classify the five different juices a Leave-One-Out cross validation procedure is executed due to the small quantity of samples in the dataset, along to prevent over-fitting [10]. The results show a correct classification procedure of the juices evidenced with a high classification accuracy. The remainder of this papers is as follows: Section 2 describes the materials and methods including the experimental setup and the cyclic voltammetry tests performed. Following, Section 3 presents the data processing results including data unfolding, data scaling, dimensionality reduction, classification, and cross validation. Finally, the Section 4 outlines the main conclusions of this work.

2. Materials and Methods

2.1. Experimental Setup for the Acquisition of the Juice Dataset

The methodology developed in this work is used to classify 5 different classes of juices. This dataset of juices was obtained by conducting experiments on 5 different juices from a company located in the city of Tunja in the department of Boyacá-Colombia. Cyclic voltammetry tests were performed on each one of the 5 juices. For each juice, five experiments were performed, as shown in Table 1.
Experiments were performed on the different juices using the EVAL-AD5940ELCZ [11] electrochemical evaluation board from Analog Devices. This board is commanded by the evaluation board EVAL-ADICUP3029, which is an Arduino- and PMOD-compatible development board that includes Bluetooth and WiFi connectivity [12]. The EVAL-ADICUP3029 board uses the ADuCM3029 ultra low power Arm Cortex-M3 processor as the main device. The ADuCM3029 is an integrated mixed-signal microcontroller system for processing, control, and connectivity. The integration of the EVAL -AD5940ELCZ and EVAL-ADICUP3029 boards is used as potentiostat equipment. This system provide only 1 channel in such a way that a cyclic voltammogram was obtained at a time, In the experimentation the sensor had to be changed to perform each cyclic voltammetry experiment. This electronic tongue used two screen-printed electrode voltammetric sensors from the BVT technologies company [13]. Specifically, the types of these two sensors were: AC1.W2.R2 DW = 1 and AC1.W4.R2 DW = 1. These type of sensors uses the same material for their working and auxiliary electrodes. The first sensor used as working and auxiliary electrode platinum and the second sensor used graphite. Silver covered by AgCl was used as reference electrode in both sensors. The hardware used to obtain the data set of five juices is depicted in Figure 1 left.

2.2. Cyclic Voltammetry Tests to Obtain the Juice Data Set

The Sensor Pal command software from Analog Devices was used to perform the cyclic voltammetry tests. The parameters used in the development of these experiments are shown in Table 2. The ramp-type drive signal shown in blue in Figure 1 right has a total duration of 4 s. The data points of each voltammogram is equal to 500, since there is a period of 8 ms for each sample. The scan rate used is equal to 500 mV/s. Results shown by the green line in the unfolding voltammogram present data current in the ordinate axis in the order of μ A. According to Table 1, five measurements were taken per analyte. In this sense the two sensors are referred to one measure in Table 1. Thus, in total, five measures × 2 sensors = 10 voltammograms were acquired by each juice.
Figure 2 left and right show the cyclic voltammograms for two different juices with both the platinum and graphite sensors in the electronic tongue system by using the boards EVAL-AD5940ELCZ and EVAL-ADICUP3029 as potentiostat. In particular, Figure 2 left depicts the cyclic voltammograms obtained for green apple juice showing that the voltammogram obtained by the graphite sensor reaches higher positive current values than the platinum sensor. In contrast, Figure 2 right shows the cyclic voltammograms for an experiment in red fruit juice, the magnitude of the current obtained by the graphite sensor is clearly lower than with the platinum sensor.

2.3. Dimensionality Reduction

Due to the high dimensionality of the data obtained when performing cyclic voltammetry experiments and how the data are unfolded creating a two-dimensional matrix, it is necessary to carry out a dimensionality reduction process. There are different methods of dimensionality reduction, these can be classified as linear or non-linear. Within the linear methods is the principal component analysis (PCA) [9]. In this method, the greatest amount of variance of the data is represented in a low-dimensional linear space. The data normalization affects the result of the embedding performed by different dimensionality reduction methods.
However, the data obtained by the electronic tongue can form a highly nonlinear manifold. To deal with this issue, different nonlinear dimensionality reduction methods have been developed [14]. These methods are based on the construction of a neighborhood graph and the idea that nearby points in the high-dimensional space can preserve this property in a low-dimensional space. One of the parameters that must be tuned in the dimensionality reduction process is the target dimension d. These target dimensions define the sized of the reduced feature matrix. Specifically, d defines the number of columns that the reduced feature matrix will have. The Locally Linear Embedding (LLE) method solely preserves manifold local properties.

3. Data Processing Results

3.1. Data Unfolding

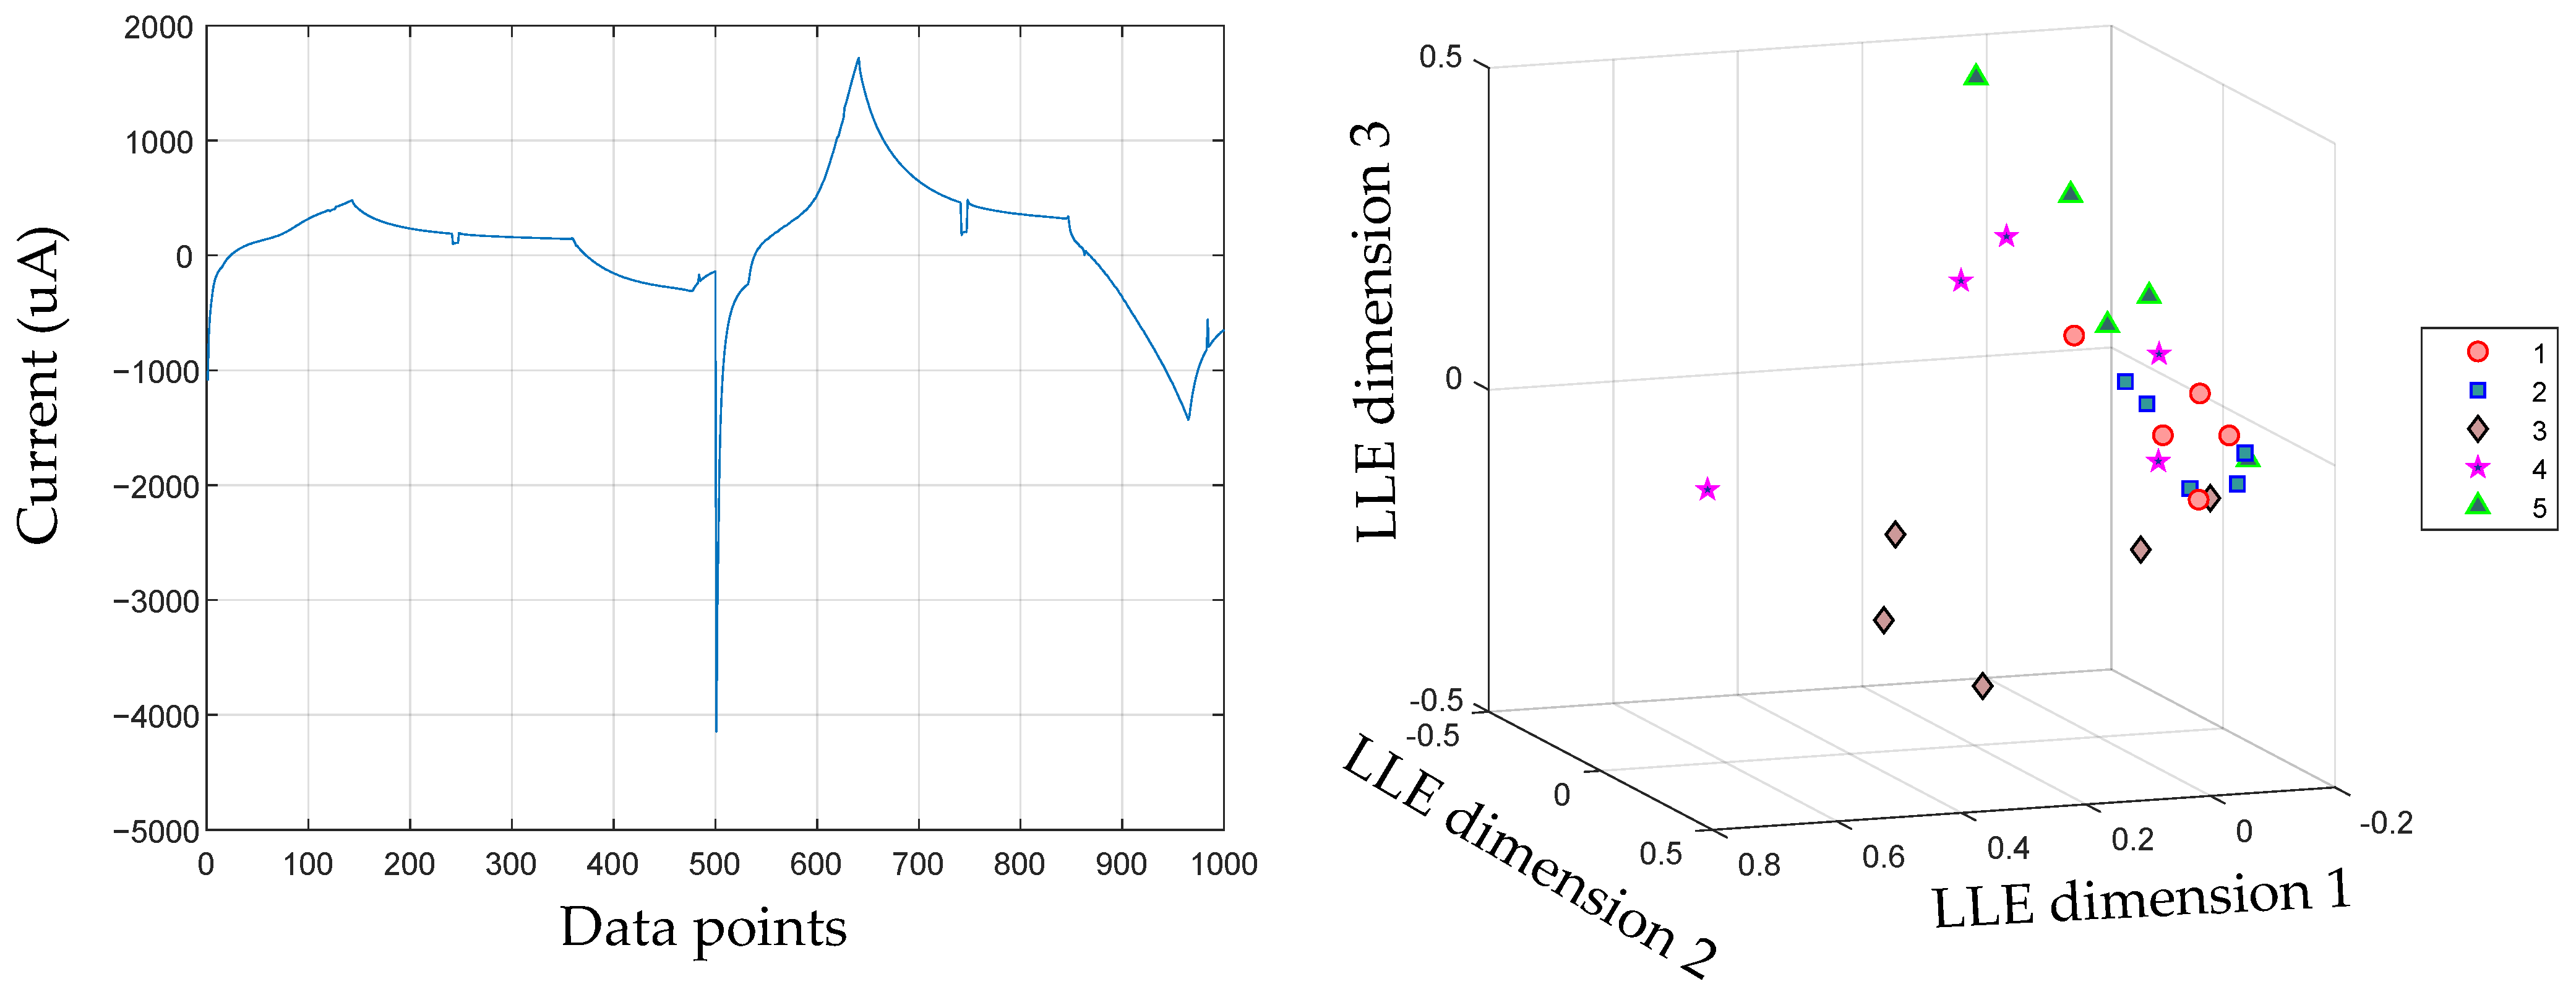
The unfolding of the cyclic voltammogram data obtained by each sensor is carried out according to the group scaling method [15]. For each experiment carried out, the unfolding of the two sensors is performed, obtaining a signal of 1000 data points. Figure 3 left shows an unfolded signal by juice number 3 (red fruits). In this case, the ordinates correspond to current measurements in μ A and the abscissa to data points. Since 25 juice samples were considered in total, the matrix size X is equal to 25 × 1000.

3.2. Dimensionality Reduction Results

The next step in the juice recognition methodology using a cyclic voltammetry electronic tongue is to reduce the dimensionality of the data. In this case, the Locally Linear Embedding (LLE) algorithm was used, which allows to carry out the feature extraction process. The results of the first 3 dimensions after applying the LLE algorithm to the juice dataset are illustrated in the scatter diagram of Figure 3 right. Classes 3 and 5 are the ones better separated (according to the 3D-view shown in Figure 3 right). Thus, the use of a machine learning classifier algorithm is necessary. In this case, the classifying algorithm was k-Nearest Neighbors.
In order to compare the behavior of different methods [15] to perform the dimensionality reduction stage the PCA, Laplacian Eigenmaps, Isomap and t-distributed stochastic neighbor embedding (t-SNE) were selected to determine their behavior in terms of classification accuracy. In addition, a parameter tuning is performed for each manifold learning dimensionality reduction algorithm used. In this case there are 3 algorithms that in common need to create a neighborhood graph, which has the parameter k, on the other hand the algorithm t-SNE needs the calibration of its perplexity parameter p. Figure 4 shows the behavior in the classification accuracy with respect to the variation of each of these parameters. The used range for the parameters was from 4 to 24 since for the neighborhood graphs the minimum value of k= 4 and the maximum of 24 because there are 25 total samples in the data set. This same range was used for the perplexity p value. As can be seen in Figure 4, the LLE method is the one that achieves the highest accuracy values. Particularly when k = 22 the LLE method reaches 80% of classification accuracy.

3.3. Classification and Cross Validation

The LLE algorithm needs the definition of the destination dimension, to find this parameter, a study of the change of the destination dimension d vs. the classification accuracy obtained by the algorithm k-NN with k = 1 was carried out and Euclidean distance was considered. The cross-validation process executed was leaving one out (LOOCV) due to the small number of samples in the juice data set.

Influence of Target Dimensions Variation

Since the number of dimensions at the input of the k-NN classifier algorithm can vary, a study was carried out to determine the best classification accuracy for each of the dimensionality reduction algorithms studied. In Table 3, it can be seen how the LLE method is the one with the best performance in terms of classification accuracy, reaching an accuracy value of 80% with 9 dimensions. As it can be seen in Table 3 the accuracy behavior tends to increase as d is increased up to a maximum of d = 9 for a classification accuracy of 80%. After the dimension d = 9 accuracy tends to decrease, in this sense the optimum size selection was defined as d = 9. Therefore, the feature matrix size at the input of the k-NN classifier is equal to 25 × 9 .
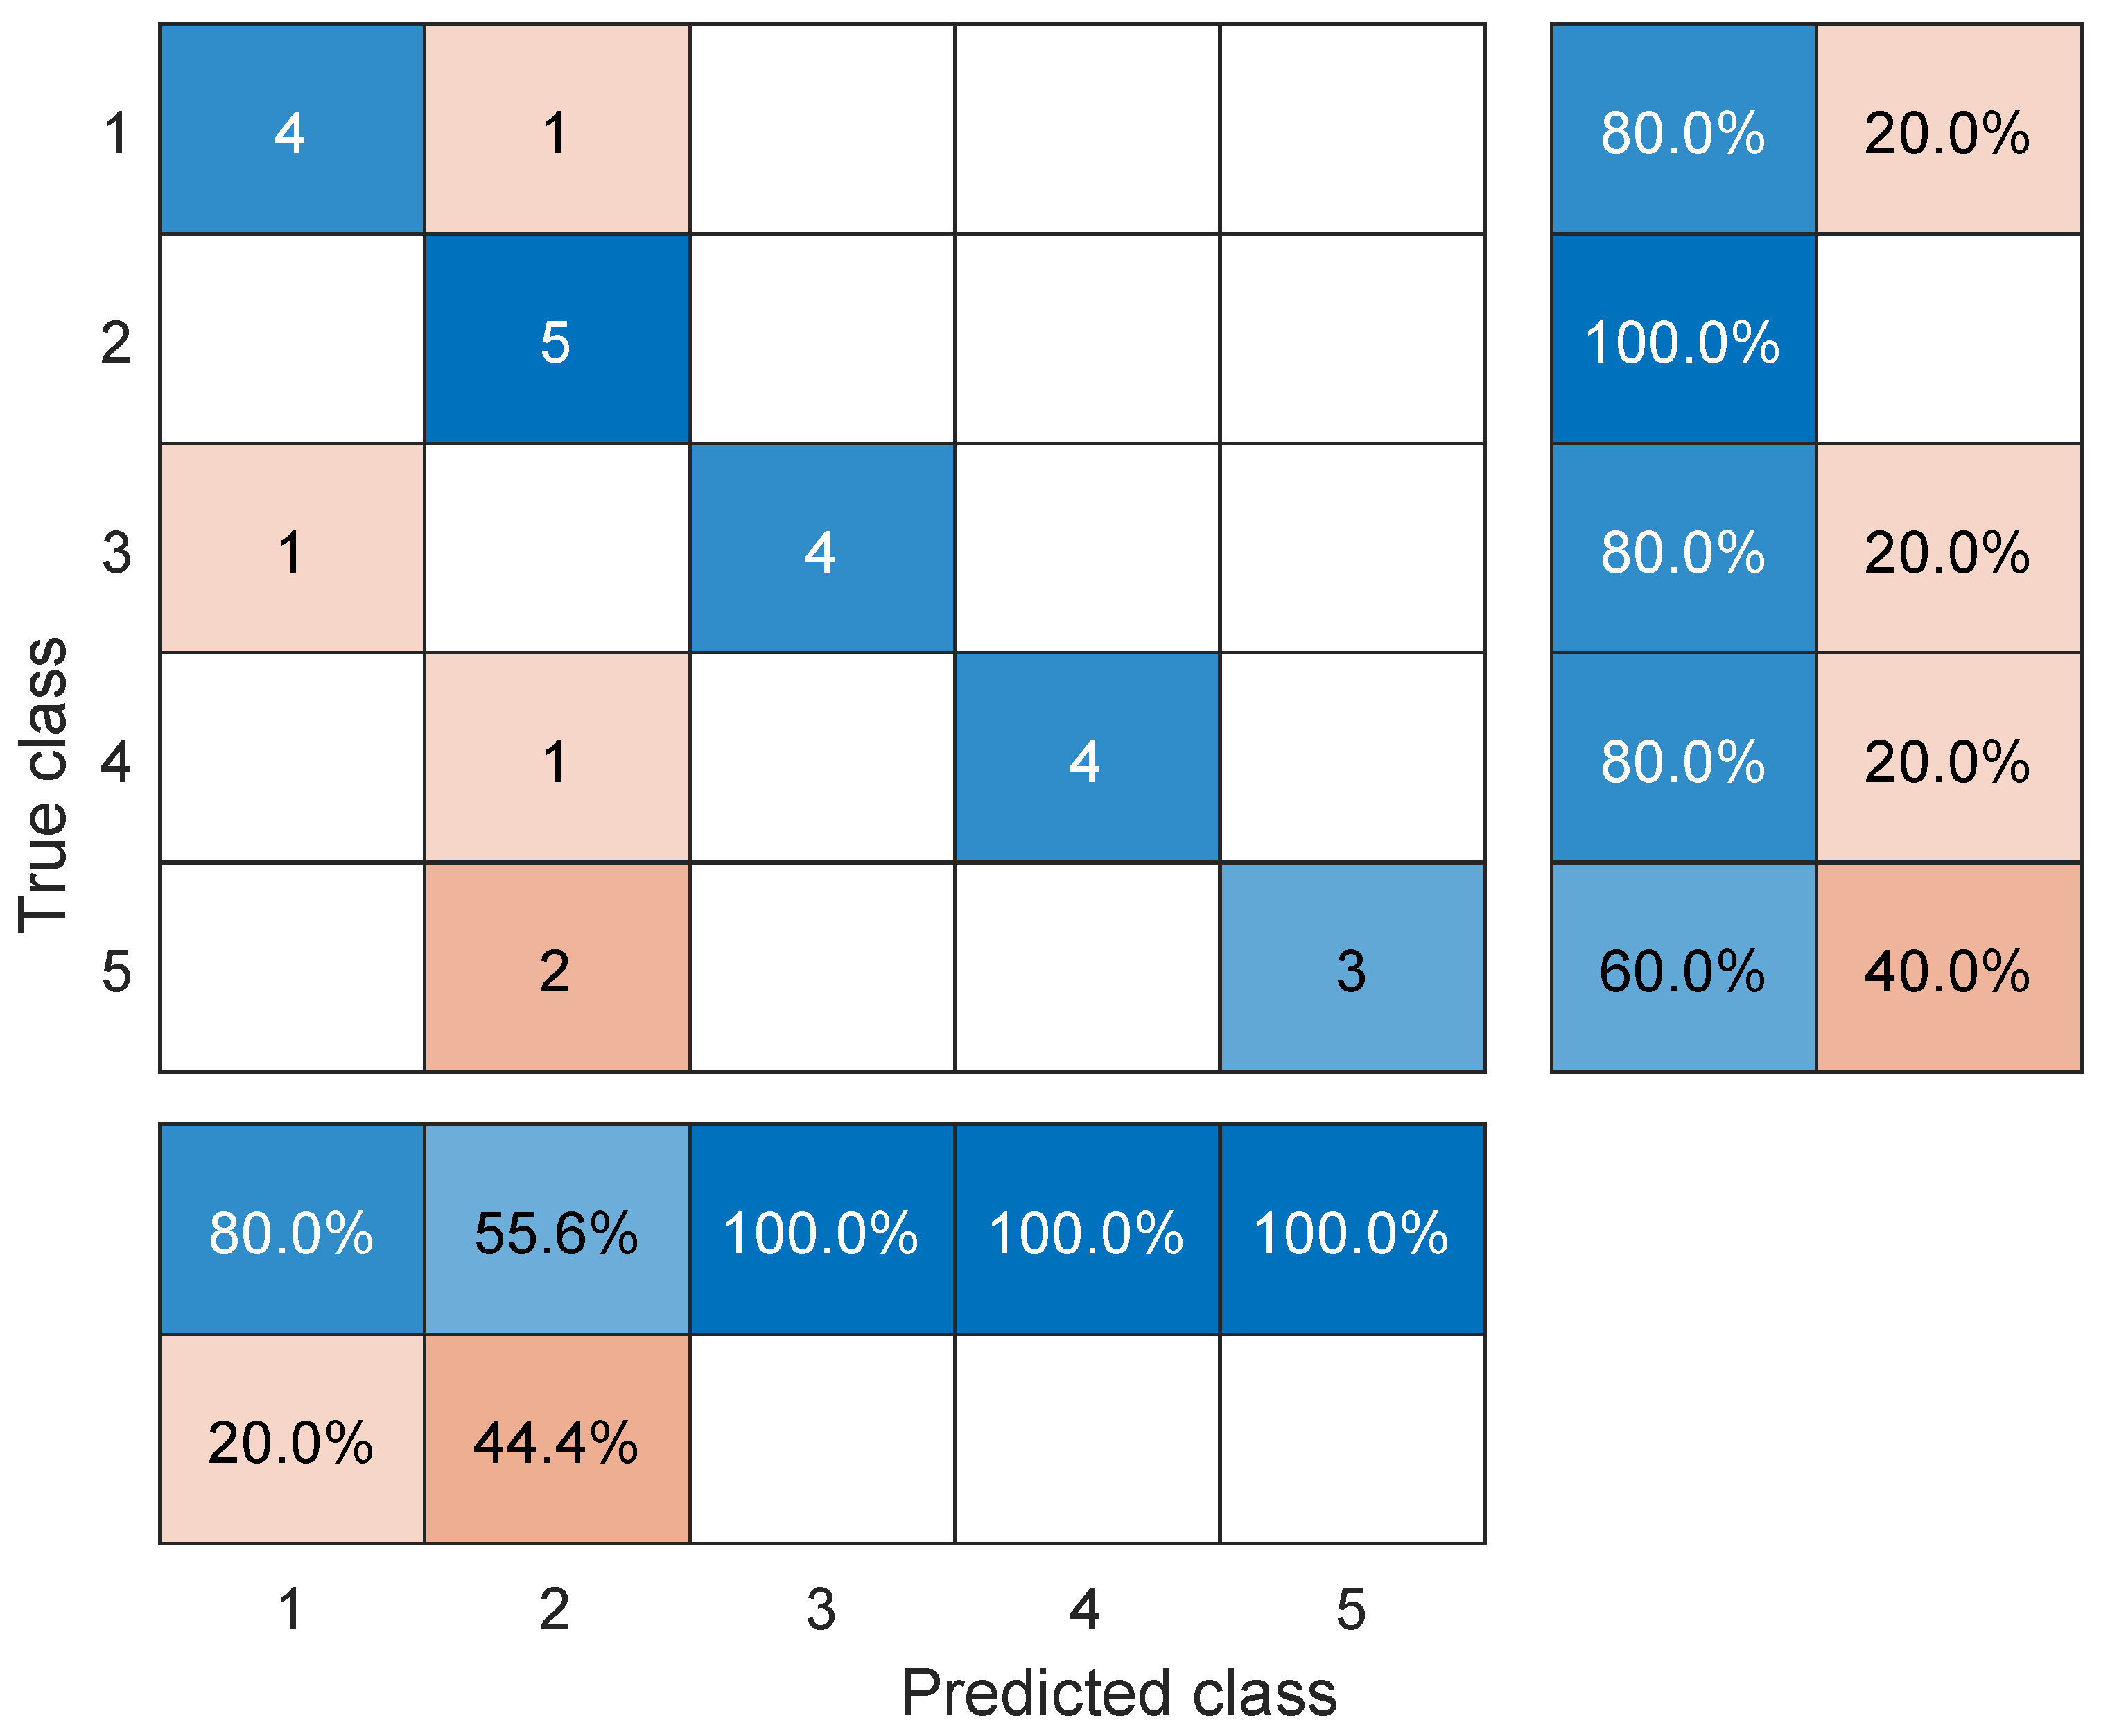
Figure 5 shows the results of the confusion matrix for the mentioned accuracy of 80%. In this case, class 2 was correctly classified, there was 1 error for classes 1,3 and 4; finally, the class that was classified worst was class 5 with two errors. Overall, of the 25 total samples, 20 were classified well and five were classified badly.

4. Conclusions

This work presented a computational framework for processing the signals obtained by a cyclic voltammetry electronic tongue sensor array. The classification accuracy obtained by the developed methodology in a dataset of five different juices showed the advantages of apply this methodology as classification method. It processes the raw complete voltammograms obtained by each working electrode and unfolded them to create a two dimensional matrix. This matrix was normalized applying the group scaling method. Then, the locally linear embedding method is used as a nonlinear feature extraction approach to obtain the feature matrix at the input of a k-NN classifier. As future work, the developed methodology will be applied for classify other kind of substances and other approaches related to semi-supervised classification will be tested.

Author Contributions

All authors contributed to the development of this work, specifically their contributions are as follows: conceptualization, D.A.T. and J.X.L.-M.; data organization and pre-processing, J.X.L.-M. and M.A.; methodology, J.X.L.-M. and M.A.; validation, J.X.L.-M. and D.A.T. All authors have read and agreed to the published version of the manuscript.

Funding

This research was funded by FONDO DE CIENCIA TECNOLOGÍA E INNOVACION FCTeI DEL SISTEMA GENERAL DE REGALÍAS SGR. The authors express their gratitude to the Administrative Department of Science, Technology and Innovation—Colciencias with the grant 779—“Convocatoria para la Formación de Capital Humano de Alto Nivel para el Departamento de Boyacá 2017” for sponsoring the research presented herein.

Institutional Review Board Statement

Not applicable.

Informed Consent Statement

Not applicable.

Acknowledgments

J.X.L.-M. is grateful with Colciencias and Gobernación de Boyacá. J.X.L.-M. thanks Miryam Rincón Joya from the Department of Physics of the National University of Colombia and Leydi Julieta Cardenas Flechas, for their introduction to the electronic tongue sensor array field of research.

Conflicts of Interest

The authors declare no conflict of interest.

References

  1. Podrażka, M.; Bączyńska, E.; Kundys, M.; Jeleń, P.S.; Witkowska Nery, E. Electronic tongue—A tool for all tastes? Biosensors 2018, 8, 3. [Google Scholar] [CrossRef] [PubMed] [Green Version]
  2. Ross, C.F. Considerations of the use of the electronic tongue in sensory science. Curr. Opin. Food Sci. 2021, 40, 87–93. [Google Scholar] [CrossRef]
  3. Zabadaj, M.; Ufnalska, I.; Chreptowicz, K.; Mierzejewska, J.; Wróblewski, W.; Ciosek-Skibińska, P. Performance of hybrid electronic tongue and HPLC coupled with chemometric analysis for the monitoring of yeast biotransformation. Chemom. Intell. Lab. Syst. 2017, 167, 69–77. [Google Scholar] [CrossRef]
  4. Qiu, S.; Wang, J.; Gao, L. Qualification and quantisation of processed strawberry juice based on electronic nose and tongue. LWT-Food Sci. Technol. 2015, 60, 115–123. [Google Scholar] [CrossRef]
  5. Dias, L.; Peres, A.M.; Barcelos, T.P.; Morais, J.S.; Machado, A. Semi-quantitative and quantitative analysis of soft drinks using an electronic tongue. Sens. Actuator B Chem. 2011, 154, 111–118. [Google Scholar] [CrossRef]
  6. Haddi, Z.; Mabrouk, S.; Bougrini, M.; Tahri, K.; Sghaier, K.; Barhoumi, H.; El Bari, N.; Maaref, A.; Jaffrezic-Renault, N.; Bouchikhi, B. E-Nose and e-Tongue combination for improved recognition of fruit juice samples. Food Chem. 2014, 150, 246–253. [Google Scholar] [CrossRef] [PubMed]
  7. Kiranmayee, A.; Panchariya, P.; Sharma, A. New data reduction algorithm for voltammetric signals of electronic tongue for discrimination of liquids. Sens. Actuators A Phys. 2012, 187, 154–161. [Google Scholar] [CrossRef]
  8. Roweis, S.T.; Saul, L.K. Nonlinear dimensionality reduction by locally linear embedding. Science 2000, 290, 2323–2326. [Google Scholar] [CrossRef] [PubMed] [Green Version]
  9. Leon-Medina, J.X.; Cardenas-Flechas, L.J.; Tibaduiza, D.A. A data-driven methodology for the classification of different liquids in artificial taste recognition applications with a pulse voltammetric electronic tongue. Int. J. Distrib. Sens. Netw. 2019, 15, 1550147719881601. [Google Scholar] [CrossRef] [Green Version]
  10. Liu, T.; Chen, Y.; Li, D.; Wu, M. An active feature selection strategy for DWT in artificial taste. J. Sens. 2018, 2018, 9709505. [Google Scholar] [CrossRef] [Green Version]
  11. Analog Devices (2021) EVAL-AD5940ELCZ Electrochemical Evaluation Board. Available online: https://www.analog.com/en/design-center/evaluation-hardware-and-software/evaluation-boards-kits/eval-ad5940elcz.html#eb-overview (accessed on 20 May 2021).
  12. Analog Devices (2021) EVAL-ADICUP3029. Available online: https://www.analog.com/en/design-center/evaluation-hardware-and-software/evaluation-boards-kits/eval-adicup3029.html#eb-overview (accessed on 20 May 2021).
  13. BVT Technologies (2021) ELECTROCHEMICAL SENSOR Type: AC1.W*.R* (*). Available online: https://bvt.cz/wp-content/uploads/2020/08/01-AC1.pdf (accessed on 20 May 2021).
  14. Van der Maaten, L. An Introduction to Dimensionality Reduction Using Matlab; Report MICC 07-07; Universiteit Maastricht: Maastricht, The Netherlands, 2007; p. 62. [Google Scholar]
  15. Leon-Medina, J.X.; Anaya, M.; Pozo, F.; Tibaduiza, D. Nonlinear Feature Extraction Through Manifold Learning in an Electronic Tongue Classification Task. Sensors 2020, 20, 4834. [Google Scholar] [CrossRef] [PubMed]
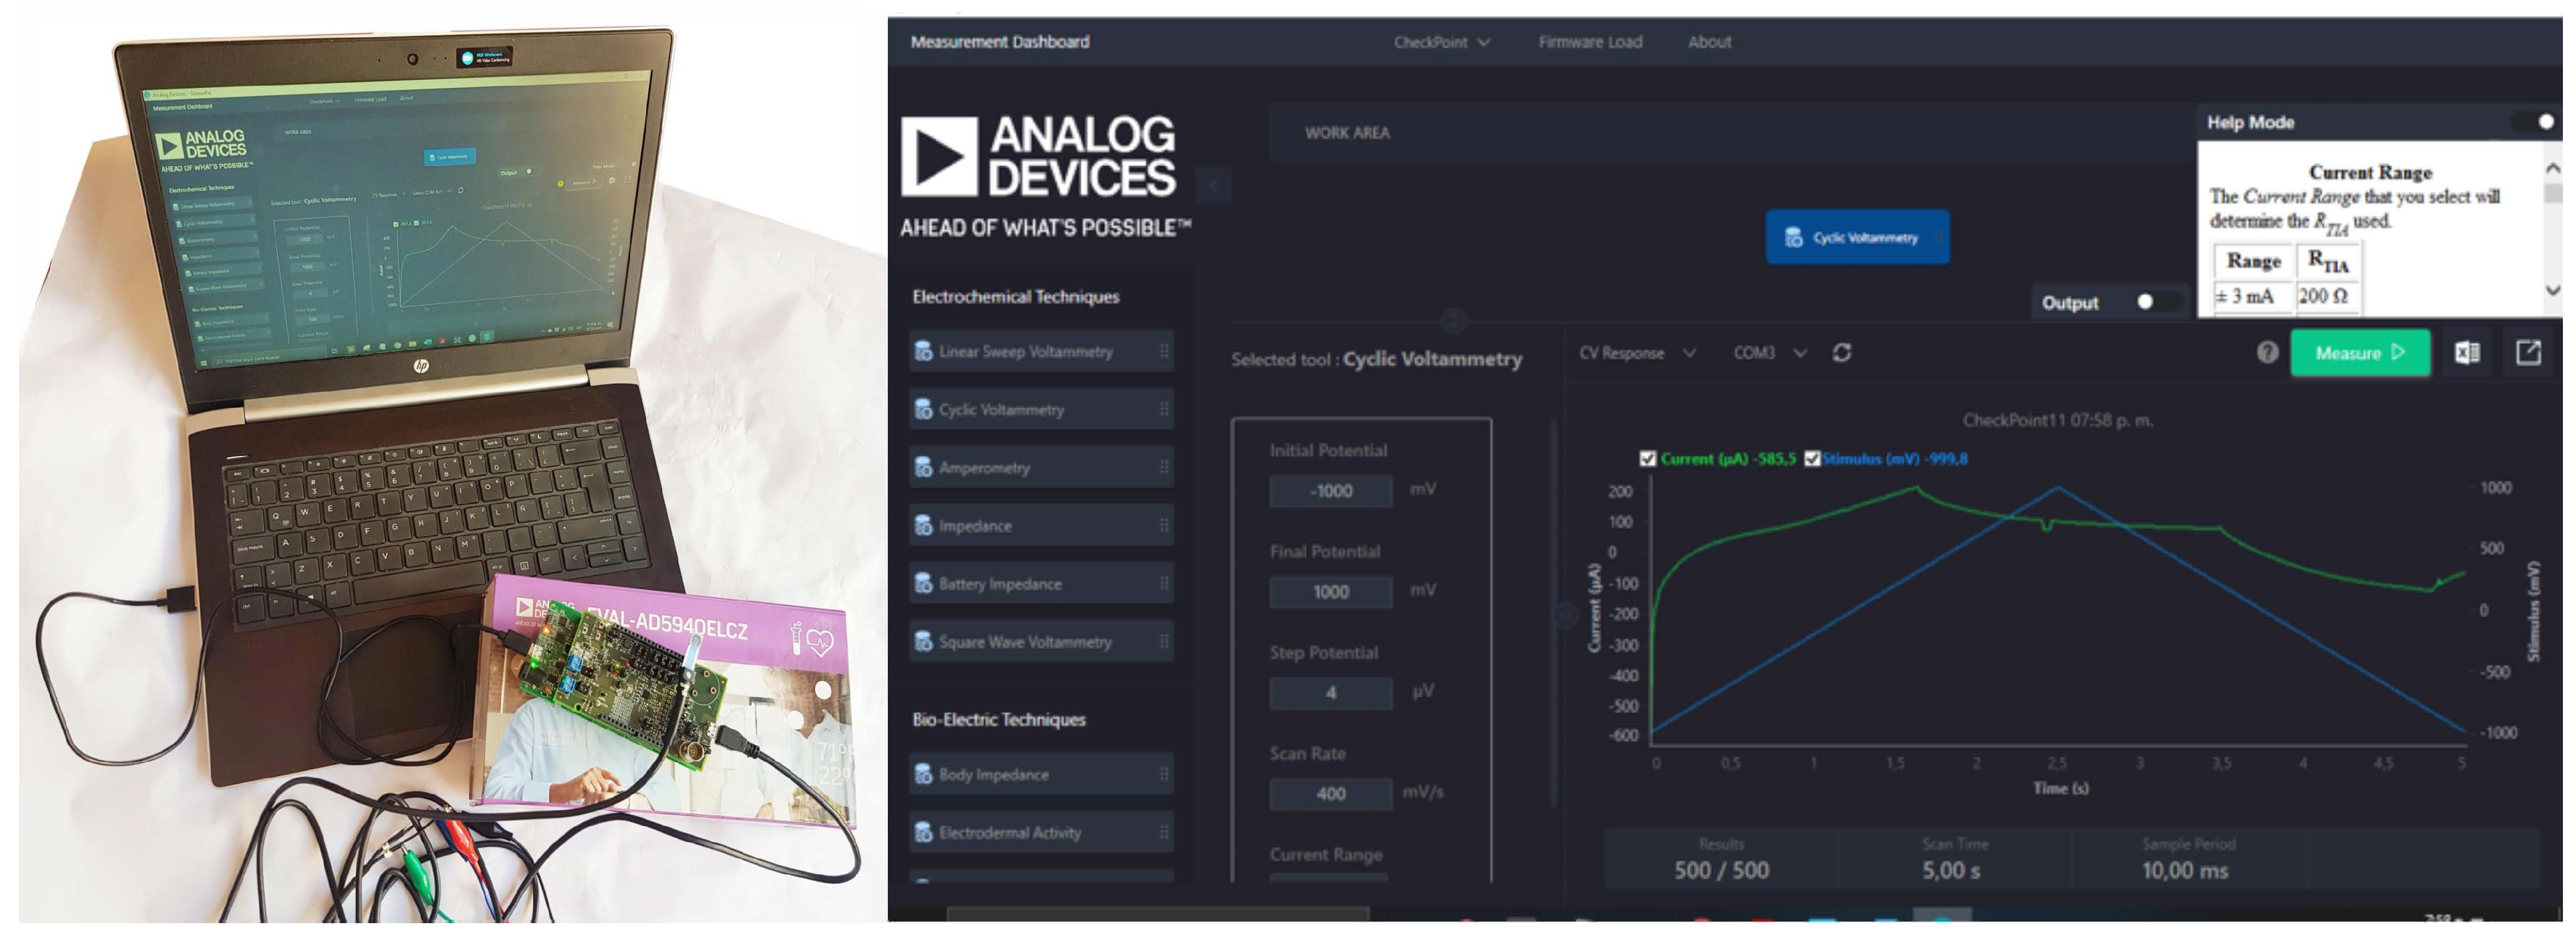
Figure 1. (Left) Integrated electronic tongue system: Computer with Sensor Pal software, USB cable to the EVAL-AD5940ELCZ and EVAL-ADICUP3029 attached boards, colored crocodile cable, sensor connection cable and SPE Sensor. (Right) Cyclic voltammetry test in Sensor Pal software from Analog Devices, blue line represents the excitation ramp signal, while the green line shows the response signal.
Chemproc 05 00056 g001
Figure 2. (Left) Cyclic voltammograms obtained by platinum and graphite sensors in experiment # 2 on juice # 2 (green apple). (Right) Cyclic voltammograms obtained by platinum and graphite sensors in experiment # 5 on juice # 3 (red fruits).
Chemproc 05 00056 g002
Figure 3. (Left) Example of unfolded signal of the cyclic voltammograms obtained by the platinum and graphite sensors. (Right) Three-dimensional scatter plot for the first three dimensions obtained using the LLE method on the juice data set.
Chemproc 05 00056 g003
Figure 4. Behavior of the classification accuracy obtained by each manifold learning algorithm used in the data set of commercial fruit-based products. The target dimension was set at d = 9 in all cases. (a) Laplacian Eigenmaps, (b) LLE, (c) Isomap y (d) t -SNE.
Chemproc 05 00056 g004
Figure 5. Confusion matrix for the juice data set obtained using 9 target dimensions of the LLE algorithm. The classification accuracy is equal to 80%.
Chemproc 05 00056 g005
Table 1. Description of the type of juice in the dataset registered with the EVAL-AD5940ELCZ potentiostat.
IDJuiceNumber of Samples
1BICHES FRUITS5
2GREEN APPLE5
3RED FRUITS5
4PASSION FRUIT5
5ORANGE5
Table 2. Parameters used in cyclic voltammetry tests to obtain the juice data set.
ParametersValue
Initial potential−1000mV
Final potential1000mV
Potential step4 μ V
Scan rate500mV/s
Current range±450 μ A
Calibration resistance12,000 Ω
Load resistance100 Ω
Table 3. Classification accuracy behavior of each dimensionality reduction method when varying the number of dimensions at the input of the k-NN classifier algorithm for the classification of 5 different commercial fruit-based products.
DimensionPCALaplacianLLEIsomapt-SNE
20.12000.20000.12000.16000.1600
30.08000.36000.16000.08000.0400
40.12000.32000.24000.12000.2000
50.16000.20000.24000.12000.3200
60.16000.20000.60000.24000.2000
70.16000.20000.48000.24000.0800
80.16000.20000.76000.24000.1600
90.16000.24000.80000.16000.0800
100.16000.20000.68000.20000.1600
110.16000.20000.64000.16000.2800
120.16000.24000.64000.16000.2800
130.16000.36000.68000.16000.1600
140.16000.36000.72000.16000.2400
150.16000.36000.64000.16000.2400
160.16000.36000.64000.16000.1600
170.16000.36000.64000.16000.2400
Publisher’s Note: MDPI stays neutral with regard to jurisdictional claims in published maps and institutional affiliations.