Next Article in Journal
Validation of Spent Coffee Grounds as Precursors for the Development of Sustainable Carbon Dot-Based for Fe3+ Optical Sensing
Previous Article in Journal
Graphene Nanoflakes Incorporating Natural Phytochemicals Containing Catechols as Functional Material for Sensors
 
 
Correction published on 19 March 2024, see Chem. Proc. 2021, 5(1), 92.
Proceeding Paper

Numerical and Experimental Modeling of Paper-Based Actuators †

Microfluidics Laboratory, Department of Mechanical, Industrial and Systems Engineering, University of Rhode Island, Kingston, RI 02881, USA
*
Author to whom correspondence should be addressed.
Presented at the 1st International Electronic Conference on Chemical Sensors and Analytical Chemistry, 1–15 July 2021; Available online: https://csac2021.sciforum.net/.
Chem. Proc. 2021, 5(1), 15; https://doi.org/10.3390/CSAC2021-10468
Published: 30 June 2021 / Corrected: 19 March 2024

Abstract

:
Microfluidic paper-based analytical devices (μPADs) have witnessed a great extent of innovation over the past decade, developing new components and materials assisting the diagnosis of different diseases and sensing of a wide range of biological, chemical, optical, and electrochemical phenomena. The novel paper-based cantilever (PBC) actuator is one the major components that allows autonomous loading and control of multiple fluid reagents required for the accurate operation of paper-based microfluidic devices. This paper provides an extensive overview of numerical and experimental modeling of fluidically controlled PBC actuators for automation of the paper-based assay. The PBC model undergoing hygro-expansion utilizes quasi-static 2D fluid loaded structure governed by the Euler–Bernoulli beam theory for small and moderately large deflections. The solution for the model can avail the response of paper-based actuators for response deflection θ, within 0° to 10° under the assumption of insignificant cross-sectional deformation. The actuation of PBC obtained using a quasi-static theory shows that our results are consistent with quantitative experiments demonstrating the adequacy of models.

1. Introduction

The first usage of paper as a substrate material goes back to the early 1800s with litmus paper, the oldest form of pH indicator, for analytical testing of chlorine and carbonic oxide [1]. Developed by Müller and Clegg [2], the first microfluidics channel on filter paper was utilized to elute a mixture of pigment. However, in 2007, the Whiteside’s Group of Harvard University gave a new push to the endless possibilities of paper-based microfluidics by introducing a patterned paper as a platform for portable devices [3]. Due to the several benefits of paper for making microfluidic paper-based analytical devices (µPADs), it has attracted extreme attention. Paper is a very cheap and renewable material since it is made of cellulose, the most abundant organic polymer on Earth, and it is also biocompatible and can be used for numerous biological and chemical applications [4,5]; thanks to capillary forces, an external force is not needed for fluid transport in paper.
Paper-based microfluidic devices are made up of different sections that serve different purposes. The simpler devices generally have a sample port, transport channels, reaction zones, and a detection zone. Devices that perform more complex reactions or enzyme-linked immunosorbent assay (ELISA) protocols require proper sample timing and control as it flows into the different reaction zones. Such control is usually achieved by the use of a suitable valving system in the device.
Different valving systems have been developed for use in paper-based microfluidic devices. Some of these valving systems were simple, autonomous and required little-to-no operator input while others required some operator involvement or an external power source to operate. Li et al. [6] reported a method to stop and to promote wicking by manually separating and re-joining two paper channels using a sliding separator or a switch valve. Jahanshahi-Anbuhi et al. [7] utilize the switch valve, which they refer to as a flap, in a paper-based sensor for the detection of pesticides. Han et al. [8] built on the concept and created a 3D slip-PAD in which the operator connects the different fluidic channels by manipulation of the cartridge that holds the paper-based device. Martinez et al. [9] reported on a press valve in a multilayer paper-based device that had small gaps between the paper layers which were created by the finite thickness of the tape in between the layers. The operator would need to press the buttons to mechanically bridge the discrete channels to promote wicking. Rodriguez et al. [10] and Jayawardane et al. [11] utilized discarded separators in their devices that would be removed after a predetermined amount of time to connect appropriate fluidic channels. Noh et al. [12] and Lutz et al. [13] provided designs for metering valve systems that were based on paraffin wax and dissolvable sugar, respectively. While this valving system is cheap, controls the flow rate and requires no operator input, it suffers from the fact that it can only impede the flow rate of the sample without completely stopping it until it is required to move to the next section of the device. Chen et al. [14] and Gerbers et al. [15] developed novel autonomous two- and three-dimensional microfluidic valves involving no external actuation based on altering the hydrophobicity of a multilayered structure by means of a surfactant. With this technique, they were able to control the order and mixing time of the sample and multiple reagents autonomously. However, these valves required long response times and large volumes of actuation fluids. Lai et al. [16] provided a design for a timing valve in their device that consisted of a surfactant and a wax barrier to provide appropriate time delays to sequentially handle the multiple fluidic operations of the device. Koo et al. [17] used an electrowetting valve in which a dielectric material that is normally hydrophobic, is polarized and becomes hydrophilic when the valve is actuated with an applied potential difference. Li et al. [18] developed a magnetic valve with the use of a blend of ferromagnetic nanoparticles and polydimethylsiloxane that magnetized the paper cantilever. Although the operation of the magnetic valve was autonomous, it required an applied potential to actuate the cantilever. Phillips et al. [19] used a thin-film electric heater to thermally actuate a wax valve to pass or block the flow of the sample. Kong et al. [20] reported actuators based on selective wetting of folded paper strips. These strips reduced the actuator’s response time to within two seconds from wetting, while utilizing a very small volume of actuation fluid in the order of four microliters. Toley et al. [21] developed a valving toolkit that utilized an expanding element, which was a compressed sponge valve, to control the flow of the fluid in the device. Fu et al. [22] developed a thermally actuated cantilever valve that utilizes a shape-memory polymer.
This paper provides an overview of the behavior of a fluidically controlled paper-based cantilever (PBC) for the automation of a paper-based assay that is exploited in a fluidic circuit to sequentially load several reagents to the analyte detection area. For this purpose, first a simple paper-based cantilever (PBC) will be modeled. Different scenarios for using the cantilever will then be presented. Finally, a mathematical model will be developed for better understanding of the model and for comparing with the experimental results.

2. Methods

A fluidic circuit is used to conduct complex immunoassay to sequentially load two or more additional reagents in addition to the sample fluid. Once a user pipettes a certain amount of sample fluid on the sample port of the paper-based cantilever, as the sample fluid transfers to the free end of the PBC due to the capillary force, and hence, the hygro-expansion of cellulose fibers, the cantilever starts to bend downward and contacts the stationary component within several seconds. This paper incorporates experimental, analytical and numerical methods for analysis and the results from different methods were compared to check for adequacy of the model.

2.1. Materials

The following materials were used in preparing, fabrication, and testing the cantilever valves used in this study. Filter paper (GE Healthcare Whatman grade 4—1004917 & grade 41—1441866), chromatography paper (GE Healthcare Whatman 1—3001878), deionized water, and food coloring (Wilton Icing Colors). The stationary component was a 1 × 1 cm chromatography paper. The dimensions of the cantilevers were using a vector graphics software (CorelDraw X6). The cantilevers were then cut out from paper, in the cross-machine direction, using a laser engraver (Epilog mini 40W). An 8-megapixel video camera with 30 frames per seconds capability was used to record the actuation of the cantilever valve. A media player (Avidemux) was used to playback the recording and collect the data.

2.2. Modeling

2.2.1. Concept of Design

Single Cantilever Design

The design of the single cantilever device comprises a paper-based cantilever, reagent pad, stationary structure and a support structure. Figure 1 demonstrates the single cantilever design of PBC in two conditions (unloaded and loaded). The PBC remains in a normally open position with the separation distance ‘d’, until the sample fluid is loaded. Upon loading with sample fluid, the PBC absorbs the sample fluid though wicking and the actuator activates and results in deflection, as shown in Figure 1, resulting in the transfer of sample fluid to the reagent pad.

Double Cantilever Design

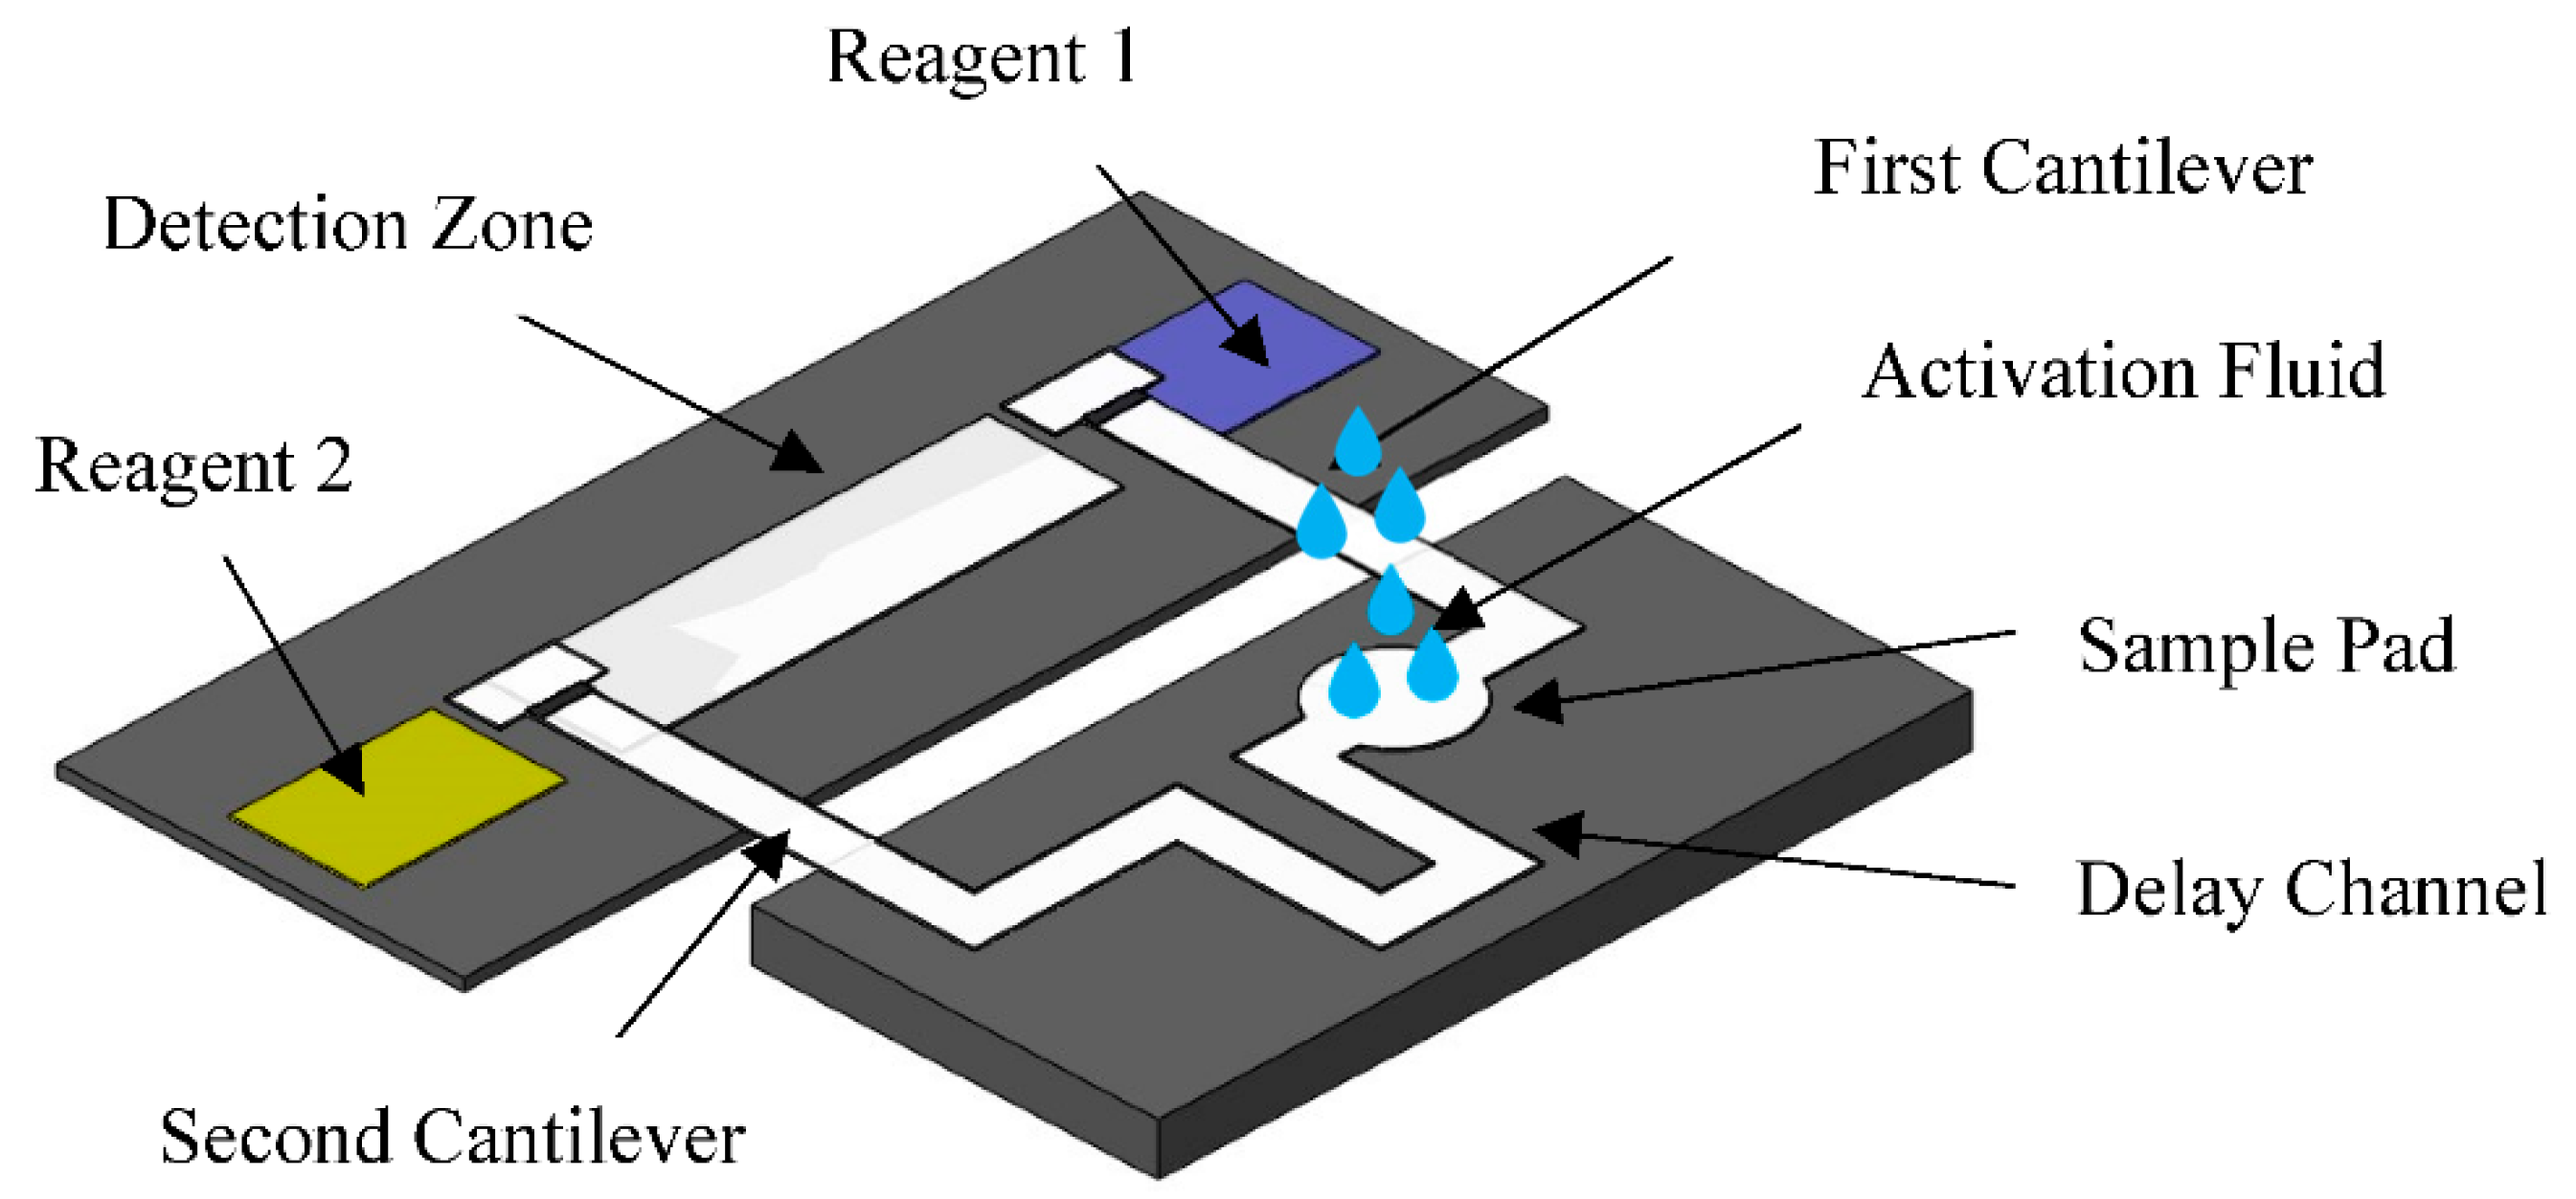
In the double cantilever design, two cantilevers are utilized to allow for the sequential loading of reagents into an area of interest on the paper-based device. Figure 2 shows the diagram of the double cantilever design and Figure 3 shows the sequence of operation for this architecture. The operation of this device is fairly simple; first, the user just needs to pipette a certain amount of activation liquid (e.g., DI water) on the sample pad initiating the actuation of the cantilever on the right, shortly after the addition of the activation fluid, as seen in Figure 3b. This permits the flow of the reagent on the righthand side into the middle section of the device to react with any chemicals dried there. In the meantime, part of the activation fluid is flowing through the timing channel to the left and activates the second cantilever after a predetermined duration of time, as seen in Figure 3d. This connects both zones and thus enables the passage of the reagent on the left into the area of interest to react with the material there, as seen in Figure 3e.

2.2.2. Experimental Model

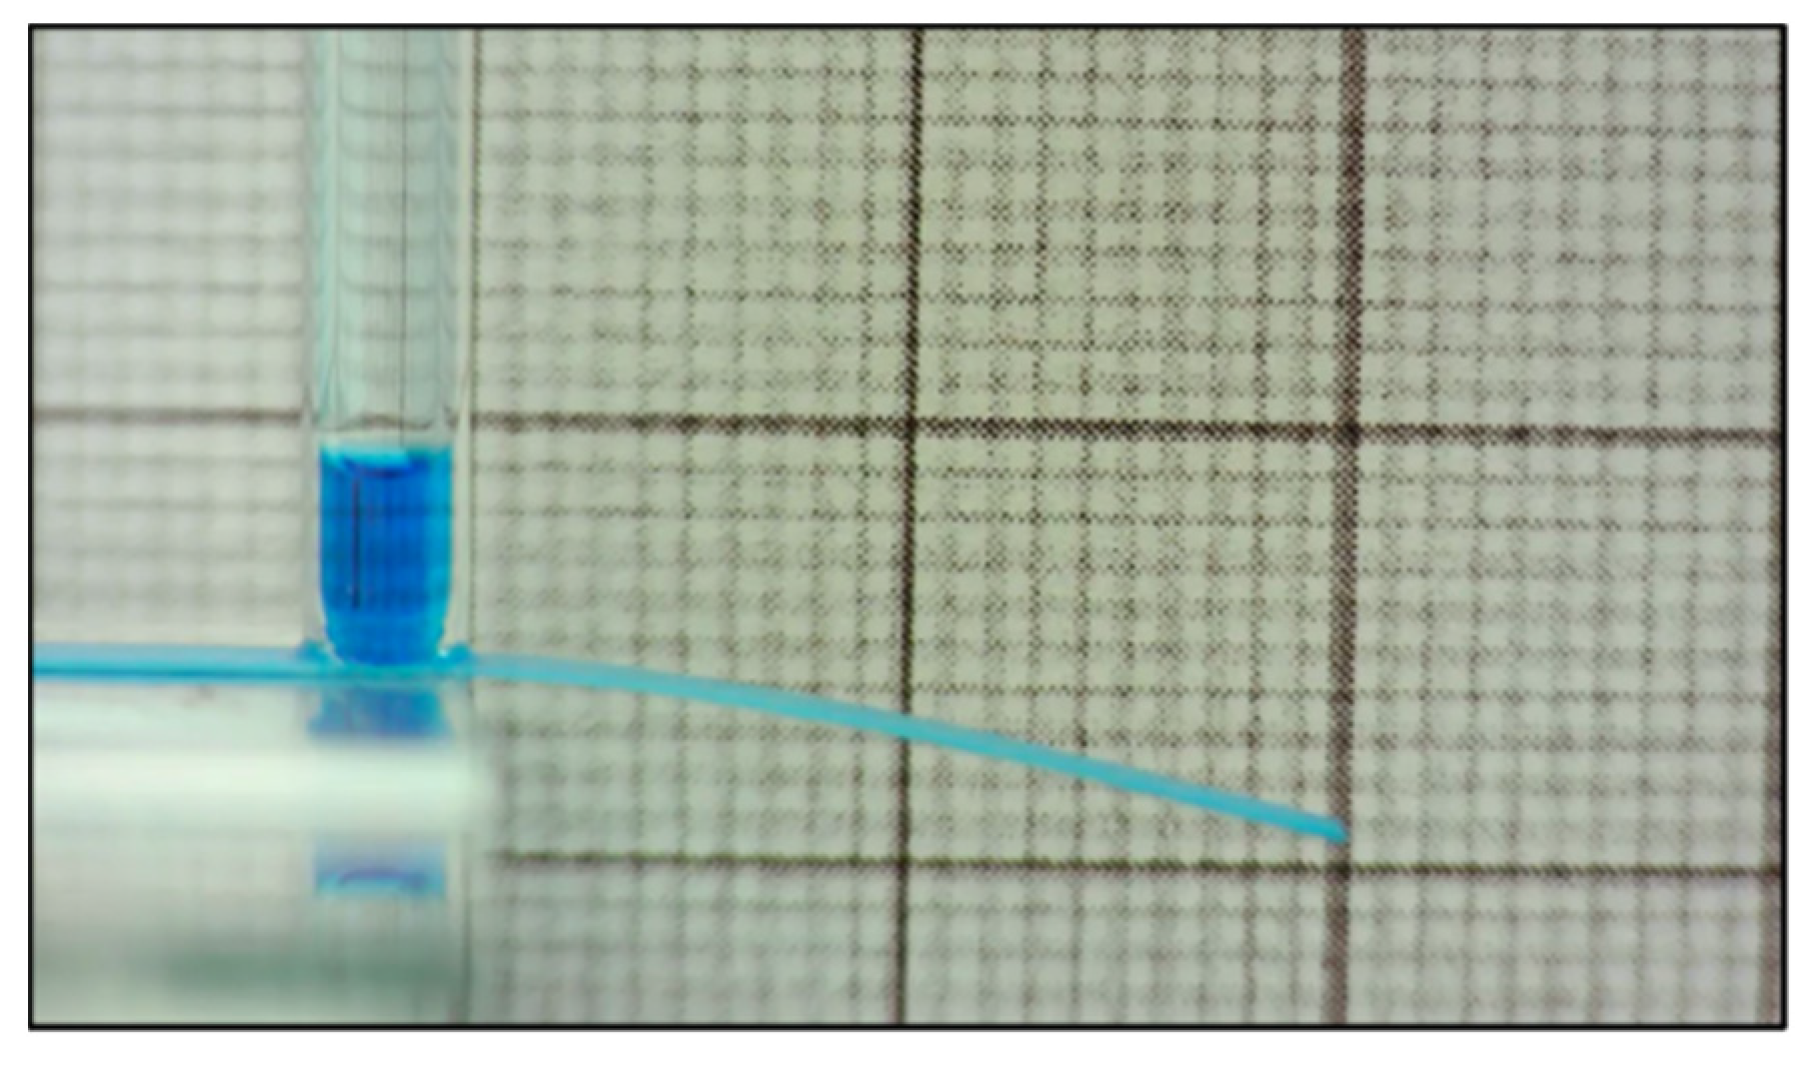
A picture of the experiment is shown in Figure 4, consisting of PBC and a capillary tube to load the fluid and obtain the response deflection.
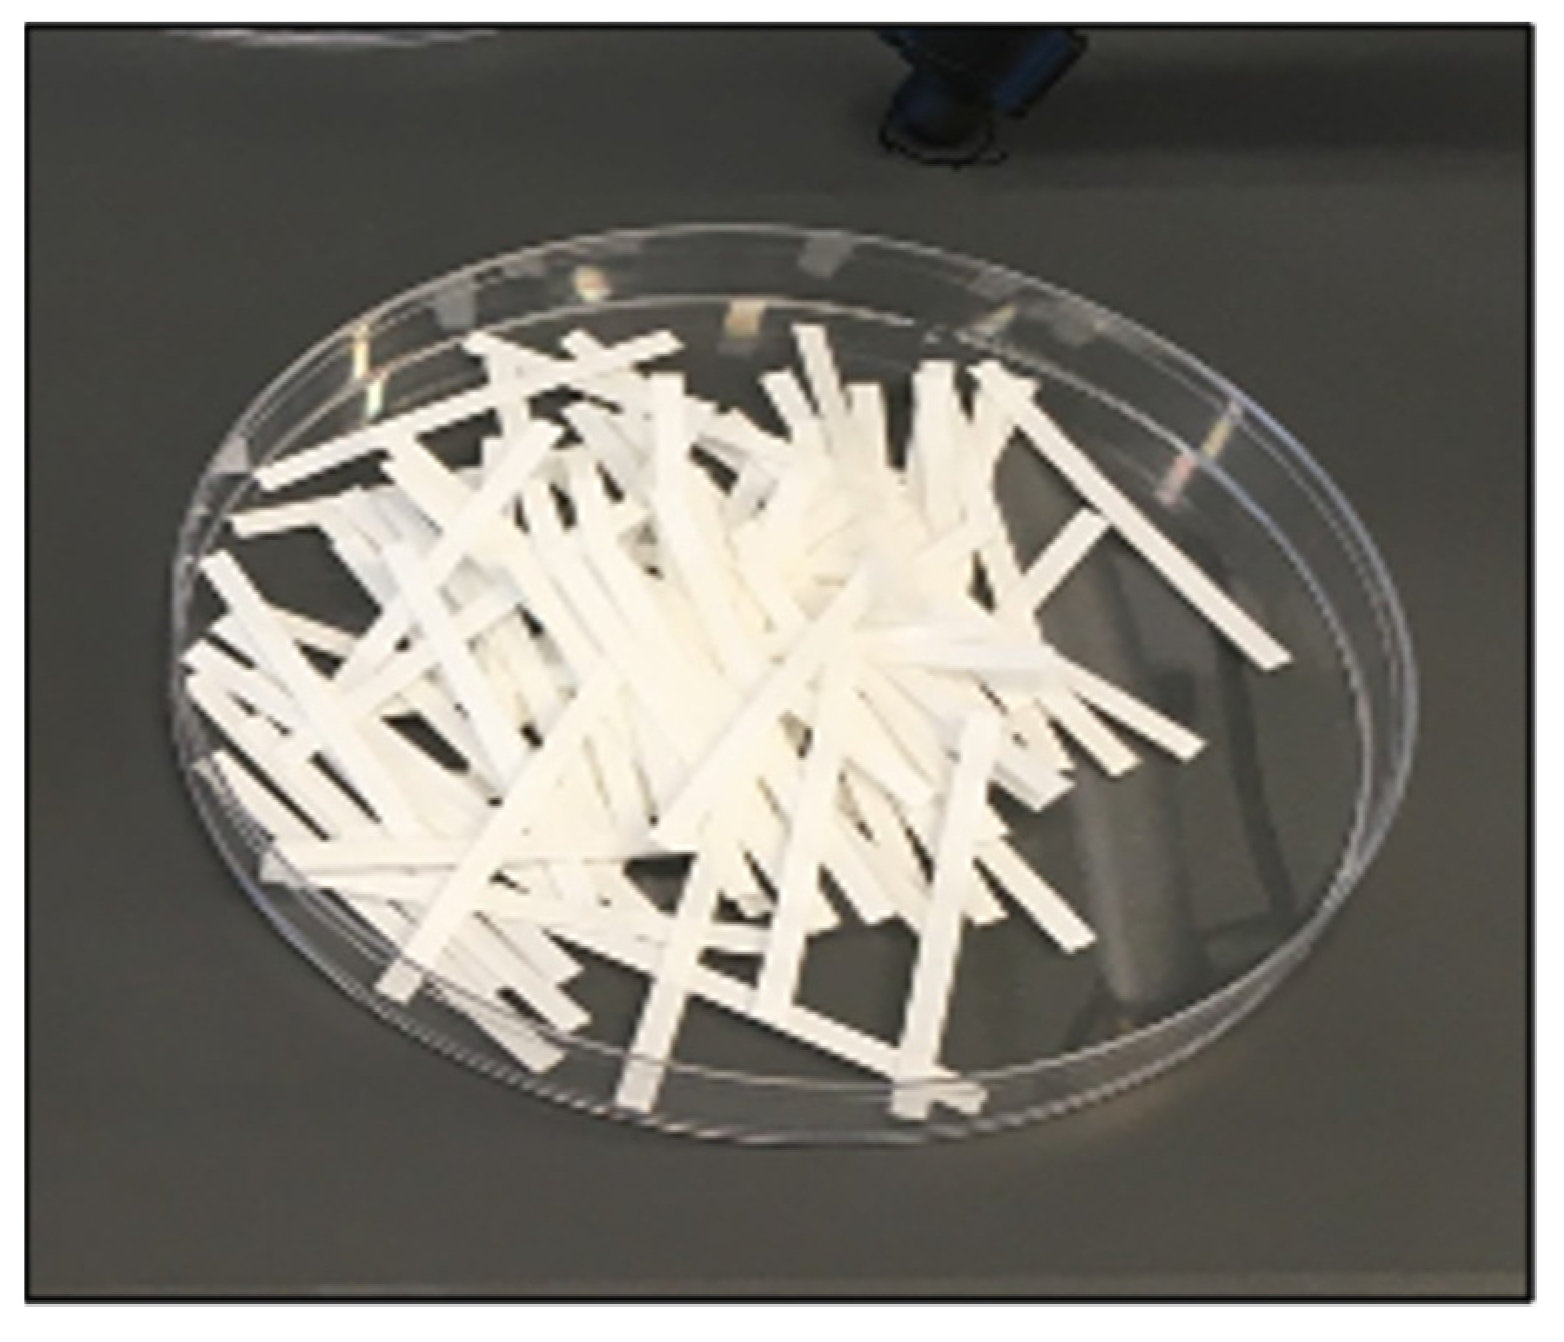
In order to measure the deflection of the PBC, Whatman grade 41 filter paper was selected. The filter paper was cut in the cross-machine direction with a 4 mm width and a 40 mm length using an Epilog Mini laser engraver. The picture of samples for PBC can be seen in Figure 5.
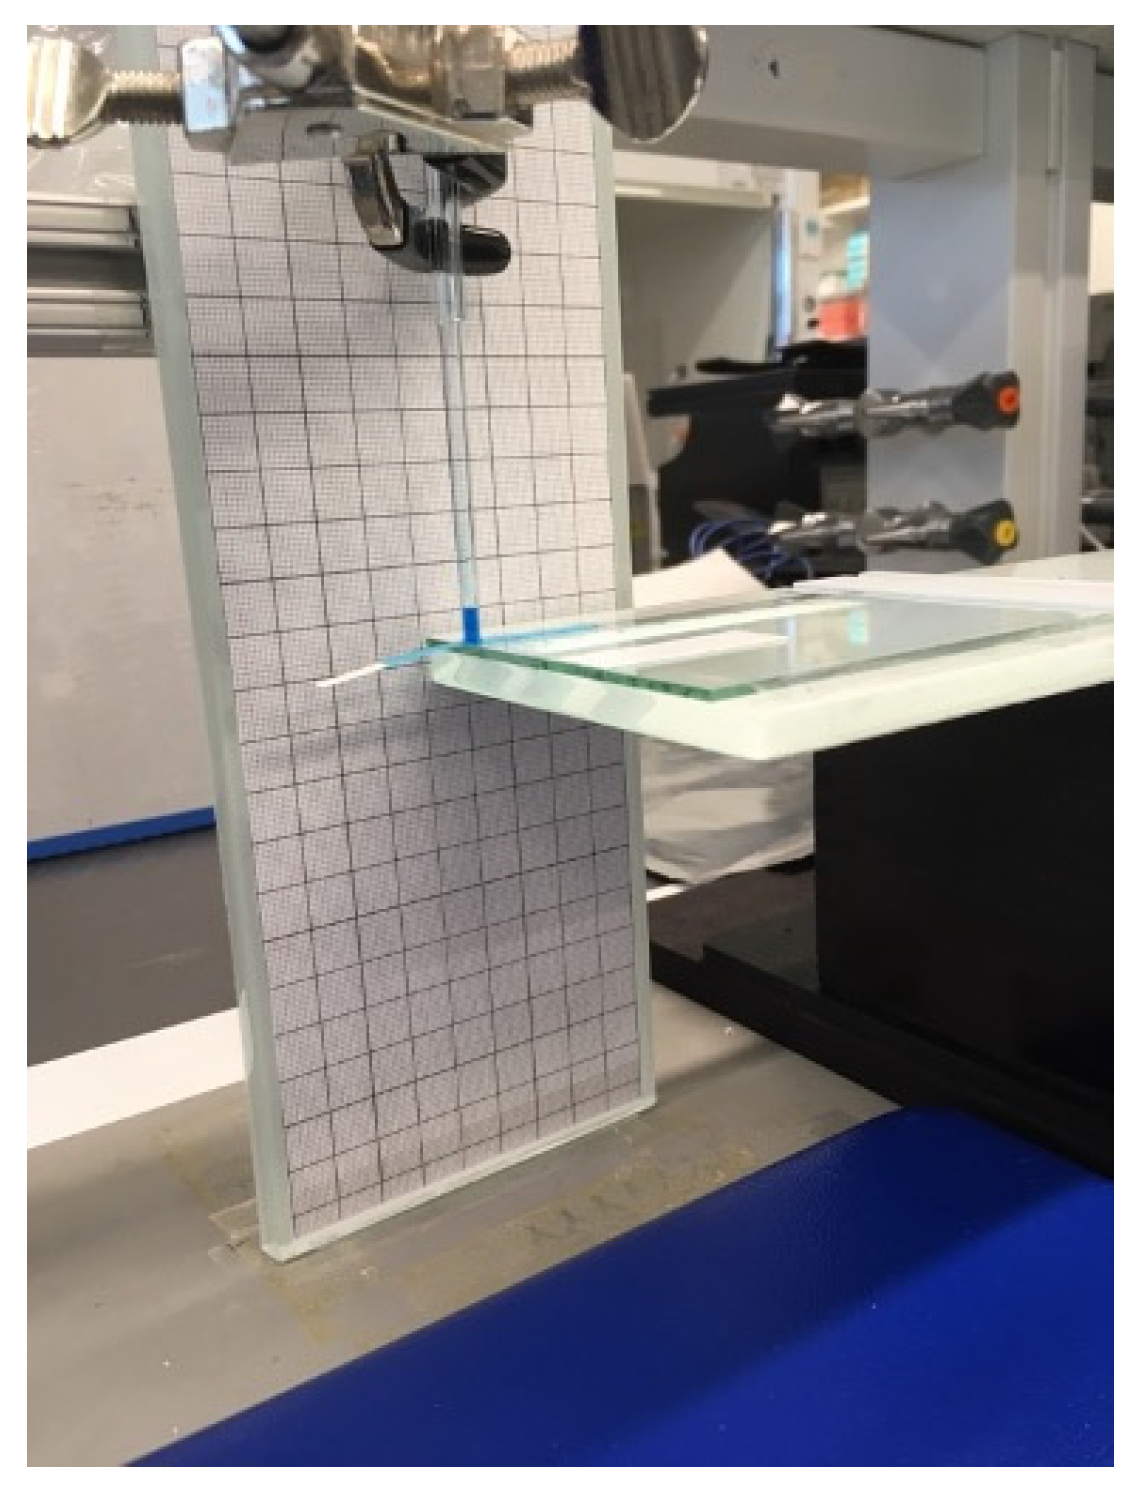
A 2 mm in diameter capillary tube was used to introduce fluid into the PBC. A fixture for the position of PBC and capillary was designed and utilized to reduce the uncontrollable error of running experiments (Figure 6).

2.2.3. Mathematical Model

This paper models the response of PBC on the fluidic loading of the paper-based cantilever. The PBC undergoes hygro-expansion when exposed to fluid, which results in the actuation of the cantilever. The mathematical modeling of the PBC determines the response deflection, the Euler–Bernoulli beam theory will be used with the assumption that the cross-section remains normal to the axis of the cantilever deflection and that cross-sectional deformation is not significant.

Modeling of Flow in Paper

The capillary model is adapted to simulate the flow in paper for this experiment. This model will be utilized to develop an analytical expression for fluid imbibition into paper due to capillary action. According to the Washburn equation [23]:
L w = R γ cos θ 2 η t
where, LW—wetted length, R—pore radius, γ—the surface tension of the liquid, t—the time taken for liquid to seep into the capillary, θ—the contact angle of liquid on the capillary walls and η—the viscosity of fluid.

Modeling of PBC

The quasi 2D fluid structure mode is adapted for analysis. Geometry is inspired by the bending of the paper-based cantilever when exposed to fluid. Cantilever actuation is considered as the system output defined by fluid loading, please refer Table 1 for parameters.
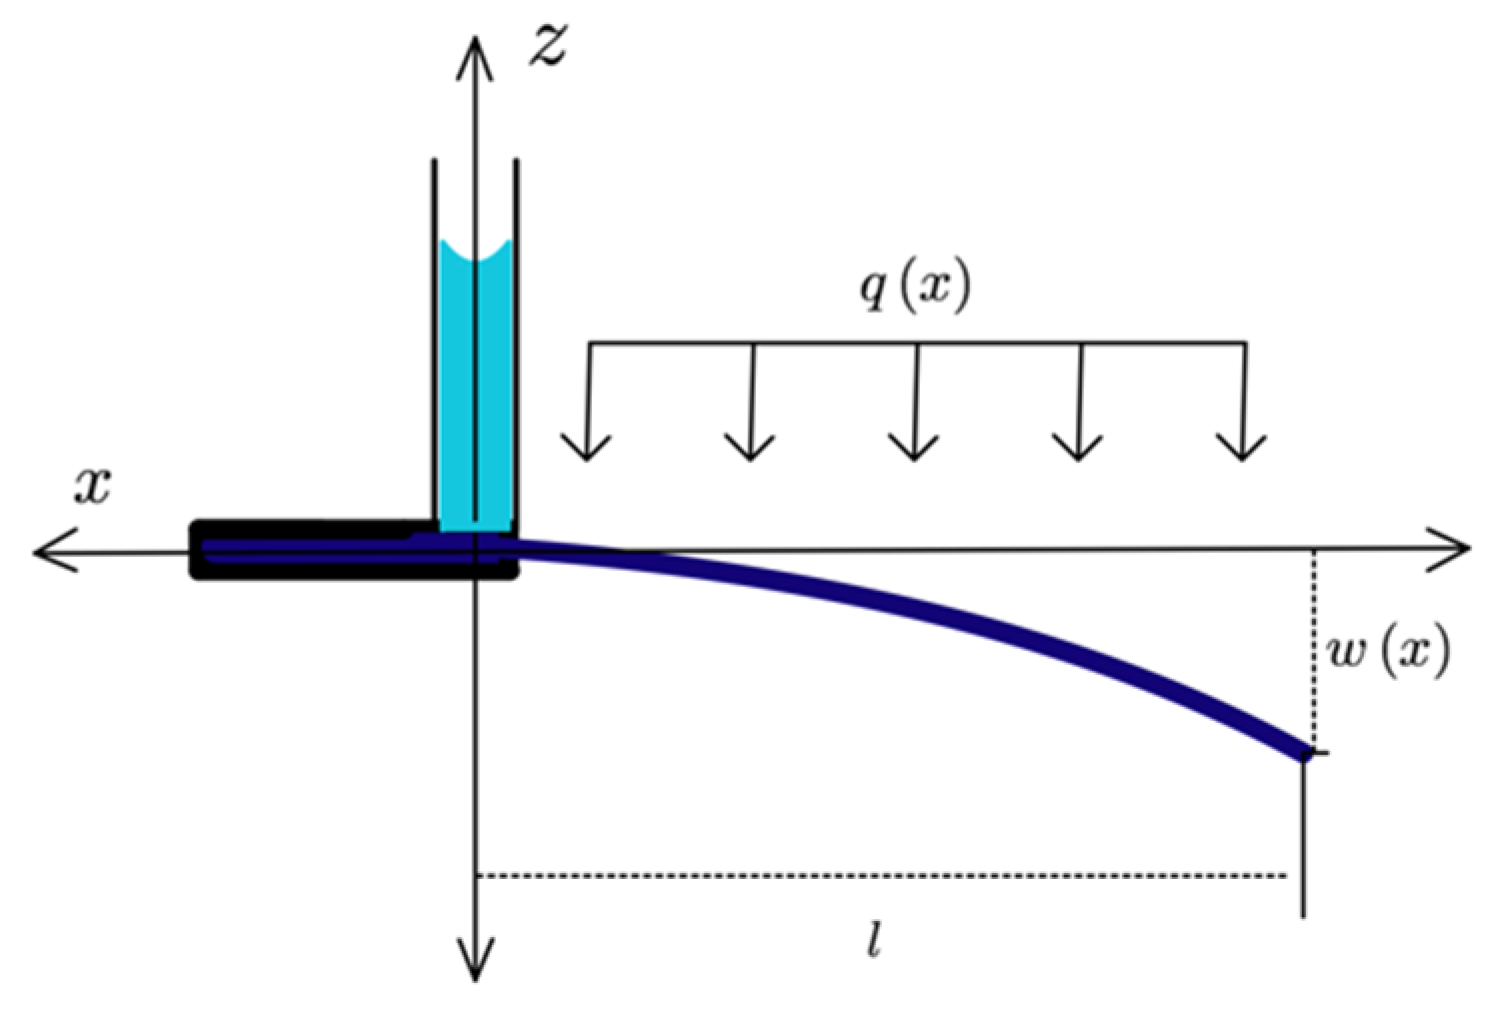
Consider the PBC with a uniform rectangular cross-section loaded by a water column, as shown in Figure 7. Moderately large static deflection (Appendix A) of PBC is governed by equation [24],
E I d 4 w d x 4 + N d 2 w d x 2 + q = 0
where, E—Young’s modulus of the wet paper, I—second moment of inertia, N—internal (axial) stress in PBC and q—auxiliary loading is the equivalent transverse loading resulting in the same deflection of the PBC.
Internal (axial) stress in PBC is given by,
N = E A ϵ
where, A—cross-sectional area of PBC and ϵ– membrane strain (due to hygro-expansion and rotation of PBC) [25].
The auxiliary loading of PBC is given by,
q = ρ g ( V f l )
where, Vf —volume of fluid imbibition into PBC.
Substituting the above equation to governing Equation (2) we get,
w I V + λ 2 w I I = Q
where,
λ = l N E I
Q = ρ g ( V f l ) E I
In the above equations, λ and Q are parameters associated with the type of paper and fluid used for experiment respectively.
In order to solve Equation (2) uniquely, four boundary conditions are required. A four combination of in-plane boundary condition for PBC are given as, deflection: fixed-end x = 0, w ( x ) = 0 ; slope: fixed-end x = 0,   w I ( x ) = 0 , slope; bending moment: free-end x = l, w I I ( x ) = 0 ; shear force: free-end x = l, w I I I ( x ) = 0 .

Non-Dimensional Model of PBC

To get a better idea of the relative size of the terms, we need a non-dimensionalized Equation (5) as per Table 2.
Thus, the non-dimensional form of Equation (5) yields to,
w I V + λ 2 w I I = Q
The solution to the problems depends on a four combination of in-plane boundary condition for the non-dimensional model given as,
Fixed - end   x = 0 ,   w ( x ) = 0
Fixed - end   x = 0 ,   w I ( x ) = 0
Free - end   x = l ,   w I I ( x ) = 0
Free - end   x = l ,   w I I I ( x ) = 0
To summarize, Equation (8), together with boundary conditions, related the deflection, hygro-expansive stress and loading of PBC.

Solution for PBC

The problem is solved under the assumption of fixed-free end conditions, and the fluid load is distributed according to the square of wetted length as per the Washburn equation mentioned earlier. There is a considerable elastoplastic effect [26] of PBC response due to fluid imbibition.
In order to determine the deflection shape of the PBC, consider Equation (8). The roots of the characteristic equation are 0, 0, ±. Therefore, the general solution of the homogeneous equation is,
w g ( x ) = C 0 + C 1 x + C 2 c o s ( λ x ) + C 3 s i n ( λ x )
As a particular solution of the inhomogeneous equation,
w p ( x ) = C x 2
Substituting the above solution to the governing Equation (8), we get,
C = Q 2 λ 2 = 1 2 ( ρ g V f l N R g )
The general solution for Equation (4) is sum of the general solution of the homogeneous equation, and the particular solution of the inhomogeneous equation,
w ( x ) = w g + w p
There are four unknowns, and four boundary conditions as per Equation (4) for transverse deflection. The coefficients determined from boundary conditions are C 0 = C / 10 , C 1 = 4 C / 100 ,   C 2 = C / 10 ,   and   C 3 = 9 C / 1000 .
The general solution for deflection of PBC,
w g ( x ) = C 0 + C 1 x + C 2 c o s ( λ x ) + C 3 s i n ( λ x ) + C x 2

3. Results

3.1. Analytical Solution

Analytical solution for the problem is obtained by substituting the value of coefficients in Equation (17).
w g ( x ) = C 10 4 C 100 x + C 10 c o s ( λ x ) + 9 C 1000 s i n ( λ x ) + C x 2
Eliminating C between Equations (15) and (18), we get
w g ( x ) = Q 2000 λ 2 ( 100 cos λ x + 9 sin λ x + 1000 x 2 40 x 100 )
For the future reduction of the solution, typical values for the variables can be obtained from Table 3.
An output of MATLAB for the analytical solution for variable values is compatible with the information indicated in Table 3.

3.2. Numerical Solution

The numerical solution for the problem is obtained by using ODE function, an output from MATLAB for the analytical solution for the water and variable values are compatible with the information indicated in Table 3.

3.3. Comparison of Numerical and Analytical Solution

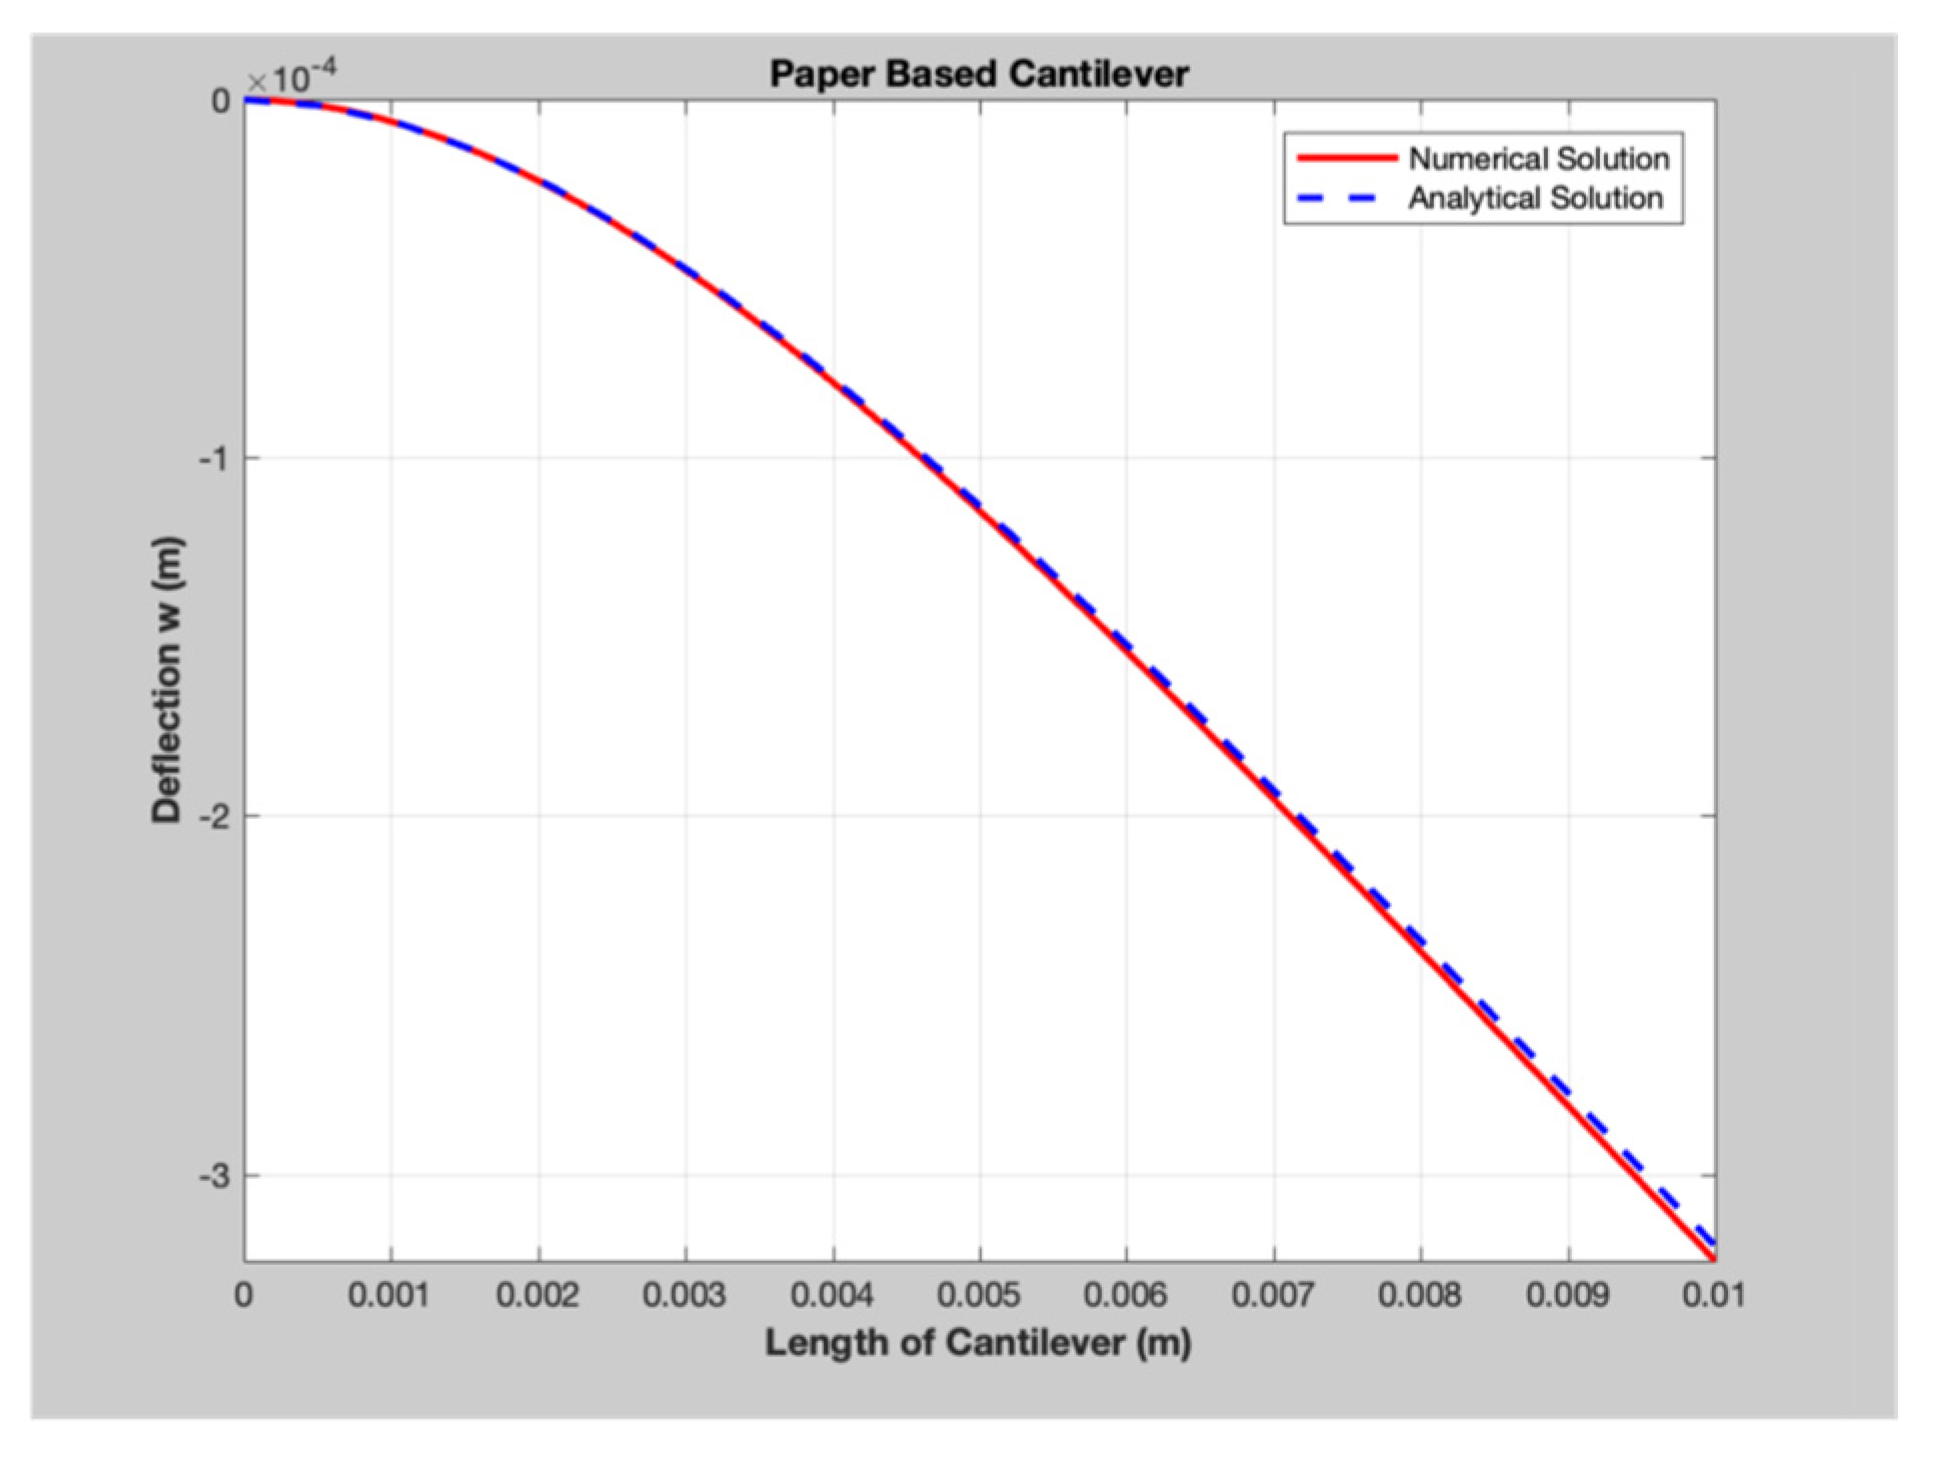
A comparison of the analytical and numerical solution is made in Figure 8, where the solid color and dash lines in plot represent analytical and numerical solutions, respectively.

3.4. Experimental Results

In order to validate the obtained results for the response deflection of the PBC, data for the maximum deflection and change in height of the capillary tube were obtained from the experiment, as presented in Table 4. The experiment was conducted with five replicas of PBC, fabricated at the Microfluidics Laboratory URI, to study the effect of fluidic loading on response deflection (actuation) of PBC.

3.5. Parametric Model

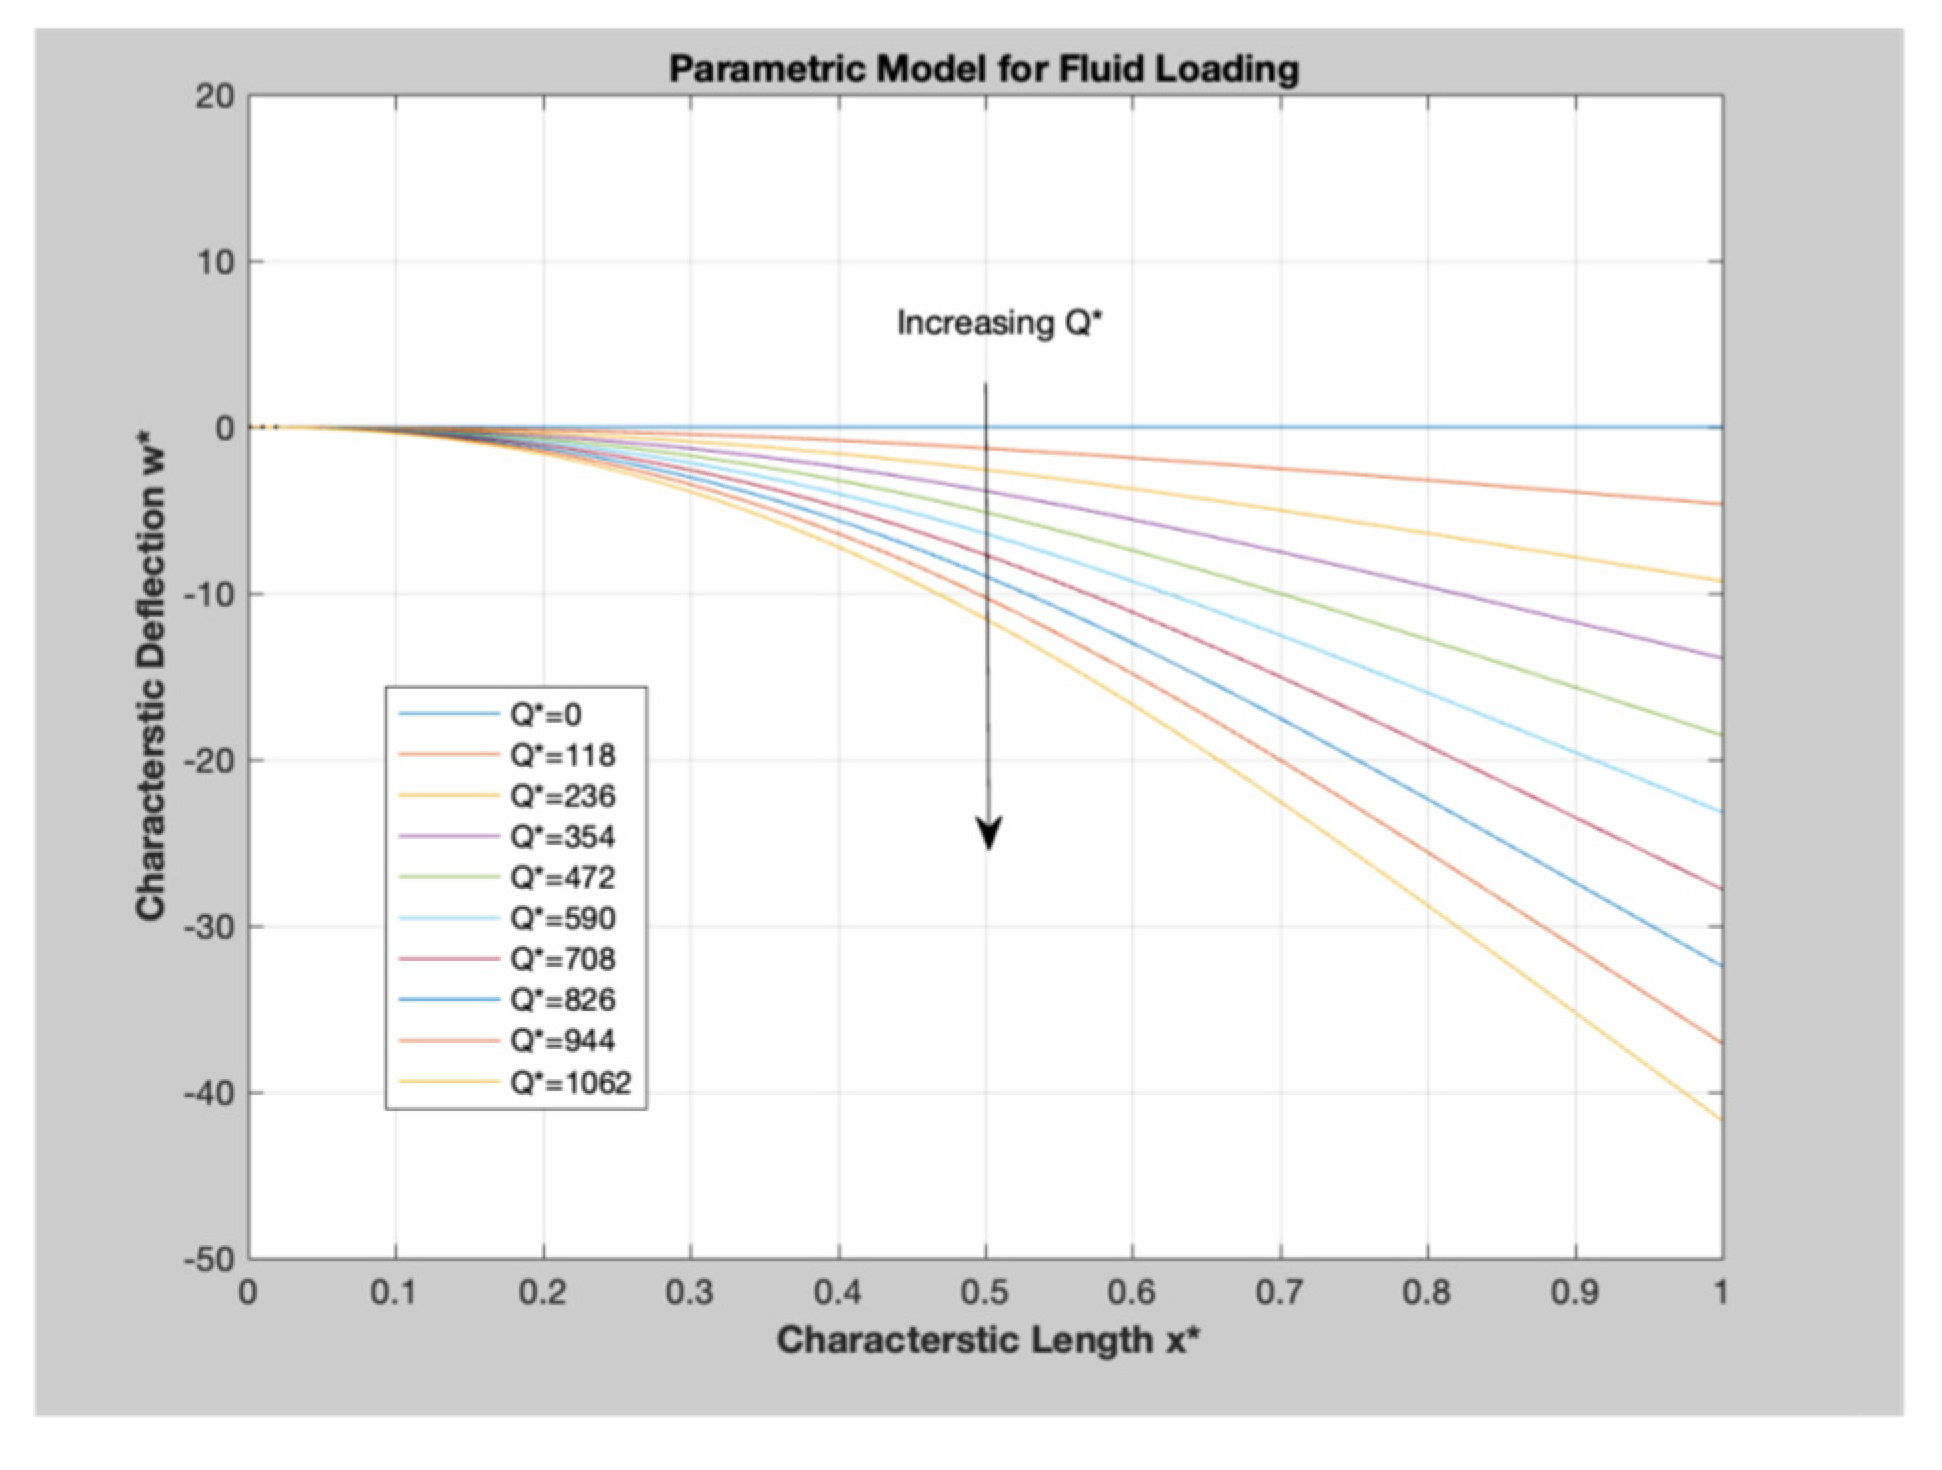
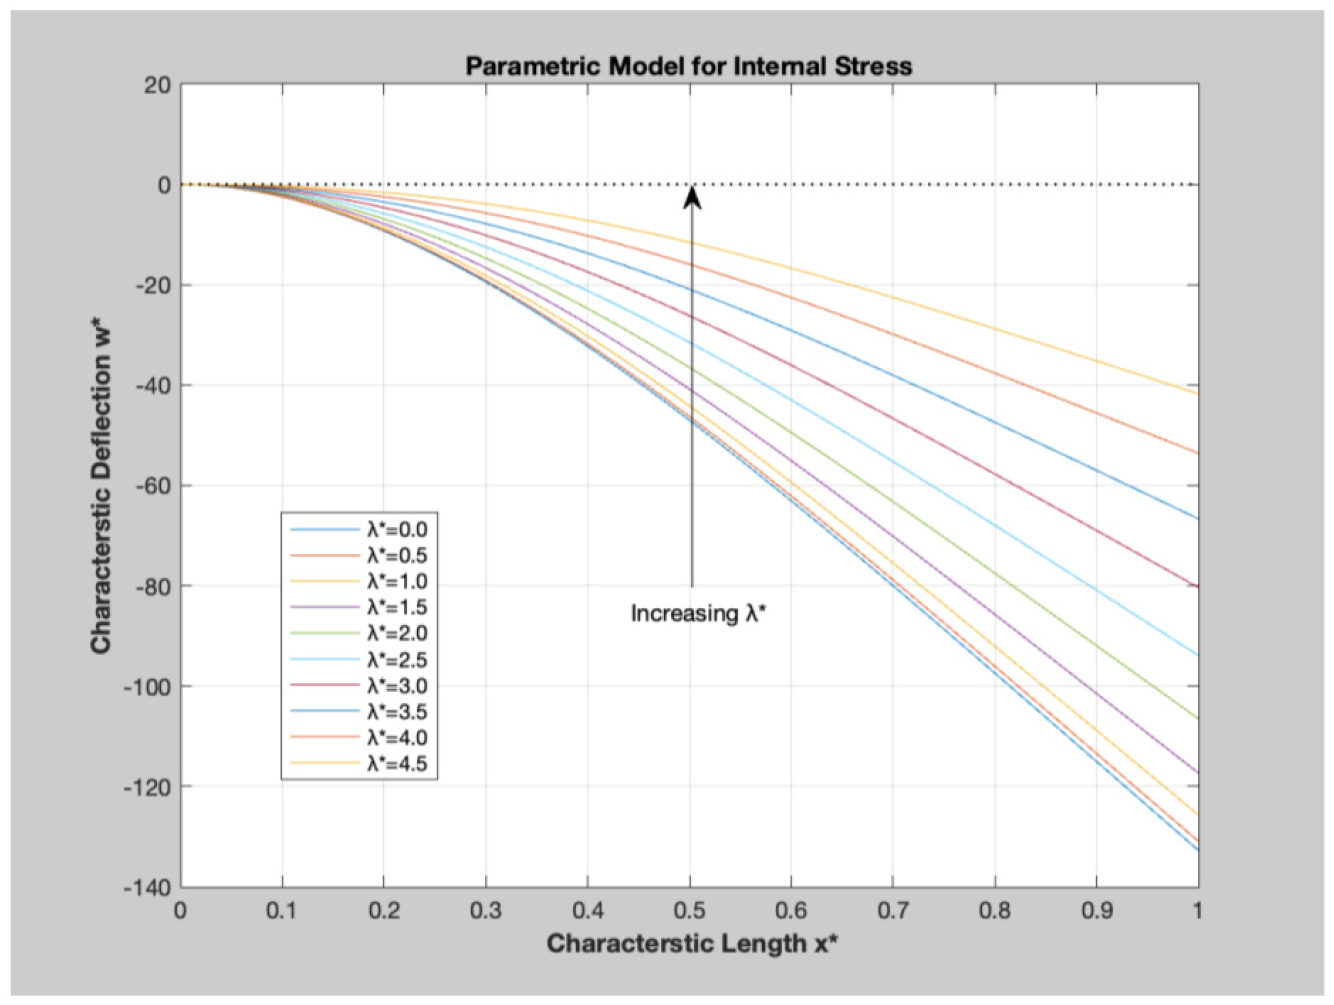
The parametric plots for the fluid (water) loading and internal (axial) stress are shown in Figure 9 and Figure 10, respectively.
Figure 9 displays the relationship between the characteristic length and response deflection of PBC for the increasing value of the fluid loading parameter, Q∗. Figure 10 displays the relationship between the characteristic length and response deflection of PBC for the increasing value of the internal stress parameter, λ∗.

3.6. Transverse Displacement of the Free end of PBC

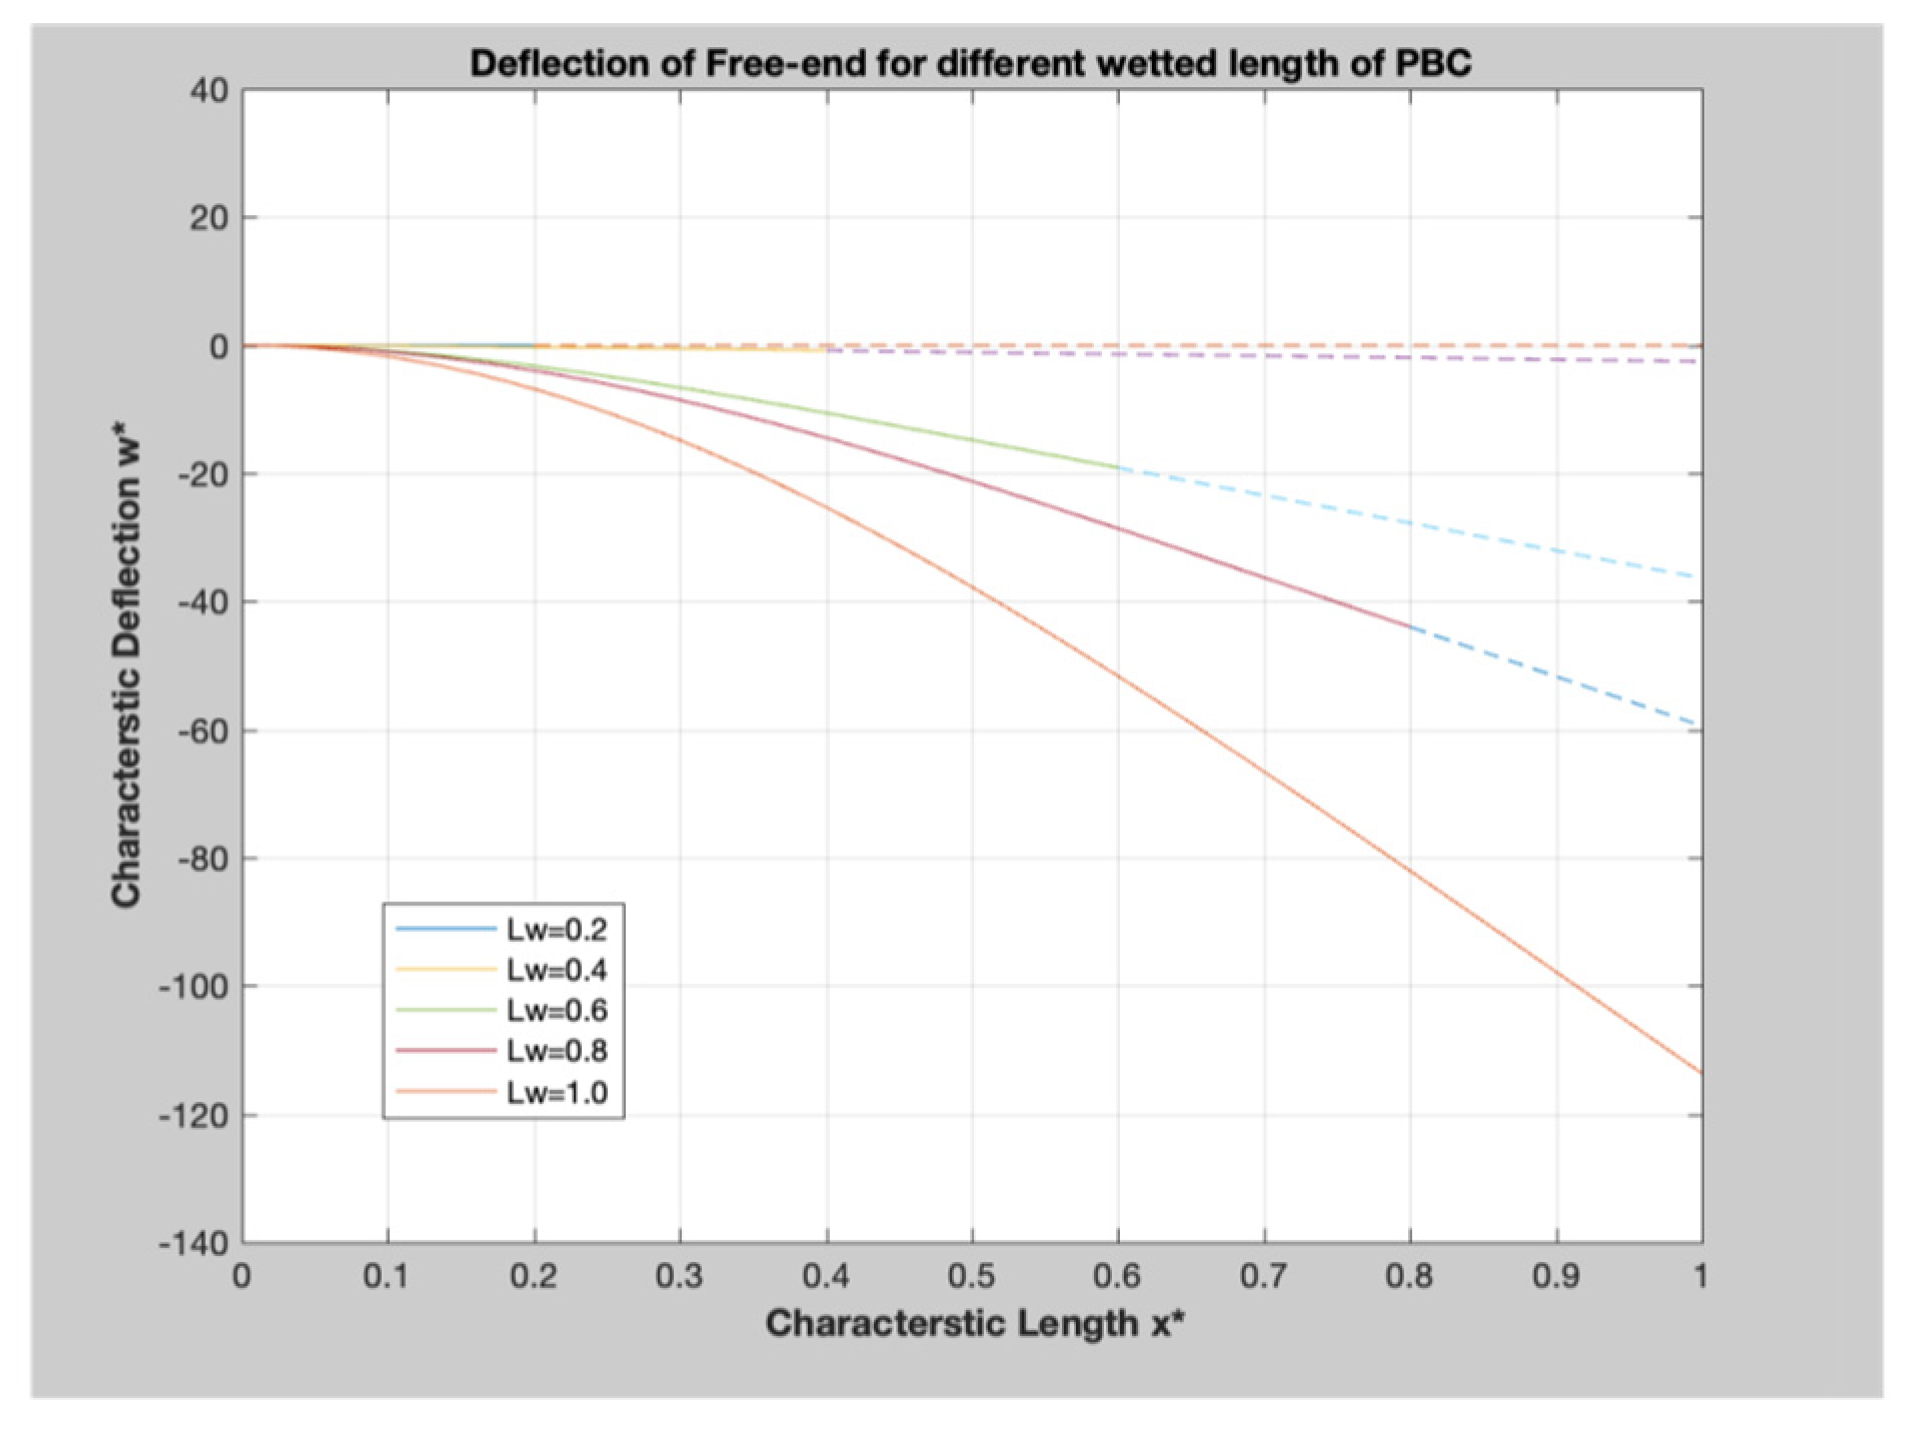
Figure 11 displays the relationship between the length of the cantilever response deflection of the free end of PBC for different wetted lengths.

3.7. Model Summary

The interpretation for the experiment mode is:
  • The response deflection of PBC results in identical values both analytically and numerically. The analytical solution is obtained by the use of an experimental value for maximum deflection, whereas the numerical solution is obtained by the use of the material property of PBC, obtained from Table 3;
  • Parametric model has been utilized to better understand the effect of fluid loading and internal stress on response deflection of PBC;
  • The Washburn flow model is utilized to govern the imbibition of fluid into PBC, and the plots of the response deflection of the free end is demonstrated in Figure 11.

4. Discussion

4.1. Summary of Solutions

The maximum deflection of PBC obtained from different models is found to be identical, i.e., 3.04 mm. Thus, the models are adequate and can be used to compare how the response deflection is affected by different fluid loadings.

4.2. Non-Dimensional Model

The non-dimensional model was utilized to compare the magnitude of deflection, fluid loading and internal (axial) stress for PBC. For color water loading, the maximum deflection is found to be around one order of magnitude larger than the internal stress, and more than two orders of magnitude smaller than the fluid loading. The other way to interpret the non-dimensional model is that 1000 units of water loading will induce 250 units of internal stress responsible for membrane strain and 25 units of maximum deflection at the free end of PBC.

4.3. Parametric Model

Comparison for response deflection of PBCs were carried out and the results are shared in Section 3.5.
The increasing value of fluid loading parameter, Q∗, results in the higher maximum deflection of PBC. The fluid loading parameter is considered as the mass of fluid acting transversely on PBC, the phenomenon of imbibition of fluid from the capillary is carried out until the paper attains its saturation, and at this point the PBC will correspond to maximum deflection. Different paper capillaries possess different amounts of fluid based on their physical properties. The higher value of Q∗ signifies the high fluid carrying capacity of paper. The graph in Figure 9 demonstrates the increasing response deflection of PBC.
Internal stress parameter λ∗ is another significant factor that needs to be addressed for the analysis of parametric mode. Generally, internal stress results in stress emerging in the structure of loading. In the case of paper, it is comfortable to adapt these resultant stresses in PBC due to the phenomenon of hygro-expansion and bending (rotation). In case of large deflection, these components cancel out others. Figure 10 plots the response deflection of PBC with the increasing value of internal stress parameter λ∗. Contrary to parameter Q∗, the increasing value of parameter λ∗ will result in a lower maximum deflection of PBC.

4.4. Transverse Displacement of Free End of PBC

It is interesting to analyze the response deflection of the free end for different wetted lengths of PBC. The problem is modeled as a quasi-static 2D fluid structure; however, the fluid flow is governed by Washburn, which makes the model susceptible to dynamic conditions. Instead of analyzing the time dependent solution of the model, the response variable is studied for different wetted lengths. The wetted length of PBC progresses as the square root of the time elapsed, so 5 instants in time are included in the Figure 11, when the value of wetting length is equal to 20, 40, 60, 80 and 100 percent of overall length of PBC.
Due to the fact that Equation (2) is developed for the moderately large static deflection of PBC, it allows for very minimal room to obtain a solution for the axial displacement of the free end of PBC. The model is developed with the limitation of deflection θ, within 0° to 10°. Please refer to Appendix A for details.

5. Conclusions

In this paper, an autonomous paper-based actuation system was introduced in order to sequentially load different reagents into the area of interest. For the purpose of this study, the concluded result will be utilized to model the behavior of PBC on fluidic loading. The solution for the model can be utilized to obtain the maximum deflection of PBC under the assumption, 1 ° θ 10 ° . For small and large deflection, the model shall be modified under the similar assumption of cross-sectional deformation.

Author Contributions

Conceptualization, A.K., H.H.-B. and A.C.; methodology, A.K., H.H.-B. and A.C.; software, A.K. and H.H.-B.; validation, A.K., H.H.-B., A.C. and N.R.; formal analysis, A.K., H.H.-B.; investigation, A.K., H.H.-B. and A.C.; resources, N.R., C.A. and M.F.; data curation, A.K. and H.H.-B.; writing—original draft preparation, A.K., H.H.-B. and A.C.; writing—review and editing, A.K., H.H.-B., A.C., N.R., C.A. and M.F.; visualization, A.K. and H.H.-B.; supervision, N.R., C.A. and M.F.; project administration, N.R., C.A. and M.F.; funding acquisition, C.A. and M.F. All authors have read and agreed to the published version of the manuscript.

Funding

This research received no external funding.

Acknowledgments

The authors would like to acknowledge the ideas and suggestions that Winfield Smith has shared during the execution of this study in addition to his valuable help and support.

Conflicts of Interest

The authors declare no conflict of interest.

Appendix A

Generalized Relationship [27],
Generalized Stress for cantilever in (x, z) plan,
Bending Moment, M =   σ x x   z   d A [Nm]
Normal Stress, N =   σ x x   d A [N]
Shear Stress, V =   σ x z   d A [N]
From Euler-Bernoulli hypothesis, and substitution in Axial Force N and Bending Moment M, for constant E and I we get:
M = E I κ   [ Nm ] N = E A ϵ 0   [ N ]
Figure A1. Generalized planar stress for cantilever.
Chemproc 05 00015 g0a1
Force equilibrium equation, in x-direction:
d N d x = 0
Force equilibrium equation, in z-direction:
d d x ( V + N d w d x ) + q = 0
Moment equilibrium equation, about y-axis:
d M d x = V
Cantilever equilibrium equation,
d 2 M d x 2 + N d 2 w d x 2 + q ( x ) = 0
Substituting value of M from pervious equation, we get.
d 2 d x 2 ( E I κ ) + N d 2 w d x 2 + q ( x ) = 0
where κ = d 2 w ( x ) d x 2

References

  1. Davy, J.; Davy, H. LXVIII. On a gaseous compound of carbonic oxide and chlorine. Philos. Mag. 1812, 39, 443–448. [Google Scholar] [CrossRef]
  2. Müller, R.H.; Clegg, D.L. Automatic Paper Chromatography. Anal. Chem. 1949, 21, 1123–1125. [Google Scholar] [CrossRef]
  3. Martinez, A.W.; Phillips, S.T.; Butte, M.; Whitesides, G.M. Patterned Paper as a Platform for Inexpensive, Low-Volume, Portable Bioassays. Angew. Chem. Int. Ed. 2007, 46, 1318–1320. [Google Scholar] [CrossRef] [PubMed]
  4. Böhm, A.; Carstens, F.; Trieb, C.; Schabel, S.; Biesalski, M. Engineering microfluidic papers: Effect of fiber source and paper sheet properties on capillary-driven fluid flow. Microfluid. Nanofluidics 2014, 16, 789–799. [Google Scholar] [CrossRef]
  5. Carstens, F.; Gamelas, J.; Schabel, S. Engineering microfluidic papers: Determination of fibre source and paper sheet prop-erties and their influence on capillary-driven fluid flow. Cellulose 2017, 24, 295–309. [Google Scholar] [CrossRef]
  6. Li, X.; Tian, J.F.; Nguyen, T.; Shen, W. Paper-Based Microfluidic Devices by Plasma Treatment. Anal. Chem. 2008, 80, 9131–9134. [Google Scholar] [CrossRef]
  7. Jahanshahi-Anbuhi, S.; Chavan, P.; Sicard, C.; Leung, V.; Hossain, S.M.Z.; Pelton, R.; Brennan, J.D.; Filipe, C.D. Creating fast flow channels in paper fluidic devices to control timing of sequential reactions. Lab Chip 2012, 12, 5079–5085. [Google Scholar] [CrossRef]
  8. Han, K.N.; Choi, J.-S.; Kwon, J. Three-dimensional paper-based slip device for one-step point-of-care testing. Sci. Rep. 2016, 6, 25710. [Google Scholar] [CrossRef]
  9. Martinez, A.W.; Phillips, S.T.; Nie, Z.; Cheng, C.-M.; Carrilho, E.; Wiley, B.; Whitesides, G.M. Programmable diagnostic devices made from paper and tape. Lab Chip 2010, 10, 2499–2504. [Google Scholar] [CrossRef]
  10. Rodriguez, N.M.; Wong, W.S.; Liu, L.; Dewar, R.; Klapperich, C.M. A fully integrated paperfluidic molecular diagnostic chip for the extraction, amplification, and detection of nucleic acids from clinical samples. Lab Chip 2016, 16, 753–763. [Google Scholar] [CrossRef]
  11. Jayawardane, B.M.; Wei, S.; McKelvie, I.D.; Kolev, S. Microfluidic Paper-Based Analytical Device for the Determination of Nitrite and Nitrate. Anal. Chem. 2014, 86, 7274–7279. [Google Scholar] [CrossRef]
  12. Noh, H.; Phillips, S.T. Metering the Capillary-Driven Flow of Fluids in Paper-Based Microfluidic Devices. Anal. Chem. 2010, 82, 4181–4187. [Google Scholar] [CrossRef]
  13. Lutz, B.; Liang, T.; Fu, E.; Ramachandran, S.; Kauffman, P.; Yager, P. Dissolvable fluidic time delays for programming mul-ti-step assays in instrument-free paper diagnostics. Lab Chip 2013, 13, 2840–2847. [Google Scholar] [CrossRef] [PubMed]
  14. Chen, H.; Cogswell, J.; Anagnostopoulos, C.; Faghri, M. A fluidic diode, valves, and a sequential-loading circuit fabricated on layered paper. Lab Chip 2012, 12, 2909. [Google Scholar] [CrossRef] [PubMed]
  15. Gerbers, R.; Foellscher, W.; Chen, H.; Anagnostopoulos, C.; Faghri, M. A new paper-based platform technology for point-of-care diagnostics. Lab Chip 2014, 14, 4042–4049. [Google Scholar] [CrossRef] [PubMed]
  16. Lai, Y.T.; Tsai, J.S.; Hsu, J.C.; Lu, Y.W. Automated paper-based devices by microfluidic timing-valve for competitive ELI-SA. In Proceedings of the 2017 IEEE 30th International Conference on Micro Electro Mechanical Systems (MEMS), Las Vegas, NV, USA, 22–26 January 2017; pp. 1321–1324. [Google Scholar]
  17. Koo, C.K.W.; He, F.; Nugen, S.R. An inkjet-printed electrowetting valve for paper-fluidic sensors. Analyst 2013, 138, 4998–5004. [Google Scholar] [CrossRef]
  18. Li, X.; Zwanenburg, P.; Liu, X. Magnetic timing valves for fluid control in paper-based microfluidics. Lab Chip 2013, 13, 2609–2614. [Google Scholar] [CrossRef]
  19. Phillips, E.A.; Shen, R.; Zhao, S.; Linnes, J.C. Thermally actuated wax valves for paper-fluidic diagnostics. Lab Chip 2016, 16, 4230–4236. [Google Scholar] [CrossRef]
  20. Kong, T.; Flanigan, S.; Weinstein, M.P.; Kalwa, U.; Legner, C.M.; Pandey, S. A fast, reconfigurable flow switch for paper microfluidics based on selective wetting of folded paper actuator strips. Lab Chip 2017, 17, 3621–3633. [Google Scholar] [CrossRef]
  21. Toley, B.J.; Wang, J.A.; Gupta, M.; Buser, J.R.; LaFleur, L.K.; Lutz, B.R.; Fu, E.; Yager, P. A versatile valving toolkit for automating fluidic operations in paper microfluidic devices. Lab Chip 2015, 15, 1432–1444. [Google Scholar] [CrossRef]
  22. Fu, H.; Song, P.; Wu, Q.; Zhao, C.; Pan, P.; Li, X.; Li-Jessen, N.Y.K.; Liu, X. A paper-based microfluidic platform with shape-memory-polymer-actuated fluid valves for automated multi-step immunoassays. Microsyst. Nanoeng. 2019, 5, 50. [Google Scholar] [CrossRef]
  23. Perez-Cruz, A. Development of Paper-Based Hygro-Mechanical Systems for Liquid Characterization. Ph.D. Thesis, Concordia University, Montréal, QC, Canada, 2017. [Google Scholar]
  24. Yu, H.; Yuan, Y. Analytical Solution for an Infinite Euler-Bernoulli Beam on a Viscoelastic Foundation Subjected to Arbitrary Dynamic Loads. J. Eng. Mech. 2014, 140, 542–551. [Google Scholar] [CrossRef]
  25. Lee, M.; Kim, S.; Mahadevan, L. Bending and buckling of wet paper. Phys. Fluids 2016, 28, 042101. [Google Scholar] [CrossRef]
  26. Mäkelä, P.; Östlund, S. Orthotropic elastic–plastic material model for paper materials. Int. J. Solids Struct. 2003, 40, 5599–5620. [Google Scholar] [CrossRef]
  27. Wang, H.; Qin, Q.-H. Methods of Fundamental Solutions in Solid Mechanics; Elsevier BV: Amsterdam, The Netherlands, 2019; pp. 53–90. [Google Scholar]
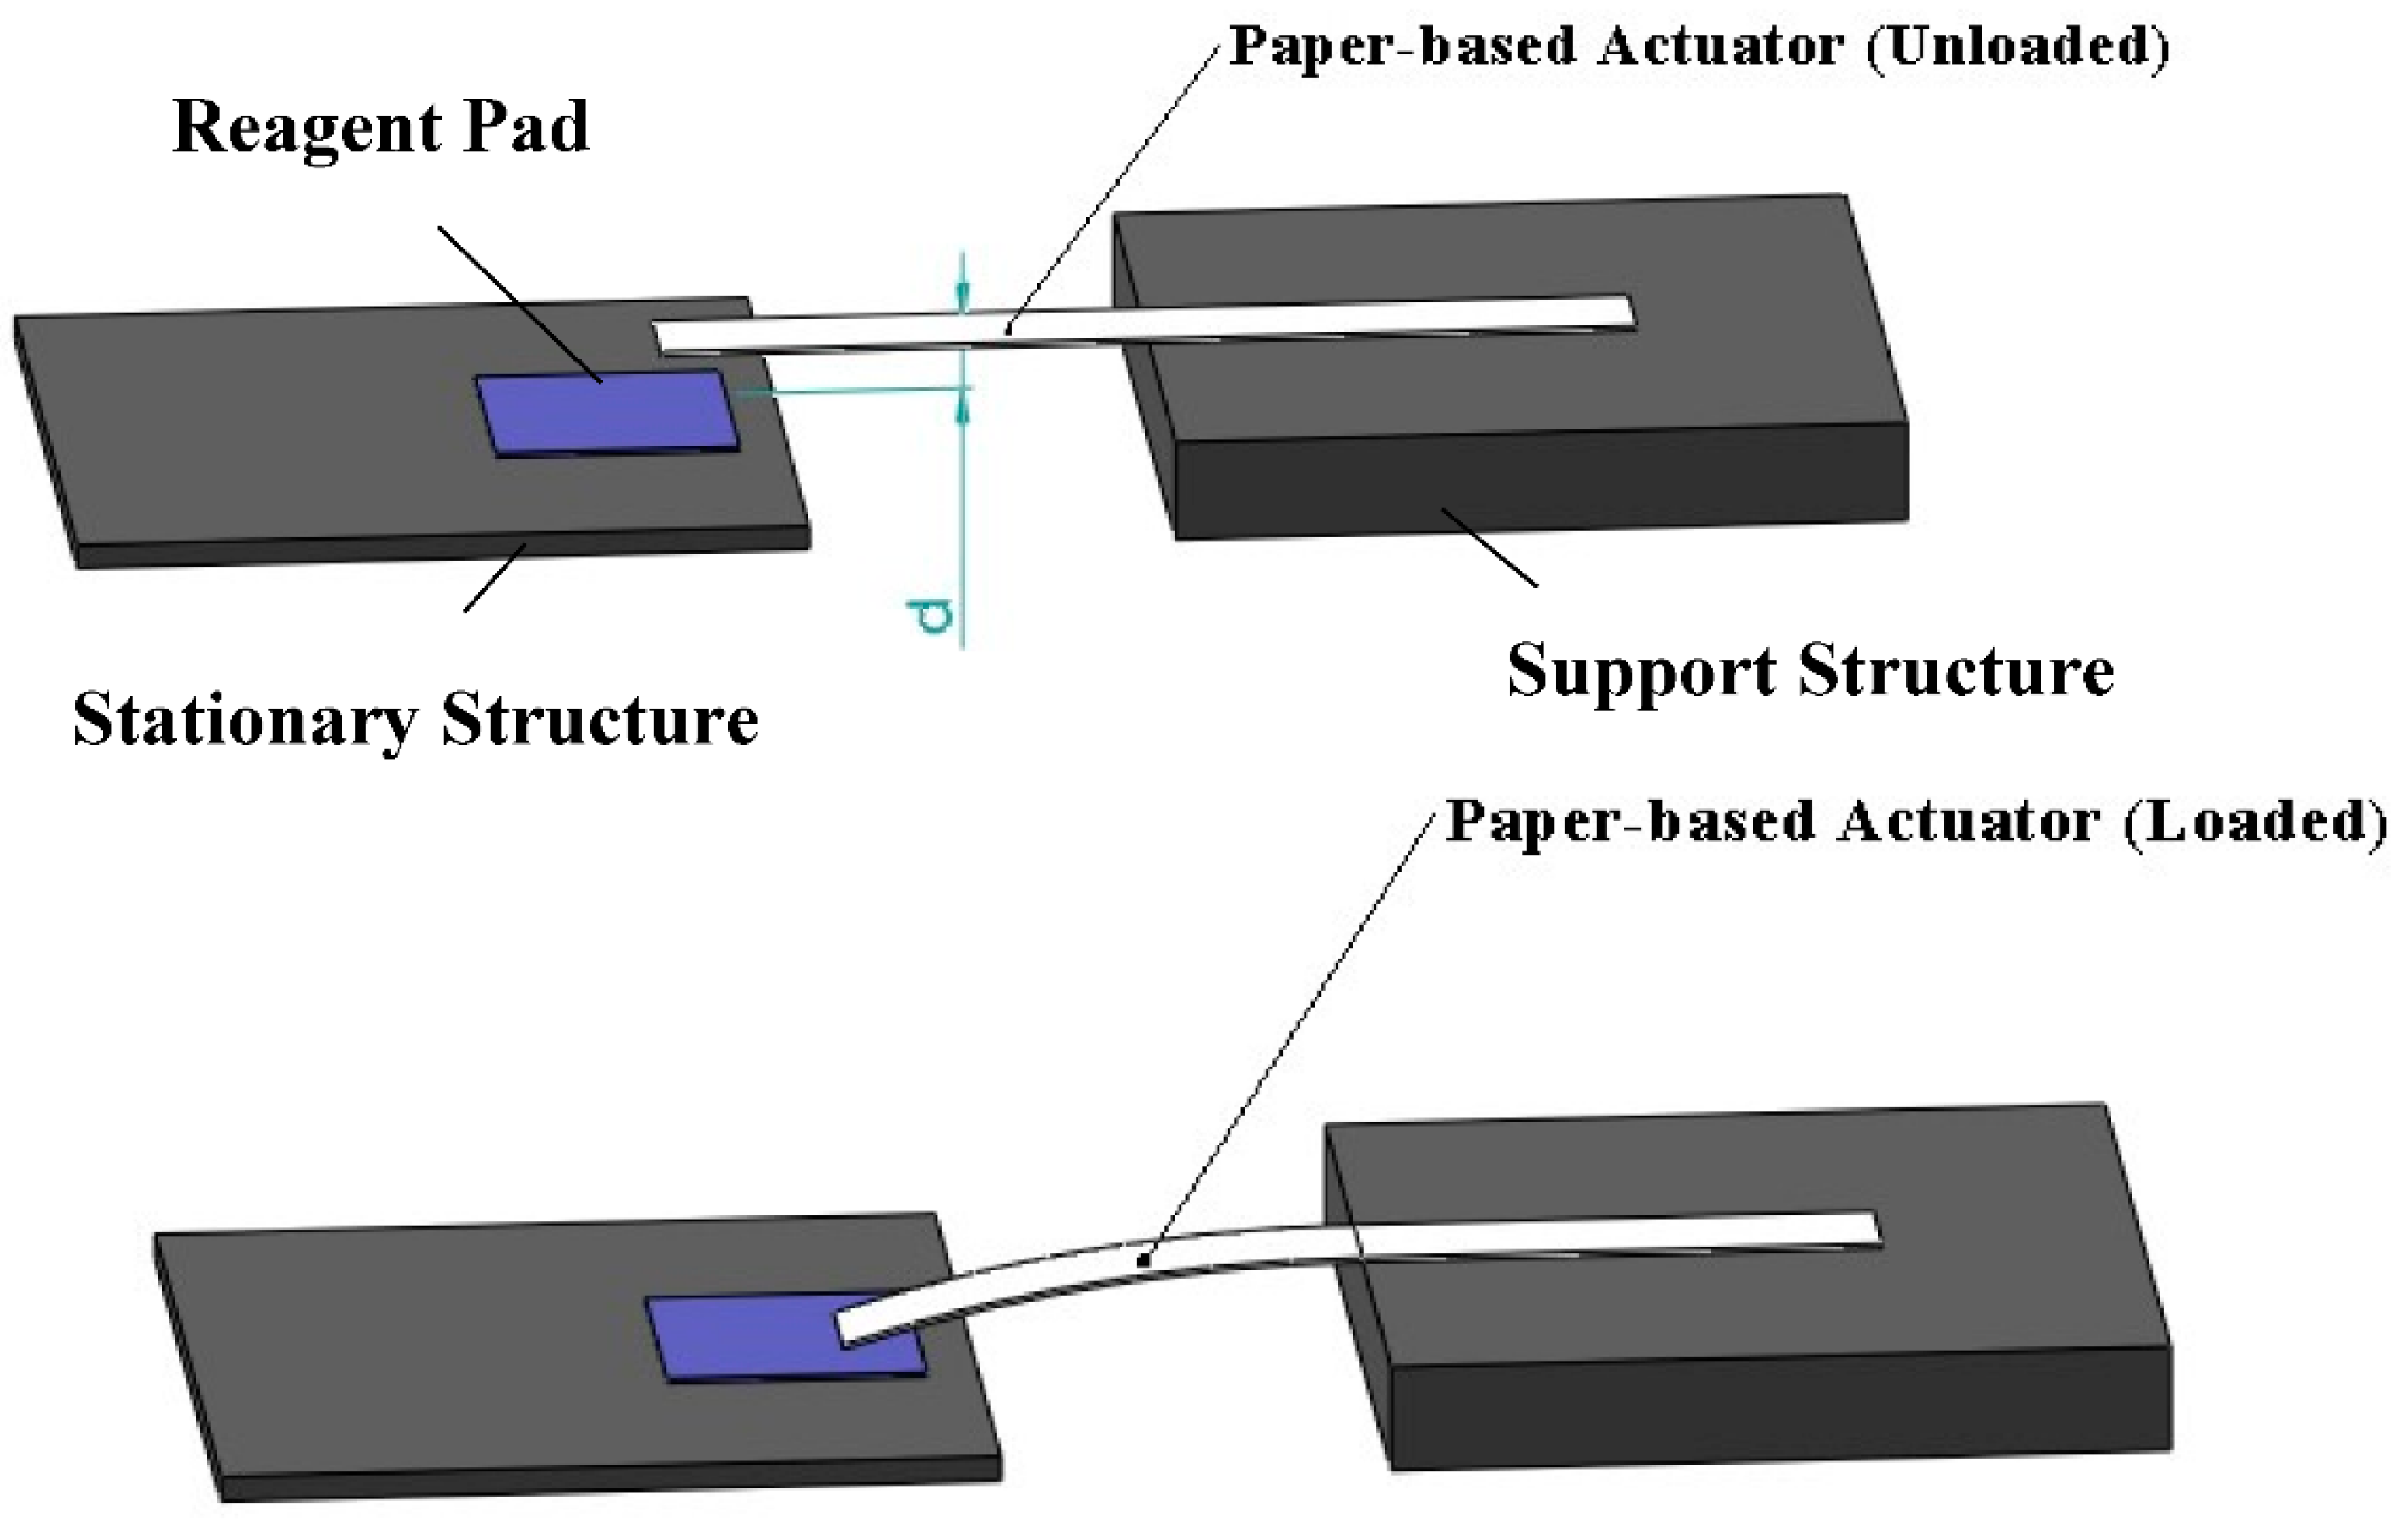
Figure 1. Single cantilever design of PBC actuator device.
Chemproc 05 00015 g001
Figure 2. Addition of activation fluid on sample pad for double cantilever design of PBC actuator device.
Chemproc 05 00015 g002
Figure 3. Sequence of operation of the double cantilever design. (a) Initial state of device after pipetting activation fluid, (b) Loading of the first reagent on-to detection zone upon activation of the first cantilever. (c) Activation fluid passing from the delay channel for actuation of the second cantilever. (d) Loading of the second reagent on-to the detection zone upon activation of the second cantilever. (e) Final state of the device after mixing of two reagents.
Chemproc 05 00015 g003
Figure 4. Experimental model for PBC actuator.
Chemproc 05 00015 g004
Figure 5. Paper-based cantilevers (PBCs).
Chemproc 05 00015 g005
Figure 6. Fixture for experiment.
Chemproc 05 00015 g006
Figure 7. Static actuation model of PBC.
Chemproc 05 00015 g007
Figure 8. Analytical and numerical solution for PBC.
Chemproc 05 00015 g008
Figure 9. Parametric model for fluid loading Q∗.
Chemproc 05 00015 g009
Figure 10. Parametric Model for internal stress parameter λ∗.
Chemproc 05 00015 g010
Figure 11. Response deflection of free end of PBC for different wetted length.
Chemproc 05 00015 g011
Table 1. PBC parameters.
VariablesDescriptionDimension
xLength coordinateL
zHeight coordinateL
tTimeT
wDeflectionL
qTransverse loadingMT−2
lPBC lengthL
bPBC widthL
hPBC heightL
ρFluid densityML−3
EYoung’s modulusML−1T−2
Table 2. PBC parameters.
VariablesExpressionDescription
x∗ ( x l ) Characteristic Length
w∗ ( w R g ) Characteristic Deflection
t∗ ( R g l ) t Characteristic Time
λ∗ l N E I Internal Stress Parameter
Q∗ ρ g V f l 3 R g E I Fluid Loading Parameter
Rg I A Radius of Gyration
Table 3. Variable used to obtain response deflection of PBC.
VariablesValueDescription
ρ w 1000 kg/m3Density of water
V f 1.42 × 10 8 LVolume of fluid moved into PBC
l 20 × 10 3 mLength of PBC
b 4 × 10 3 mWidth of PBC
h 0.25 × 10 3   m Height of PBC
N 5.3 × 10 3 NAxial force
E20.5 MPaYoung’s modulus of wet paper [25]
Table 4. Experimental results for PBC.
VariablesResults (in mm)
Maximum Deflection of PBC3.04
Change in Height of Capillary Tube8.96
Disclaimer/Publisher’s Note: The statements, opinions and data contained in all publications are solely those of the individual author(s) and contributor(s) and not of MDPI and/or the editor(s). MDPI and/or the editor(s) disclaim responsibility for any injury to people or property resulting from any ideas, methods, instructions or products referred to in the content.