1. Introduction
Wood naturally contains a large amount of lignin, which needs to be separated/extracted from the wood before further processing [
1,
2]. The sulfite pulping process is one of the main ways in which wood has been processed industrially to produce moderately pure cellulose fibers, which can be further processed to obtain paper and paper-based products [
3,
4,
5].
Despite its historical success, the sulfite process is energy-intensive, with a significant carbon footprint [
6]. During the sulfite pulping process, lignin is separated from the wood as sodium lignosulfonate in high-temperature and -pressure conditions, at a neutral pH [
3,
4,
5]. However, the process has a tendency towards acidic pH values. In order to maintain an optimal pH, sodium carbonate is added continuously, and is consumed, which leads to the production of carbon dioxide [
3].
Membranary processes that operate in crossflow conditions are becoming attractive alternatives to classical methods in many industrial processes, despite their high capital and operating costs [
7]. The main advantage of membranary processes is the fact that temperature is not essential to intensifying the process. For this reason, it is a very good choice for purifying valuable biomolecules, even on the industrial scale [
8]. Another advantage that has become very relevant in the current century is that the process requires only pumping energy, which means it is directly linked to the carbon footprint of electrical energy production [
9].
SuperPro Designer 10 allows us to model crossflow filtration in batch mode or in feed-and-bleed mode [
7,
10] While in batch mode, the retentate flows back into a perfectly mixed tank; in a feed-and-bleed process [
11], the retentate is sent directly into the feed stream, where it mixes inline. The feed-and-bleed approach results in a higher membrane surface being required to maintain flux, and also imposes a theoretical concentration limit that depends on the concentration factor (CF), and on the rejection coefficient (RC). Despite these drawbacks, the feed-and-bleed better models real situations, where a continuous process is required, with reduced hold-up times, in comparison to the batch alternative. Another advantage, in comparison to the batch process, is the lower frequency of clean-in-place (CIP) operations. The drawbacks of the crossflow feed-and-bleed filtration process can be greatly diminished when the units are disposed of in a sequential manner, with respect to the stream of interest. Pore-blocking can also be limited this way, as low CF values are required, with more filtration stages in series.
2. Methods
The main equations that model the mass balance in a crossflow filtration feed-and-bleed process in SuperPro Designer 10 are shown below (Equations (1)–(4)) [
10]:
Using these equations, the mass balance can be simulated in filtration units, which concentrate the product in series, using Microsoft Excel 2013 and its dedicated solver add-in. The results can show which CF values are required in each filtration unit as a function of the feed flow, the RC values for each component, the number of stages, the feed concentration of each component, and the target concentration of the product and other components.
A process sheet was built into SuperPro Designer 10 (
Figure 1) that takes the initial feed into a microfiltration batch unit, which separates the hemicellulose (precipitated partially by ethanol, for example) from the sodium lignosulfonate and the salts. This was shown to have a significant impact on the purity of the product in the product stream. The permeate of this stage is fed into a multi-effect evaporator, as this is the most efficient, in comparison with other drying/evaporating processes (
Figure A1,
Table A1 and
Table A2). The concentrate is then fed into a series of filtration units at 3-bar absolute pressure. The final concentrate is considered the product stream, rich in sodium lignosulfonate.
The simulation had many input parameters, of which some were fixed and others had a changing value. The feed flow was fixed at 100 kg/h, with the mass fractions of 6%, 2%, and 2% for sodium lignosulfonate, hemicellulose, and sodium sulfite, respectively. The initial concentration factor for the initial batch microfiltration unit was set at 5. To simulate possible situations, the hemicellulose had an RC value of 0.9, while the sodium lignosulfonate was set at 0.4. The assumed volumetric flux was 20 L/m2/h. The multi-effect evaporator had six stages, and it was assumed that the evaporation rate would be that of pure water. Several final mass fractions with respect to sodium lignosulfonate were considered. The concentrate was fed to the series of ultrafiltration units, which had the ideal volumetric flux values of 20 L/m2/h, the exact CF values calculated via the Microsoft Excel simulations, the RC values of 0.99 for hemicellulose and 0.9 for sodium lignosulfonate, and a specific power consumption of 0.2 kW/m2. All combinations of numbers of stages (3, 5, 7) with all combinations of target concentrations in the evaporator (20%, 30%, and 40%, with respect to sodium lignosulfonate) were considered.
3. Results and Discussion
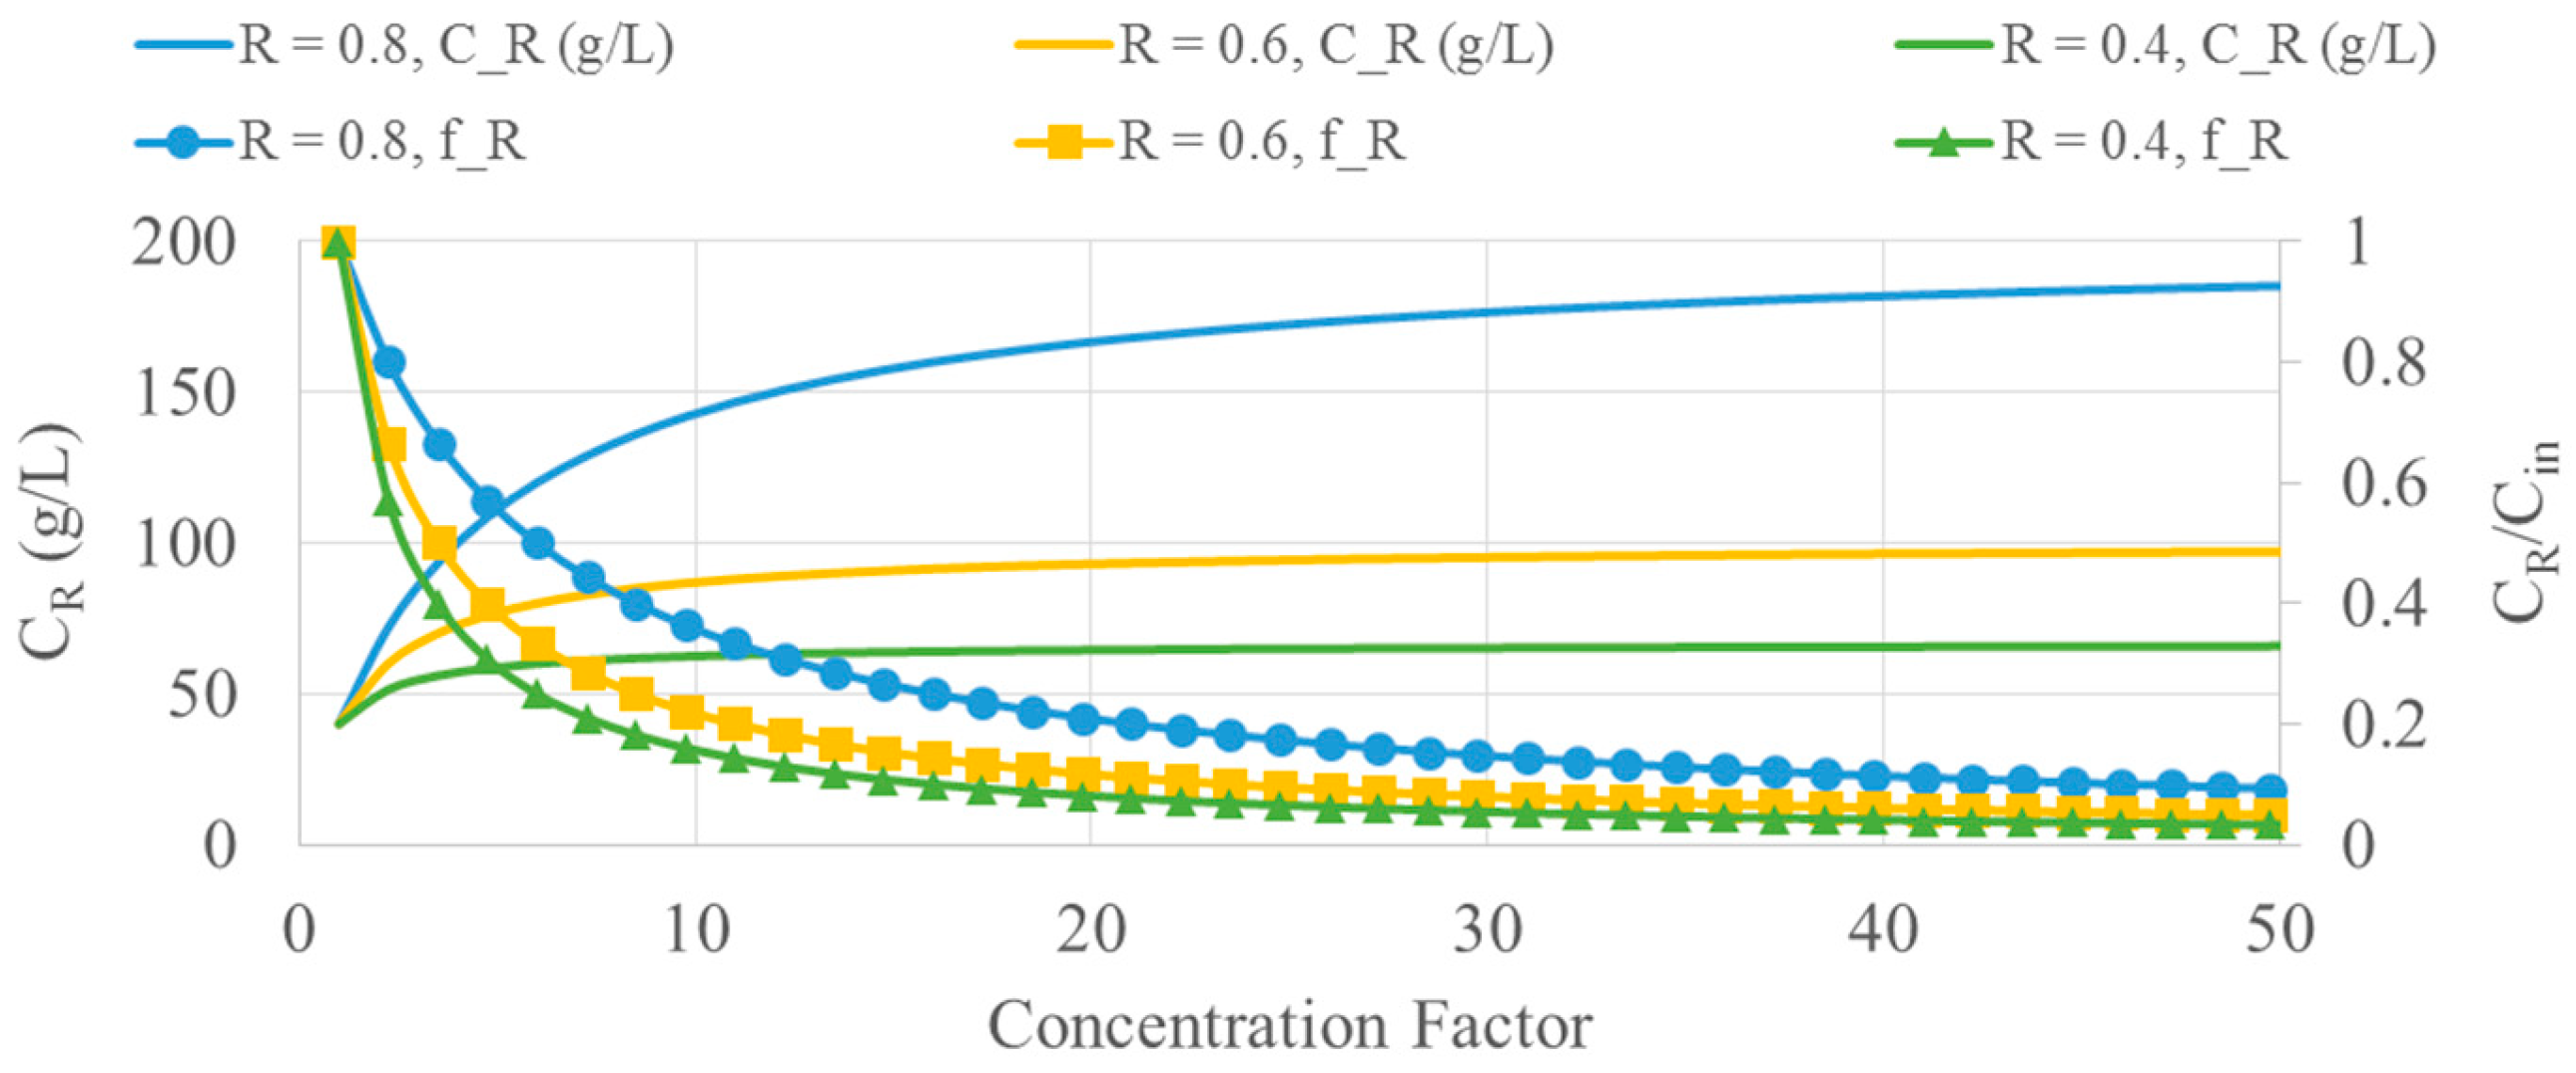
Figure 2 shows the interdependency between the concentration factor, the mass fraction in the retentate, the concentration in the retentate of the key component, and the maximum achievable concentration in the retentate for the case of concentrating a feed stream in a feed-and-bleed filtration unit operated in continuous mode.
In order to achieve a useful separation of sodium lignosulfonate, the concentration factor values should be very small (up to 2 or 3) in each filtration unit, in order to limit the unwanted passing of sodium lignosulfonate into the permeate. However, the use of sequential feed-and-bleed filtration units can lead to a useful separation.
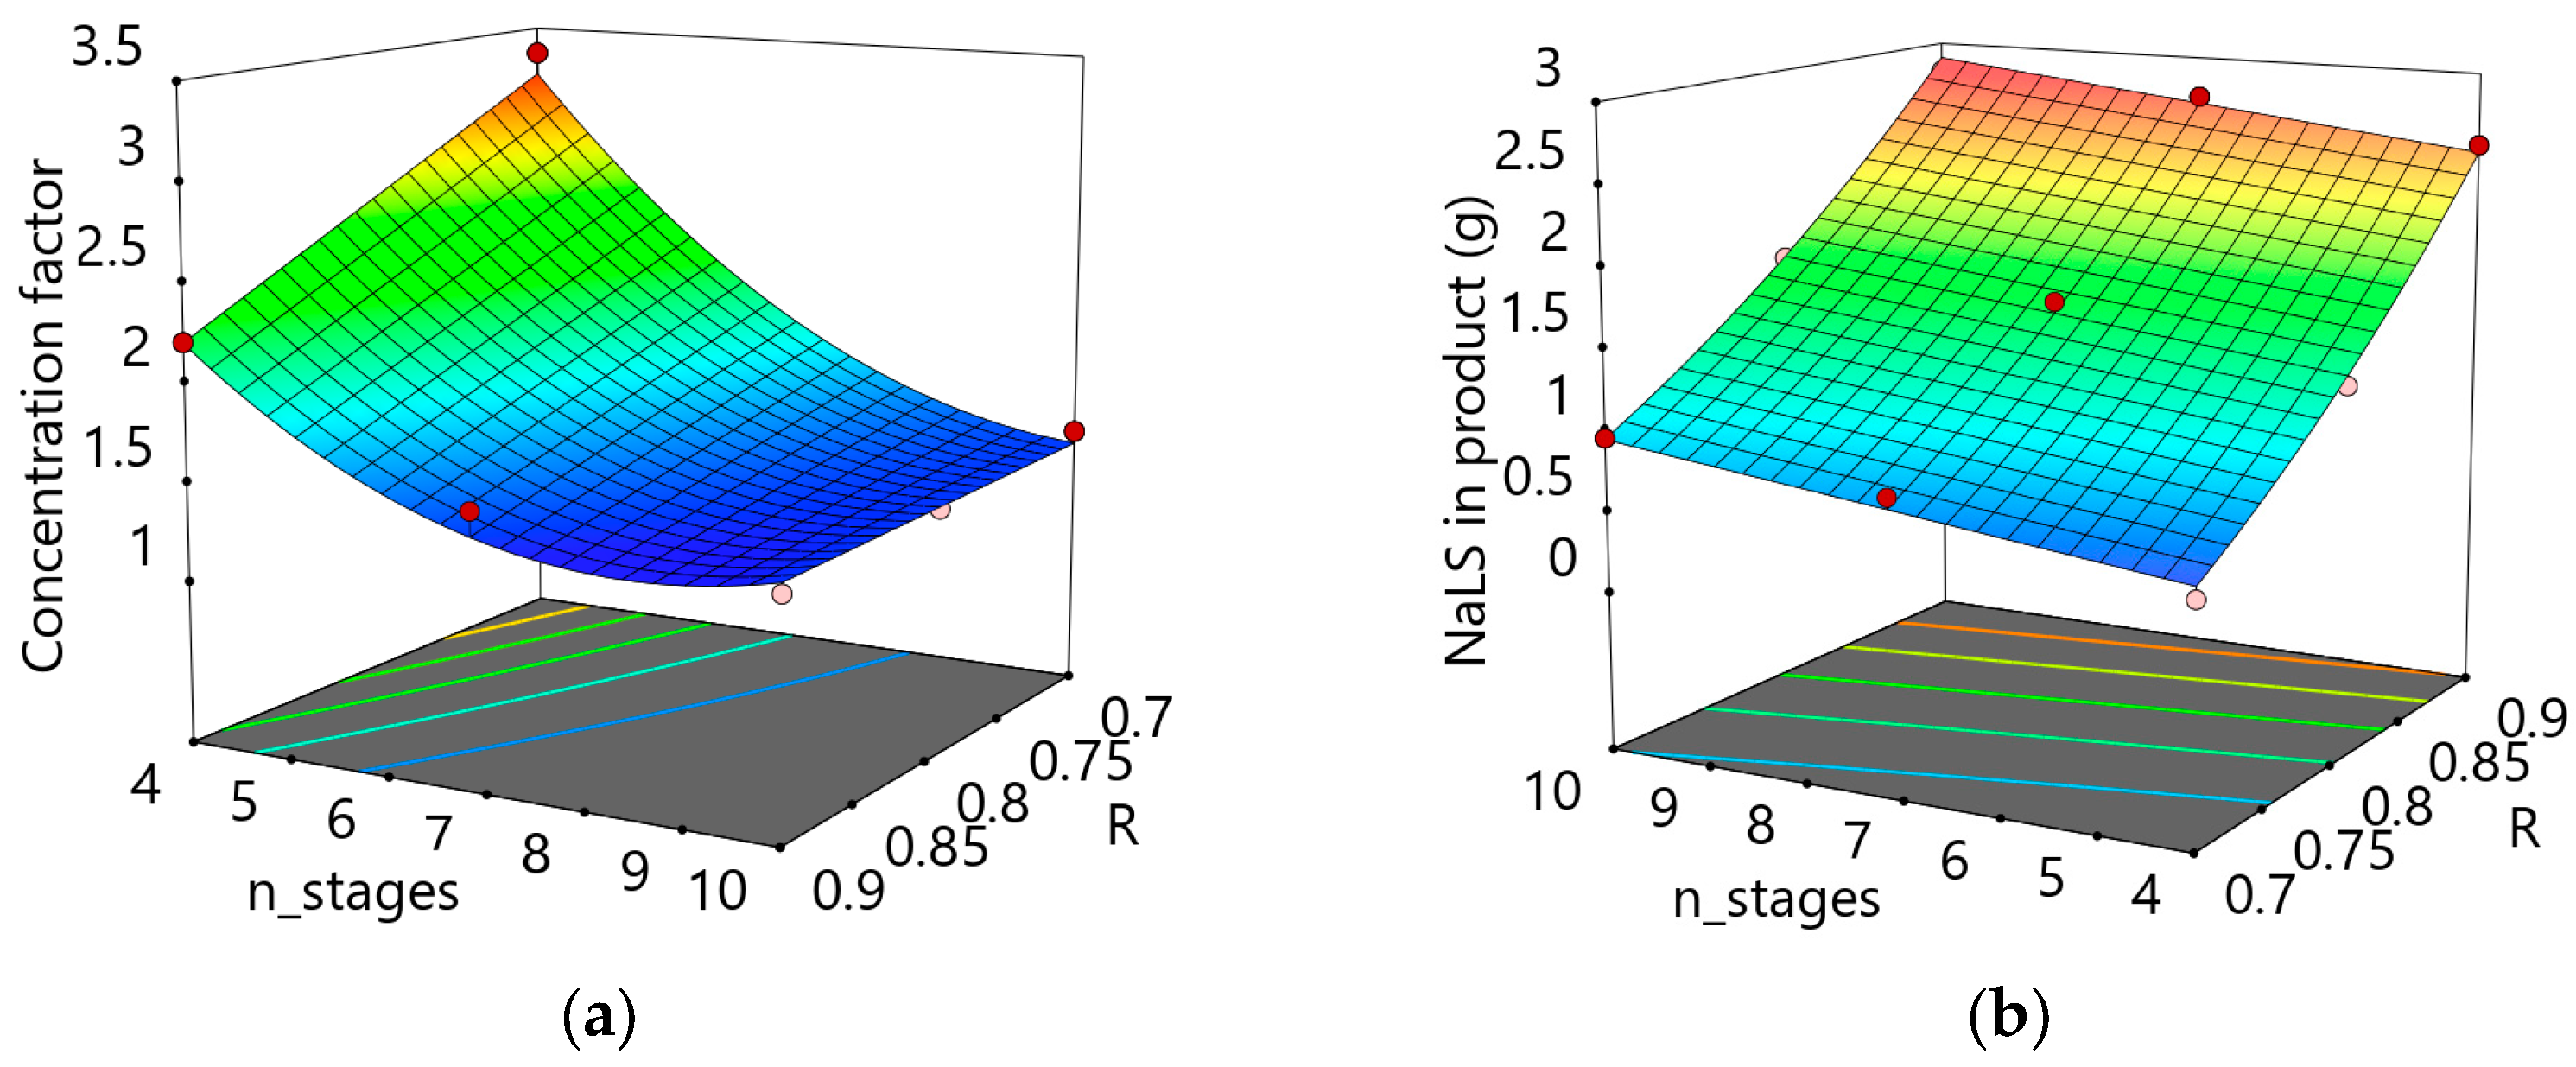
Figure 3 depicts the effects of changing the number of stages and of rejection coefficients. It shows that the required concentration factor can be very small when 10 stages are used, no matter the rejection coefficient of the target component. It also shows that a reduced number of stages leads to a situation in which higher CF values are required when the rejection coefficients are smaller (
Figure 3a). Additionally, the yield of the main component is only slightly increased when more stages are used, but it is very much dependent on the rejection coefficient. This result further consolidates the need to choose membranes with MWCO values that put the key component at a rejection factor of 0.9 when it is supposed to be recovered in the retentate, and a similar value for other components when the product is to be recovered in the permeate. This also shows that it becomes a difficult task to separate components which have similar RC values, unless some other type of agglomeration principle is used, specific to at least one of the components.
The algorithm presented earlier can be used to estimate the CF values required in the process simulation, which was built in SuperPro Designer 10. The detailed results are shown in
Table 1 for situations with 3, 5, or 7 filtration stages, at various initial concentration values (20%, 30%, and 40%) obtained via evaporation. These results are grouped in three categories: the flow characteristics, which also describe the mass flow of the components; the capital and operating costs, estimated via the software; and the utility consumption for the steam and electrical power required, and the corresponding carbon footprint.
These results show that there is a trade-off between the purity of the sodium lignosulfonate in the final product stream, and its yield. In a real situation, these parameters can be tweaked, to be optimized for a purer product with a lower production rate, or for a less-pure product with a higher production rate. The capital costs depend only on the number of filtration stages, while the operating costs are influenced significantly by the number of stages, and very little by the amount of water, which is initially separated via evaporation. While the steam utility consumption holds the largest percentage of the total carbon footprint related to the process, its value is significantly decreased through the use of expensive equipment that evaporates water more efficiently. Overall, the carbon trapped in the sodium lignosulfonate is higher than the estimated carbon footprint of the processes used. This shows that sodium lignosulfonate can be produced in a process with a negative or neutral carbon footprint. The results obtained via the simulation are probably very close to an ideal situation. However, the large difference between the equivalent carbon released as CO2 and the equivalent carbon stored in the lignosulfonate product shows that there is room to include other real conditions.
Figure 4 shows how the capital and operating costs scale with an increase in the production capacity. While the production capacity increases 10-fold, both the capital and the operating costs only increase less than 2-fold. This shows that, for a large production capacity, the selling price of the purified sodium lignosulfonate can be greatly reduced, which could lead to a competitive price for various applications.
4. Conclusions
A simulation was built in SuperPro Designer 10 to evaluate various parameters related to the purification of sodium lignosulfonate using membranary processes. The feed-and-bleed variation was shown to be compatible with the requirements imposed on the product stream. It was shown that the capital costs would be in the range from EUR 2 to 3 million, with the operating costs in the range from EUR 1 to 2 million. While a higher number of filtration stages increased the costs significantly, it also required very low concentration factors, which decreased the possibility of pore-clogging. The addition of an evaporator played a more significant role in both the process yield and the purity. This led to an increase in the carbon footprint of the process. However, the overall approach suggested that there is great potential to achieve an overall carbon-neutral or even carbon-negative process, considering the carbon contained in the sodium lignosulfonate product.
Author Contributions
Conceptualization, B.T. and F.O.; methodology, B.T. and M.S.; software, B.T.; validation, B.T. and F.O.; formal analysis, M.S.; investigation, B.T.; resources, F.O.; data curation, F.O.; writing—original draft preparation, B.T.; writing—review and editing, F.O.; visualization, B.T.; supervision, F.O.; project administration, F.O.; funding acquisition, F.O. and M.S. All authors have read and agreed to the published version of the manuscript.
Funding
This work has been funded by the European Social Fund from the Sectoral Operational Programme Human Capital 2014–2020, through the Financial Agreement with the title “Training of PhD students and postdoctoral researchers in order to acquire applied research skills—SMART”, Contract no. 13530/16.06.2022—SMIS code: 153734; and by the project POC-A1-A1.2.3-G-2015-P_40_352-SECVENT, Sequential processes to close bioeconomy side stream and innovative bioproducts resulted from these, contract 81/2016, SMIS 105684, funded by Cohesion Funds of the European Union, subsidiary projects 382/2020 BioBleach and 383/2020 LignoHumate.
Institutional Review Board Statement
Not applicable.
Informed Consent Statement
Not applicable.
Data Availability Statement
Not applicable.
Conflicts of Interest
The authors declare no conflict of interest.
Appendix A
Figure A1.
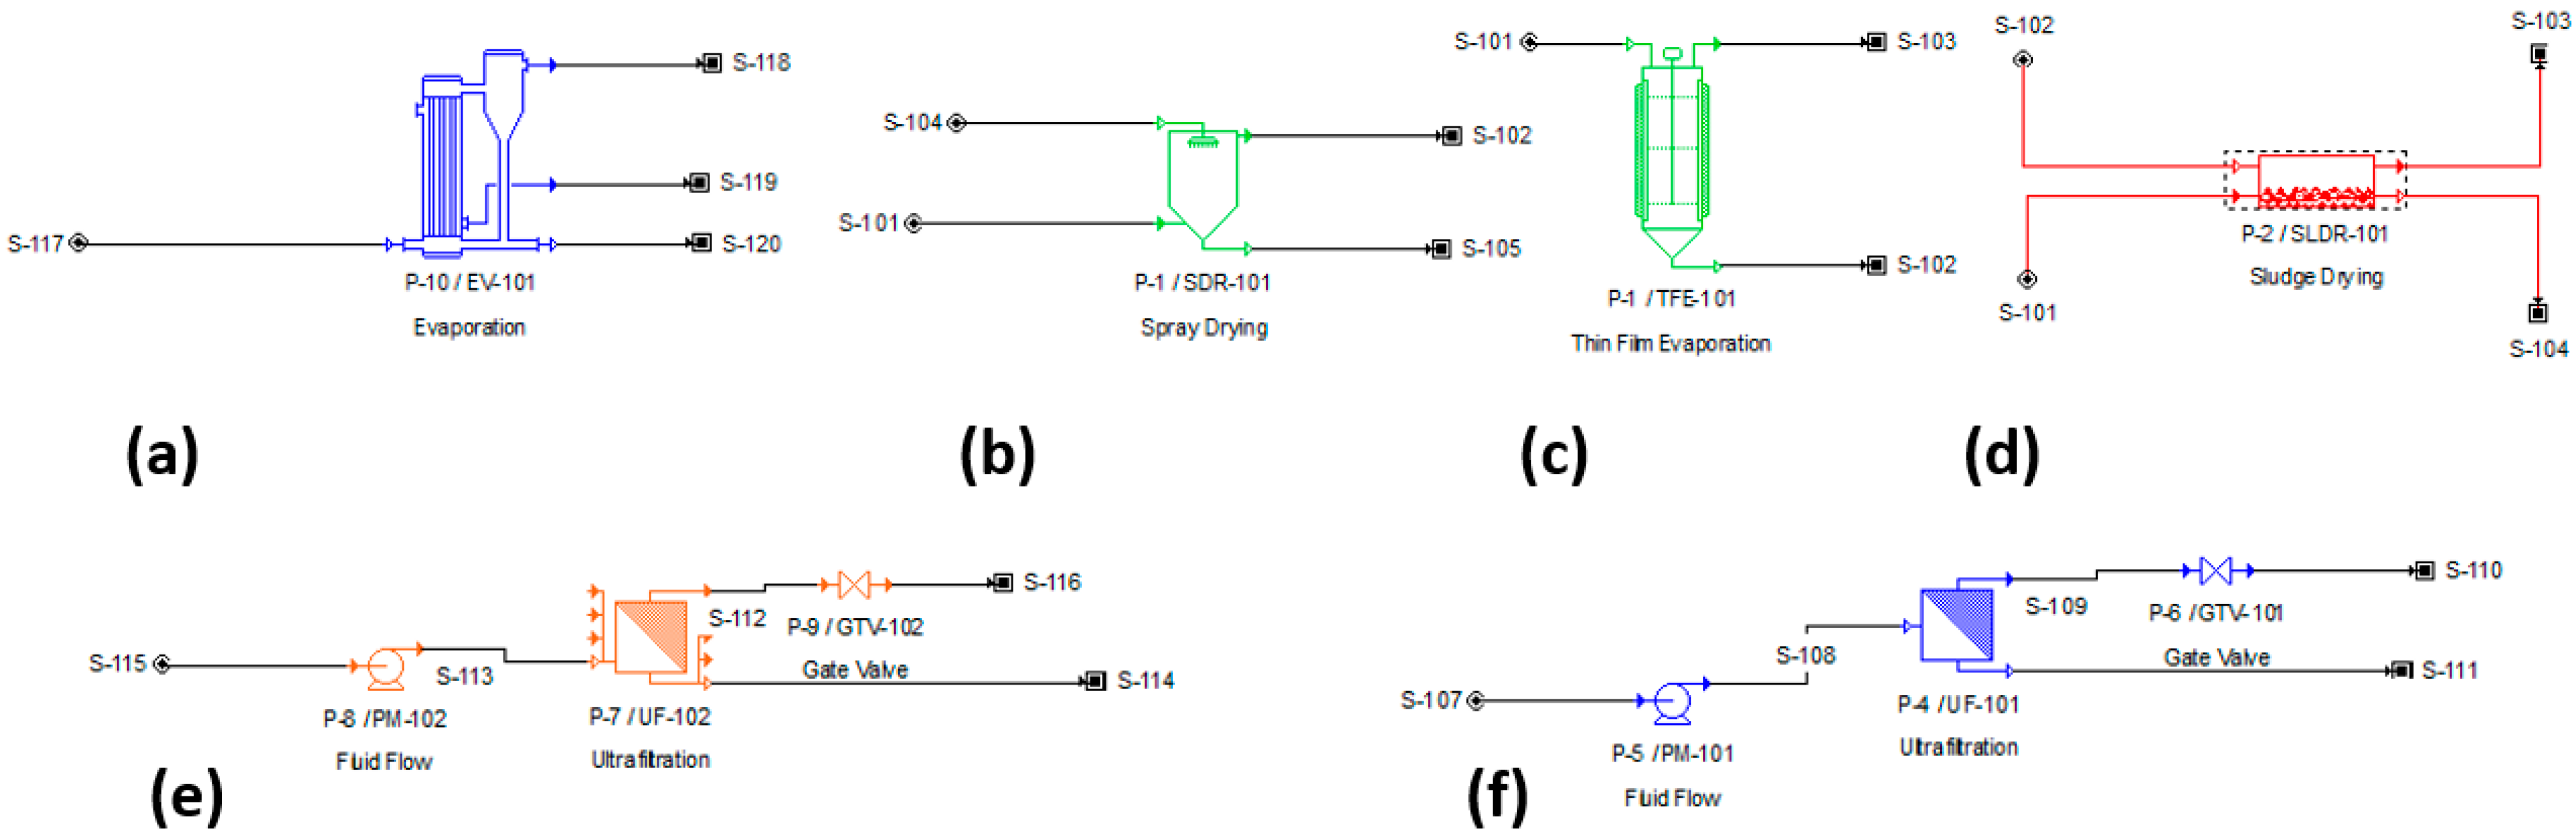
Process diagrams in SuperPro Designer 10 for the simulated situations: (a) multi-effect evaporator (MEE); (b) spray dryer (SpD); (c) thin-film evaporator (TFE); (d) sludge dryer (SlD); (e) ultrafiltration (batch) (UFB); (f) ultrafiltration (feed-and-bleed) (UFFB).
Figure A1.
Process diagrams in SuperPro Designer 10 for the simulated situations: (a) multi-effect evaporator (MEE); (b) spray dryer (SpD); (c) thin-film evaporator (TFE); (d) sludge dryer (SlD); (e) ultrafiltration (batch) (UFB); (f) ultrafiltration (feed-and-bleed) (UFFB).
Table A1.
The process parameters for the thermal and membranary simulated processes.
Table A1.
The process parameters for the thermal and membranary simulated processes.
| Process | Conditions |
|---|
| Multi-effect evaporator | Six effects; feed flow arrangement: forward; thermal vapor recompression with an entrainment ratio of 1.26; liquor temperature in last effect: 25 °C; specific power: 0.001 kW/(kg/h)); 1 labor hrs/h; main equipment cost: EUR 94,000. |
| Spray dryer | Water evaporation set at 94.3%; outlet gas and product exit at 25 °C; volatile content of outlet gas: 0.0195 wt/wt dry; specific evaporation rate: 100 (kg/h)/m3; specific power: 1 kW/m2 of drum area; 0.5 labor-hrs/h; main equipment cost: EUR 13,300. |
| Thin-film evaporator | Water evaporation set at 94.3%; existing temperature of both streams: 25 °C; existing pressure of both streams: 1 atm; 0.5 labor hrs/h; main equipment cost: EUR 99,000. |
| Sludge dryer | Dried sludge temperature: 25 °C; solid concentration: 60%; moisture of air in: 0.008 wt H2O/wt dry air; moisture of air out: 0.12 wt H2O/wt dry air; temperature of air out: 115 °C; 0.5 labor hrs/h; main equipment cost: EUR 34,000. |
| Ultrafiltration (batch) | Two-bar transmembranary pressure (set by centrifugal pump in front of unit); rejection coefficient of membrane with respect to NaLS; filtration time: 240 min; filtrate flux: 20 L/m2/h; 1 labor hrs/h; main equipment cost: EUR 31,000; clean in place operation after every concentration cycle, which involves cleaning with 0.1 M NaOH (15 min), followed by cleaning with water (30 min). |
| Ultrafiltration (feed-and-bleed) | The operation is set up the same way as the ultrafiltration (batch) process described above. |
Table A2.
The simulation results for a feed flow of 100 kg/h, with an 8% content of sodium lignosulfonate.
Table A2.
The simulation results for a feed flow of 100 kg/h, with an 8% content of sodium lignosulfonate.
| | MEE | SpD | TFE | SlD | UFB | UFFB |
|---|
| Steam (MT/year) | 107 | 823 | 916 | 851 | 0 | 0 |
| Electrical (kWh/year) | 867 | 0 | 0 | 0 | 8800 | 8800 |
| Capital costs (EUR 1000) | 779 | 115 | 758 | 281 | 353 | 353 |
| Total operating costs (EUR 1000) | 290 | 104 | 222 | 90 | 321 | 318 |
| Labor costs (EUR 1000) | 131 | 66 | 66 | 26 | 156 | 157 |
| Other consumables (EUR 1000/year) | 0 | 0 | 0 | 0 | 79 | 75 |
| CO2 eq. tons (steam)/year | 16 | 124 | 138 | 129 | 0 | 0 |
| CO2 eq. tons (electrical)/year | 0 | 0 | 0 | 0 | 2 | 2 |
| Total CO2 eq. tons/year | 16 | 124 | 138 | 129 | 2 | 2 |
| Total C eq. tons/year | 7 | 56 | 62 | 58 | 1 | 1 |
| NaLS conc. 60% tons/year | 107 | 107 | 107 | 107 | 107 | 107 |
| NaLS (dry)/year | 64 | 64 | 64 | 64 | 64 | 64 |
| C eq. tons in product/year | 29 | 29 | 29 | 29 | 29 | 29 |
References
- Sixta, H.; Potthast, A.; Krotschek, A.W. Chemical pulping processe: Sections 4.1–4.2.5. In Handbook of Pulp; Sixta, H., Ed.; John Wiley and Sons: Hoboken, NJ, USA, 2008; Volume 1, pp. 109–229. [Google Scholar]
- Alén, R. Pulp mills and wood-based biorefineries. In Industrial Biorefineries and White Biotechnology; Pandey, A., Höfer, R., Taherzadeh, M., Nampoothiri, K.M., Larroche, C., Eds.; Elsevier: Amsterdam, The Netherlands, 2015; pp. 91–126. [Google Scholar]
- Evtuguin, D.V. Sulphite pulping. In Lignocellulosic Fibers and Wood Handbook: Renewable Materials for Today’s Environment; Belgacem, N., Pizzi, A., Eds.; Wiley Blackwell: Hoboken, NJ, USA, 2016; pp. 225–244. [Google Scholar]
- Bajpai, P. Pulp and paper making process. In Springerbriefs in Applied Sciences and Technology; Springer: Berlin/Heidelberg, Germany, 2017; pp. 55–59. [Google Scholar]
- Berg, A.; Guzmn, F. Wood biorefineries. In Springer Handbook of Wood Science and Technology; Springer Handbooks; Niemz, P., Teischinger, A., Sandberg, D., Eds.; Springer: Cham, Switzerland, 2023; pp. 1713–1751. [Google Scholar]
- Kong, L.; Hasanbeigi, A.; Price, L.; Liu, H. Energy conservation and CO2 mitigation potentials in the chinese pulp and paper industry. Resour. Conserv. Recycl. 2017, 117, 74–84. [Google Scholar] [CrossRef]
- Qureshi, N.; Singh, V. Process economics of renewable biorefineries: Butanol and ethanol production in integrated bioprocesses from lignocellulosics and other industrial by-products. In Biorefineries: Integrated Biochemical Processes for Liquid Biofuels; Qureshi, N., Vertès, A.A., Hodges, D.B., Eds.; Elsevier: Amsterdam, The Netherlands, 2014; pp. 237–254. [Google Scholar]
- Kamble, S.P.; Barve, P.P.; Rahman, I.; Kulkarni, B.D. Separation processes in biopolymer production. In Separation and Purification Technologies in Biorefineries; Ramaswamy, S., Huang, H.J., Ramarao, B.V., Eds.; Wiley: Hoboken, NJ, USA, 2013; pp. 555–568. [Google Scholar]
- Rodrigues Pinto, P.C.; Borges Da Silva, E.A.; Rodrigues, A.E. Lignin as source of fine chemicals: Vanillin and syringaldehyde. In Biomass Conversion: The interface of Biotechnology, Chemistry and Materials Science; Baskar, C., Baskar, S., Dhilon, S., Eds.; Springer: Berlin/Heidelberg, Germany, 2012; pp. 381–420. [Google Scholar]
- McGregor, W.C. Membrane separations. In Biotechnology; McGregor, W.C., Ed.; Marcel Dekker: New York, NY, USA, 1986; p. 386. [Google Scholar]
- Tanaka, Y. Electrodialysis. In Progress in Filtration and Separation; Tarleton, S., Ed.; Elsevier: Amsterdam, The Netherlands, 2015; pp. 207–284. [Google Scholar]
| Disclaimer/Publisher’s Note: The statements, opinions and data contained in all publications are solely those of the individual author(s) and contributor(s) and not of MDPI and/or the editor(s). MDPI and/or the editor(s) disclaim responsibility for any injury to people or property resulting from any ideas, methods, instructions or products referred to in the content. |
© 2023 by the authors. Licensee MDPI, Basel, Switzerland. This article is an open access article distributed under the terms and conditions of the Creative Commons Attribution (CC BY) license (https://creativecommons.org/licenses/by/4.0/).


