
Article

Nutritional Knowledge, Attitude, Eating Behavior, and Dietary Intake in Relation to Glycemic Control Among Patients with Type 2 Diabetes in Rural Thailand

by
Sirapat Khodseewong
1,2,
Thidarat Somdee
1,2,
Ploypailin Aneknan
1,2 and
Rujira Nonsa-ard
1,2,*
1
Faculty of Public Health, Mahasarakham University, Mahasarakham 44150, Thailand
2
The Excellent Center for Community Aged Care, Mahasarakham University, Mahasarakham 44150, Thailand
*
Author to whom correspondence should be addressed.
Diabetology 2026, 7(7), 139; https://doi.org/10.3390/diabetology7070139
Submission received: 31 May 2026 / Revised: 8 July 2026 / Accepted: 16 July 2026 / Published: 20 July 2026
(This article belongs to the Section Prevention and Public Health Management of Diabetes)

Abstract

Objectives: Type 2 diabetes mellitus (T2DM) is an increasing public health concern in Thailand, particularly in rural communities where dietary practices and contextual factors may influence glycemic control. This study aimed to assess nutritional knowledge, attitude, and eating behavior using the Knowledge–Attitude–Practice (KAP) framework and to compare nutritional intake profiles between patients with controlled and uncontrolled glycemic status. Methods: A cross-sectional study was conducted among 70 patients with T2DM attending a health-promoting hospital in northeastern Thailand. Participants were classified into glycemic-controlled (GC; HbA1c < 7%, n = 36) and glycemic-uncontrolled (UC; HbA1c ≥ 7%, n = 34) groups. Data were collected using a semi-structured questionnaire covering demographics, anthropometry, body composition, biochemical parameters, and KAP domains. Dietary intake was assessed using three-day food records (two weekdays and one weekend day) and analyzed with the INMUCAL Nutrients program. Statistical analyses included descriptive statistics, group comparisons, logistic regression, and Spearman’s correlation. Results: Overall, participants demonstrated high levels of nutritional knowledge (71.4%) and fair attitude (52.9%), but moderate levels of appropriate eating behavior (58.6%). Eating behavior differed significantly between GC and UC groups (p = 0.038). The UC group consumed significantly higher amounts of total energy, carbohydrates, simple carbohydrates, and protein than the GC group. HbA1c and fasting blood glucose were positively correlated with total energy, carbohydrate, simple carbohydrate, and zinc intake, while protein and phosphorus intake were positively associated with fasting blood glucose only. Logistic regression analysis showed no significant associations between KAP domains and glycemic control. Conclusions: Glycemic control among rural Thai patients with T2DM was more closely related to dietary intake patterns than to nutritional knowledge or attitude alone, highlighting the need for context-specific, community-based dietary interventions.

1. Introduction

The increasing burden of non-communicable diseases (NCDs) has emerged as a major global public health challenge over the past decade [1]. This trend has been closely associated with lifestyle transitions, including unhealthy dietary patterns, chronic stress, and physical inactivity [2]. In particular, an imbalance between energy intake and energy expenditure, combined with sedentary behavior, plays a critical role in the development of NCDs such as type 2 diabetes mellitus (T2DM), hypertension, cardiovascular disease, and cancer [3]. In Thailand, the prevalence of T2DM has continued to rise. Data from the International Diabetes Federation in 2024 reported a T2DM prevalence of 10.2% among adults [4]. Despite this high prevalence, glycemic control remains suboptimal. Data from the Ministry of Public Health indicated that only 8.8% of patients with T2DM achieved adequate glycemic control, defined as HbA1c levels below 7%. Previous studies have identified several factors associated with glycemic control, including educational level, body mass index (BMI), total cholesterol, and duration of T2DM [5]. Dietary behavior is a key modifiable factor influencing glycemic control and HbA1c levels [6].
In many Asian populations, rice serves as the primary source of dietary carbohydrates. This is particularly evident in rural areas of Thailand, where sticky rice is commonly consumed as the main carbohydrate staple [7,8]. High carbohydrate intake has been widely recognized as a challenge for effective glycemic control and HbA1c management [9]. However, dietary choices are not determined solely by food availability but are also shaped by individual knowledge, attitudes, and habitual practices.
The Knowledge–Attitude–Practice (KAP) model, introduced by Everett M. Rogers in the late 1950s and early 1960s, provides a theoretical framework for understanding health-related behaviors. The model describes a sequential process in which knowledge acquisition influences attitudes, which in turn shape health practices [10]. These components are closely interconnected and collectively affect diabetes self-management and blood glucose control [11,12]. Although the KAP model proposes a sequential pathway, the translation from knowledge and attitude to practice is often incomplete and strongly modified by contextual factors [13]. This study used the framework to interpret, rather than to assume, the relationship between these domains and glycemic control.
Guided by the KAP framework, this study aimed to address two specific objectives. First, it sought to assess diabetes-related knowledge, attitudes, and eating behaviors among patients with T2DM in a rural Thai context. Second, it aimed to examine differences in nutritional profiles in relation to glycemic indicators, including fasting blood glucose and HbA1c, among patients with T2DM. By integrating behavioral factors with nutritional and glycemic outcomes, the findings of this study are intended to inform context-appropriate dietary and behavioral interventions for T2DM management in rural Thailand.

2. Materials and Methods

2.1. Study Design and Study Population

This study was designed as a cross-sectional study. Participants were recruited by consecutive sampling from patients attending the diabetes clinic at Ban Khee Health Promoting Hospital, Mahasarakham Province, in northeastern Thailand. Inclusion criteria were a confirmed diagnosis of T2DM for more than 12 months, age ≥ 35 years, and ability to communicate in Thai. The exclusion criteria were type 1 diabetes, pregnancy, current cancer or end-stage renal disease, reduce weight program. The required sample size was calculated using G*Power version 3.1, based on parameters derived from previous studies, with a statistical power of 0.80 and a significance level alpha of 0.05 [14]. A total of 70 patients with T2DM were included in the study. Participants were classified into two groups according to their glycated hemoglobin (HbA1c) levels. Patients with HbA1c levels below 7% were categorized as the glycemic-controlled (GC) group, while those with HbA1c levels equal to or greater than 7% were categorized as the glycemic-uncontrolled (UC) group based on the Standards of Care in Diabetes 2025 [15]. Data collection was conducted between May and December 2024. The questionnaire was administered face-to-face (pen-and-paper) by researchers.

2.2. Data Collection and Questionnaires

Data were collected using a semi-structured questionnaire comprising five sections. The questionnaire was developed by adapting items from previously published instruments [16] and refining them through a review of the relevant literature, with modifications made to ensure content relevance and contextual appropriateness for patients with T2DM in a rural Thai setting. The first section included eight items on demographic characteristics, namely sex, age, education level, occupation, marital status, income, family history of T2DM, and duration of T2DM. The second section consisted of seven items related to anthropometric measurements, body composition, blood pressure, and biochemical parameters, including fasting blood glucose (FBG) and glycated hemoglobin (HbA1c). All biochemical measurements were obtained using routine laboratory procedures at the hospital. The third section included eleven items assessing nutritional knowledge related to T2DM and appropriate dietary practices for diabetes management. The fourth section comprised ten items evaluating attitudes toward nutrition, while the fifth section consisted of fifteen items assessing eating behaviors among patients with T2DM. Content validity was evaluated by three experts using the Item–Objective Congruence (IOC) index [17]; items with an IOC ≥ 0.50 were retained, and the final instrument yielded IOC values of 0.64–1.00. The instrument was then pilot tested with 30 patients with T2DM of comparable characteristics who were not part of the study sample, and internal consistency was assessed using Cronbach’s alpha coefficient.

2.3. Anthropometry, Body Composition, and Biochemical Measurement

Body weight and height were measured using the same calibrated standard scale. All measurements were conducted in the morning between 7.30 and 9.00 a.m. after an overnight fast. Body composition parameters, including muscle mass, body fat, and visceral fat, were assessed using bioelectrical impedance analysis (HBF-702T, Omron Healthcare, Kyoto, Japan).

2.4. Knowledge, Attitude, and Behavior Assessment

Knowledge was assessed using a dichotomous scoring system, in which correct responses were scored as “1” and incorrect responses as “0”. Following Bloom’s criterion-referenced classification [18]. Participants who correctly answered 80–100% of the items were classified as having good knowledge regarding appropriate eating habits for T2DM. Those scoring 60–79% were categorized as having moderate knowledge, while those scoring less than 60% were classified as having inadequate knowledge.
Attitudes were assessed using items related to nutritional education, nutrition awareness, and utilization of nutrition labeling, with responses categorized as “agree,” “not sure,” or “disagree.” According to Best’s formula [19], attitude scores were classified into three levels: poor (10–17 points), moderate (18–25 points), and good (26–30 points).
Eating behavior was assessed using a frequency-based rating scale with the following response options: “>5 times/week,” “3–5 times/week,” “1–2 times/week,” “1–2 times/month,” and “never.” According to Best’s formula, practice scores were classified into five levels: very poor (15–27 points), poor (28–40 points), moderate (41–53 points), good (54–66 points), and very good (67–75 points) based on Best’s criterion [19].

2.5. Dietary Record and Nutritional Profile Assessment

Dietary intake was assessed using dietary records collected by three trained students from the Nutrition and Dietetics program using food records completed over two weekdays and one weekend day. All the dietary data was analyzed by using the INMUCAL program version 4 (Institute of Nutrition, Mahidol University, Salaya, Nakhon Pathom, Thailand) [20]. The mean intake of energy and each nutrient was then compared with the Dietary Reference Intakes for Thais (Thai-DRI, 2020) to evaluate the adequacy of nutrient intake relative to national recommendations [21].

2.6. Statistical Analysis

Statistical analyses were performed using SPSS software, version 28.0 (IBM Corp., Armonk, NY, USA). Analyses included demographic characteristics, anthropometric and body composition measures, biochemical parameters, knowledge, attitudes, practices among patients with T2DM, and nutrient intake. Descriptive statistics were used to summarize demographic characteristics, as well as measurement outcomes and knowledge, attitude, and practice variables.
The Chi-square test was applied to assess associations between patient groups. For the logistic regression analysis, each explanatory variable was dichotomized. Knowledge scores were categorized as “inadequate” (<80%) or “adequate” (≥80%); this cut-off was not arbitrary but corresponds to the pre-established 80% mastery threshold of Bloom’s criterion-referenced classification [18]. Attitude and eating behavior were dichotomized at the sample median (17 and 32, respectively) because their distributions were skewed and clustered, precluding stable multi-level categories.
The independent samples t-test or the Mann–Whitney U test was used to compare continuous variables, presented as mean ± standard deviation (SD) or median with interquartile range (IQR), depending on data distribution. Spearman’s correlation coefficient was employed to examine the association between nutrient intake and both HbA1c and FBG. Statistical significance was set at p < 0.05.

3. Results

3.1. Characteristics and Demographic Data of Participants

The majority of participants in this study were female, with a mean age of 60.3 ± 6.1 years. The only statistically significant difference between the GC and UC groups was educational level (p = 0.043). A higher proportion of participants in the UC group (68.4%) had more than six years of education. No statistically significant differences were observed between the two groups for other characteristics, including age, sex, marital status, occupation, income, family history of diabetes mellitus, and duration of T2DM (Table 1).

3.2. Anthropometry, Body Composition, and Cardiovascular Measurements of the Participants

As shown in Table 2, no statistically significant differences were observed between the GC and UC groups with respect to anthropometric measures, body composition, or blood pressure. In contrast, markers of glycemic control differed significantly between the two groups. The UC group exhibited a significantly higher median FBG level (147.5 mg/dL) compared with the GC group (124.5 mg/dL; p < 0.001). Consistent with this finding, median HbA1c levels were also significantly higher in the UC group (8.3%) than in the GC group (6.1%; p < 0.001).

3.3. Nutritional Knowledge, Attitude, and Eating Behavior of the Participants

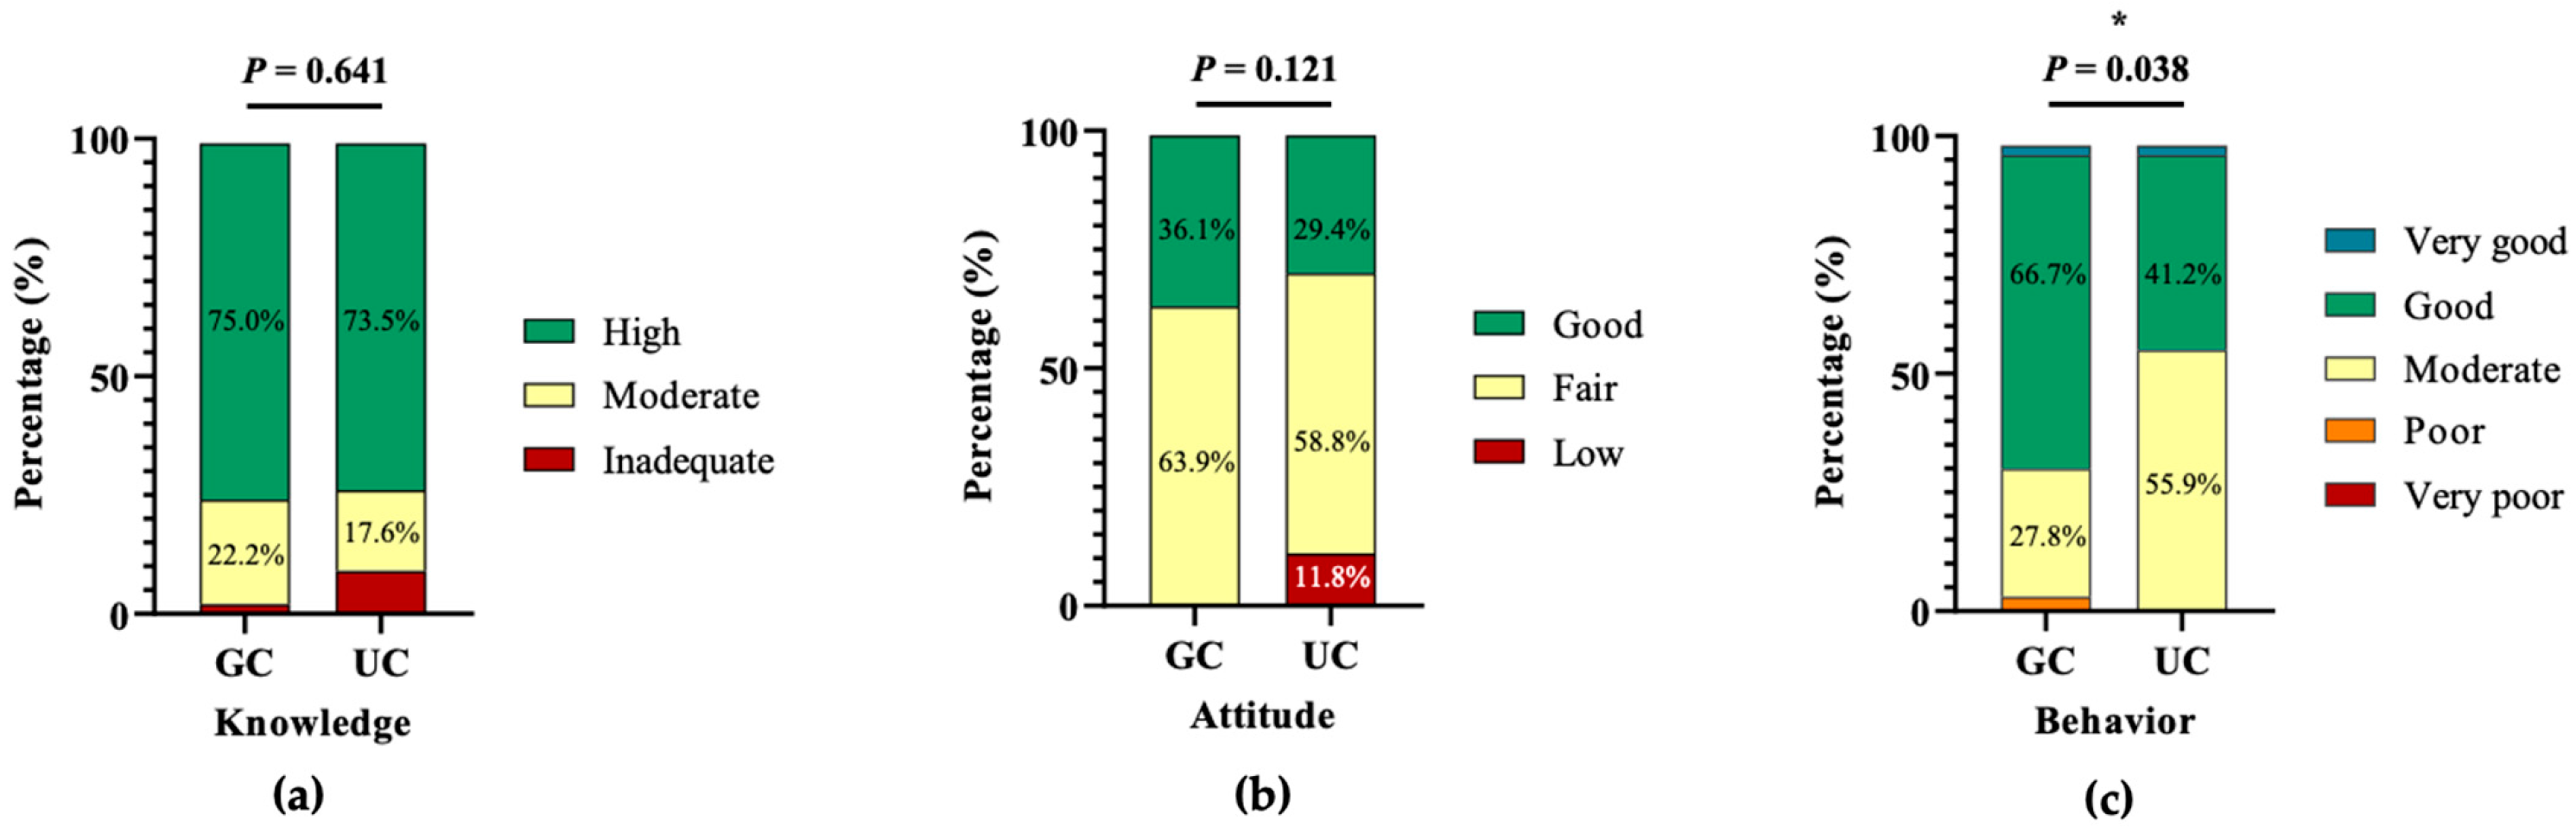
Overall, among the 70 patients with T2DM, 71.4% demonstrated a high level of nutritional knowledge, 52.9% had a fair level of attitude, and 58.6% exhibited a moderate level of eating behavior. Fisher’s exact test revealed a statistically significant association between glycemic control groups and eating behavior (p = 0.038). A higher proportion of patients in the UC group were classified as having a moderate level of eating behavior, whereas the proportion of patients with a good level of eating behavior was lower compared with the GC group (Figure 1).

3.4. The Association Between Glycemic Control and Knowledge, Attitude, and Eating Behavior in the Participants

Based on the distribution of data across cells, median values were used as cut-off points for categorization. The results showed no statistically significant associations between glycemic control status and levels of knowledge, attitude, or eating behavior (Table 3).

3.5. Nutritional Intake of the Participants

Analysis of dietary intake showed that the UC group consumed significantly higher amounts of total energy and macronutrients than the GC group. The mean daily energy intake in the UC group was 1477.7 kcal/day, which was significantly higher than that of the GC group (1265.0 kcal/day; p < 0.001). Similar patterns were observed for carbohydrate intake (UC: 221.5 g/day vs. GC: 185.3 g/day; p < 0.001), simple carbohydrate intake (UC: 28.4 g/day vs. GC: 18.6 g/day; p < 0.001), and protein intake (UC: 71.7 g/day vs. GC: 65.6 g/day; p = 0.023). Fat intake also tended to be higher in the UC group compared with the GC group (33.9 g/day vs. 29.0 g/day; p = 0.050). Among micronutrients, zinc intake was the only nutrient that differed significantly between groups, with higher intake observed in the UC group (6.0 mg/day) compared with the GC group (5.1 mg/day; p = 0.001). No statistically significant differences were observed for other mineral or vitamin intakes between the two groups. Focus on the energy distribution of three main macronutrients, this study found that the proportions of energy derived from carbohydrate (GC: 58.6 ± 6.7% of energy; UC: 60.1 ± 5.6% of energy; p = 0.304) and fat (GC: 20.6 ± 5.6% of energy; UC: 20.4 ± 5.0% of energy; p = 0.884) did not differ significantly between groups. In contrast, protein contributed a significantly smaller proportion of total energy in the UC group (19.5 ± 2.1% of energy) than in the GC group (20.8 ± 2.5% of energy; p = 0.018). While the contribution of simple carbohydrates found lower proportion in GC group (GC: 5.8 ± 2.5% of energy; UC: 7.5 ± 3.0% of energy; p = 0.015) (Table 4).

3.6. The Association Between Glycemic Indices and Nutrition Intake of the Participants

Bivariate correlation analysis demonstrated significant positive associations between HbA1c and total energy intake (p < 0.001), carbohydrate intake (p < 0.001), simple carbohydrate intake (p = 0.006), and zinc intake (p = 0.009). Consistent findings were observed for FBG, which was positively correlated with total energy (p < 0.001), carbohydrate (p = 0.002), simple carbohydrate (p = 0.025), and zinc intake (p < 0.001). Protein intake was also significantly associated with FBG (p = 0.013) (Table 5).

4. Discussion

The patients with T2DM in this study showed no significant differences in characteristics between patients who could and could not control glycemic levels. Only in education did this study found UC had a slightly higher proportion of students studying in school than GC. However, this difference in educational attainment did not translate into differences in occupation, as most participants in both groups were farmers with low income living in rural communities in northeastern Thailand. This slight difference in education was also not accompanied by better eating behavior. This may reflect the small, single-site sample; education was nonetheless retained as an adjustment covariate in the regression analysis.
Anthropometric and body composition measures did not differ significantly between GC and UC patients, with the exception of glycemic indices, including HbA1c and FBG. These findings contrast with previous studies reporting a positive association between higher visceral fat and poor glycemic control [22], as well as a negative association between muscle mass and poor glycemic control [23]. This phenomenon is explained by the pivotal role of muscle in glucose uptake [24]. However, evidence regarding the association between body composition and glycemic control remains controversial, with reported effects often being small and inconsistent across studies [25]. The higher levels of glycemic indices were related to nutrition intake, which found higher levels of total energy intake, carbohydrate, and simple carbohydrate in the uncontrolled group.
Regarding the Knowledge–Attitude–Practice (KAP) framework, this study was designed with the primary objective of investigating participants’ knowledge, attitudes, and practices related to appropriate nutritional intake and how these were applied in self-management of T2DM. Based on the study findings, patients overall demonstrated a high level of knowledge, a fair level of attitude, and a moderate level of eating behavior.
When comparing GC and UC groups, high levels of nutritional knowledge were observed in both groups, with no statistically significant difference, although knowledge levels were slightly higher in the GC group. This level of knowledge may be related to the duration of living with T2DM, as patients typically receive repeated health education from healthcare professionals during routine clinical visits aimed at promoting behavioral change before discharge. This observation is supported by previous research indicating that knowledge of diabetes complications among patients is influenced by factors such as duration of diabetes, occupation, family history, and participation in diabetes counseling programs [26].
Attitude was one of the domains explored in this study. A higher proportion of participants demonstrated a fair level of attitude in the GC group, although the difference was not statistically significant, whereas a lower level of attitude was more frequently observed in the UC group. These findings were consistent with the observed patterns of eating behavior, in which the GC group exhibited better behavioral practices compared with the UC group. A study conducted in India reported positive correlations between knowledge and practice, as well as between knowledge and attitude, among patients with T2DM [27]. That study also identified older age, lower educational level, and longer duration of T2DM as factors associated with poor practice [27]. The KAP findings of the present study partially align with evidence from Vietnam, where practice scores were low, while knowledge and attitude scores were low and moderate, respectively [28]. This difference may be explained by the accessibility of diabetic information; more than half of the patients responded no to receiving diabetic information. In addition, the average disease duration was found to be 4.33 years [28], whereas in the present study, more than half of the participants had lived with T2DM for over five years since diagnosis.
Despite generally high levels of knowledge and fair attitude in this study, participants were unable to fully translate these into appropriate eating behaviors. This finding suggests that knowledge and attitude alone may be insufficient to drive behavioral change. Beyond knowledge and attitude, affective and contextual drivers of intake, including emotional or stress-related eating, may further weaken the translation of nutritional knowledge into practice. In T2DM outpatients, an emotional/uncontrolled eating pattern was independently associated with higher BMI, HbA1c, and triglycerides than a cognitive restraint pattern [29]. This study did not assess emotional or stress-related eating, which may partly explain the observed gap between knowledge/attitude and actual eating behavior. In rural contexts of Thailand, where educational attainment is generally low, healthcare professionals play a critical role as agents of behavior change. However, focusing solely on patients may be inadequate in rural household settings characterized by multigenerational family structures. Food selection and meal preparation are often undertaken by younger family members. Therefore, involving family caregivers in dietary counseling and practical skill-building is essential to facilitate the translation of nutrition education into actual eating behaviors and should be considered as a key component of future interventions [30,31,32].
Logistic regression analysis in this study did not reveal significant associations between knowledge, attitude, or eating behavior and glycemic indices, including HbA1c and FBG. This finding likely reflects the complex and multifactorial nature of glycemic control in T2DM. In rural community settings, eating practices are strongly influenced by household food availability, family decision-making processes, cultural norms, and economic constraints, which may attenuate the direct effects of individual knowledge or attitudes on glycemic outcomes.
Moreover, the main carbohydrate source in this region also warrants consideration. Sticky rice or glutinous rice is well known that has high glycemic index (GI). Sticky (glutinous) rice, the staple carbohydrate in this region, is widely consumed and has a high glycemic index (reported values 75–82) [33]. High-GI carbohydrate intake is associated with greater postprandial hyperglycemia and increased long-term diabetes risk, whereas low-GI or low-glycemic load (GL) dietary patterns have been shown to produce modest but clinically meaningful improvements in HbA1c and fasting glucose among patients with diabetes [34]. Even among patients with good dietary knowledge and generally positive attitudes, actual behavior was more accurately reflected in their nutritional intake. Evidence from Tanzania indicated that residing in rural areas and lacking adequate diabetes knowledge were associated with a lower likelihood of appropriate practices, and that patients with T2DM demonstrated low levels of appropriate practice regarding general diabetes management, risk factors, and related complications [35].
The secondary objective of this study was to compare nutritional profiles between GC and UC patients with T2DM. As expected, higher intakes of total energy, carbohydrates, simple carbohydrates, and protein were observed in the UC group. These findings indicate that greater overall food consumption was associated with poorer glycemic control in this population. However, the overall dietary composition of the two groups was largely similar. The proportions of energy derived from carbohydrate and fat did not differ between the GC and UC groups, and both groups fell within the Acceptable Macronutrient Distribution Ranges recommended by the Institute of Medicine (carbohydrate 45–65%, fat 20–35%, protein 10–35%) [36]. This indicates that the significantly higher absolute macronutrient intake observed in the UC group primarily reflected a greater total energy intake rather than a fundamentally different dietary structure. Notably, this occurred despite a mean energy intake that was below the Thai Dietary Reference Intakes in both groups, suggesting that poor glycemic control in this setting was not attributable to gross energy excess but rather to specific qualitative features of the diet. In addition, HbA1c and FBG levels were positively correlated with total energy, carbohydrate, simple carbohydrate, and zinc intake. Protein and phosphorus intake were positively correlated with FBG, but not with HbA1c. The higher phosphorus levels observed alongside elevated HbA1c may reflect altered phosphate turnover and renal handling associated with chronic hyperglycemia [37].
Similarly, the positive association between protein intake and glycemic indices may reflect broader metabolic dysregulation accompanying poor glycemic control, rather than a direct adverse effect of protein itself, consistent with evidence that protein metabolism is altered in diabetes and may track with disease severity rather than glycemic improvement [38]. Zinc plays an essential role in insulin regulation and antioxidant defense, and the observed positive correlations between zinc intake and FBG or HbA1c are consistent with disrupted zinc homeostasis in diabetes, where circulating zinc levels may fluctuate as part of compensatory or pathological processes rather than reflecting effective glycemic regulation [39]. However, the interpretation of micronutrient findings in the present study warrants caution. Dietary intake was estimated from a three-day food record, which, although widely used and practical for community-based research, is subject to greater day-to-day variability for micronutrients than for energy or macronutrients. This limitation has been demonstrated in patients with T2DM, in whom dietary records showed larger within-individual variation than urinary biomarkers for several nutrients, including phosphorus [40].
Interestingly, when compared with the Thai DRIs (2020), the mean energy intake of both groups fell below the recommended range of 1500–1800 kcal/day (GC: 1265.0 kcal/day; UC: 1477.7 kcal/day), indicating a generally low energy intake across all participants. Notably, poorer glycemic control in the UC group occurred despite this overall low energy intake. This study suggests that the quality and composition of the diet, particularly higher intakes of carbohydrate and simple carbohydrate rather than total energy, were the primary dietary factors associated with glycemic status. In addition, intakes of several micronutrients, including calcium, phosphorus, potassium, magnesium, selenium, zinc, and vitamins B1, B6, B12, C, and E, were below the Thai DRIs in both groups, whereas sodium intake exceeded the recommended level. Nationally representative data from Thailand using 24 h urinary sodium excretion have shown that average sodium intake among Thai adults is nearly twice the World Health Organization recommendation [41]. This excessive intake is largely driven by habitual use of sodium rich condiments such as fish sauce, salt, soy sauce, shrimp paste, and monosodium glutamate during home cooking and food preparation. In rural settings, these condiments are frequently added both during cooking and at the table, reflecting deeply embedded cultural and culinary practices rather than reliance on processed foods alone. Traditional food preservation methods and frequent consumption of fermented or salted products further contribute to excessive sodium intake, providing a plausible explanation for the consistently elevated sodium consumption observed in this study.
Both macro and micronutrients play pivotal roles in cellular function. Although micronutrient deficiencies are common among patients with T2DM, prolonged deficits of certain nutrients may lead to adverse health outcomes, particularly among women [42]. In this study, intakes of antioxidant vitamins C and E were found to be low among patients with T2DM. Previous studies have similarly reported lower concentrations of these antioxidants in individuals with T2DM, including those with obesity [43]. Oxidative stress is commonly elevated in T2DM, and non-enzymatic antioxidants such as vitamins C and E constitute a first-line defense against free radicals. When intake and circulating levels of these antioxidants are insufficient, the imbalance between antioxidants and reactive oxygen species may exacerbate systemic low-grade inflammation in T2DM [44,45].

5. Conclusions

Among patients with T2DM in rural northeastern Thailand, glycemic control was more closely associated with actual dietary intake than with nutritional knowledge or attitude, neither of which was significantly related to glycemic status. Although the uncontrolled group consumed more energy and carbohydrate in absolute terms, the macronutrient distribution of both groups was similar and mean energy intake was below national recommendations, indicating that the quality of the diet, particularly a higher proportional intake of simple carbohydrates from high glycemic index glutinous rice, rather than energy excess, was the key dietary correlate of poor control. These findings underscore a gap between knowledge and practice and point to the need for community-based interventions that address household food preparation, family caregiver involvement, and culturally specific dietary patterns, alongside longitudinal research to establish causal relationships.

6. Limitations

This study has several limitations. Its cross-sectional design precludes causal inference. The small, single-site rural sample limits statistical power and generalizability. KAP and dietary data were self-reported and subject to social-desirability and recall bias. A three-day record has limited precision for micronutrients. Glycemic index/load of staple foods was inferred from the literature rather than measured directly, and residual confounding cannot be excluded. Larger longitudinal and multi-site studies are warranted.

Author Contributions

Conceptualization, R.N.-a. and S.K.; formal analysis, R.N.-a.; investigation, R.N.-a., S.K. and P.A.; supervision, T.S.; validation, R.N.-a. and S.K.; writing—original draft preparation, R.N.-a., S.K.; writing—review and editing, T.S., R.N.-a. and P.A.; visualization, R.N.-a. and S.K. All authors have read and agreed to the published version of the manuscript.

Funding

This study was funded by Mahasarakham University, grant number 6801003/2568.

Institutional Review Board Statement

This study was conducted according to the guidelines laid down in the Declaration of Helsinki and all procedures involving research study participants were approved by the Ethics Committee of Centre for Ethics in Human Research, Mahasarakham University (Approval Code: 246-108/2024, Date approved: 25 April 2024).

Informed Consent Statement

Informed consent was obtained from all subjects involved in the study.

Data Availability Statement

The datasets generated and analyzed during the current study are available from the corresponding author upon reasonable request. They are not publicly available because of participant privacy and ethical restrictions.

Acknowledgments

The authors thank the participants of the study and all staff at the Ban Khee health promoting hospital for support during the data collection phase. In the interest of full transparency regarding the use of artificial intelligence tools, we disclose that Claude Opus 4.6 (Claude Opus 4.6, Anthropic, San Francisco, CA, USA) was used solely for English-language editing (grammar and sentence structure). The authors reviewed and edited all output and take full responsibility for the content.

Conflicts of Interest

The authors declare no conflicts of interest.

Abbreviations

The following abbreviations are used in this manuscript:
T2DMtype 2 diabetes mellitus
GCGlycemic-controlled
UGGlycemic-uncontrolled
KAPKnowledge–Attitude–Practice
FBSfasting blood glucose

References

  1. Armocida, B.; Tolonen, H.; Rakovac, I.; Formenti, B.; Farrington, J.; Ekberg, A.; Bueno, H.; Capelli, G.; Francisci, S.; Frydensberg, M.S.; et al. Strengthening Non-Communicable Diseases Monitoring Systems in Europe through a Multistakeholder Collaborative Approach: A Key Priority for Advancing Data-Driven Policymaking. Lancet Reg. Health Eur. 2026, 61, 101553. [Google Scholar] [CrossRef] [PubMed]
  2. Garg, R.K. The Alarming Rise of Lifestyle Diseases and Their Impact on Public Health: A Comprehensive Overview and Strategies for Overcoming the Epidemic. J. Res. Med. Sci. 2025, 30, 1. [Google Scholar] [CrossRef] [PubMed]
  3. Hildebrand, S.; Pfeifer, A. The Obesity Pandemic and Its Impact on Non-Communicable Disease Burden. Pflug. Arch. 2025, 477, 657–668. [Google Scholar] [CrossRef] [PubMed]
  4. Genitsaridi, I.; Salpea, P.; Salim, A.; Sajjadi, S.F.; Tomic, D.; James, S.; Thirunavukkarasu, S.; Issaka, A.; Chen, L.; Basit, A.; et al. 11th Edition of the IDF Diabetes Atlas: Global, Regional, and National Diabetes Prevalence Estimates for 2024 and Projections for 2050. Lancet Diabetes Endocrinol. 2026, 14, 149–156. [Google Scholar] [CrossRef] [PubMed]
  5. Tarekegn, E.T.; Gobezie, M.Y.; Haile, M.B.; Zerga, A.A. Glycemic Control and Associated Factors among Type 2 Diabetes Patients Attending at Dessie Comprehensive Specialized Hospital Outpatient Department. Sci. Rep. 2025, 15, 9286. [Google Scholar] [CrossRef] [PubMed]
  6. Jing, T.; Zhang, S.; Bai, M.; Chen, Z.; Gao, S.; Li, S.; Zhang, J. Effect of Dietary Approaches on Glycemic Control in Patients with Type 2 Diabetes: A Systematic Review with Network Meta-Analysis of Randomized Trials. Nutrients 2023, 15, 3156. [Google Scholar] [CrossRef] [PubMed]
  7. Aekplakorn, W.; Satheannoppakao, W.; Putwatana, P.; Taneepanichskul, S.; Kessomboon, P.; Chongsuvivat-wong, V.; Chariyalertsak, S. Dietary Pattern and Metabolic Syndrome in Thai Adults. J. Nutr. Metab. 2015, 2015, 468759. [Google Scholar] [CrossRef] [PubMed]
  8. Chupanit, P.; Muktabhant, B.; Schelp, F.P. Dietary Patterns and Their Association with the Components of Metabolic Syndrome: A Cross-Sectional Study of Adults from Northeast Thailand. F1000Research 2019, 7, 905. [Google Scholar] [CrossRef] [PubMed]
  9. Seok, J.-A.; Lee, Y.-K. Analysis of Dietary Behavior and Intake Related to Glycemic Control in Patients with Type 2 Diabetes Aged 30 Years or Older in Korea: Utilizing the 8th Korea National Health and Nutrition Examination Survey (2019–2021). Nutr. Res. Pract. 2024, 18, 239. [Google Scholar] [CrossRef] [PubMed]
  10. Kang, K.; Bagaoisan, M.A.P. Research Status of the Knowledge-Attitude-Practice Theory Model in Gastric Cancer Prevention. Cureus 2024, 16, e64960. [Google Scholar] [CrossRef] [PubMed]
  11. Liu, B.; Wu, X.; Zou, X.; Sun, F.; Yu, J. Knowledge, Attitudes, and Practices of Chronic Type 2 Diabetes Patients in China Toward Continuous Glucose Monitoring: An Online Questionnaire Survey. Diabetes Metab. Syndr. Obes. 2025, 18, 11–22. [Google Scholar] [CrossRef] [PubMed]
  12. Lema, G.D.; Gebeyaw, E.D. Diabetes Knowledge and Glycemic Control among Type 2 Diabetes Patients at Public Hospitals in Debre Berhan, Ethiopia. PLoS ONE 2025, 20, e0317288. [Google Scholar] [CrossRef] [PubMed]
  13. Marouzi, P.; Mousavi Baigi, S.F.; Fereydouni, F.; Hemmatian Rabbani, Z.; Haghighi, B.; Shariati Moghaddam, R. Knowledge, Attitude, and Practice Toward Diabetic Retinopathy Among People With Diabetes: A Systematic Review and Meta-Analysis. Health Sci. Rep. 2026, 9, e72097. [Google Scholar] [CrossRef] [PubMed]
  14. Faul, F.; Erdfelder, E.; Buchner, A.; Lang, A.-G. Statistical power analyses using G*Power 3.1: Tests for correlation and regression analyses. Behav. Res. Methods 2009, 41, 1149–1160. [Google Scholar] [CrossRef] [PubMed]
  15. American Diabetes Association Professional Practice Committee 6. Glycemic Goals and Hypoglycemia: Standards of Care in Diabetes—2025. Diabetes Care 2024, 48, S128–S145. [Google Scholar] [CrossRef] [PubMed]
  16. Nilnate, N.; Prasomsuk, S.; Nilnate, P. Knowledge, attitudes, and behaviors of sweetened food consumption to reduce health risk factors of elderly with non-communicable diseases in Phetchaburi Province. Reg. Health Promot. Cent. 9 J. 2024, 18, 1–12. [Google Scholar]
  17. Rovinelli, R.J.; Hambleton, R.K. On the Use of Content Specialists in the Assessment of Criteri-on-Referenced Test Item Validity. Tijdschr. Voor Onderwijs Res. 1977, 2, 49–60. [Google Scholar]
  18. Bloom, B.S. Handbook on Formative and Summative Evaluation of Student Learning; McGraw-Hill: New York, NY, USA, 1971. [Google Scholar]
  19. Best, J.W. Research in Education; Prentice-Hall: Englewood Cliffs, NJ, USA, 1977. [Google Scholar]
  20. Mahidol University, Institute of Nutrition. Nutrients Calculation Software: INMUCAL-Nutrients V.4.0 Database Version NB.4; Institute of Nutrition, Mahidol University: Nakhon Pathom, Thailand, 2018. [Google Scholar]
  21. Bureau of Nutrition. Dietary Reference Intake Tables for Thais 2020; Bureau of Nutrition, Department of Health, Ministry of Public Health: Bangkok, Thailand, 2020. (In Thailand) [Google Scholar]
  22. Warner, J.D.; Blake, G.M.; Garrett, J.W.; Lee, M.H.; Nelson, L.W.; Summers, R.M.; Pickhardt, P.J. Correlation of HbA1c Levels with CT-Based Body Composition Biomarkers in Diabetes Mellitus and Metabolic Syndrome. Sci. Rep. 2024, 14, 21875. [Google Scholar] [CrossRef] [PubMed]
  23. Alabadi, B.; Civera, M.; De la Rosa, A.; Martinez-Hervas, S.; Gomez-Cabrera, M.C.; Real, J.T. Low Muscle Mass Is Associated with Poorer Glycemic Control and Higher Oxidative Stress in Older Patients with Type 2 Diabetes. Nutrients 2023, 15, 3167. [Google Scholar] [CrossRef] [PubMed]
  24. Merz, K.E.; Thurmond, D.C. Role of Skeletal Muscle in Insulin Resistance and Glucose Uptake. Compr. Physiol. 2020, 10, 785–809. [Google Scholar] [CrossRef]
  25. Solanki, J.D.; Makwana, A.H.; Mehta, H.B.; Kamdar, P.; Gokhale, P.A.; Shah, C.J. Effect of Current Glycemic Control on Qualitative Body Composition in Sedentary Ambulatory Type 2 Diabetics. Niger. Med. J. 2016, 57, 5–9. [Google Scholar] [CrossRef] [PubMed]
  26. Chekol, G.Z.; Mengistu, D.; Tadesse, A.W. Is the Duration of Diabetes Diseases Positively Associated With Knowledge About Diabetic Complications? Knowledge of Diabetes Mellitus Complications and Associated Factors Among Type-2 Diabetic Patients in Public Hospitals of Addis Ababa, 2020. Front. Public Health 2021, 9, 812586. [Google Scholar] [CrossRef] [PubMed]
  27. Reddy, D.R.; Kodi, V.K. Assessment of Knowledge, Attitude, and Practice of Type 2 Diabetic Patients in a Tertiary Care Hospital. Int. J. Med. Pharm. Res. 2025, 6, 944–949. [Google Scholar]
  28. Le, N.K.; Turnbull, N.; Van Dam, C.; Khiewkhern, S.; Thiabrithi, S. Impact of Knowledge, Attitude, and Practices of Type 2 Diabetic Patients: A Study in the Locality in Vietnam. J. Educ. Health Promot. 2021, 10, 72. [Google Scholar] [CrossRef] [PubMed]
  29. Freitag, A.C.; Koller, O.G.; Menezes, V.M.; Luft, V.C.; de Almeida, J.C. Emotional and Uncontrolled Eating Behaviors Are Associated with Poorer Glycemic Control in Patients with Type 2 Diabetes. Nutr. Res. 2025, 140, 93–101. [Google Scholar] [CrossRef] [PubMed]
  30. Baig, A.A.; Benitez, A.; Quinn, M.T.; Burnet, D.L. Family Interventions to Improve Diabetes Outcomes for Adults. Ann. N. Y Acad. Sci. 2015, 1353, 89–112. [Google Scholar] [CrossRef] [PubMed]
  31. Diriba, D.C.; Leung, D.Y.P.; Suen, L.K.P. Effects of Family-Based Diabetes Self-Management Education and Support Programme on Support Behaviour amongst Adults with Type 2 Diabetes in Western Ethiopia. Sci. Rep. 2023, 13, 20867. [Google Scholar] [CrossRef] [PubMed]
  32. Feng, Y.; Zhao, Y.; Mao, L.; Gu, M.; Yuan, H.; Lu, J.; Zhang, Q.; Zhao, Q.; Li, X. The Effectiveness of an eHealth Family-Based Intervention Program in Patients With Uncontrolled Type 2 Diabetes Mellitus (T2DM) in the Community Via WeChat: Randomized Controlled Trial. JMIR Mhealth Uhealth 2023, 11, e40420. [Google Scholar] [CrossRef] [PubMed]
  33. Lerdluksamee, C.; Srikaeo, W.; Srikaeo, K. Glycemic Responses of Special Rice: Case Study in Thai Geographical Indication Rice Cultivars agriculture and natural resources. Agric. Nat. Resour. 2024, 58, 13–22. [Google Scholar] [CrossRef]
  34. Chiavaroli, L.; Lee, D.; Ahmed, A.; Cheung, A.; Khan, T.A.; Blanco, S.; Mejia; Mirrahimi, A.; Jenkins, D.J.A.; Livesey, G.; et al. Effect of Low Glycaemic Index or Load Dietary Patterns on Glycaemic Control and Cardi-ometabolic Risk Factors in Diabetes: Systematic Review and Meta-Analysis of Randomised Controlled Trials. BMJ 2021, 374, n1651. [Google Scholar] [CrossRef] [PubMed]
  35. Joho, A.A.; Sandi, F.; Yahaya, J.J. Determinants of Knowledge, Attitude, and Practice among Patients with Type 2 Diabetes Mellitus: A Cross-Sectional Multicenter Study in Tanzania. PLoS Glob. Public Health 2023, 3, e0001351. [Google Scholar] [CrossRef] [PubMed]
  36. Institute of Medicine. Dietary Reference Intakes for Energy, Carbohydrate, Fiber, Fat, Fatty Acids, Cholesterol, Protein, and Amino Acids; National Academies Press: Washington, DC, USA, 2005. [Google Scholar] [CrossRef] [PubMed]
  37. Raikou, V.D.; Kyriaki, D.; Gavriil, S. Importance of Serum Phosphate in Elderly Patients with Diabetes Mellitus. World J. Diabetes 2020, 11, 416–424. [Google Scholar] [CrossRef] [PubMed]
  38. Flores-Hernández, M.N.; Martínez-Coria, H.; López-Valdés, H.E.; Arteaga-Silva, M.; Arrieta-Cruz, I.; Gutiér-rez-Juárez, R. Efficacy of a High-Protein Diet to Lower Glycemic Levels in Type 2 Diabetes Mellitus: A Systematic Review. Int. J. Mol. Sci. 2024, 25, 10959. [Google Scholar] [CrossRef] [PubMed]
  39. Younes, S. The Role of Micronutrients on the Treatment of Diabetes. Hum. Nutr. Metab. 2024, 35, 200238. [Google Scholar] [CrossRef]
  40. Takaoka, T.; Watanabe, D.; Hosokawa, M.; Hosokawa, K.; Kubota, S.; Kawai, Y.; Oono, F.; Inoue, Y.; Zakoji, C.; Oiwa, A.; et al. Within- and Between-Individual Variations in Protein, Sodium, Potassium, and Phosphorus Intake Estimated from Urinary Biomarkers and Dietary Records in Individuals with Type 2 Diabetes Mellitus. Nutrients 2025, 17, 1757. [Google Scholar] [CrossRef] [PubMed]
  41. Chailimpamontree, W.; Kantachuvesiri, S.; Aekplakorn, W.; Lappichetpaiboon, R.; Sripaiboonkij Thokanit, N.; Vathesatogkit, P.; Kunjang, A.; Boonyagarn, N.; Sukhonthachit, P.; Chuaykarn, N.; et al. Estimated Dietary Sodium Intake in Thailand: A Nationwide Population Survey with 24-Hour Urine Collections. J. Clin. Hypertens. 2021, 23, 744–754. [Google Scholar] [CrossRef] [PubMed]
  42. Mangal, D.K.; Shaikh, N.; Tolani, H.; Gautam, D.; Pandey, A.K.; Sonnathi, Y.; Gupta, S.D.; Kalra, S.; Sharma, K.C.; Prasad, J.; et al. Burden of Micronutrient Deficiency among Patients with Type 2 Diabetes: Systematic Review and Meta-Analysis. BMJ Nutr. Prev. Health 2025, 8, e000950. [Google Scholar] [CrossRef] [PubMed]
  43. Caturano, A.; D’Angelo, M.; Mormone, A.; Russo, V.; Mollica, M.P.; Salvatore, T.; Galiero, R.; Rinaldi, L.; Vetrano, E.; Marfella, R.; et al. Oxidative Stress in Type 2 Diabetes: Impacts from Pathogenesis to Lifestyle Modifications. Curr. Issues Mol. Biol. 2023, 45, 6651–6666. [Google Scholar] [CrossRef] [PubMed]
  44. Mummadi, M.K.; Sapavat, S.; Ettey, I.; Appala, T.; Geddam, J.J.B. Antioxidant Nutrients and Diabetes and Its Complications: A Narrative Review on the Roles of Vitamin E, Vitamin C, and Selenium. Cureus 2025, 17, e95075. [Google Scholar] [CrossRef] [PubMed]
  45. Shrivastav, D.; Dabla, P.K.; Sharma, J.; Viswas, A.; Mir, R. Insights on Antioxidant Therapeutic Strategies in Type 2 Diabetes Mellitus: A Narrative Review of Randomized Control Trials. World J. Diabetes 2023, 14, 919–929. [Google Scholar] [CrossRef] [PubMed]
Figure 1. Distribution of nutritional knowledge, attitude, and eating behavior levels of the participants (a) nutritional knowledge, (b) nutritional attitude, (c) eating behavior. Abbreviation: GC, glycemic-controlled; UC, glycemic-uncontrolled. * indicates statistically significant difference (p < 0.05).
Diabetology 07 00139 g001
Table 1. Characteristics and demographic data of the participants (n = 70).
CategoryTotal (n = 70)GC (n = 36)UC (n = 34)p
Age (year)<60 years old39 (55.7)22 (61.1)17 (50.0)0.350
≥60 years old31 (44.3)14 (38.9)17 (50.0)
GenderMale (%)21 (30.0)12 (33.3)9 (26.5)0.531
Female (%)49 (70.0)24 (66.7)25 (73.5)
Education≤6 years51 (72.9)30 (58.8)21 (41.2) 0.043
>6 years19 (27.1)6 (31.6)13 (68.4)
StatusSingle19 (27.1)11 (57.9)8 (42.1)0.509
Marriage51 (72.9)25 (49.0)26 (51.0)
OccupationNon-farmer12 (17.1)6 (50.0)6 (50.0)0.913
Farmer58 (82.9)30 (51.7)28 (48.3)
Monthly income (Bath)≤300049 (70.0)27 (75.0)22 (64.7)0.348
>300021 (30.0)9 (25.0)12 (35.3)
Family history on DMYes40 (57.1)24 (60.0)16 (40.0)0.098
No30 (42.9)12 (40.0)18 (60.0)
Duration (years)≤5 years28 (40.0)13 (46.4)15 (53.6)0.494
>5 years42 (60.0)23 (54.8)19 (45.2)
Note: Data is presented as frequency and percentage; n (%). Abbreviation: type 2 diabetes mellitus.
Table 2. Anthropometry, body composition, and cardiovascular measurements of the participants (n = 70).
Total (n = 70)GC (n = 36)UC (n = 34)p
Body mass (kg)56.9 ± 9.358.1 ± 10.555.7 ± 7.80.278
Height (cm)152.0 (149.8–160.0)152.0 (150.0–160.0)152.0 (149.0–158.5)0.745
BMI (kg/m2)24.1 ± 3.624.5 ± 4.223.7 ± 2.80.380
Muscle mass (%)30.5 (27.4–34.8)31.5 (29.8–36.7)31.0 (26.6–34.1)0.293
Body fat (%)25.8 ± 6.226.0 ± 6.425.6 ± 6.00.804
Visceral fat (%)8.3 (5.9–10.5)8.3 (5.6–12.0)8.0 (5.9–9.6)0.874
HR (/min)79.8 ± 8.179.1 ± 8.280.1 ± 8.10.470
SBP (mmHg)134.1 ± 14.0134.3 ± 13.1133.9 ± 15.10.900
DBP (mmHg)75.9 ± 10.476.1 ± 10.975.7 ± 9.90.863
FBG (mg/dL)131.5 (119.0–151.0)124.5 (112.3–130.8)147.5 (137.0–171.3)<0.001
HbA1c (%)6.6 (6.1–8.3)6.1 (5.5–6.3)8.3 (7.6–9.4)<0.001
Note: The data were presented as median (IQR) or mean and standard deviation (SD). Abbreviation: GC, glycemic-controlled; UC, glycemic-uncontrolled; BMI, body mass index; HR, heart rate; SBP, systolic blood pressure; DBP, diastolic blood pressure; FBG, fasting blood glucose; HbA1c, glycated hemoglobin.
Table 3. Logistic regression analysis of the association between HbA1c levels and nutritional knowledge, attitude, and eating behavior (n = 70).
ItemsCategoryCOR95% CIpAOR #95% CIp
Nutrition knowledge related to T2DMInadequate1 1 0.670
Adequate0.800.31–2.030.6330.810.31–2.13
Attitude for appropriate eatingFair1 1 0.854
Good1.110.43–2.850.8261.100.42–2.89
Diet behaviorFair1 1 0.660
Good0.620.24–1.600.3230.800.29–2.18
# Adjusted for education. Abbreviation: T2DM, type 2 diabetes mellitus.
Table 4. Nutrition intake of the participants (n = 70).
NutrientsThai-DRI 2020Total (n = 70)GC (n = 36)UC (n = 34)p
Energy (kcal/day)1500–18001368.3 ± 211.31265.0 ± 147.51477.7 ± 215.1<0.001
Carbohydrate (g)180–325202.9 ± 36.9185.3 ± 30.0221.5 ± 34.6<0.001
Simple carbohydrate (g)2423.4 ± 12.318.6 ± 8.528.4 ± 13.7<0.001
Protein (g)49–5968.5 ± 11.365.6 ± 10.171.7 ± 11.80.023
Fat (g)40–7031.4 ± 10.429.0 ± 9.033.9 ± 11.30.050
Carbohydrate
(% of energy)
45–65%59.3 ± 6.258.6 ± 6.760.1 ± 5.60.304
Simple carbohydrate
(% of energy)
<10%6.7 ± 2.95.8 ± 2.57.5 ± 3.00.015
Protein
(% of energy)
10–35%20.1 ± 2.420.8 ± 2.519.5 ± 2.10.018
Fat
(% of energy)
20–35%20.5 ± 5.320.6 ± 5.620.4 ± 5.00.884
Calcium (mg)1000322.1 (244.4–735.2)307.8 (233.7–400.4)331.0 (250.6–384.7)0.347
Phosphorus (mg)700628.4 (562.5–735.2)615.2 (539.1–663.9)637.0 (584.8–747.7)0.169
Potassium (mg)2050–41001383.8 (1173.5–1538.3)1348.0 (1191.5–14,567.5)1452.5 (1101.5–1624.6)0.067
Sodium (mg)400–14503193.5 ± 906.23100.7 ± 958.53291.8 ± 850.60.382
Magnesium (mg)240–30048.4 ± 18.346.7 ± 17.750.2 ± 18.90.269
Selenium (mcg)5532.7 ± 15.131.6 ± 12.633.9 ± 17.40.787
Zinc (mg)9.75.5 ± 1.25.1 ± 0.86.0 ± 1.30.001
Vitamin B1 (mg)2.41.1 (0.7–1.4)1.0 (0.7–1.3)1.1 (0.7–1.4)0.296
Vitamin B2 (mg)1.1–1.21.1 (0.9–1.3)1.0 (0.6–1.3)1.0 (0.9–1.3)0.981
Vitamin B6 (mg)1.5–1.70.5 (0.3–0.6)0.5 (0.3–0.6)0.4 (0.3–0.7)0.589
Vitamin B12 (mcg)2.41.6 (0.4–2.6)0.8 (0.4–2.7)0.8 (0.5–2.6)0.963
Vitamin C (mg)85–10071.7 (29.0–66.0)41.9 (23.0–66.3)48.3 (36.6–65.1)0.188
Niacin (mg)14–1616.7 (14.2–18.9)16.1 (13.8–17.7)17.2 (14.6 20.2)0.166
Vitamin E (mg)11–130.8 (0.3–1.0)0.6 (0.3–0.9)0.8 (0.5–1.1)0.062
Abbreviation: Thai-DRI, dietary reference intake for Thais.
Table 5. Bivariate correlations between glycemic indices and nutrient intake (n = 70).
NutrientsHbA1c (%)FBG (mg/dL)
rprp
Energy (kcal/day)0.398<0.0010.410<0.001
Carbohydrate (g)0.423<0.0010.3580.002
Simple carbohydrate (g)0.3250.0060.2680.025
Protein (g)0.2100.0810.2940.013
Fat (g)0.2130.0770.1870.120
Calcium (mg)0.0010.9920.0250.838
Phosphorus (mg)0.0560.6450.2600.030
Potassium (mg)0.1690.1620.2070.085
Sodium (mg)0.1210.3180.0440.718
Magnesium (mg)0.1320.2780.1550.199
Selenium (mcg)0.0460.7040.0500.684
Zinc (mg)0.3090.0090.3820.001
Vitamin B1 (mg)0.0770.5290.0050.970
Vitamin B2 (mg)−0.0800.5110.0770.526
Vitamin B6 (mg)0.0990.4160.0210.864
Vitamin B12 (mcg)0.0070.9530.0670.581
Vitamin C (mg)0.1240.3070.1680.165
Niacin (mg)0.1310.2800.1230.311
Vitamin E (mg)0.1740.1500.0780.522
Abbreviation: FBG, fasting blood glucose; HbA1c, glycated hemoglobin.
Disclaimer/Publisher’s Note: The statements, opinions and data contained in all publications are solely those of the individual author(s) and contributor(s) and not of MDPI and/or the editor(s). MDPI and/or the editor(s) disclaim responsibility for any injury to people or property resulting from any ideas, methods, instructions or products referred to in the content.