
Article

Long-Term Cholecalciferol Supplementation and Metabolic Parameters in Postmenopausal Women with Type 2 Diabetes Mellitus: A Longitudinal Prospective Study

by
Monique Resende Costa Machado
1,
Claudio Melibeu Bentes
2,3,
Claudia Cardoso Netto
4,
Letícia Baptista de Paula Barros
1,
Rafael Bizarelo
5,
Karina Ribeiro Silva
6,7,
Humberto Miranda
8,
Pablo B. Costa
9,* and
Lizanka Paola Figueiredo Marinheiro
1
1
National Institute of Women, Children and Adolescent Health Fernandes Figueira (INSMCA-Fernandes Figueira), Fiocruz, Rio de Janeiro 22250-020, Brazil
2
Physical Activity Sciences Post-Graduate Program (PGCAF), Salgado de Oliveira University (UNIVERSO), Niteroi 24030-060, Brazil
3
Laboratory of Physiology and Human Performance, Department of Physical Education and Sports, Institute of Education, Federal Rural University of Rio de Janeiro (UFRRJ), Seropedica 23890-000, Brazil
4
Biochemistry Department, Biomedical Institute, Federal University of the State of Rio de Janeiro (UNIRIO), Rio de Janeiro 20211-010, Brazil
5
Post-Graduate Program in Nutrition (PPGN), Nutrition Institute, Federal University of Rio de Janeiro (UFRJ), Rio de Janeiro 21941-902, Brazil
6
Laboratory of Stem Cell Research, Department of Histology and Embryology, Institute of Biology, State University of Rio de Janeiro (UERJ), Rio de Janeiro 20550-013, Brazil
7
Department of Biomedical and Health Sciences, Institute of Biology, State University of Rio de Janeiro (UERJ), Rio de Janeiro 20550-013, Brazil
8
Performance, Training, and Physical Exercise Laboratory, Federal University of Rio de Janeiro (UFRJ), Rio de Janeiro 21941-901, Brazil
9
Department of Kinesiology, California State University, Fullerton, CA 92831, USA
*
Author to whom correspondence should be addressed.
Diabetology 2026, 7(7), 129; https://doi.org/10.3390/diabetology7070129
Submission received: 2 June 2026 / Revised: 24 June 2026 / Accepted: 2 July 2026 / Published: 6 July 2026

Abstract

Background/Objectives: Type 2 diabetes mellitus (T2DM) and menopause are associated with low levels of vitamin D (25[OH]D). Primary trials reported the effects of cholecalciferol supplementation on glycemia and T2DM incidence with conflicting results. This uncontrolled longitudinal prospective study aimed to evaluate changes in metabolic and cardiovascular parameters in postmenopausal women with T2DM during sequential cholecalciferol supplementation. Methods: Thirty-four postmenopausal women (mean of 63.8 ± 7.5 years) with T2DM received 1000 IU/day of cholecalciferol for 12 months, followed by 2000 IU/day for another 12 months. Fasting blood tests, anthropometric assessments, and physical examinations were performed at baseline, 12 months, and 24 months after the intervention. The levels of 25(OH)D, fasting glycemia, glycated hemoglobin, fasting insulin, homeostasis model assessment (HOMA) of insulin resistance, HOMA of β-cell function (HOMA-β), total cholesterol, high-density lipoprotein cholesterol (HDL-c), triglycerides, and C-reactive protein were evaluated. Systolic blood pressure (SBP), diastolic blood pressure, waist circumference (WC), waist-to-hip ratio, and body mass index were also assessed. Results: Serum 25(OH)D and HDL-c levels increased over time during the follow-up period. Lower WC and SBP values were observed across follow-up assessments. Although fasting blood glucose values showed a median of 120 mg/dL at baseline and 110 mg/dL after cholecalciferol supplementation, and HOMA-β values were approximately 35% higher at the end of follow-up, these differences were not statistically significant (p = 0.059 and p = 0.158, respectively). Conclusions: The long-term 25(OH)D dosing regimen had modest beneficial effects on glucose homeostasis, lipid profiles, and blood pressure in postmenopausal women with T2DM. This study contributes to the search for an optimal daily 25(OH)D dose in postmenopausal women with diabetes.

1. Introduction

Vitamin D deficiency, assessed by serum 25-hydroxyvitamin D [25(OH)D], and type 2 diabetes mellitus (T2DM) are global public health concerns. They commonly occur in the elderly population and have implications for the development of complications related to bone mineral metabolism [1,2,3]. Menopause, or menstrual cycle arrest caused by the reduced secretion of estrogen and progesterone, is defined as the absence of continuous cycles within 1 year [4]. Estrogen increases the activity of 1-α-hydroxylase (expressed in the kidneys), which is responsible for the activation of 25(OH)D and upregulation of vitamin D receptor (VDR) [5]. Female aging and the subsequent decline in estrogen levels are associated with declining 25(OH)D levels [6], which is a steroidal hormone known for its essential role in maintaining calcium homeostasis, promoting and maintaining bone health, and improving immune function. Previous recommendations from the Endocrine Society suggested cholecalciferol supplementation for fall prevention, recommending daily intakes of 600 IU/day for adults aged 50–70 years and 800 IU/day for adults older than 70 years [7]. However, the updated 2024 Endocrine Society guideline no longer recommends vitamin D supplementation beyond the Dietary Reference Intake (DRI) values for healthy adults aged 50–74 years. Nevertheless, supplementation is still suggested for adults older than 75 years because of its potential benefits on health outcomes and mortality reduction [8].
Epidemiological observations have associated low levels of 25(OH)D with an increased risk of nonmusculoskeletal diseases, such as type 1 diabetes mellitus (T1DM), T2DM, and cardiovascular disease (CVD) [9,10,11]. The potential extraskeletal function of 25(OH)D has been suggested, including the expression of VDR in many non-skeletal cells (e.g., β-pancreatic cells) [6,12]. Additional evidence strongly suggests that 25(OH)D status plays a role in modifying the risk for T2DM. This influence seems to be primarily mediated by 25(OH)D, affecting β-cell function, insulin sensitivity, and systemic inflammation [13,14]. Previous longitudinal and cross-sectional observational studies reported an association between 25(OH)D status and the risk of T2DM or glycemia among patients with established T2DM [11,12,13,14]. Recent studies have associated low serum 25(OH)D levels with worsening clinical outcomes in patients with type 2 diabetes mellitus, including poorer glycemic control, increased insulin resistance, and a higher risk of metabolic syndrome [15,16].
Insulin resistance has recently been associated with vitamin D status in postmenopausal women of Caucasian descent with T2DM [17]. However, existing evidence regarding the beneficial effects of cholecalciferol supplementation as a method of improving glucose homeostasis or insulin resistance in patients with diabetes, impaired glucose tolerance, or normal fasting glucose is insufficient [18,19] and needs to be further investigated [17].
The current study investigated whether cholecalciferol supplementation in postmenopausal women with T2DM, which is already clinically indicated for fall prevention, has beneficial effects on the metabolic control of T2DM, lipid profile, and blood pressure. The question of whether the doses of 25(OH)D prescribed for fall prevention in the elderly population (600 and 800 IU/day of 25[OH]D for 50–70 and 70 years, respectively) are sufficient to provide all other potential non-skeletal benefits of 25(OH)D, such as glycemic homeostasis, lipid metabolism, and cardiovascular health, remains unknown. In addition, increasing the blood 25(OH)D levels to sufficient levels (>30 ng/mL) may require at least 1500–2000 IU/day of supplementation [7]. Therefore, this study aimed to evaluate the effects of progressive cholecalciferol supplementation over a two-year period on glucose homeostasis, lipid metabolism, and blood pressure in postmenopausal women with T2DM.

2. Materials and Methods

2.1. Patients and Study Design

This uncontrolled prospective longitudinal study involved a database sample of postmenopausal women clinically diagnosed with T2DM who habitually attended an ambulatory endocrinology clinic. Thirty-four women in the postmenopausal period (with a follicle-stimulating hormone level of ≥40 mIU/mL, hypoestrogenism, and amenorrhea for at least 1 year after the last menstrual period) [18], those who were diagnosed with T2DM (a two-time fasting glucose level of ≥126 mg/dL after an 8 h fasting period, a blood glucose level of ≥200 mg/dL 2 h after an oral glucose tolerance test, or signs and symptoms of hyperglycemia with a blood glucose level of ≥200 mg/dL at any time of the day) [20], and those who already had a clinical indication of cholecalciferol supplementation were included in the analysis. Women diagnosed with cancer, renal failure, hyperparathyroidism, hypercalcemia, nephrolithiasis, liver disease, or granulomatous diseases; those who received pharmacological treatment that could affect glycemic and lipid metabolism, 25(OH)D metabolism, or 25(OH)D absorption (such as insulin, phenytoin, rifampicin, isoniazid, glucocorticoid, and ketoconazole); or those who received antiretroviral medication for HIV, anticonvulsants, or nutritional supplements containing calcium or 25(OH)D were excluded. Due to the lack of consensus on the definition of an optimal 25(OH)D status [7,21,22,23,24] and the limited number of studies yielding results that can be generalizable to clinical practice, the plasma level of 25(OH)D at baseline was not included in the inclusion or exclusion criteria. All participants read and signed an informed consent form prior to the study enrollment. The study was approved by the local research ethics committee (CAAE36698514.1.0000.5269) and conducted in accordance with the Declaration of Helsinki.

2.2. Intervention, Follow-Up, and Measurements

After selection and baseline measurements, eligible participants received 1000 IU/day of cholecalciferol for 12 months and 2000 IU/day for another 12 months. The doses were selected based on the available literature [7,25,26], which recommends a dose of 1000 IU/day for patients with adequate 25(OH)D levels (≥30 ng/mL) as a 25(OH)D maintenance regimen and a dose of 2000 IU/day for patients with insufficient or deficient 25(OH)D levels, depending on ethnicity. Moreover, these doses are safe [7] and higher than those established in the consensus for the prevention of falls in postmenopausal women, which were 600–800 IU/day (as indicated by the main medical societies of osteoporosis monitoring [27]. The patients remained on the same diet, which had been prescribed previously for the management of diabetes at the outpatient clinic, and additional nutritional supplementation was not permitted. Treatment adherence was assessed through biweekly telephone inquiries and conducting pill counts during consultations (percentage of pills taken to the number of pills that should have been taken). The volunteers underwent fasting blood tests, anthropometric evaluation of body composition, and clinical examinations every three or six months and received a new quantity of tablets.
The outcomes were measured at the following time points: pretreatment (P0), 12 months after treatment initiation (P12), and 24 (P24) months after treatment initiation. Serum levels of 25(OH)D, fasting glycemia (FG), glycated hemoglobin (HbA1c), fasting insulin (I), insulin resistance measured by the homeostasis model assessment (HOMA-IR) and insulin secretory capacity (HOMA-β), total cholesterol (TC), high-density lipoprotein cholesterol (HDL-c), triglycerides (TGs), and C-reactive protein (CRP) were evaluated. Systolic blood pressure (SBP), diastolic blood pressure (DBP), waist circumference (WC), hip circumference (HC), waist-to-hip ratio (WHR), and body mass index (BMI) were also assessed.

2.3. Anthropometric Data and Blood Pressure

Height was measured using a stadiometer (Stadiometer 208 Bodymeter; Seca GmbH, Hamburg, Germany), while WC and HC were measured using an anthropometric tape. WC was measured at half of the mean distance between the iliac crest and lower costal margin. Body mass was measured using a digital scale InBody 720 (Biospace, Seoul, Republic of Korea). BMI was measured as body mass (kg) divided by height squared (m2). Prior to these measurements, the participants were asked to (1) wear comfortable clothing, (2) fast for 12 h prior to the test, and (3) refrain from performing any physical activity 24 h before the test.
BP was measured using an automatic device (Durashock DS44-BR; Welch Allyn, Skaneateles Falls, NY, USA) on the right arm in a seated position after resting for 5 min. Hypertension was defined as a systolic pressure of ≥140 mmHg, a diastolic pressure of ≥90 mmHg, or a previously known history of hypertension and antihypertensive medication use.

2.4. Biochemical Analysis

Biochemical analysis of venous blood samples was performed in the morning after a 12 h overnight fast; the analysis included FG by enzymatic colorimetric method, HbA1c by high-resolution liquid chromatography, 25(OH)D and fasting insulin by chemiluminescent assay, CRP by nephelometry, and TC, HDL-c, and TG by esterase/oxidase assay (all kits purchased from Wiener Laboratories). Homeostatic model assessment (HOMA) was used to determine insulin resistance (HOMA-IR, Equation (1)) and β-cell function based on insulin secretory capacity (HOMA-β Equation (2)), as follows [4]:
HOMA-IR = (fasting insulin (µU/mL) × fasting glucose (mmol/L)/22.5
HOMA-β = (20 × fasting insulin (µU/mL))/(fasting glucose (mmol/L) − 3.5

2.5. Statistical Analysis

All data were presented as the medians and percentiles (25% and 75%, respectively). The Shapiro–Wilk (SW) test was used to verify the normality of distribution. For normally distributed data, the effect of time on each variable was evaluated using repeated-measures analysis of variance. A post hoc Bonferroni test was adopted for multiple comparisons between time points. For non-normally distributed data, Friedman’s nonparametric test was used to verify the possible differences over time, while a pairwise Wilcoxon post hoc test was adopted for the analysis of multiple comparisons between the time points. The correlations between serum 25(OH)D levels and serum biochemical indicators of glucose and lipid metabolism were analyzed using Pearson’s (normally distributed data) or Spearman’s (non-normally distributed data) correlation analyses. An alpha value of <0.05 was considered significant. SPSS 25.0 (IBM Corp., Armonk, NY, USA) software was used for performing all statistical analyses.
Given the longitudinal design of this study, a post hoc sensitivity analysis was performed using G*Power (version 3.1, Heinrich-Heine-Universität, Düsseldorf, Germany). Assuming a repeated-measures ANOVA with three time points (baseline, 12 months, and 24 months), a total sample size of N = 34, and an alpha level of 0.05, the study achieved a statistical power of 0.89 to detect moderate within-subject effects (Cohen’s f = 0.25). However, given the absence of a placebo-controlled design and the uniform increase in supplementation dose after 12 months across all participants, the study might not have had sufficient statistical power to detect moderate differences between time points in some outcomes.

3. Results

3.1. Sample Characteristics

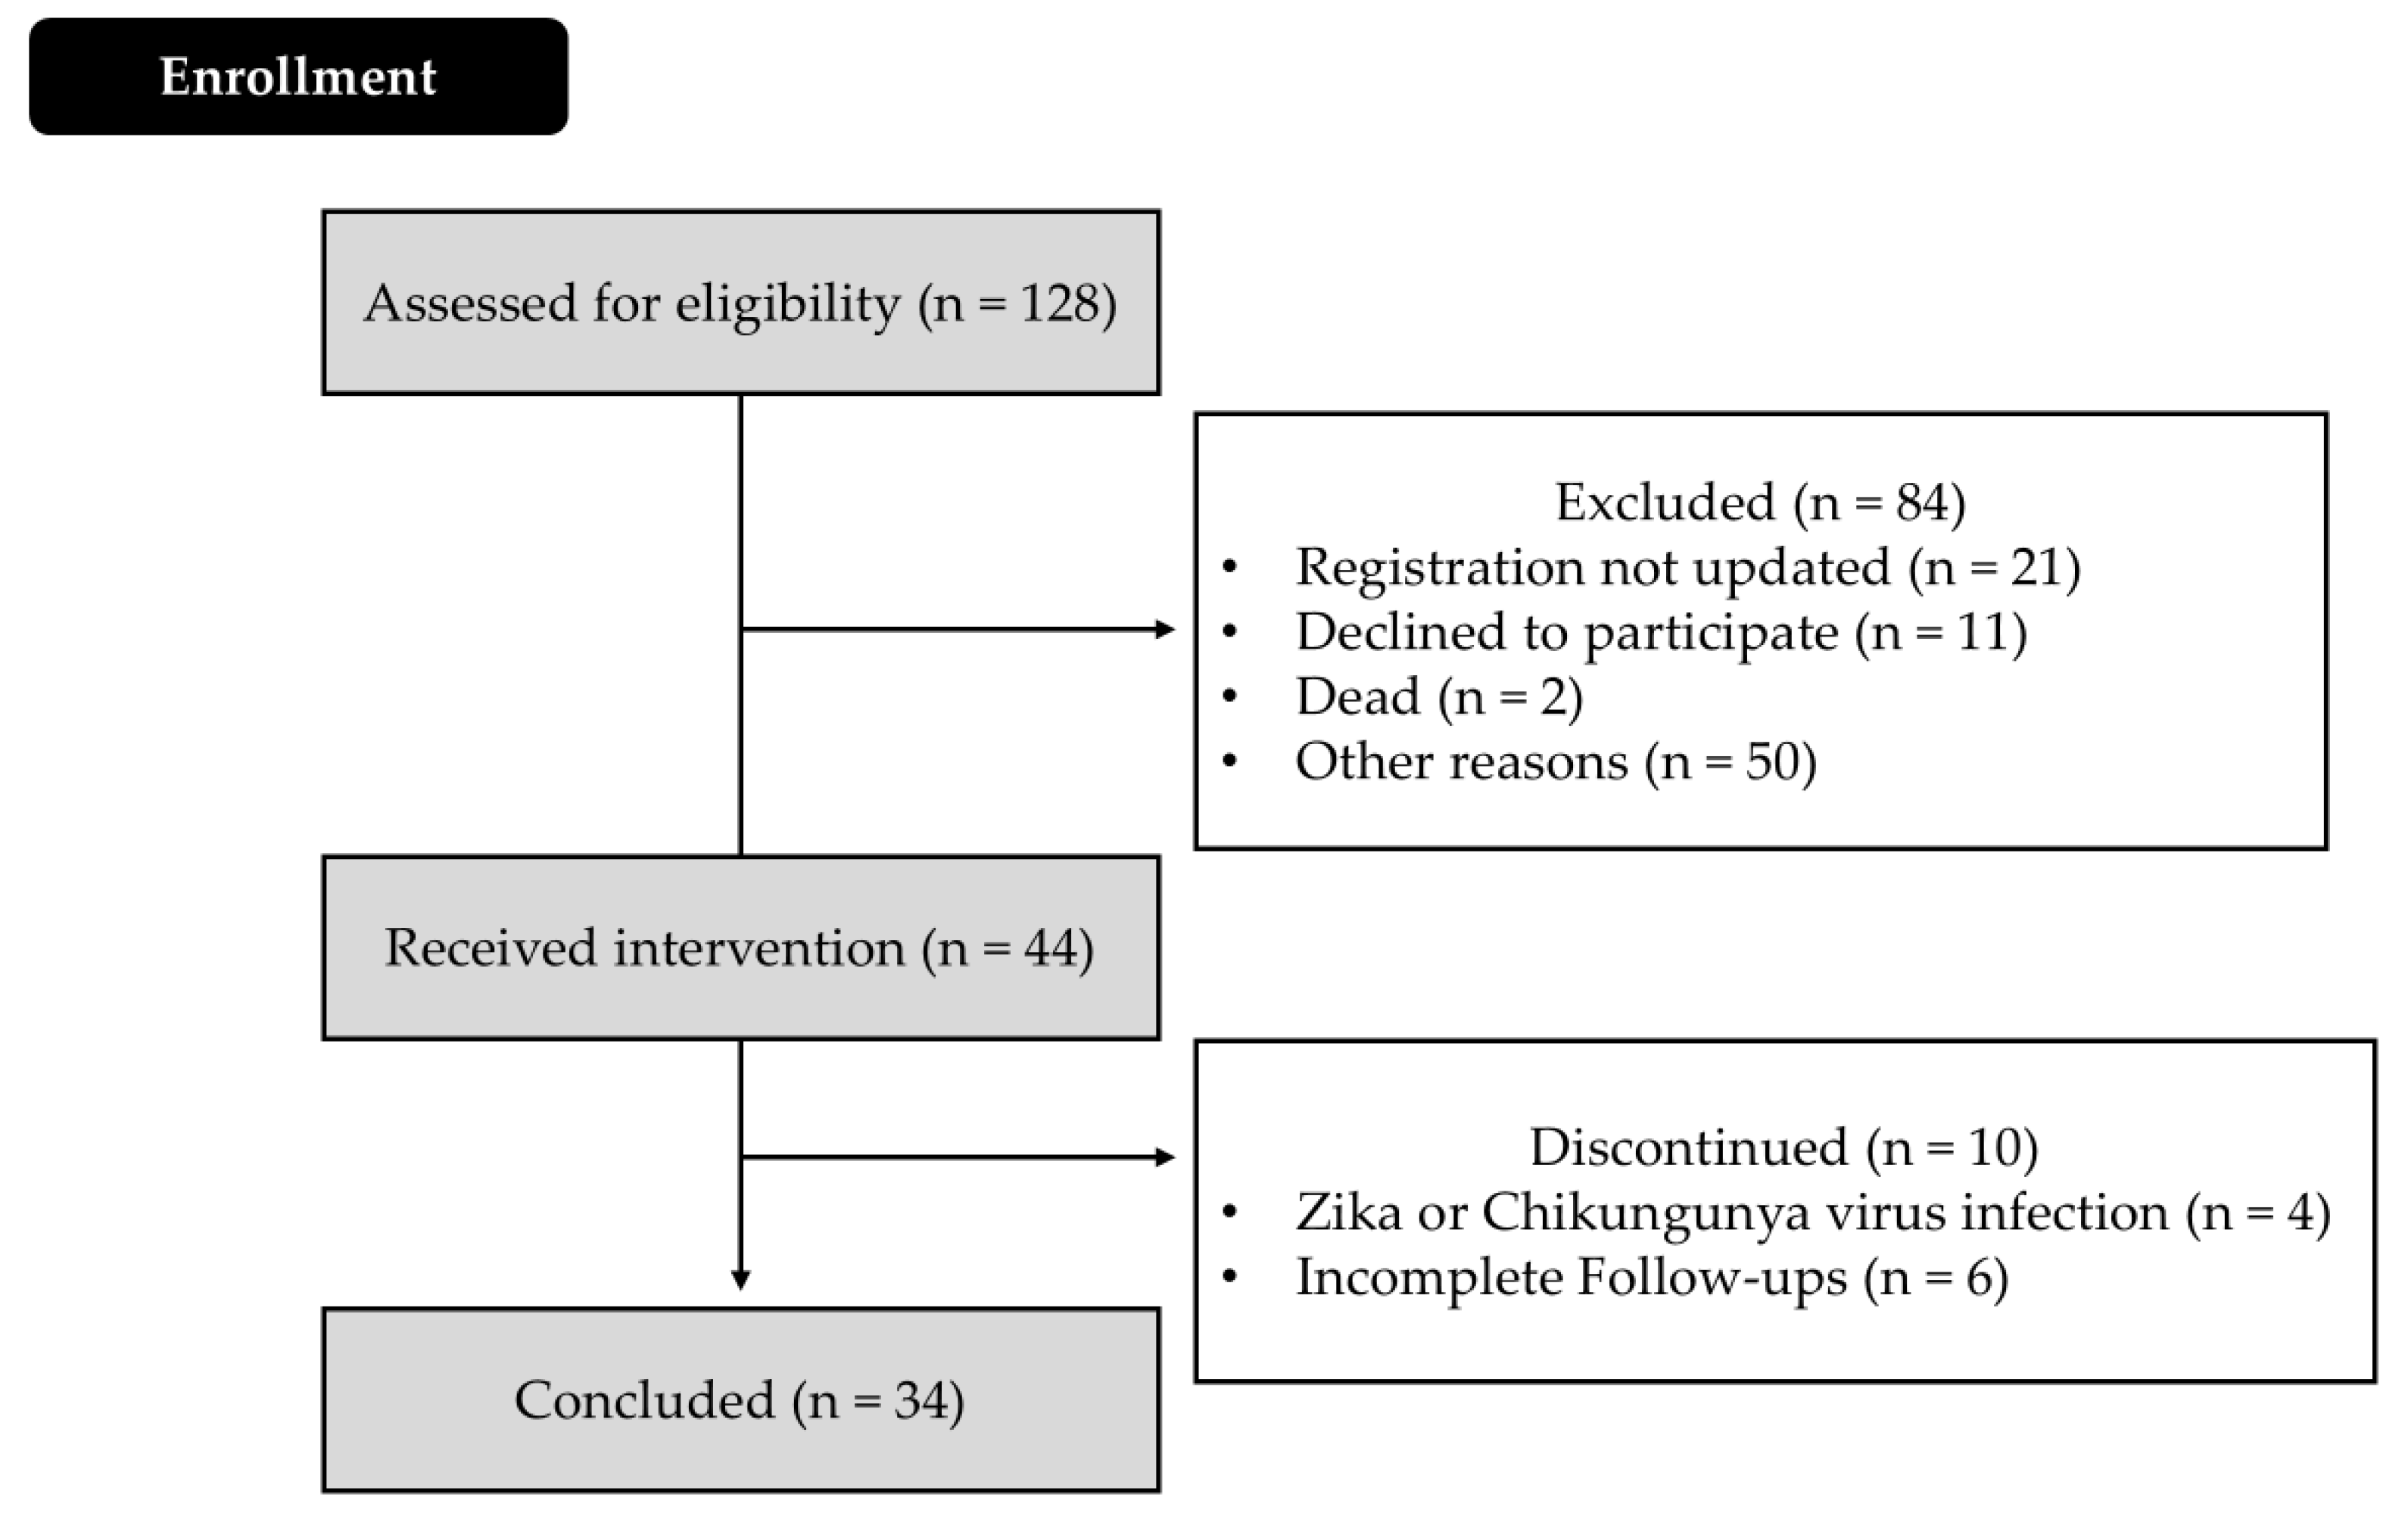
In total, 128 women met the inclusion criteria. The volunteers underwent prescreening via phone contact. Fifty women were excluded due to the following reasons: calcium and cholecalciferol supplementation (n = 27), use of insulin (n = 15), glucose intolerance (n = 4), glucocorticoid use (n = 3), and anticonvulsant use (n = 1). Additionally, 11 women declined to participate due to the difficulties in moving from home to the clinic, 21 could not be reached owing to the outdated contact registration on the records, and 2 died at the time of contact. Therefore, only 44 participants fulfilled the eligibility criteria (Figure 1), underwent baseline measurements, and received cholecalciferol at 1000 IU/day. Four participants who developed Zika or Chikungunya infection were excluded. Six participants did not undergo complete follow-up. Hence, only 34 participants completed the 24-month follow-up (received cholecalciferol 1000 IU/day for 12 months and 2000 IU/day for another 12 months). They were postmenopausal women clinically diagnosed with T2DM with a mean age of 63.84 ± 7.56 years. Most of them were using glibenclamide and/or metformin to treat diabetes. The treatment adherence rate was 100%.
No adverse effects attributable to cholecalciferol supplementation were observed throughout the study period, including hypercalcemia, hypercalciuria, or nephrolithiasis.

3.2. Effect of Vitamin D Supplementation on Glycemic and Lipid Homeostasis, Anthropometric Measurements, and Blood Pressure

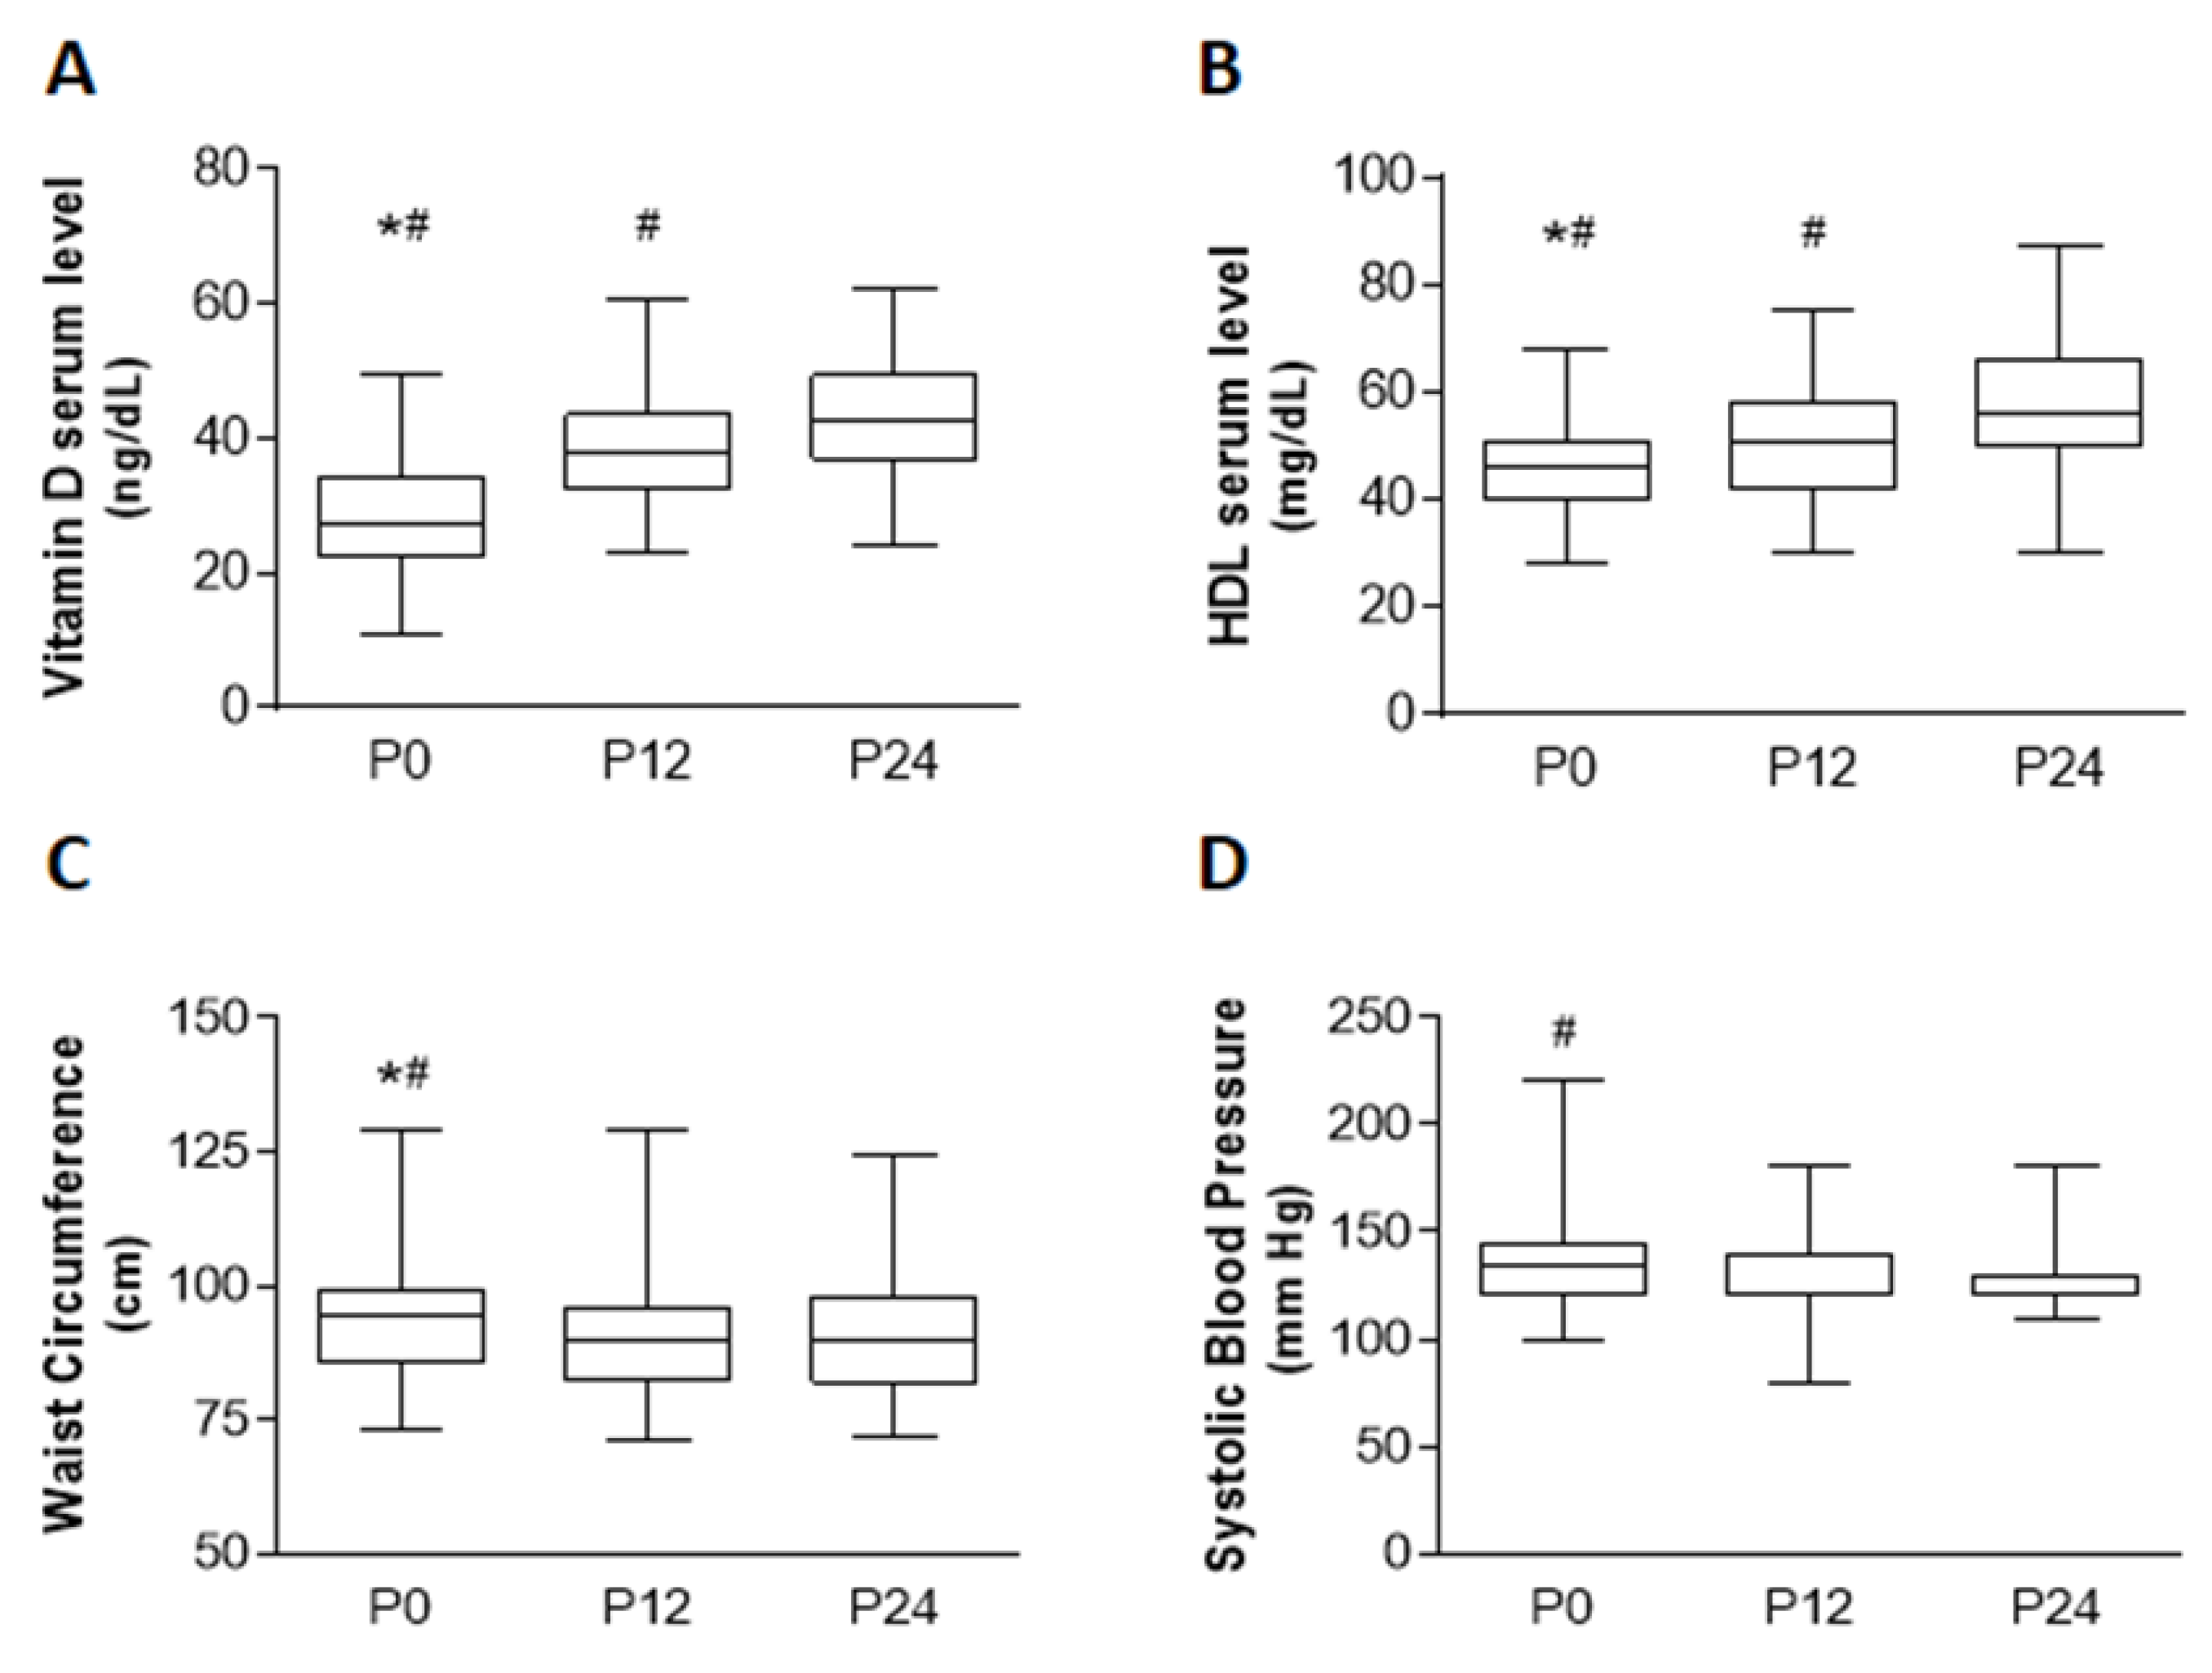
Descriptive measures of the variables are presented in Table 1. Differences were observed between 25(OH)D (p < 0.001) and HDL-C levels (P0 vs. P12, p = 0.008; P0 vs. P24, p < 0.001; P12 vs. P24 = p < 0.001), with an increase in their serum levels after cholecalciferol supplementation over time (Figure 2A,B). Fasting blood glucose values showed a median of 120 mg/dL at baseline to 110 mg/dL at follow-up, while HOMA-β were 35% higher over time after cholecalciferol supplementation. These differences were not significant.
WC and SBP were significantly lower after 24 months of supplementation (Table 1 and Figure 2C,D).
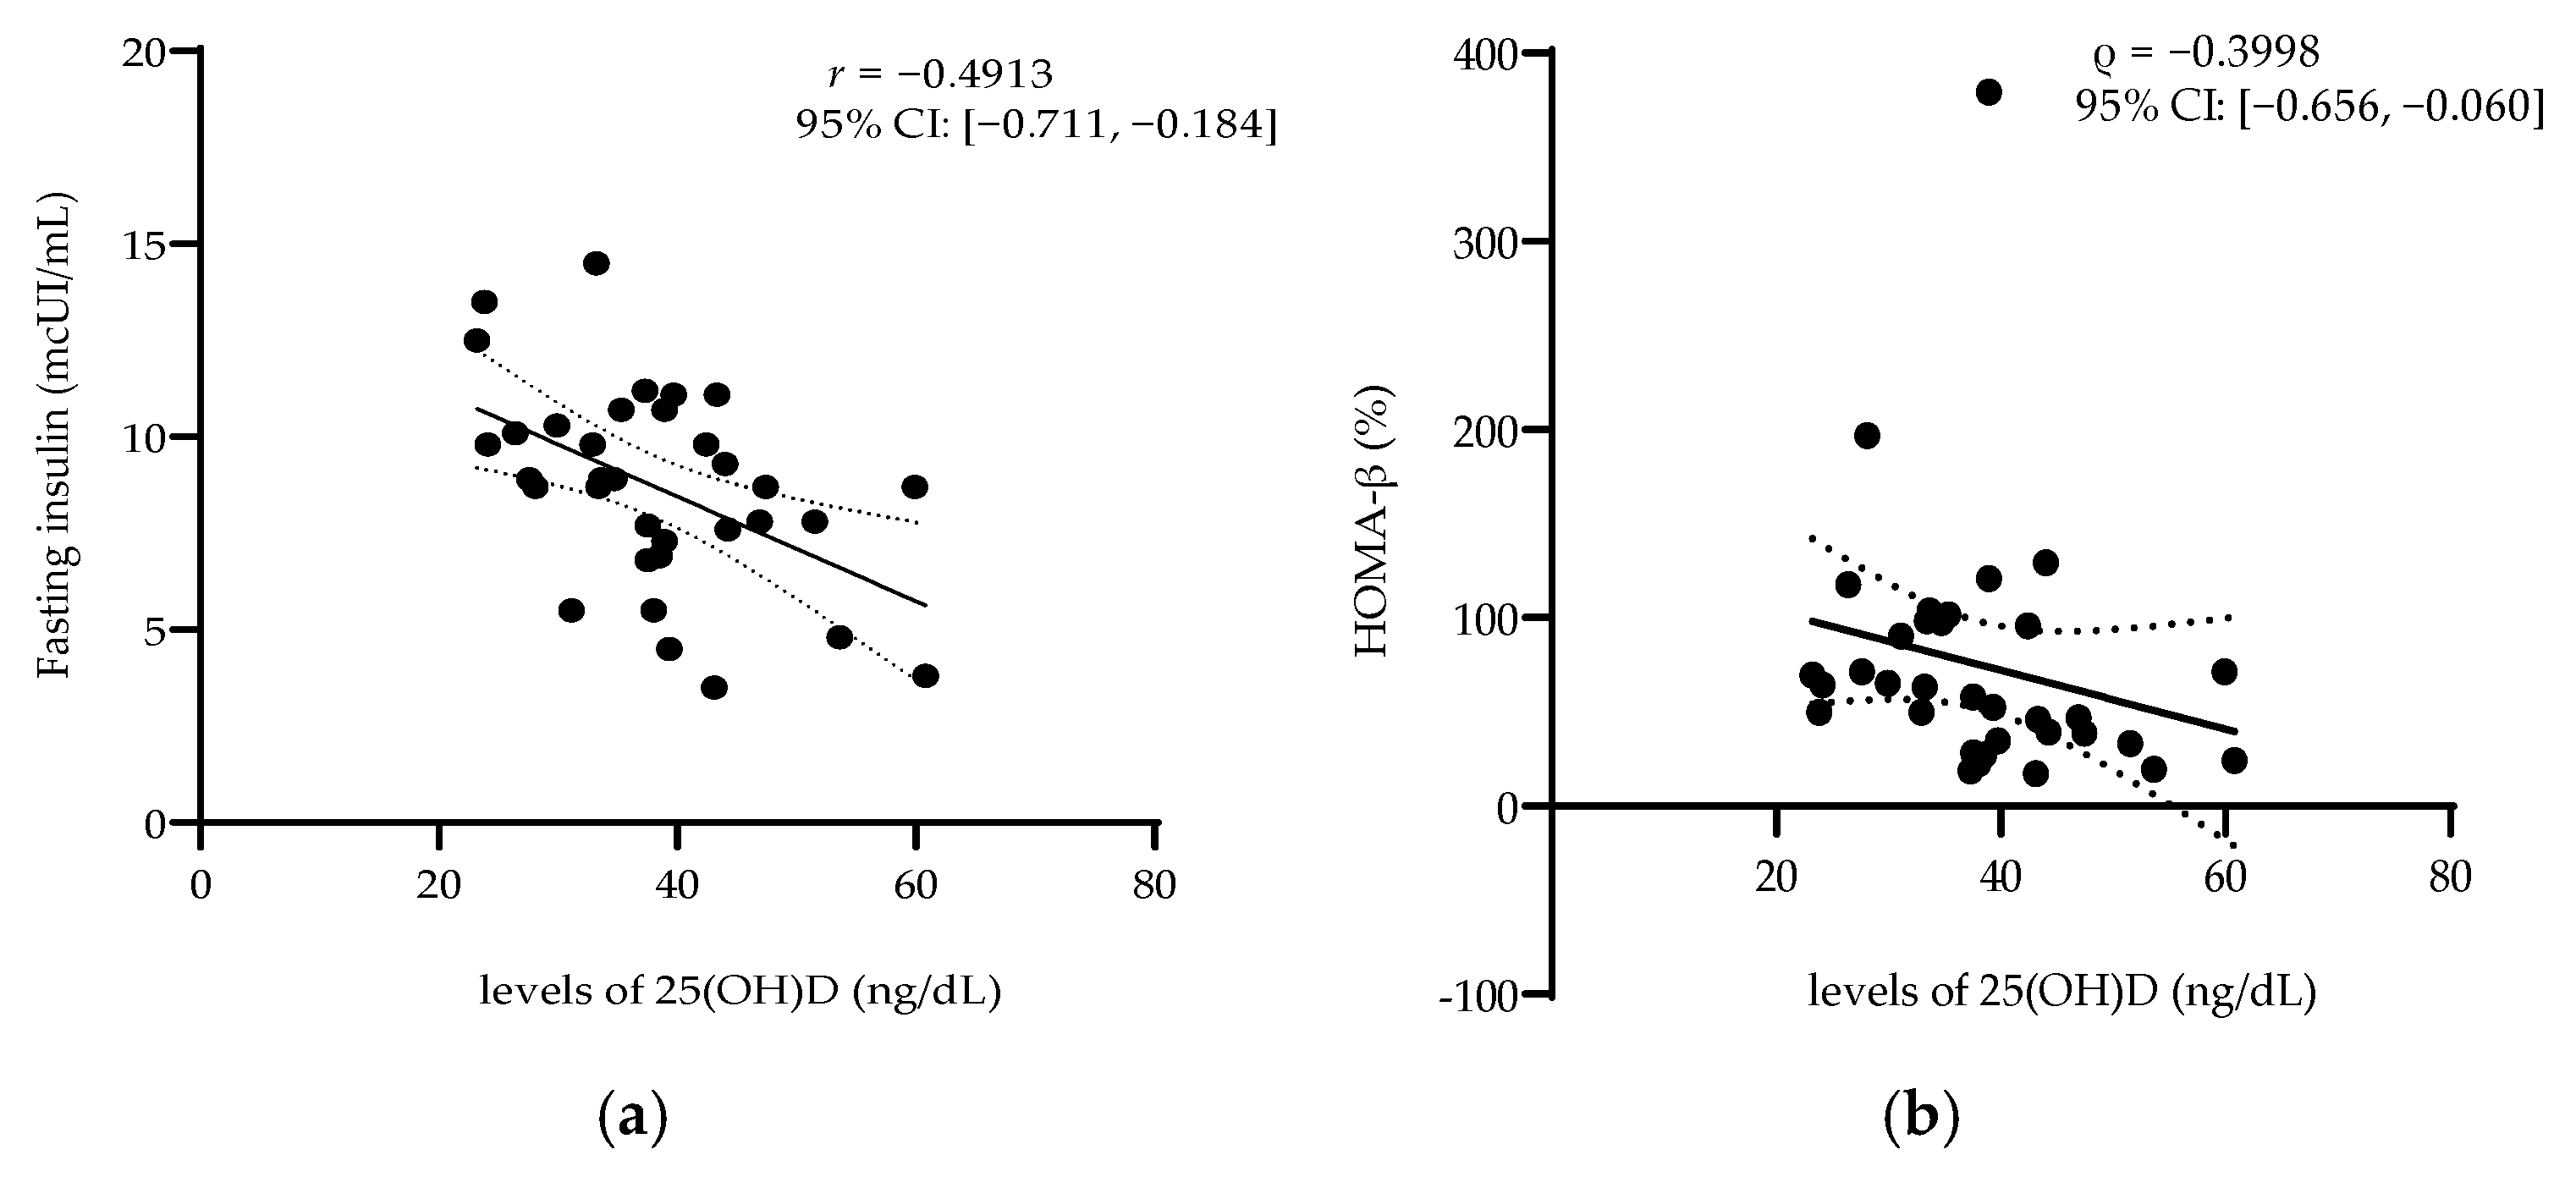
A significant inversely proportional correlation was observed between 25(OH)D levels and insulin and HOMA-β values at 12 months after supplementation with cholecalciferol at a dose of 1000 IU/day: lower serum insulin (Pearson’s coefficient r = −0.491, p = 0.003) (Figure 3a) and HOMA-β (Spearman’s coefficient ρ = −0.399, p = 0.0192) values indicated higher levels of 25(OH)D (Figure 3b).

4. Discussion

This clinical study evaluated the influence of cholecalciferol supplementation for two years on glucose homeostasis, lipid metabolism, and BP in postmenopausal women with T2DM who received cholecalciferol supplementation as a prophylaxis to reduce the risk of falls and prevent or treat osteoporosis. Serum 25(OH)D and HDL-C levels progressively increased after 1 and 2 years of cholecalciferol supplementation, while WC and SBP decreased after 1 year. Moreover, fasting serum insulin and HOMA-β values were inversely correlated with the levels of 25(OH)D at 12 months after cholecalciferol supplementation.
25(OH)D may aid with glucose metabolism by improving low-grade inflammation, observed in patients with insulin resistance due to T2DM, or by stimulating insulin release from the β-pancreatic cells [14,19]. Peripheral 25(OH)D metabolites may increase insulin sensitivity by upregulating VDR expression, through the transcription of essential factors of glycemic homeostasis, or by regulating calcium, which is essential for insulin-mediated intracellular processes. However, small clinical trials and post hoc analyses of large trials investigating the effects of cholecalciferol supplementation with or without calcium on glycemic homeostasis have reported inconsistent results [19,28].
Although weak, results from randomized clinical trials suggest a serum 25(OH)D concentration of >30 ng/mL may be required for its non-skeletal effects [29]. In this study, postmenopausal women with T2DM receiving 1000 IU/day for 12 months, followed by 2000 IU/day for another 12 months, had increased levels of 25(OH)D, the majority of whom showed a 25(OH)D serum concentration of >30 ng/mL. However, no statistical differences were observed in the set of variables used to evaluate glycemic homeostasis (fasting glucose, HbA1c, fasting insulin, HOMA-IR, and HOMA-β) following the elevation of 25(OH)D concentration. Although fasting blood glucose values showed a decrease from 120 mg/dL to 110 mg/dL and HOMA-β values were approximately 35% higher after cholecalciferol supplementation, these changes were not statistically significant. Importantly, due to the absence of a control group and the nature of the study design, it is not possible to attribute these changes strictly to the supplementation.
Nilas and Christiansen [30] evaluated the effects of 2000 IU/d of 25(OH)D treatment for 2 years in 25 postmenopausal women for the prevention or treatment of bone mass loss on body mass and glucose levels, and reported the variables assessed remained unchanged compared with those in the placebo group (n = 150). In contrast, a randomized controlled study of postmenopausal women with T2DM receiving weekly vitamin D3 supplementation (at doses equivalent to 942 IU/day) showed improved isometric handgrip strength. However, no effects were observed for mean fasting glucose and HbA1c serum levels [31].
A meta-analysis of 39 clinical trials demonstrated that vitamin D supplementation, at doses ranging from 400 to 11200 IU/day and over periods from 8 weeks to 30 months, may significantly reduce fasting glucose, HbA1c, HOMA-IR, and insulin levels in patients with T2DM, with greater effects observed in short-term interventions, at higher doses, and in individuals with vitamin D deficiency [32] (Chen et al., 2024). A systematic review showed 25(OH)D administration can improve glycemic control, by lowering the HbA1c, fasting plasma glucose, and HOMA-IR values in patients with T2DM. Notably, only randomized control trials that reported the effects of cholecalciferol supplementation on glycemic measures in participants age ≥18 years were reviewed. In addition, a minimum dose of 4.000 IU/day is recommended to improve glycemic measures [33]. The differences between these studies and the results shown in the present study are likely due to the variations in participant characteristics, such as age, stages of T2DM, menopausal status, and doses of 25(OH)D. Thus, the dose and duration of cholecalciferol supplementation in the present study might have been insufficient to show significant changes in insulin sensitivity and HbA1c levels. Importantly, a relatively lower supplementation dose was used in the present study compared with doses reported to be effective for these glycemic outcomes. Although the levels of 25(OH)D significantly increased during the treatment period, it could still be suboptimal for achieving beneficial effects on glucose homeostasis. Whether a higher daily dose of 25(OH)D or a longer period of supplementation has beneficial effects on glycemic control in postmenopausal women with T2DM still needs to be elucidated.
Swart et al. [34] evaluated the effects of cholecalciferol supplementation on glucometabolic and cardiovascular markers and revealed that this intervention had no effects on HbA1c and BP levels. The results of a recent meta-analysis of cohort studies and randomized controlled trials indicated cholecalciferol supplementation did not significantly reduce the SBP or DBP in the general population [35]. Considering postmenopausal women with T2DM, weekly supplementation of vitamin D3 in doses equivalent to 942 IU/day had no significant changes in BP, although SBP increased significantly in the control group (from 136.6 ± 18.6 to 141.4 ± 17.6 mmHg, p = 0.04) [30]. In contrast, the present study showed lower SBP values after 24 months of 25(OH)D intervention in postmenopausal women with T2DM, while DBP remained unchanged.
Previous studies demonstrated the association between low concentrations of 25(OH)D and elevated risk of CVD-related death [10]. Supplementation with 25(OH)D improved the endothelial function in diabetic and non-diabetic populations [36,37]. However, these studies have little available data on the long-term vascular impact of this intervention, the required doses, and whether higher doses would improve the surrogate markers of CVD [38], such as CRP levels and intima–media thickness. Previous randomized clinical trials reporting cardiovascular outcomes had inconclusive or negative evidence of the causal relationship between the effects of cholecalciferol supplementation and cardiovascular incidence and risk factors [39,40,41]. In the present study, in postmenopausal women with diabetes, the use of CRP as a risk factor for CVD did not show significant differences after cholecalciferol supplementation.
The present study observed that supplementation with 1000 and 2000 IU/day of 25(OH)D, administered over 1 year, was accompanied by changes in HDL-c concentration and by a progressive reduction in WC. The association between low 25(OH)D levels and HDL-C concentrations was reported in several studies. A longitudinal study demonstrated a strong and positive association between serum levels of 25(OH)D and HDL-c, although the cause of this association remains unknown [42]. WC is an essential component for detecting insulin resistance [43]. Insulin resistance is a critical factor in the development of T2DM, CVD, and metabolic syndrome [44]. An elevated proportion of abdominal adiposity is a major risk factor for coronary heart disease and T2DM [45]. WC can be the best anthropometric measure of abdominal adiposity [46]. Therefore, the effect of progressively reducing WC by cholecalciferol supplementation in postmenopausal women with T2DM may play a role in reducing insulin resistance and coronary heart disease risk.
The limitations of this study included the nature and size of the sample, thus limiting its generalizability. In addition, the study did not include a placebo or control group, and the administered doses were not provided in a crossover design. In addition, it was not possible to ensure that the use of antidiabetic medications remained unchanged throughout the study, which may have significantly influenced the observed results. The strengths of the present study were its prospective nature; the inclusion of postmenopausal women with T2DM; the long duration of 25(OH)D intervention and evaluation (two years); the exclusion of patients receiving pharmacological treatment that could affect glycemic and lipid metabolism, 25(OH)D metabolism, or its absorption; and the exclusion of external confounding elements that could alter the serum levels of the targeted biomolecules. The study also benefited from the mean 25(OH)D concentration achieved in the 25(OH)D group (approximately 42 ng/mL), objective assessment of endpoints, high retention rates, and medication compliance.
The findings of the present study contribute to the identification of the recommended daily dose of 25(OH)D in postmenopausal women with T2DM. The study will also serve as a guide in the conduct of larger and longer trials to assess whether cholecalciferol supplementation with higher daily safe doses than those used in the present study (4000 IU/day) is an effective intervention to improve glycemic control in postmenopausal women with T2DM.

5. Conclusions

The administration of 25(OH)D at 1000 IU/day for 12 months, followed by 2000 IU/day for another 12 months, was accompanied by changes in HDL-c concentration, WC, and SBP, but not with statistically significant changes in fasting glycemia or increases in HOMA-β in postmenopausal women with T2DM. Therefore, the long-term 25(OH)D dosing regimen adopted in a postmenopausal T2DM population may have a modest effect on glucose homeostasis, lipid profiles, and blood pressure. However, studies including a placebo group or using a crossover design are needed to provide more robust conclusions.

Author Contributions

Conceptualization: M.R.C.M., C.M.B., H.M., and L.P.F.M.; methodology: M.R.C.M., C.M.B., C.C.N., H.M., and L.P.F.M.; formal analysis: M.R.C.M., C.M.B., C.C.N., R.B., L.P.F.M., L.B.d.P.B., and P.B.C.; data curation: P.B.C. and L.P.F.M.; writing—original draft preparation: M.R.C.M., C.M.B. and L.P.F.M.; writing—review and editing: R.B., K.R.S., M.R.C.M., C.M.B., L.P.F.M., and P.B.C.; supervision, L.P.F.M. and P.B.C.; project administration: L.P.F.M.; funding acquisition: L.P.F.M. All authors have read and agreed to the published version of the manuscript.

Funding

This research was funded by Coordenação de Aperfeiçoamento de Pessoal de Nível 270 Superior—Brasil (CAPES), Finance Code 001.

Institutional Review Board Statement

The study was conducted in accordance with the Declaration of Helsinki and approved by the Ethics Committee of the Instituto Fernandes Figueira—IFF/FIOCRUZ-RJ/MS (CAAE36698514.1.0000.5269; approval date 28 May 2015). Signed informed consent from all participants was obtained.

Informed Consent Statement

Informed consent was obtained from all subjects involved in this study.

Data Availability Statement

The data used in this study are available upon reasonable request from the corresponding author.

Acknowledgments

We would like to thank the Fábio Russomano, Janio Cordeiro, The Employee Association (ASFOC), and the research volunteers that believed in our work.

Conflicts of Interest

The authors declare no conflicts of interest.

Abbreviations

25(OH)DVitamin D
T2DMType 2 diabetes mellitus
VDRVitamin D receptor
CVDCardiovascular disease
FGFasting glucose
HbA1cGlycosylated hemoglobin
IInsulin
HOMA-IRHomeostasis model of insulin resistance
TCTotal cholesterol
HDL-c:High-density lipoprotein cholesterol
TGTriglycerides
CRPC-reactive protein
SBPSystolic blood pressure
DBPDiastolic blood pressure
WCWaist circumference
HCHip circumference
WHRWaist-to-hip ratio
BMIBody mass index

References

  1. Cui, A.; Zhang, T.; Xiao, P.; Fan, Z.; Wang, H.; Zhuang, Y. Global and regional prevalence of vitamin D deficiency in population-based studies from 2000 to 2022: A pooled analysis of 7.9 million participants. Front. Nutr. 2023, 10, 1070808. [Google Scholar] [CrossRef] [PubMed]
  2. Meshkin, A.; Badiee, F.; Salari, N.; Hassanabadi, M.; Khaleghi, A.A.; Mohammadi, M. The global prevalence of vitamin D deficiency in the elderly: A meta-analysis. Indian J. Orthop. 2024, 58, 223–230. [Google Scholar] [CrossRef] [PubMed]
  3. Genitsaridi, I.; Salpea, P.; Salim, A.; Sajjadi, S.F.; Tomic, D.; James, S.; Thirunavukkarasu, S.; Issaka, A.; Chen, L.; Basit, A.; et al. 11th edition of the IDF Diabetes Atlas: Global, regional, and national diabetes prevalence estimates for 2024 and projections for 2050. Lancet Diabetes Endocrinol. 2026, 14, 149–156. [Google Scholar] [CrossRef] [PubMed]
  4. Nelson, H.D. Menopause. Lancet 2008, 371, 760–770. [Google Scholar] [CrossRef] [PubMed]
  5. Kanwar, G.; Sharma, N.; Shekhawat, M.; Sharma, P.; Hada, R.; Chandel, C.S. Comparison of vitamin D levels in pre and post menopausal type 2 diabetic females. IOSR J. Dent. Med. Sci. 2015, 14, 70–73. [Google Scholar]
  6. Fondjo, L.A.; Sakyi, S.A.; Owiredu, W.K.B.A.; Laing, E.F.; Owiredu, E.; Awusi, E.K.; Ephraim, R.K.D.; Kantanka, O.S. Evaluating vitamin D status in pre- and postmenopausal type 2 diabetics and its association with glucose homeostasis. BioMed Res. Int. 2018, 2018, 9369282. [Google Scholar] [CrossRef] [PubMed]
  7. Holick, M.F.; Binkley, N.C.; Bischoff-Ferrari, H.A.; Gordon, C.M.; Hanley, D.A.; Heaney, R.P.; Murad, M.H.; Weaver, C.M.; Endocrine Society. Evaluation, treatment, and prevention of vitamin D deficiency: An Endocrine Society clinical practice guideline. J. Clin. Endocrinol. Metab. 2011, 96, 1911–1930. [Google Scholar] [CrossRef] [PubMed]
  8. Demay, M.B.; Pittas, A.G.; Bikle, D.D.; Diab, D.L.; Kiely, M.E.; Lazaretti-Castro, M.; Lips, P.; Mitchell, D.M.; Murad, M.H.; Powers, S.; et al. Vitamin D for the prevention of disease: An Endocrine Society clinical practice guideline. J. Clin. Endocrinol. Metab. 2024, 109, 1907–1947. [Google Scholar] [CrossRef] [PubMed]
  9. Griz, L.H.M.; Bandeira, F.; Gabbay, M.A.L.; Dib, S.A.; Carvalho, E.F. Vitamin D and diabetes mellitus: An update 2013. Arq. Bras. Endocrinol. Metab. 2014, 58, 1–8. [Google Scholar] [CrossRef]
  10. Gil, Á.; Plaza-Diaz, J.; Mesa, M.D. Vitamin D: Classic and novel actions. Ann. Nutr. Metab. 2018, 72, 87–95. [Google Scholar] [CrossRef] [PubMed]
  11. Wan, Z.; Geng, T.; Li, R.; Chen, X.; Lu, Q.; Lin, X.; Chen, L.; Guo, Y.; Liu, L.; Shan, Z.; et al. Vitamin D status, genetic factors, and risks of cardiovascular disease among individuals with type 2 diabetes: A prospective study. Am. J. Clin. Nutr. 2022, 116, 1389–1399. [Google Scholar] [CrossRef] [PubMed]
  12. Johnson, J.A.; Grande, J.P.; Roche, P.C.; Kumar, R. Immunohistochemical localization of the 1,25(OH)2D3 receptor and calbindin D28k in human and rat pancreas. Am. J. Physiol. Endocrinol. Metab. 1994, 267, E356–E360. [Google Scholar] [CrossRef]
  13. Chacko, S.A.; Song, Y.; Manson, J.E.; Van Horn, L.; Eaton, C.; Martin, L.W.; McTiernan, A.; Curb, J.D.; Wylie-Rosett, J.; Phillips, L.S.; et al. Serum 25-hydroxyvitamin D concentrations in relation to cardiometabolic risk factors and metabolic syndrome in postmenopausal women. Am. J. Clin. Nutr. 2011, 94, 209–217. [Google Scholar] [CrossRef] [PubMed]
  14. Park, C.Y.; Shin, S.; Han, S.N. Multifaceted roles of vitamin D for diabetes: From immunomodulatory functions to metabolic regulations. Nutrients 2024, 16, 3185. [Google Scholar] [CrossRef] [PubMed]
  15. Zoppini, G.; Galletti, A.; Targher, G.; Brangani, C.; Pichiri, I.; Trombetta, M.; Negri, C.; De Santi, F.; Stoico, V.; Cacciatori, V.; et al. Lower levels of 25-hydroxyvitamin D3 are associated with a higher prevalence of microvascular complications in patients with type 2 diabetes. Diabet. Med. 2015, 32, 1259–1266. [Google Scholar]
  16. Ma, Y.; Liu, B.; Yin, F.; Liu, J.; Wang, X.; Fan, D.; Sun, L.; Lu, L. Vitamin D level as a predictor of dysmobility syndrome with type 2 diabetes. Sci. Rep. 2024, 14, 19792. [Google Scholar] [CrossRef] [PubMed]
  17. Alharazy, S.; Alissa, E.; Lanham-New, S.; Naseer, M.I.; Chaudhary, A.G.; Robertson, M.D. Association between vitamin D and glycaemic parameters in a multi-ethnic cohort of postmenopausal women with type 2 diabetes in Saudi Arabia. BMC Endocr. Disord. 2021, 21, 162. [Google Scholar] [CrossRef] [PubMed]
  18. George, P.S.; Pearson, E.R.; Witham, M.D. Effect of vitamin D supplementation on glycaemic control and insulin resistance: A systematic review and meta-analysis. Diabet. Med. 2012, 29, e142–e150. [Google Scholar] [PubMed]
  19. Probosari, E.; Subagio, H.W.; Rachmawati, B.; Muis, S.F.; Tjandra, K.C.; Adiningsih, D.; Winarni, T.I. The impact of vitamin D supplementation on fasting plasma glucose, insulin sensitivity, and inflammation in type 2 diabetes mellitus: A systematic review and meta-analysis. Nutrients 2025, 17, 2489. [Google Scholar] [CrossRef] [PubMed]
  20. IDF Diabetes Atlas. Available online: https://diabetesatlas.org/ (accessed on 17 December 2018).
  21. World Health Organization Scientific Group. Prevention and Management of Osteoporosis: Report of a WHO Scientific Group; World Health Organization: Geneva, Switzerland, 2003. Available online: https://pubmed.ncbi.nlm.nih.gov/15293701/ (accessed on 1 February 2025).
  22. Engelman, C.D. Vitamin D recommendations: The saga continues. J. Clin. Endocrinol. Metab. 2011, 96, 3065–3066. [Google Scholar] [CrossRef] [PubMed]
  23. Rosen, C.J.; Abrams, S.A.; Aloia, J.F.; Brannon, P.M.; Clinton, S.K.; Durazo-Arvizu, R.A.; Gallagher, J.C.; Gallo, R.L.; Jones, G.; Kovacs, C.S.; et al. IOM Committee Members Respond to Endocrine Society Vitamin D Guideline. J. Clin. Endocrinol. Metab. 2012, 97, 1146–1152. [Google Scholar] [CrossRef] [PubMed]
  24. Holick, M.F.; Binkley, N.C.; Bischoff-Ferrari, H.A.; Gordon, C.M.; Hanley, D.A.; Heaney, R.P.; Murad, M.H.; Weaver, C.M. Guidelines for preventing and treating vitamin D deficiency and insufficiency revisited. J. Clin. Endocrinol. Metab. 2012, 97, 1153–1158. [Google Scholar] [CrossRef] [PubMed]
  25. Tang, H.; Li, D.; Li, Y.; Zhang, X.; Song, Y.; Li, X. Effects of vitamin D supplementation on glucose and insulin homeostasis and incident diabetes among nondiabetic adults: A meta-analysis of randomized controlled trials. Int. J. Endocrinol. 2018, 2018, 7908764. [Google Scholar] [CrossRef] [PubMed]
  26. Wimalawansa, S.J. Associations of vitamin D with insulin resistance, obesity, type 2 diabetes, and metabolic syndrome. J. Steroid Biochem. Mol. Biol. 2018, 175, 177–189. [Google Scholar] [CrossRef] [PubMed]
  27. Institute of Medicine (US) Committee to Review Dietary Reference Intakes for Vitamin D and Calcium. Institute of Medicine Dietary Reference Intakes for Calcium and Vitamin D. Available online: https://www.ncbi.nlm.nih.gov/books/NBK56070/ (accessed on 1 February 2025).
  28. Musazadeh, V.; Kavyani, Z.; Mirhosseini, N.; Dehghan, P.; Vajdi, M. Effect of vitamin D supplementation on type 2 diabetes biomarkers: An umbrella of interventional meta-analyses. Diabetol. Metab. Syndr. 2023, 15, 76. [Google Scholar] [CrossRef] [PubMed]
  29. Anagnostis, P.; Livadas, S.; Goulis, D.G.; Bretz, S.; Ceausu, I.; Durmusoglu, F.; Erkkola, R.; Fistonic, I.; Gambacciani, M.; Geukes, M.; et al. EMAS position statement: Vitamin D and menopausal health. Maturitas 2023, 169, 2–9. [Google Scholar] [CrossRef] [PubMed]
  30. Nilas, C.; Christiansen, C. Treatment with vitamin D or its analogues does not change body weight or blood glucose level in postmenopausal women. Int. J. Obes. 1984, 8, 407–411. [Google Scholar] [PubMed]
  31. Cavalcante, R.; Maia, J.; Mesquita, P.; Henrique, R.; Griz, L.; Bandeira, M.P.; Bandeira, F. The effects of intermittent vitamin D3 supplementation on muscle strength and metabolic parameters in postmenopausal women with type 2 diabetes: A randomized controlled study. Ther. Adv. Endocrinol. 2015, 6, 149–154. [Google Scholar] [CrossRef]
  32. Chen, W.; Liu, L.; Hu, F. Efficacy of vitamin D supplementation on glycaemic control in type 2 diabetes: An updated systematic review and meta-analysis of randomized controlled trials. Diabetes Obes. Metab. 2024, 26, 5713–5726. [Google Scholar] [CrossRef] [PubMed]
  33. Mirhosseini, N.; Vatanparast, H.; Mazidi, M.; Kimball, S.M. The effect of improved serum 25-hydroxyvitamin D status on glycemic control in diabetic patients: A meta-analysis. J. Clin. Endocrinol. Metab. 2017, 102, 3097–3110. [Google Scholar] [CrossRef] [PubMed]
  34. Swart, K.M.; Lips, P.; Brouwer, I.A.; Jorde, R.; Heymans, M.W.; Grimnes, G.; Grübler, M.R.; Gaksch, M.; Tomaschitz, A.; Pilz, S.; et al. Effects of vitamin D supplementation on markers for cardiovascular disease and type 2 diabetes: An individual participant data meta-analysis of randomized controlled trials. Am. J. Clin. Nutr. 2018, 107, 1043–1053. [Google Scholar] [CrossRef] [PubMed]
  35. Zhang, D.; Cheng, C.; Wang, Y.; Sun, H.; Yu, S.; Xue, Y.; Liu, Y.; Li, W.; Li, X. Effect of vitamin D on blood pressure and hypertension in the general population: An update meta-analysis of cohort studies and randomized controlled trials. Prev. Chronic Dis. 2020, 9, E03. [Google Scholar] [CrossRef]
  36. Sugden, J.A.; Davies, J.I.; Witham, M.D.; Morris, A.D.; Struthers, A.D. Vitamin D improves endothelial function in patients with type 2 diabetes mellitus and low vitamin D levels. Diabet. Med. 2008, 25, 320–325. [Google Scholar] [CrossRef] [PubMed]
  37. Harris, R.A.; Pedersen-White, J.; Guo, D.; Stallmann-Jorgensen, I.S.; Keeton, D.; Huang, Y.; Shah, Y.; Zhu, H.; Dong, Y. Vitamin D3 supplementation for 16 weeks improves flow-mediated dilation in overweight African-American adults. Am. J. Hypertens. 2011, 24, 557–562. [Google Scholar] [PubMed]
  38. Breslavsky, A.; Frand, J.; Matas, Z.; Boaz, M.; Barnea, Z.; Shargorodsky, M. Effect of high doses of vitamin D on arterial properties, adiponectin, leptin and glucose homeostasis in type 2 diabetic patients. Clin. Nutr. 2013, 32, 970–975. [Google Scholar] [CrossRef] [PubMed]
  39. Pittas, A.G.; Chung, M.; Trikalinos, T.; Mitri, J.; Brendel, M.; Patel, K.; Lichtenstein, A.H.; Lau, J.; Balk, E.M. Systematic review: Vitamin D and cardiometabolic outcomes. Ann. Intern. Med. 2010, 152, 307–314. [Google Scholar] [CrossRef] [PubMed]
  40. Ford, J.A.; MacLennan, G.S.; Avenell, A.; Bolland, M.; Grey, A.; Witham, M. Cardiovascular disease and vitamin D supplementation: Trial analysis, systematic review, and meta-analysis. Am. J. Clin. Nutr. 2014, 100, 746–755. [Google Scholar] [CrossRef] [PubMed]
  41. Beveridge, L.A.; Struthers, A.D.; Khan, F.; Jorde, R.; Scragg, R.; Macdonald, H.M.; Alvarez, J.A.; Boxer, R.S.; Dalbeni, A.; Gepner, A.D.; et al. Effect of vitamin D supplementation on blood pressure: A systematic review and meta-analysis incorporating individual patient data. JAMA Intern. Med. 2015, 175, 745–755. [Google Scholar] [PubMed]
  42. Jorde, R.; Grimnes, G. Exploring the association between serum 25-hydroxyvitamin D and serum lipids—More than confounding? Eur. J. Clin. Nutr. 2018, 72, 526–533. [Google Scholar] [CrossRef] [PubMed]
  43. Ramírez-Manent, J.I.; Jover, A.M.; Martinez, C.S.; Tomás-Gil, P.; Martí-Lliteras, P.; López-González, Á.A. Waist circumference is an essential factor in predicting insulin resistance and early detection of metabolic syndrome in adults. Nutrients 2023, 15, 257. [Google Scholar] [CrossRef] [PubMed]
  44. Lebovitz, H.E. Insulin resistance: Definition and consequences. Exp. Clin. Endocrinol. Diabetes 2001, 109, S135–S148. [Google Scholar] [CrossRef] [PubMed]
  45. Kissebah, A.H.; Freedman, D.S.; Peiris, A.N. Health risks of obesity. Med. Clin. N. Am. 1989, 73, 111–138. [Google Scholar] [CrossRef] [PubMed]
  46. Mouchti, S.; Orliacq, J.; Reeves, G.; Chen, Z. Assessment of correlation between conventional anthropometric and imaging-derived measures of body fat composition: A systematic literature review and meta-analysis of observational studies. BMC Med. Imaging 2023, 23, 127. [Google Scholar] [CrossRef] [PubMed]
Figure 1. Diagram of the participant selection process.
Diabetology 07 00129 g001
Figure 2. Changes in serum 25(OH)D, HDL-c, waist circumference, and systolic blood pressure over time. Only the statistically significant variables presented in Table 1 are graphically represented. Results are expressed as the median, interquartile range (25% and 75%), and minimum and maximum values. (A) Vitamin D: P0 vs. P12, p < 0.001; P0 vs. P24, p < 0.001; P12 vs. P24, p = 0.001; (B) HDL: P0 vs. P12, p = 0.008; P0 vs. P24, p < 0.001; P12 vs. P24, p < 0.001. (C) Waist circumference: P0 vs. P12, p = 0.001; P0 vs. P24, p = 0.045. (D) Systolic blood pressure: P0 vs. P12, p = 0.052; P0 vs. P24, p = 0.011; P12 vs. P24, p = 0.196. * Statistically different compared with P12 (12 months after study initiation); # Statistically different compared with that at P24 (24 months after study initiation).
Diabetology 07 00129 g002
Figure 3. Correlations between serum 25(OH)D levels and markers of insulin metabolism. (a) Correlation between serum 25(OH)D levels and fasting insulin. (b) Correlation between serum 25(OH)D levels and HOMA-β.
Diabetology 07 00129 g003
Table 1. Variables at baseline and after 12 and 24 months of cholecalciferol supplementation.
P0
(Baseline)
P12
(1000 IU/Day)
P24
(2000 IU/Day)
VariablesDescriptive StatisticsDescriptive StatisticsDescriptive Statistics
25(OH)D (ng/dL)27.15 (22.30–34.00) * #37.75 (32.45–43.47) #42.7 (36.92–49.55)
Fasting glycemia (mg/dL)120.00 (102.00–144.50)121.5 (97.00–149.50)110.00 (95.25–137.00)
Fasting insulin (µU/mL)8.45 (6.85–11.55)8.80 (7.20–10.40)9.75 (7.50–11.80)
HOMA-IR2.64 (1.70–3.92)2.37 (2.01–3.00)2.66 (1.83–3.42)
HOMA-β (%)51.75 (39.97–71.80)55.15 (29.42–85.57)69.55 (44.60–104.55)
HbA1c (%)6.30 (5.90–6.97)6.30 (5.90–6.90)6.50 (5.9–7.10)
C-reactive protein (mg/dL)0.26 (0.15–0.73)0.26 (0.12–0.49)0.31 (0.16–0.66)
Total cholesterol (mg/dL)171.00 (152.75–213.25)170.00 (148.00–210.00)182.50 (165.50–218.00)
HDL cholesterol (mg/dL)46.00 (28.00–68.00) * #51.00 (30.00–75.00) #56.00 (30.00–87.00)
Triglycerides (mg/dL)140.00 (114.25–191.50)127.00 (102.00–165.00)127.50 (96.50–147.00)
Waist circumference (cm)94.20 (85.50–99.20) * #87.00 (82.25–93.95)86.70 (80.80–93.75)
Hip circumference (cm)100.50 (96.55–108.47)102.20 (95.85–110.00)100.35 (92.87–109.75)
Waist-to-hip ratio0.90 (0.86–1.01)0.87 (0.81–0.92)0.87 (0.84–0.96)
Body mass index (kg/m2)28.22 (25.93–30.87)28.57 (26.22–31.47)27.64 (25.31–31.44)
Systolic blood pressure (mmHg)130.00 (120.00–150.00) #120.00 (120.00–140.00)120.000 (110.00–120.00)
Diastolic blood pressure (mmHg)80.00 (70.00–92.50)80.00 (70.00–80.00)80.00 (70.00–80.00)
* Statistically different compared with that at P12 (12 months after study initiation); # Statistically different compared with that at P24 (24 months after study initiation).
Disclaimer/Publisher’s Note: The statements, opinions and data contained in all publications are solely those of the individual author(s) and contributor(s) and not of MDPI and/or the editor(s). MDPI and/or the editor(s) disclaim responsibility for any injury to people or property resulting from any ideas, methods, instructions or products referred to in the content.