Article

Diabetes-Specific Dementia Risk Score Relates to Cognitive and Metabolic Factors in Older Mexican Adults with Type 2 Diabetes


by
Diana L. Baldenebro-Félix
1,2,
Alma Marlene Guadrón-Llanos
3,
Carla E. Angulo-Rojo
2,
Marco A. Valdez-Flores
4,
Claudia D. Norzagaray-Valenzuela
5,
Alberto K. De la Herrán-Arita
2,
Alexis M. Rodríguez-Rosas
2,
Loranda Calderón-Zamora
5 and
Javier Magaña-Gómez
6,*
1
Programa de Posgrado en Biomedicina Molecular, Facultad de Medicina, Universidad Autónoma de Sinaloa, Culiacán 80019, Sinaloa, Mexico
2
Laboratorio de Neurociencias, Centro de Investigación Aplicada a la Salud Pública (CIASaP), Facultad de Medicina, Universidad Autónoma de Sinaloa, Culiacán 80019, Sinaloa, Mexico
3
Laboratorio de Diabetes y Comorbilidades, Centro de Investigación Aplicada a la Salud Pública (CIASaP), Facultad de Medicina, Universidad Autónoma de Sinaloa, Culiacán 80019, Sinaloa, Mexico
4
Laboratorio de Fisiología Molecular, Centro de Investigación Aplicada a la Salud Pública (CIASaP), Facultad de Medicina, Universidad Autónoma de Sinaloa, Culiacán 80019, Sinaloa, Mexico
5
Laboratorio de Inmunogenética, Facultad de Biología, Universidad Autónoma de Sinaloa, Culiacán 80013, Sinaloa, Mexico
6
Laboratorio de Nutrición Humana, Facultad de Ciencias de la Nutrición y Gastronomía, Universidad Autónoma de Sinaloa, Culiacán 80019, Sinaloa, Mexico
*
Author to whom correspondence should be addressed.
Diabetology 2026, 7(6), 118; https://doi.org/10.3390/diabetology7060118
Submission received: 21 April 2026 / Revised: 6 June 2026 / Accepted: 12 June 2026 / Published: 17 June 2026

Abstract

Background/Objectives: The Diabetes-Specific Dementia Risk Score (DSDRS) integrates clinical and metabolic markers to predict cognitive decline in Type 2 diabetes mellitus (T2DM), yet its association with key modifiable risk factors remains unvalidated in Latin American cohorts. This study aimed to assess the relationship between the DSDRS and clinical, biochemical, anthropometric, and neuropsychological variables in older adults with T2DM. Methods: A cross-sectional study of 291 Mexican adults aged ≥ 60 with T2DM was conducted, including assessments of cognitive function (MoCA), depression (BDI), sleep quality (AIS), and metabolic parameters. Results: Higher DSDRS correlated with lower cognitive scores, poorer sleep quality, reduced muscle mass, and smoking status. Multiple regression explained 32% of DSDRS variance, highlighting these factors as significant contributors. Conclusions: The DSDRS reflects multifactorial influences on dementia risk in older adults with T2DM and may aid early identification of individuals at increased cognitive vulnerability in this population.

1. Introduction

Type 2 diabetes mellitus (T2DM) is a major health burden in aging populations, characterized by a high prevalence and the progressive accumulation of chronic complications [1]. Beyond the classic micro- and macrovascular complications, T2DM has emerged as an important risk factor for cognitive impairment and dementia [2,3]. Epidemiological evidence consistently demonstrates a higher incidence of cognitive decline among individuals with T2DM than in populations without diabetes [3].
The pathophysiological mechanisms underlying this association are multifactorial. Chronic hyperglycemia, insulin resistance, dyslipidemia, and low-grade systemic inflammation promote cerebral microvascular dysfunction, oxidative stress, and neuroinflammation [2,4]. Furthermore, impaired insulin signaling in the brain disrupts key pathways such as phosphoinositide 3-kinase/protein kinase B (PI3K/Akt) and glycogen synthase kinase 3 beta (GSK3β), facilitating β-amyloid accumulation and tau hyperphosphorylation, which contribute to neurodegeneration [5].
Given this complex interplay of risk factors, early identification of individuals with T2DM who are at increased risk of developing dementia is essential for targeted prevention strategies. The DSDRS was developed to estimate 10-year dementia risk in individuals with T2DM by integrating clinical variables relevant to diabetes-related complications [6]. While the DSDRS has demonstrated predictive utility primarily in European and North American cohorts, its predictive value and associations with clinical and metabolic factors have not been well studied in Latin American populations [7,8,9]. In recent years, increasing attention has been directed toward the development of diabetes-specific tools for cognitive assessment and risk stratification [10]. While traditional cognitive screening instruments such as the Montreal Cognitive Assessment (MoCA) are widely used to detect cognitive impairment [11], risk prediction models such as the DSDRS offer the advantage of identifying individuals at elevated risk before clinically evident dementia develops [6]. Therefore, these approaches may provide complementary information for the early identification of vulnerable patients with T2DM.
In Mexico, where T2DM prevalence is high and frequently accompanied by central obesity, dyslipidemia, and hypertension, understanding how the DSDRS relates to cognitive performance and metabolic profiles is particularly relevant [1,12]. However, limited data are available regarding the association between the DSDRS and neuropsychological, anthropometric, and biochemical variables in older Mexican adults with T2DM. Therefore, the present study aimed to analyze the association between the DSDRS and clinical, biochemical, anthropometric, and neuropsychological variables in a cohort of older adults with a previous diagnosis of T2DM.

2. Materials and Methods

2.1. Study Design and Participants

An observational, cross-sectional study was conducted in a total of 291 adults aged 60 years and older with a previous diagnosis of T2DM. Participants with other types of diabetes, a prior diagnosis of Alzheimer’s disease, mild cognitive impairment, or other forms of dementia were excluded. Participants were recruited through an open community-based call in the city of Culiacán, Sinaloa, México. All procedures were carried out after obtaining written informed consent and in accordance with the principles of the Declaration of Helsinki. The study was reviewed and approved by the Research Ethics Committee of the Faculty of Medicine, following the guidelines established by CONBIOÉTICA (registration CONBIOÉTICA-25-CEI-003-20181012). This project was conducted as an extension of a previously approved project (CEIFM-PI-2021-003).

2.2. Clinical and Anthropometric Assessment

A structured medical history was obtained, including personal and family history, T2DM-related comorbidities, smoking and alcohol use, and physical activity habits. Anthropometric measurements were performed according to the International Society for the Advancement of Kinanthropometry (ISAK) guidelines. Waist and hip circumferences were measured with a standardized metal tape (Lufkin W606PM, Crescent Tools, Sparks, MD, USA). Height was measured using a portable stadiometer (model 213,seca, Hamburg, Germany) to the nearest 0.1 cm. Body composition was assessed using a bioelectrical impedance analysis (BIA) device (Tanita BC-545N, Tokyo, Japan). Measurements were performed under standardized conditions; body weight was measured directly, while skeletal muscle mass and bone mass were estimated using the manufacturer’s validated predictive algorithms. Body mass index (BMI) was calculated as weight (kg)/ height (m)2 and classified according to World Health Organization criteria as normal weight (18.5–24.9 kg/m2), overweight (≥25 kg/m2), and obesity (≥30 kg/m2) [13].

2.3. Biochemical Analysis

Fasting peripheral blood samples were collected by venipuncture after 10–12 h of fasting into EDTA tubes for plasma and serum-separating tubes for serum. Samples were centrifuged at 3000 rpm for 10 min, and plasma and serum were aliquoted for subsequent analyses. Serum was used to determine the lipid profile parameters, including triglycerides, total cholesterol, high-density lipoprotein (HDL) cholesterol, low-density lipoprotein (LDL) cholesterol, and very-low-density lipoprotein (VLDL) cholesterol, using standardized enzymatic colorimetric assays. Plasma glucose levels were measured using the glucose oxidase method, while glycated hemoglobin (HbA1c) was quantified in whole blood using a photometry method. All biochemical analyses were performed at the Centro de Investigación y Docencia en Ciencias de la Salud (CIDOCS) laboratory at the Civil Hospital of Culiacán.

2.4. Neuropsychological Screening

Cognitive function was evaluated using the Montreal Cognitive Assessment (MoCA), with educational adjustment, according to the original protocol [11]. MoCA scores were analyzed as a categorical variable using screening ranges as described in MoCA guidance: scores ≥ 26 were considered indicative of normal cognitive performance; 18–25, mild cognitive impairment; 10–17, moderate cognitive impairment; and ≤9, severe cognitive impairment [14]. Sleep quality was assessed using the Athens Insomnia Scale (AIS) [15], with scores of 0–5 indicating normal sleep; 6–9, suspected mild insomnia; and ≥10, clinically significant insomnia. Depressive symptoms were evaluated using the 21-item Beck Depression Inventory (BDI), with scores categorized as minimal or no depression (0–13), mild depression (14–19), moderate depression (20–28), and severe depression [16,17].

2.5. Diabetes-Specific Dementia Risk Score

The DSDRS was calculated based on clinical characteristics according to established criteria from Exalto, Biessels, Karter, Huang, Katon, Minkoff and Whitmer [6]. Age-related points were assigned as follows: 0 points for ages 60–64, 3 for ages 65–69, 5 for ages 70–74, 7 for ages 75–79, 9 for ages 80–84, and 10 for ages ≥ 85. Additional points were assigned for comorbidities, including 2 points for a history of acute metabolic events (severe hypoglycemia, diabetic ketoacidosis, or hyperosmolar hyperglycemic state), 2 points for cerebrovascular disease, 2 points for diagnosis of depression, 1 point for cardiovascular disease, 1 point for macrovascular disease, and 1 additional point in the presence of diabetic foot. Finally, one point was subtracted for participants with more than 12 years of schooling. The total DSDRS was calculated by summing the individual predictor scores as defined in the original model, yielding a score ranging from −1 (lowest risk) to 19 (highest risk).

2.6. Statistical Analysis

The normality of the data distribution was assessed using the Kolmogorov–Smirnov test. Continuous variables were presented as median [interquartile range]. Given the non-normal distribution, Spearman’s rank correlation coefficient was used to evaluate associations between clinical, biochemical, and neuropsychological variables. Multiple linear regression analysis was then performed to examine the independent associations between the DSDRS and selected anthropometric, biochemical, and neuropsychological variables. All statistical analyses and graphical representations were performed using GraphPad Prism (v2018) and Minitab Statistical Software (v2024). A two-tailed p-value < 0.05 was considered statistically significant.

3. Results

3.1. Participant Characteristics

A total of 291 older adults with a previous diagnosis of T2DM were included (Table 1). The median age was 66 [63–70] years. Participants had a high prevalence of overweight and obesity, with a median BMI of 29.2 [25.9–33] kg/m2. Central adiposity was also common, as reflected by a median waist circumference of 100 [91–109] cm and waist-to-hip ratio of 0.9 [0.8–1]. Median muscle mass was 43.7 [38.2–51.5] kg, while bone mass was 2.3 [2–2.7] kg.
Dyslipidemia was present in 91.7% of participants, followed by hypertension (72.8%) and metabolic syndrome (71.8%). Microvascular complications were frequent, including diabetic nephropathy (28.5%) and retinopathy (27.8%), whereas cardiovascular and cerebrovascular diseases were less common (3.4% and 1.0%, respectively).
Regarding metabolic control, median HbA1c was 7% [6.1–8.3] and fasting glucose was 138 [103.8–195.7] mg/dL. The lipid profile showed median total cholesterol of 185.3 [148.2–223] mg/dL, HDL cholesterol of 44.3 [34.3–54.8] mg/dL, LDL cholesterol of 101.9 [61.6–143.2] mg/dL, VLDL cholesterol of 29.4 [19.8–40.4] mg/dL, and triglycerides of 146 [101.5–189.5] mg/dL. The median TyG index was 9.2 [8.7–9.7]. Neuropsychological screening revealed a median MoCA score of 25 [21.5–26], consistent with mild cognitive impairment, while depressive symptoms and insomnia scores were generally within mild ranges.

3.2. Distribution of the Diabetes-Specific Dementia Risk Score

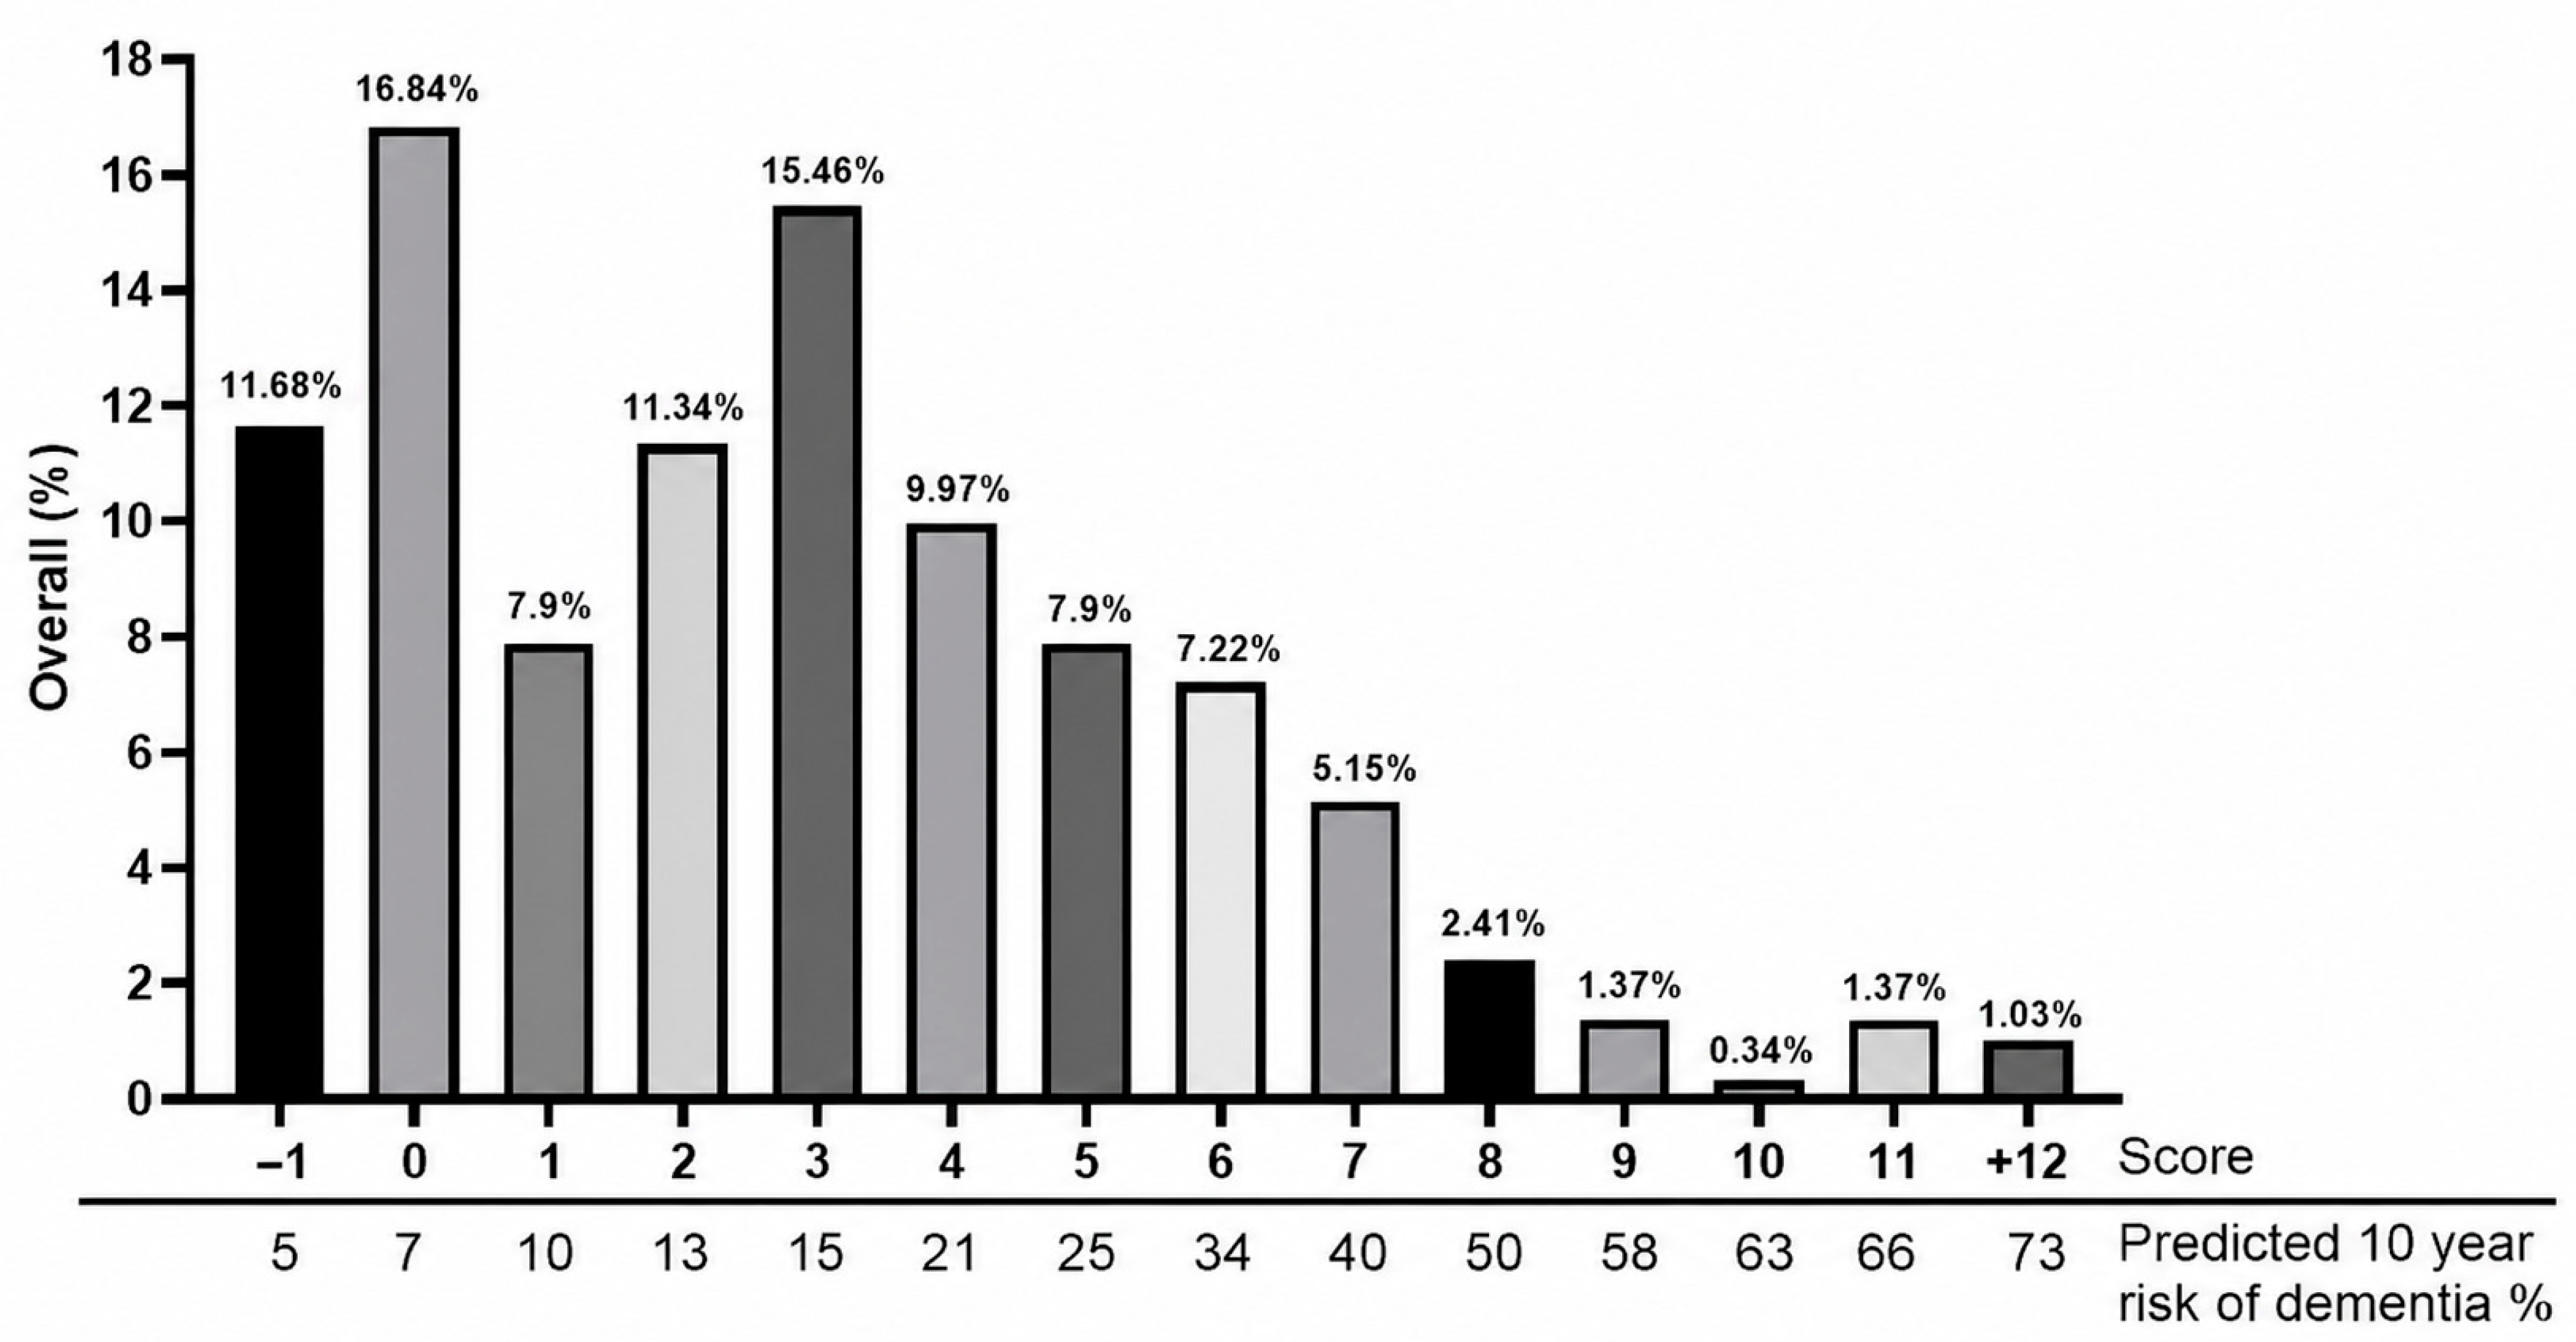
The DSDRS has substantial variability, ranging from −1 to +12 points (Figure 1). The most frequent scores were 0 (16.84%), 3 (15.46%), and −1 (11.68%), followed by 2 (11.34%) and 4 (9.97%). Based on the risk estimates proposed by Exalto [6], these scores correspond to predicted 10-year dementia risks ranging from 5% to73%. Most participants clustered within low to moderate estimated risk categories (10–25%). A smaller proportion exhibited high-risk scores, including 2.41% with a score of 8 (estimated risk of 50%), 2.7% with scores of 9 or 11 (risk of 58% and 66%, respectively), and 1.03% with the maximum score of 12 (estimated risk of 73%). Overall, the majority of the sample presented low to moderate estimated dementia risk, while a subset demonstrated markedly elevated risk.

3.3. Correlations Between Diabetes-Specific Dementia Risk Score and Clinical, Biochemical, and Neuropsychological Variables

Significant associations were identified between the DSDRS and clinical, biochemical, and neuropsychological variables (Table 2). The DSDRS was negatively correlated with body weight (r = −0.1319; 95% CI: −0.2470 to −0.01315; p = 0.0252), muscle mass (r = −0.1617; 95% CI: −0.2779 to −0.04072; p = 0.0072), and bone mass (r = −0.1480; 95% CI: −0.2649 to −0.02670; p = 0.0140). Among biochemical parameters, a modest but significant negative correlation was observed with fasting glucose levels (r = −0.1238; 95% CI: −0.2401 to −0.0040; p = 0.0370), whereas no significant associations were found with HbA1c or lipid profile components.
Regarding neuropsychological measures, higher DSDRS was significantly associated with lower cognitive performance, as indicated by MoCA scores (r = −0.2798; 95% CI: −0.4384 to −0.1044; p = 0.0021). In addition, a positive correlation was identified between the DSDRS and depressive symptoms assessed with the BDI (r = 0.3646; 95% CI: 0.2119 to 0.4999; p < 0.0001). No significant association was found between the DSDRS and insomnia scores in the correlation analysis.

3.4. Multiple Linear Regression Analysis

Multiple linear regression models were constructed to identify variables independently associated with the DSDRS (Table 3). The final model explained 31.9% of the variance in the DSDRS (R2 = 0.319; p < 0.0001). Lower MoCA scores (β = −1.005; 95% CI: −1.672 to −0.338; p = 0.004), reduced muscle mass (β = −0.339; 95% CI: −0.602 to −0.077; p = 0.012), and smoking (β = −9.58; 95% CI: −17.80 to −1.36; p = 0.023) were independently associated with higher DSDRS. Conversely, AIS was positively associated with the DSDRS (β = 0.669; 95% CI: 0.003 to 1.336; p = 0.049).
Several variables showed only trends toward significance, including pharmacological treatment for T2DM, physical activity, and VLDL cholesterol levels. No evidence of problematic collinearity was detected among the variables included in the model (all variance inflation factor values < 1.3).

4. Discussion

This study examined the association between the DSDRS and clinical, biochemical, anthropometric, and neuropsychological factors in older adults with T2DM. The cohort showed a high burden of cardiometabolic comorbidities, including dyslipidemia, hypertension, metabolic syndrome, and central obesity, consistent with previous reports in Mexican populations with T2DM [18]. These conditions are known contributors to cognitive decline through metabolic dysregulation, vascular damage, and chronic inflammation [19,20,21].
Biochemical analyses revealed suboptimal glycemic control, evidenced by elevated glucose and HbA1c levels. Chronic hyperglycemia has been strongly linked to microvascular dysfunction, neuroinflammation, and accelerated cognitive deterioration in individuals with T2DM [4,22,23,24]. Insulin resistance, estimated using the TyG index, has been associated with an increased risk of both vascular and neurodegenerative dementia in previous studies [25,26]. Although fasting insulin-derived indices such as HOMA-IR and HOMA-B could provide additional insights into peripheral insulin resistance and β-cell function, fasting insulin measurements were not available in the present cohort. Therefore, the TyG index was used as a validated surrogate marker of insulin resistance. In the present study, the elevated TyG index values observed (median 9.2) suggest the presence of an insulin-resistant metabolic profile that may contribute to neurodegenerative processes. However, no significant association between TyG index and DSDRS was identified. These findings suggest that, although insulin resistance may contribute to cognitive vulnerability in T2DM, other metabolic, vascular, and neuropsychological factors included in the DSDRS may have a greater influence on dementia risk estimation in this population.
Neuropsychological screening indicated average MoCA scores within the range of mild cognitive impairment, despite the absence of a previous dementia diagnosis [27]. This suggests that subclinical cognitive alterations are already present in a substantial proportion of older adults with T2DM [28,29]. In addition, relevant levels of depressive symptoms and sleep disturbances were observed, factors that have been consistently associated with impaired cognitive function through inflammatory and neuroendocrine mechanisms [30,31,32].
The distribution of DSDRS showed considerable variability in the study population. Although most participants were classified within low to moderate risk, a clinically relevant subgroup exhibited high scores corresponding to an estimated 10-year dementia risk exceeding 50%, according to established DSDRS risk categories. These findings align with the limited evidence available in Mexican populations and highlight a vulnerable subset of older adults with T2DM who may benefit from early preventive strategies [7]. Our findings are also consistent with studies conducted in diverse populations, supporting the DSDRS’s broader applicability across demographic and clinical settings. Higher DSDRSs were associated with poorer cognitive performance in European patients with T2DM and high cardio-renal risk [9], whereas an inverse association between DSDRS and cognitive performance was observed in Spanish adults with T2DM [8]. Similarly, higher DSDRS scores were associated with poorer cognitive and functional status among Mexican older adults [7]. Nevertheless, potential differences in the magnitude and expression of dementia risk across populations may reflect context-specific characteristics, including the high prevalence of metabolic syndrome, educational disparities, differences in healthcare access, and sociocultural determinants influencing cognitive reserve in Mexican older adults with T2DM [33]. Furthermore, the Amerindian genetic background of the Mexican population may contribute in part to its distinctive epidemiological profile, underscoring the importance of population-specific approaches [34]. Taken together, these findings support the applicability of the DSDRS in Mexican older adults and reinforce its potential utility for identifying individuals at increased risk of cognitive impairment and dementia.
The multiple regression model explained approximately one-third of the variability in the DSDRS, identifying cognitive performance, sleep quality, muscle mass, and smoking as variables independently associated with the DSDRS. Physical activity, VLDL cholesterol, and pharmacological treatment for T2DM showed association trends and are therefore discussed as exploratory findings. These results are consistent with the multifactorial associations observed between dementia risk and metabolic dysfunction, lifestyle factors, and neuropsychological alterations in T2DM [2,4,20,35].
Lower MoCA scores were strongly associated with higher DSDRS values, a finding that is consistent with previous evidence implicating cerebral insulin resistance and chronic hyperglycemia in cognitive decline [28]. Metabolic dysfunction in T2DM promotes abnormal protein accumulation, oxidative stress, and neuroinflammation, key processes involved in neurodegeneration [5,36]. These alterations contribute to synaptic dysfunction and structural brain changes, particularly in regions involved in memory and executive function, ultimately manifesting as impaired cognitive performance [37].
Sleep disturbances, particularly insomnia, were positively associated with DSDRS. Although the present study did not assess underlying mechanisms, previous research has shown that poor sleep quality exacerbates insulin resistance, systemic inflammation, and neurodegeneration, and impairs glymphatic clearance of neurotoxic proteins such as β-amyloid and tau [38,39,40,41]. Clinical evidence suggests that insomnia independently predicts cognitive impairment in older adults with diabetes, underscoring sleep as a modifiable risk factor in this population [31,42].
Muscle mass was inversely associated with higher DSDRSs, consistent with growing evidence linking sarcopenia to accelerated cognitive decline [43,44]. Skeletal muscle functions as an endocrine organ, releasing myokines that exert neuroprotective effects and regulate systemic inflammation [43]. Loss of muscle mass may therefore contribute to neurodegeneration through reduced neurotrophic support and heightened inflammatory activity [43,44]. In parallel, physical activity showed a protective trend, supporting its role in improving metabolic control, reducing inflammation, and promoting brain health through muscle–brain crosstalk [43].
Circulating lipids, particularly VLDL cholesterol, showed a trend toward an inverse association with DSDRS. This finding may reflect treatment effects or metabolic alterations rather than a protective mechanism [45,46,47]. Disruption of lipid metabolism in T2DM has been linked to blood–brain barrier dysfunction and neuroinflammation, suggesting that dyslipidemia remains a relevant contributor to cognitive risk [48].
Dietary factors may also contribute to cognitive vulnerability in older adults with T2DM through mechanisms involving lipid metabolism, systemic inflammation, and metabolic dysfunction. Diets characterized by excessive caloric intake or high saturated fat content have been linked to neurodegenerative pathways and impaired cognitive performance in aging populations [49,50]. Although dietary intake was not systematically assessed in the present study, future investigations should consider dietary patterns as potential modifiers of DSDRS-related dementia risk.
The inverse association observed between smoking and DSDRS likely reflects survival bias rather than a true protective effect, as extensive evidence links tobacco exposure to increased dementia risk [51,52]. Similarly, the positive association between pharmacological treatment and DSDRS probably indicates greater disease severity and longer duration of metabolic dysfunction rather than adverse effects of medication [2]. It is also important to consider that growing evidence suggests that some glucose-lowering therapies may influence cognitive outcomes through mechanisms related to insulin signaling, inflammation, and metabolic regulation [53]. However, in the present study, medication categories were heterogeneous, and sample sizes within specific treatment groups were insufficient to allow robust comparisons. Therefore, the potential influence of individual glucose-lowering therapies on dementia risk could not be adequately evaluated and warrants further investigation in larger, treatment-stratified cohorts.
Overall, these findings indicate that the DSDRS is associated with metabolic, neuropsychological, and lifestyle factors in older adults with T2DM. Identifying modifiable factors associated with cognitive vulnerability, such as sleep quality, physical activity, and muscle mass, suggests areas for further research in this population. Beyond risk prediction models, diabetes-specific cognitive screening tools are also emerging for clinical use. The Diabetic Cognitive Assessment Tool (DCAT), recently proposed for older adults with T2DM, has shown promising performance in identifying cognitive impairment in clinical settings [10]. While the DSDRS was designed to estimate long-term dementia risk based on clinical characteristics and diabetes-related complications, the DCAT aims to detect current cognitive dysfunction. Therefore, both instruments may play complementary roles in routine diabetes care, facilitating early identification of individuals who could benefit from more comprehensive cognitive evaluation and preventive interventions.
An important strength of the present study is its comprehensive, multidimensional assessment of dementia-related risk in older adults with T2DM, integrating neuropsychological, metabolic, biochemical, and anthropometric variables into a single analytical framework. To our knowledge, this is among the first studies in a Mexican and broader Latin American population to evaluate the clinical relevance of the DSDRS in relation to cognitive and metabolic vulnerability. Furthermore, the community-based recruitment strategy enhances the representativeness of older adults living with T2DM beyond highly selected clinical settings, enabling a broader characterization of dementia-related risk in routine population contexts. By combining multiple domains relevant to cognitive health, this study contributes to a more comprehensive understanding of factors associated with dementia vulnerability in older adults with T2DM.
Several limitations should be considered when interpreting the present findings. First, the cross-sectional design precludes establishing causal relationships between DSDRS and the evaluated clinical, metabolic, and neuropsychological factors. In addition, fasting insulin measurements were unavailable, preventing calculation of the HOMA-IR and HOMA-B indices; therefore, the TyG index was used as a surrogate marker of insulin resistance, although it may not fully capture all aspects of glucose homeostasis related to cognitive decline. Dietary intake and dietary patterns were not systematically assessed, and medication heterogeneity limited evaluation of the potential effects of specific glucose-lowering therapies on cognitive risk (Table S1, in Supplementary Materials). Finally, the absence of dementia-related biomarkers or neuroimaging data limits the mechanistic interpretation of the observed associations. Nevertheless, the present study provides clinically relevant evidence regarding dementia vulnerability in older Mexican adults with T2DM within a real-world community setting.

5. Conclusions

In older adults with T2DM, the DSDRS was significantly associated with cognitive performance, sleep disturbances, and muscle mass, highlighting the multifactorial nature of dementia risk in this population. These findings underscore the relevance of comprehensive assessments integrating primarily neuropsychological and functional correlates, with limited associations observed for metabolic variables.

Supplementary Materials

The following supporting information can be downloaded at: https://www.mdpi.com/article/10.3390/diabetology7060118/s1, Table S1: Frequency and distribution of glucose-lowering medications used by study participants.

Author Contributions

Conceptualization, D.L.B.-F. and J.M.-G.; methodology, D.L.B.-F. and L.C.-Z.; validation, A.M.G.-L., C.E.A.-R. and A.M.R.-R.; formal analysis, D.L.B.-F. and A.K.D.l.H.-A.; investigation, D.L.B.-F., A.M.G.-L., C.E.A.-R., C.D.N.-V. and A.M.R.-R.; resources, A.M.G.-L., C.E.A.-R., M.A.V.-F., C.D.N.-V., A.K.D.l.H.-A., A.M.R.-R. and J.M.-G.; data curation, D.L.B.-F.; writing—original draft preparation, D.L.B.-F.; writing—review and editing, A.M.G.-L., C.E.A.-R., M.A.V.-F., C.D.N.-V., A.K.D.l.H.-A., A.M.R.-R., L.C.-Z. and J.M.-G.; visualization, D.L.B.-F. and M.A.V.-F.; supervision, L.C.-Z. and J.M.-G.; project administration, L.C.-Z. and J.M.-G.; funding acquisition, J.M.-G. All authors have read and agreed to the published version of the manuscript.

Funding

This work was supported by the Secretaría de Ciencia, Humanidades, Tecnología e Innovación through the Ciencia Básica y de Frontera Program [grant number CBF2023-2024-3494].

Institutional Review Board Statement

All procedures were carried out after obtaining written informed consent and in accordance with the principles of the Declaration of Helsinki. The study was reviewed and approved by the Research Ethics Committee of the Faculty of Medicine, following the guidelines established by CONBIOÉTICA (registration CONBIOÉTICA-25-CEI-003-20181012). This project was conducted as an extension of a previously approved project (Approval Code: CEIFM-PI-2021-003; Approval Date: 10 April 2021).

Informed Consent Statement

All participants (or their proxies) provided written informed consent.

Data Availability Statement

The data that support the findings of this study are available from the corresponding author upon reasonable request.

Conflicts of Interest

The authors declare no conflicts of interest.

Abbreviations

The following abbreviations are used in this manuscript:
CIASaPCentro de Investigación Aplicada a la Salud Pública
DSDRSDiabetes-Specific Dementia Risk Score
T2DMType 2 Diabetes Mellitus
PI3K/AktPhosphoinositide 3-Kinase/Protein Kinase B
GSK3βGlycogen Synthase Kinase 3 Beta
ISAKInternational Society for the Advancement of Kinanthropometry
BIABioelectrical Impedance Analysis
BMIBody Mass Index
HDLHigh-Density Lipoprotein
LDLLow-Density Lipoprotein
VLDLVery-Low-Density Lipoprotein
HbA1cGlycated Hemoglobin
CIDOCSCentro de Investigación y Docencia en Ciencias de la Salud
MoCAMontreal Cognitive Assessment
AISAthens Insomnia Scale
BDIBeck Depression Inventory
TyGTriglyceride–Glucose Index
WHtRWaist-to-Height Ratio
WHRWaist-to-Hip Ratio
SECIHTISecretaría de Ciencia, Humanidades, Tecnología e Innovación

References

  1. International Diabetes Federation. IDF Diabetes Atlas, 11th ed.; International Diabetes Federation: Brussels, Belgium, 2025. [Google Scholar]
  2. Biessels, G.J.; Despa, F. Cognitive decline and dementia in diabetes mellitus: Mechanisms and clinical implications. Nat. Rev. Endocrinol. 2018, 14, 591–604. [Google Scholar] [CrossRef] [Scilit] [PubMed]
  3. Cao, F.; Yang, F.; Li, J.; Guo, W.; Zhang, C.; Gao, F.; Sun, X.; Zhou, Y.; Zhang, W. The relationship between diabetes and the dementia risk: A meta-analysis. Diabetol. Metab. Syndr. 2024, 16, 101. [Google Scholar] [CrossRef] [Scilit] [PubMed]
  4. van Sloten, T.T.; Sedaghat, S.; Carnethon, M.R.; Launer, L.J.; Stehouwer, C.D.A. Cerebral microvascular complications of type 2 diabetes: Stroke, cognitive dysfunction, and depression. Lancet Diabetes Endocrinol. 2020, 8, 325–336. [Google Scholar] [CrossRef] [Scilit] [PubMed]
  5. Pugazhenthi, S.; Qin, L.; Reddy, P.H. Common neurodegenerative pathways in obesity, diabetes, and Alzheimer’s disease. Biochim. Biophys. Acta Mol. Basis Dis. 2017, 1863, 1037–1045. [Google Scholar] [CrossRef] [Scilit] [PubMed]
  6. Exalto, L.G.; Biessels, G.J.; Karter, A.J.; Huang, E.S.; Katon, W.J.; Minkoff, J.R.; Whitmer, R.A. Risk score for prediction of 10 year dementia risk in individuals with type 2 diabetes: A cohort study. Lancet Diabetes Endocrinol. 2013, 1, 183–190. [Google Scholar] [CrossRef] [Scilit] [PubMed]
  7. Bello-Chavolla, O.Y.; Aguilar-Salinas, C.A.; Avila-Funes, J.A. The type 2 diabetes-specific dementia risk score (DSDRS) is associated with frailty, cognitive and functional status amongst Mexican community-dwelling older adults. BMC Geriatr. 2020, 20, 363. [Google Scholar] [CrossRef] [Scilit] [PubMed]
  8. Ortiz Zuñiga, A.M.; Simó, R.; Rodriguez-Gómez, O.; Hernández, C.; Rodrigo, A.; Jamilis, L.; Campo, L.; Alegret, M.; Boada, M.; Ciudin, A. Clinical Applicability of the Specific Risk Score of Dementia in Type 2 Diabetes in the Identification of Patients with Early Cognitive Impairment: Results of the MOPEAD Study in Spain. J. Clin. Med. 2020, 9, 2726. [Google Scholar] [CrossRef] [Scilit] [PubMed]
  9. Verhagen, C.; Janssen, J.; Exalto, L.G.; van den Berg, E.; Johansen, O.E.; Biessels, G.J. Diabetes-specific dementia risk score (DSDRS) predicts cognitive performance in patients with type 2 diabetes at high cardio-renal risk. J. Diabetes Complicat. 2020, 34, 107674. [Google Scholar] [CrossRef] [Scilit] [PubMed]
  10. Tayob, M.H.; Goncalves, C.N.; Musundwa, M.N.; Thokan, A.; Choonara, H.; Modan, Z.; Mabuza, W.P.; Mapatlare, M.P.; Mohamed, F.; Mathew, A. The performance of a novel, diabetes-specific cognitive screening tool against the MoCA in older adults with type 2 diabetes. BMC Geriatr. 2026, 26, 739. [Google Scholar] [CrossRef] [Scilit] [PubMed]
  11. Nasreddine, Z.S.; Phillips, N.A.; Bédirian, V.; Charbonneau, S.; Whitehead, V.; Collin, I.; Cummings, J.L.; Chertkow, H. The Montreal Cognitive Assessment, MoCA: A brief screening tool for mild cognitive impairment. J. Am. Geriatr. Soc. 2005, 53, 695–699. [Google Scholar] [CrossRef] [Scilit] [PubMed]
  12. Campos-Nonato, I.; Ramírez-Villalobos, M.; Monterrubio-Flores, E.; Mendoza-Herrera, K.; Aguilar-Salinas, C.; Pedroza-Tobías, A.; Simón, B. Prevalence of Metabolic Syndrome and Combinations of Its Components: Findings from the Mexican National Health and Nutrition Survey, 2021. Metab. Syndr. Relat. Disord. 2025, 23, 193–204. [Google Scholar] [CrossRef] [Scilit] [PubMed]
  13. WHO. A Healthy Lifestyle—WHO Recommendations. Available online: https://www.who.int/europe/news-room/fact-sheets/item/a-healthy-lifestyle---who-recommendations (accessed on 2 June 2025).
  14. MoCA. Interpretation of the MoCA. Available online: https://mocacognition.com/faq/ (accessed on 5 June 2025).
  15. Soldatos, C.R.; Dikeos, D.G.; Paparrigopoulos, T.J. The diagnostic validity of the Athens Insomnia Scale. J. Psychosom. Res. 2003, 55, 263–267. [Google Scholar] [CrossRef] [Scilit] [PubMed]
  16. Beck, A.T.; Ward, C.H.; Mendelson, M.; Mock, J.; Erbaugh, J. An inventory for measuring depression. Arch. Gen. Psychiatry 1961, 4, 561–571. [Google Scholar] [CrossRef] [Scilit] [PubMed]
  17. Wang, Y.P.; Gorenstein, C. Psychometric properties of the Beck Depression Inventory-II: A comprehensive review. Braz. J. Psychiatry 2013, 35, 416–431. [Google Scholar] [CrossRef] [Scilit] [PubMed]
  18. de la Cruz, J.P.S.; Morales, D.L.G.; González-Castro, T.B.; Tovilla-Zárate, C.A.; Juárez-Rojop, I.E.; López-Narváez, L.; Hernández-Díaz, Y.; Ble-Castillo, J.L.; Pérez-Hernández, N.; Rodriguez-Perez, J.M. Quality of life of Latin-American individuals with type 2 diabetes mellitus: A systematic review. Prim. Care Diabetes 2020, 14, 317–334. [Google Scholar] [CrossRef] [Scilit] [PubMed]
  19. Mekhora, C.; Lamport, D.J.; Spencer, J.P.E. An overview of the relationship between inflammation and cognitive function in humans, molecular pathways and the impact of nutraceuticals. Neurochem. Int. 2024, 181, 105900. [Google Scholar] [CrossRef] [Scilit] [PubMed]
  20. Kouvari, M.; D’Cunha, N.M.; Travica, N.; Sergi, D.; Zec, M.; Marx, W.; Naumovski, N. Metabolic Syndrome, Cognitive Impairment and the Role of Diet: A Narrative Review. Nutrients 2022, 14, 333. [Google Scholar] [CrossRef] [Scilit] [PubMed]
  21. Liang, Z.; Qin, H.; Su, B.; Bao, Y.; Vitiello, M.V.; Hu, G.; Wang, Y. Trajectories of general and central obesity beyond middle age in relation to late-life cognitive decline and dementia. Obesity 2025, 33, 405–415. [Google Scholar] [CrossRef] [Scilit] [PubMed]
  22. Moran, C.; Whitmer, R.A.; Dove, Z.; Lacy, M.E.; Soh, Y.; Tsai, A.L.; Quesenberry, C.P.; Karter, A.J.; Adams, A.S.; Gilsanz, P. HbA(1c) variability associated with dementia risk in people with type 2 diabetes. Alzheimer’s Dement. 2024, 20, 5561–5569. [Google Scholar] [CrossRef] [Scilit] [PubMed]
  23. Moran, C.; Lacy, M.E.; Whitmer, R.A.; Tsai, A.L.; Quesenberry, C.P.; Karter, A.J.; Adams, A.S.; Gilsanz, P. Glycemic Control Over Multiple Decades and Dementia Risk in People With Type 2 Diabetes. JAMA Neurol. 2023, 80, 597–604. [Google Scholar] [CrossRef] [Scilit] [PubMed]
  24. Cho, S.; Ok Kim, C.; Cha, B.S.; Kim, E.; Mo Nam, C.; Kim, M.G.; Park, M.S. The effects of long-term cumulative HbA1c exposure on the development and onset time of dementia in the patients with type 2 diabetes mellitus: Hospital based retrospective study (2005–2021). Diabetes Res. Clin. Pract. 2023, 201, 110721. [Google Scholar] [CrossRef] [Scilit] [PubMed]
  25. Liu, C.; Liang, D. The association between the triglyceride-glucose index and the risk of cardiovascular disease in US population aged ≤ 65 years with prediabetes or diabetes: A population-based study. Cardiovasc. Diabetol. 2024, 23, 168. [Google Scholar] [CrossRef] [Scilit] [PubMed]
  26. Bai, W.; An, S.; Jia, H.; Xu, J.; Qin, L. Relationship between triglyceride-glucose index and cognitive function among community-dwelling older adults: A population-based cohort study. Front. Endocrinol. 2024, 15, 1398235. [Google Scholar] [CrossRef] [Scilit] [PubMed]
  27. Ilardi, C.R.; Menichelli, A.; Michelutti, M.; Cattaruzza, T.; Manganotti, P. Optimal MoCA cutoffs for detecting biologically-defined patients with MCI and early dementia. Neurol. Sci. 2023, 44, 159–170. [Google Scholar] [CrossRef] [Scilit] [PubMed]
  28. Baglietto-Vargas, D.; Shi, J.; Yaeger, D.M.; Ager, R.; LaFerla, F.M. Diabetes and Alzheimer’s disease crosstalk. Neurosci. Biobehav. Rev. 2016, 64, 272–287. [Google Scholar] [CrossRef] [Scilit] [PubMed]
  29. Bernier, P.J.; Gourdeau, C.; Carmichael, P.H.; Beauchemin, J.P.; Voyer, P.; Hudon, C.; Laforce, R., Jr. It’s all about cognitive trajectory: Accuracy of the cognitive charts-MoCA in normal aging, MCI, and dementia. J. Am. Geriatr. Soc. 2023, 71, 214–220. [Google Scholar] [CrossRef] [Scilit] [PubMed]
  30. Sullivan, M.D.; Katon, W.J.; Lovato, L.C.; Miller, M.E.; Murray, A.M.; Horowitz, K.R.; Bryan, R.N.; Gerstein, H.C.; Marcovina, S.; Akpunonu, B.E.; et al. Association of depression with accelerated cognitive decline among patients with type 2 diabetes in the ACCORD-MIND trial. JAMA Psychiatry 2013, 70, 1041–1047. [Google Scholar] [CrossRef] [Scilit] [PubMed]
  31. O, C.K.; Siu, B.W.; Leung, V.W.; Lin, Y.Y.; Ding, C.Z.; Lau, E.S.; Luk, A.O.; Chow, E.Y.; Ma, R.C.; Chan, J.C.; et al. Association of insomnia with incident chronic cognitive impairment in older adults with type 2 diabetes mellitus: A prospective study of the Hong Kong Diabetes Register. J. Diabetes Complicat. 2023, 37, 108598. [Google Scholar] [CrossRef] [Scilit] [PubMed]
  32. Dantzer, R.; O’Connor, J.C.; Freund, G.G.; Johnson, R.W.; Kelley, K.W. From inflammation to sickness and depression: When the immune system subjugates the brain. Nat. Rev. Neurosci. 2008, 9, 46–56. [Google Scholar] [CrossRef] [Scilit] [PubMed]
  33. Ortiz-Rodríguez, M.A.; Bautista-Ortiz, L.F.; Villa, A.R.; Antúnez-Bautista, P.K.; Aldaz-Rodríguez, M.V.; Estrada-Luna, D.; Denova-Gutiérrez, E.; Camacho-Díaz, B.H.; Martínez-Salazar, M.F. Prevalence of Metabolic Syndrome Among Mexican Adults. Metab. Syndr. Relat. Disord. 2022, 20, 264–272. [Google Scholar] [PubMed]
  34. Mendoza-Caamal, E.C.; Barajas-Olmos, F.; García-Ortiz, H.; Cicerón-Arellano, I.; Martínez-Hernández, A.; Córdova, E.J.; Esparza-Aguilar, M.; Contreras-Cubas, C.; Centeno-Cruz, F.; Cid-Soto, M.; et al. Metabolic syndrome in indigenous communities in Mexico: A descriptive and cross-sectional study. BMC Public Health 2020, 20, 339. [Google Scholar] [CrossRef] [Scilit] [PubMed]
  35. Moheet, A.; Mangia, S.; Seaquist, E.R. Impact of diabetes on cognitive function and brain structure. Ann. N. Y. Acad. Sci. 2015, 1353, 60–71. [Google Scholar] [CrossRef] [Scilit] [PubMed]
  36. Tunalı, N.E. Neurodegenerative Diseases: Molecular Mechanisms and Current Therapeutic Approaches; IntechOpen: London, UK, 2021. [Google Scholar]
  37. Bourne, K.Z.; Ferrari, D.C.; Lange-Dohna, C.; Rossner, S.; Wood, T.G.; Perez-Polo, J.R. Differential regulation of BACE1 promoter activity by nuclear factor-kappaB in neurons and glia upon exposure to beta-amyloid peptides. J. Neurosci. Res. 2007, 85, 1194–1204. [Google Scholar] [CrossRef] [Scilit] [PubMed]
  38. Xie, L.; Kang, H.; Xu, Q.; Chen, M.J.; Liao, Y.; Thiyagarajan, M.; O’Donnell, J.; Christensen, D.J.; Nicholson, C.; Iliff, J.J.; et al. Sleep drives metabolite clearance from the adult brain. Science 2013, 342, 373–377. [Google Scholar] [CrossRef] [Scilit] [PubMed]
  39. Rasmussen, M.K.; Mestre, H.; Nedergaard, M. The glymphatic pathway in neurological disorders. Lancet Neurol. 2018, 17, 1016–1024. [Google Scholar] [CrossRef] [Scilit] [PubMed]
  40. Henson, J.; Ibarburu, G.H.; Drebert, Z.; Slater, T.; Hall, A.P.; Khunti, K.; Sargeant, J.A.; Zaccardi, F.; Davies, M.J.; Yates, T. Sleep disorders in younger and middle-older age adults with newly diagnosed type 2 diabetes mellitus: A retrospective cohort study in >1 million individuals. Diabetes Res. Clin. Pract. 2024, 217, 111887. [Google Scholar] [CrossRef] [Scilit] [PubMed]
  41. Holingue, C.; Wennberg, A.; Berger, S.; Polotsky, V.Y.; Spira, A.P. Disturbed sleep and diabetes: A potential nexus of dementia risk. Metabolism 2018, 84, 85–93. [Google Scholar] [CrossRef] [Scilit] [PubMed]
  42. Maimaitituerxun, R.; Wang, H.; Chen, W.; Xiang, J.; Xie, Y.; Xiao, F.; Wu, X.Y.; Chen, L.; Yang, J.; Liu, A.; et al. Association between sleep quality and mild cognitive impairment in Chinese patients with type 2 diabetes mellitus: A cross-sectional study. BMC Public Health 2025, 25, 1096. [Google Scholar] [CrossRef] [Scilit] [PubMed]
  43. Han, X.; Ashraf, M.; Tipparaju, S.M.; Xuan, W. Muscle-Brain crosstalk in cognitive impairment. Front. Aging Neurosci. 2023, 15, 1221653. [Google Scholar] [CrossRef] [Scilit] [PubMed]
  44. Arosio, B.; Calvani, R.; Ferri, E.; Coelho-Junior, H.J.; Carandina, A.; Campanelli, F.; Ghiglieri, V.; Marzetti, E.; Picca, A. Sarcopenia and Cognitive Decline in Older Adults: Targeting the Muscle-Brain Axis. Nutrients 2023, 15, 1853. [Google Scholar] [CrossRef] [Scilit] [PubMed]
  45. Khavandi, M.; Duarte, F.; Ginsberg, H.N.; Reyes-Soffer, G. Treatment of Dyslipidemias to Prevent Cardiovascular Disease in Patients with Type 2 Diabetes. Curr. Cardiol. Rep. 2017, 19, 7. [Google Scholar] [CrossRef] [Scilit] [PubMed]
  46. Lin, Y.S.; Liu, C.K.; Lee, H.C.; Chou, M.C.; Ke, L.Y.; Chen, C.H.; Chen, S.L. Electronegative very-low-density lipoprotein induces brain inflammation and cognitive dysfunction in mice. Sci. Rep. 2021, 11, 6013. [Google Scholar] [CrossRef] [Scilit] [PubMed]
  47. Li, C.L.; Chu, C.H.; Lee, H.C.; Chou, M.C.; Liu, C.K.; Chen, C.H.; Ke, L.Y.; Chen, S.L. Immunoregulatory effects of very low density lipoprotein from healthy individuals and metabolic syndrome patients on glial cells. Immunobiology 2019, 224, 632–637. [Google Scholar] [CrossRef] [Scilit] [PubMed]
  48. Huang, J.K.; Lee, H.C. Emerging Evidence of Pathological Roles of Very-Low-Density Lipoprotein (VLDL). Int. J. Mol. Sci. 2022, 23, 4300. [Google Scholar] [CrossRef] [Scilit] [PubMed]
  49. Liu, X.; Beck, T.; Desai, P.; Dhana, K.; Evans, D.A.; Rajan, K.B. Dietary Fat Intake, Blood Tau Levels, and Cognitive Decline in Older Adults. Alzheimer’s Dement. 2025, 21, e107782. [Google Scholar] [CrossRef] [Scilit]
  50. Zheng, C.; Zhang, Q.; Liu, F.; Qiu, G. The role of the Mediterranean diet in the treatment of cognitive dysfunction in patients with type 2 diabetes mellitus. Front. Nutr. 2025, 12, 1654684. [Google Scholar] [CrossRef] [Scilit] [PubMed]
  51. Zhong, G.; Wang, Y.; Zhang, Y.; Guo, J.J.; Zhao, Y. Smoking is associated with an increased risk of dementia: A meta-analysis of prospective cohort studies with investigation of potential effect modifiers. PLoS ONE 2015, 10, e0118333. [Google Scholar] [CrossRef] [Scilit] [PubMed]
  52. Anstey, K.J.; von Sanden, C.; Salim, A.; O’Kearney, R. Smoking as a risk factor for dementia and cognitive decline: A meta-analysis of prospective studies. Am. J. Epidemiol. 2007, 166, 367–378. [Google Scholar] [CrossRef] [Scilit] [PubMed]
  53. Li, Z.; Lin, C.; Cai, X.; Lv, F.; Yang, W.; Ji, L. Anti-diabetic agents and the risks of dementia in patients with type 2 diabetes: A systematic review and network meta-analysis of observational studies and randomized controlled trials. Alzheimer’s Res. Ther. 2024, 16, 272. [Google Scholar] [CrossRef] [Scilit] [PubMed]
Figure 1. Percentage distribution of participants according to DSDRS and predicted 10-year dementia risk. The horizontal axis represents DSDRS and estimated 10-year risk of developing dementia, while the vertical axis indicates the percentage of participants in each score category.
Diabetology 07 00118 g001
Table 1. Clinical, anthropometric, biochemical and neuropsychological characteristics. Data are presented as median [interquartile range] for continuous variables and as number (percentage) for categorical variables. The normality of data distribution was assessed using the Kolmogorov–Smirnov test.
Characteristics of Study ParticipantsOverall Sample (n = 291)
Median [Interquartile Range]
Age (years)66 [63–70]
BMI (kg/m2)29.2 [25.9–33]
Waist circumference (cm)100 [91–109]
Waist-to-hip ratio0.9 [0.8–1]
Muscle mass (kg)43.7 [38.2–51.5]
Bone mass (kg)2.3 [2–2.7]
Smoker n (%)19 (6.5%)
Dyslipidemia n (%)267 (91.7%)
Hypertension n (%)212 (72.8%)
Metabolic syndrome, n (%)209 (71.8%)
Diabetic nephropathy, n (%)83 (28.5%)
Diabetic retinopathy, n (%)81 (27.8%)
Cardiovascular disease, n (%)10 (3.4%)
Cerebrovascular disease, n (%)3 (1%)
Biochemical parameters
HbA1c (%)7 [6.1–8.3]
Glucose (mg/dL)138 [103.8–195.7]
Cholesterol (mg/dL)185.3 [148.2–223]
HDL cholesterol (mg/dL)44.3 [34.3–54.8]
LDL cholesterol (mg/dL)101.9 [61.6–143.2]
VLDL cholesterol (mg/dL)29.4 [19.8–40.4]
Triglycerides (mg/dL)146 [101.5–189.5]
TyG index 9.2 [8.7–9.7]
Neuropsychological assessment scores
MoCA25 [21.5–26]
BDI6 [2–12]
AIS4 [2–7.2]
Table 2. Correlation between DSDRS and clinical, biochemical, and neuropsychological variables. Data are presented as Spearman’s rank correlation coefficients (r) with 95% confidence intervals (95% CI) and two-tailed p-values. Statistically significant associations (p < 0.05) are highlighted in bold.
Parameterr95% CIp-Value
Age (years)0.87880.8488 to 0.9032<0.0001
Weight (kg)−0.1319−0.2470 to −0.013150.0252
BMI (kg/m2)−0.05484−0.1731 to 0.064970.3555
Muscle mass (kg)−0.1617−0.2779 to −0.040720.0072
Bone mass (kg)−0.1480−0.2649 to −0.026700.0140
WHR0.06488−0.05777 to 0.18560.2855
HbA1c (%)−0.1149−0.2363 to 0.0099480.0632
Glucose (mg/dL)−0.1238−0.2401 to −0.0040910.0370
Cholesterol (mg/dL)−0.09093−0.2083 to 0.028980.1257
HDL cholesterol (mg/dL)0.07286−0.04714 to 0.19080.2201
LDL cholesterol (mg/dL)−0.05536−0.1744 to 0.065300.3543
VLDL cholesterol (mg/dL)−0.04104−0.1601 to 0.079140.4909
Triglycerides (mg/dL)−0.01951−0.1388 to 0.10030.7429
TyG index −0.08747−0.2051 to 0.032670.1415
MoCA−0.2798−0.4384 to −0.10440.0021
BDI0.36460.2119 to 0.4999<0.0001
AIS0.1151−0.05073 to 0.27480.1606
Table 3. Multiple linear regression between DSDRS and clinical, biochemical, and neuropsychological variables. Standardized β-coefficients with 95% confidence intervals (95% CI), t-statistics, and corresponding p-values are reported. The final model was adjusted for clinically relevant covariates, with the DSDRS used as the continuous dependent variable. Model fit is indicated by R2 and the overall p-value.
Model DiagnosticsParameterβ-Coefficientt95% CIp-Value
DSDRS,AIS0.6692.000.003 to 1.3360.049
r2 = 0.3190,MoCA−1.005−3.00−1.672 to 0.3380.004
p ≤ 0.0001Smoker−9.58−2.32−17.80 to −1.360.023
Physical activity−5.23−1.94−10.59 to 0.120.055
Muscle mass (kg)−0.339−2.57−0.602 to −0.0770.012
Treatment for T2DM5.141.85−0.39 to 10.680.068
VLDL cholesterol (mg/dL)−0.0589−1.95−0.1189 to 0.00110.054
Disclaimer/Publisher’s Note: The statements, opinions and data contained in all publications are solely those of the individual author(s) and contributor(s) and not of MDPI and/or the editor(s). MDPI and/or the editor(s) disclaim responsibility for any injury to people or property resulting from any ideas, methods, instructions or products referred to in the content.