
Body Roundness Index (BRI) Predicts Metabolic Syndrome in Postmenopausal Women with Obesity Better than Insulin Resistance

 ,
,  and
and
Abstract

1. Introduction
2. Materials and Methods
2.1. Study Design
2.2. Study Variables
2.2.1. Metabolic Syndrome, Adiposity Parameters, and Blood Pressure
2.2.2. Biochemical Procedures
2.3. Data Analysis
3. Results
Sample Description
4. Discussion
5. Conclusions
Author Contributions
Funding
Institutional Review Board Statement
Informed Consent Statement
Data Availability Statement
Conflicts of Interest
References
- Mottillo, S.; Filion, K.B.; Genest, J.; Joseph, L.; Pilote, L.; Poirier, P.; Rinfret, S.; Schiffrin, E.L.; Eisenberg, M.J. The metabolic syndrome and cardiovascular risk: A systematic review and meta-analysis. J. Am. Coll. Cardiol. 2010, 56, 1113–1132. [Google Scholar] [CrossRef]
- Misra, A.; Khurana, L. Obesity and the metabolic syndrome in developing countries. J. Clin. Endocrinol. Metab. 2008, 93 (Suppl. 1), S9–S30. [Google Scholar] [CrossRef] [PubMed]
- Thomas, D.M.; Bredlau, C.; Bosy-Westphal, A.; Mueller, M.; Shen, W.; Gallagher, D.; Maeda, Y.; McDougall, A.; Peterson, C.M.; Ravussin, E.; et al. Relationships between body roundness with body fat and visceral adipose tissue emerging from a new geometrical model. Obesity 2013, 21, 2264–2271. [Google Scholar] [CrossRef] [PubMed]
- Ebtekar, F.; Dalvand, S.; Gheshlagh, R.G. The prevalence of metabolic syndrome in postmenopausal women: A systematic review and meta-analysis in Iran. Diabetes Metab. Syndr. 2018, 12, 955–960. [Google Scholar] [CrossRef] [PubMed]
- Paschou, S.A.; Athanasiadou, K.I.; Papanas, N. Menopausal hormone therapy in women with type 2 diabetes mellitus: An updated review. Diabetes Ther. 2024, 15, 741–748. [Google Scholar] [CrossRef]
- Fox, C.S.; Massaro, J.M.; Hoffmann, U.; Pou, K.M.; Maurovich-Horvat, P.; Liu, C.Y.; Vasan, R.S.; Murabito, J.M.; Meigs, J.B.; Cupples, L.A.; et al. Abdominal visceral and subcutaneous adipose tissue compartments: Association with metabolic risk factors in the Framingham Heart Study. Circulation 2007, 116, 39–48. [Google Scholar] [CrossRef]
- Walton, C.; Lees, B.; Crook, D.; Worthington, M.; Godsland, I.F.; Stevenson, J.C. Body fat distribution, rather than overall adiposity, influences serum lipids and lipoproteins in healthy men independently of age. Am. J. Med. 1995, 99, 459–464. [Google Scholar] [CrossRef]
- National Institutes of Health. Clinical guidelines on the identification, evaluation, and treatment of overweight and obesity in adults: The evidence report. Obes. Res. 1998, 6 (Suppl. 2), 51S–209S. [Google Scholar]
- Pischon, T.; Boeing, H.; Hoffmann, K.; Bergmann, M.; Schulze, M.B.; Overvad, K.; Van Der Schouw, Y.T.; Spencer, E.; Moons, K.G.; Tjønneland, A.; et al. General and abdominal adiposity and risk of death in Europe. N. Engl. J. Med. 2008, 359, 2105–2120. [Google Scholar] [CrossRef]
- Prospective Studies Collaboration. Body-mass index and cause-specific mortality in 900,000 adults: Collaborative analyses of 57 prospective studies. Lancet 2009, 373, 1083–1096. [Google Scholar] [CrossRef]
- Gómez-Ambrosi, J.; Silva, C.; Galofré, J.C.; Escalada, J.; Santos, S.; Millán, D.; Vila, N.; Ibañez, P.; Gil, M.J.; Valentí, V.; et al. Body mass index classification misses subjects with increased cardiometabolic risk factors related to elevated adiposity. Int. J. Obes. (Lond.) 2012, 36, 286–294. [Google Scholar] [CrossRef] [PubMed]
- Martin, C.K.; Most, M.; Brock, C.; RD, S.; Mancuso, B.S.; Redman, L.M. Effect of dietary protein content on weight gain, energy expenditure, and body composition during overeating. JAMA 2012, 307, 47–55. [Google Scholar]
- Bigaard, J.; Frederiksen, K.; Tjønneland, A.; Thomsen, B.L.; Overvad, K.; Heitmann, B.L.; Sørensen, T.I. Body fat and fat-free mass and all-cause mortality. Obes. Res. 2004, 12, 1042–1049. [Google Scholar] [CrossRef]
- Kang, S.M.; Yoon, J.W.; Ahn, H.Y.; Kim, S.Y.; Lee, K.H.; Shin, H.; Choi, S.H.; Park, K.S.; Jang, H.C.; Lim, S. Android fat depot is more closely associated with metabolic syndrome than abdominal visceral fat in elderly people. PLoS ONE 2011, 6, e27694. [Google Scholar] [CrossRef] [PubMed]
- Seidell, J.C. Waist circumference and waist-hip ratio in relation to all-cause mortality, cancer and sleep apnea. Eur. J. Clin. Nutr. 2010, 64, 35–41. [Google Scholar] [CrossRef] [PubMed]
- Petursson, H.; Sigurdsson, J.A.; Bengtsson, C.; Nilsen, T.I.L.; Getz, L. Body configuration as a predictor of mortality: Comparison of five anthropometric measures in a 12-year follow-up of the Norwegian HUNT 2 study. PLoS ONE 2011, 6, e26621. [Google Scholar] [CrossRef]
- Chang, Y.; Guo, X.; Li, T.; Li, S.; Guo, J.; Sun, Y. A body shape index and body roundness index: Two new body indices to identify left ventricular hypertrophy among rural populations in Northeast China. Heart Lung Circ. 2016, 25, 358–364. [Google Scholar] [CrossRef]
- Zhang, N.; Chang, Y.; Guo, X.; Chen, Y.; Ye, N.; Sun, Y. A body shape index and body roundness index: Two new body indices for detecting association between obesity and hyperuricemia in rural area of China. Eur. J. Intern. Med. 2016, 29, 32–36. [Google Scholar] [CrossRef]
- Maessen, M.F.; Eijsvogels, T.M.; Verheggen, R.J.; Hopman, M.T.; Verbeek, A.L.; de Vegt, F. Entering a new era of body indices: The feasibility of a body shape index and body roundness index to identify cardiovascular health status. PLoS ONE 2014, 9, e107212. [Google Scholar] [CrossRef]
- Chang, Y.; Guo, X.; Chen, Y.; Guo, L.; Li, Z.; Yu, S.; Yang, H.; Sun, Y. A body shape index and body roundness index: Two new body indices to identify diabetes mellitus among rural populations in northeast China. BMC Public Health 2015, 15, 794. [Google Scholar] [CrossRef]
- Liu, P.J.; Ma, F.; Lou, H.P.; Zhu, Y.N. Body roundness index and body adiposity index: Two new anthropometric indices to identify metabolic syndrome among Chinese postmenopausal women. Climacteric 2016, 19, 433–439. [Google Scholar] [CrossRef] [PubMed]
- Lee, S.H.; Kwon, H.S.; Park, Y.M.; Ha, H.S.; Jeong, S.H.; Yang, H.K.; Lee, J.H.; Yim, H.W.; Kang, M.I.; Lee, W.C.; et al. Predicting the development of diabetes using the product of triglycerides and glucose: The Chungju Metabolic Disease Cohort (CMC) study. PLoS ONE 2014, 9, e90430. [Google Scholar] [CrossRef] [PubMed]
- Reaven, G.M. Role of insulin resistance in human disease. Diabetes 1988, 37, 1595–1607. [Google Scholar] [CrossRef] [PubMed]
- Yamada, C.; Mitsuhashi, T.; Hiratsuka, N.; Inabe, F.; Araida, N.; Takahashi, E. Optimal reference interval for homeostasis model assessment of insulin resistance in a Japanese population. J. Diabetes Investig. 2011, 2, 373–376. [Google Scholar] [CrossRef]
- Expert Panel on Detection, Evaluation and Treatment of High Blood Cholesterol in Adults (Adult Treatment Panel III). Executive summary of the Third Report of the National Cholesterol Education Program (NCEP). JAMA 2001, 285, 2486–2497. [Google Scholar] [CrossRef]
- Lukaski, H.; Johson, P.E. Assessment of fat-free mass using bioelectrical impedance measurements of the human body. Am. J. Clin. Nutr. 1985, 41, 810–817. [Google Scholar] [CrossRef]
- Friedewald, W.T.; Levy, R.J.; Fredrickson, D.S. Estimation of the concentration of low-density lipoprotein cholesterol in plasma without use of the preparative ultracentrifuge. Clin. Chem. 1972, 18, 499–502. [Google Scholar] [CrossRef]
- Mathews, D.R.; Hosker, J.P.; Rudenski, A.S.; Naylor, B.A.; Treacher, D.F. Homeostasis model assessment: Insulin resistance and beta cell function from fasting plasma glucose and insulin concentrations in man. Diabetologia 1985, 28, 412–414. [Google Scholar] [CrossRef]
- Baveicy, K.; Mostafaei, S.; Darbandi, M.; Hamzeh, B.; Najafi, F.; Pasdar, Y. Predicting metabolic syndrome by visceral adiposity index, body roundness index and a body shape index in adults: A cross-sectional study from the Iranian RaNCD Cohort Data. Diabetes Metab. Syndr. Obes. 2020, 13, 879–887. [Google Scholar] [CrossRef]
- Liu, B.; Liu, B.; Wu, G.; Yin, F. Relationship between body-roundness index and metabolic syndrome in type 2 diabetes. Diabetes Metab. Syndr. Obes. 2019, 12, 931. [Google Scholar] [CrossRef]
- Ramírez-Vélez, R.; Pérez-Sousa, M.Á.; Izquierdo, M.; Cano-Gutierrez, C.A.; González-Jiménez, E.; Schmidt-RioValle, J.; González-Ruíz, K.; Correa-Rodríguez, M. Validation of surrogate anthropometric indices in older adults: What is the best indicator of high cardiometabolic risk factor clustering? Nutrients 2019, 11, 1701. [Google Scholar] [CrossRef]
- Stefanescu, A.; Revilla, L.; Lopez, T.; Sanchez, S.E.; Williams, M.A.; Gelaye, B. Using a body shape index (ABSI) and body roundness index (BRI) to predict risk of metabolic syndrome in Peruvian adults. J. Int. Med. Res. 2019, 48, 1–12. [Google Scholar] [CrossRef] [PubMed]
- Endukuru, C.K.; Gaur, G.S.; Dhanalakshmi, Y.; Sahoo, J.; Vairappan, B. Cut-off values and clinical efficacy of body roundness index and other novel anthropometric indices in identifying metabolic syndrome and its components among Southern-Indian adults. Diabetol. Int. 2021, 13, 188–200. [Google Scholar] [CrossRef] [PubMed]
- Rico-Martín, S.; Calderón-García, J.F.; Sánchez-Rey, P.; Franco-Antonio, C.; Martínez Alvarez, M.; Sánchez Muñoz-Torrero, J.F. Effectiveness of body roundness index in predicting metabolic syndrome: A systematic review and meta-analysis. Obes. Rev. 2020, 21, e13023. [Google Scholar] [CrossRef] [PubMed]
- Li, Z.; Fan, C.; Huang, J.; Chen, Z.; Yu, X.; Qian, J. Non-linear relationship between the body roundness index and metabolic syndrome: Data from National Health and Nutrition Examination Survey (NHANES) 1999–2018. Br. J. Nutr. 2024, 131, 1852–1859. [Google Scholar] [CrossRef]


| Parameters | Total Group n = 468 | No Metabolic Syndrome n = 198 | Metabolic Syndrome n = 270 | p Value |
|---|---|---|---|---|
| BMI (k/m2) | 37.8 ± 1.2 | 36.6 ± 0.9 | 38.7 ± 0.7 | 0.01 |
| Body weight (kg) | 88.6 ± 9.1 | 82.2 ± 8.9 | 92.8 ± 5.9 | 0.02 |
| Total fat mass (kg) | 40.7 ± 11.1 | 35.8 ± 3.0 | 44.2 ± 4.1 | 0.02 |
| WC (cm) | 110.8 ± 3.0 | 104.5 ± 4.1 | 115.8 ± 3.1 | 0.02 |
| SBP (mmHg) | 132.7 ± 7.1 | 125.6 ± 4.2 | 137.7 ± 3.9 | 0.01 |
| DBP (mmHg) | 83.1 ± 3.2 | 80.0 ± 4.1 | 85.3 ± 3.2 | 0.02 |
| Fasting glucose (mg/dL) | 106.2 ± 6.2 | 96.9 ± 8.0 | 113.5 ± 5.0 | 0.01 |
| Total cholesterol (mg/dL) | 217.4 ± 11.8 | 217.8 ± 9.2 | 218.8 ± 8.2 | 0.29 |
| LDL cholesterol (mg/dL) | 135.6 ± 22.9 | 132.8 ± 6.1 | 138.7 ± 5.9 | 0.23 |
| HDL cholesterol (mg/dL) | 58.3 ± 2.1 | 59.3 ± 2.1 | 56.0 ± 1.1 | 0.04 |
| Triglycerides (mg/dL) | 121.7 ± 9.2 | 105.1 ± 8.1 | 133.9 ± 6.9 | 0.02 |
| Insulin (mUI/L) | 12.3 ± 1.3 | 10.2 ± 1.9 | 14.5 ± 0.4 | 0.02 |
| HOMA-IR | 3.3 ± 0.9 | 2.3 ± 0.5 | 4.1 ± 0.2 | 0.03 |
| CRP (mg/dL) | 5.4 ± 0.6 | 5.2 ± 0.9 | 5.9 ± 1.1 | 0.22 |
| Resistin (ng/mL) | 4.9 ± 0.2 | 4.5 ± 0.4 | 5.0 ± 0.9 | 0.38 |
| Adiponectin (ng/mL) | 24.7 ± 3.4 | 32.9 ± 3.8 | 19.8 ± 1.1 | 0.01 |
| Leptin (ng/mL) | 70.4 ± 7.1 | 56.7 ± 2.3 | 78.1 ± 3.8 | 0.02 |
| BRI | 9.6 ± 2.3 | 8.4 ± 0.2 | 10.5 ± 0.3 | 0.01 |
| Parameters | Total Group n = 468 | No Metabolic Syndrome n = 198 | Metabolic Syndrome n = 270 | p |
|---|---|---|---|---|
| Percentage of MetS | 57.5% | 0% | 100% | 0.001 |
| Percentage of central obesity | 83.8% | 68.7% | 95.8% | 0.02 |
| Percentage of hypertriglyceridemia | 12.5% | 4.6% | 18.3% | 0.01 |
| Low HDL cholesterol | 16.6% | 7.5% | 23.3% | 0.02 |
| Percentage of hypertension | 59.5% | 26.3% | 82.5% | 0.001 |
| Percentage of hyperglycemia | 30.6% | 3.6% | 50.2% | 0.001 |
| Parameters | Total Group n = 468 | No Metabolic Syndrome n = 198 | Metabolic Syndrome n = 270 | Total Group n = 468 | No Metabolic Syndrome n = 198 | Metabolic Syndrome n = 270 |
|---|---|---|---|---|---|---|
| BRI | HOMA-IR | |||||
| Glucose (mg/dL) | r = 0.28, p = 0.01 | r = 0.13, p = 0.12 | r = 0.36, p = 0.01 | r = 0.50, p = 0.001 | r = 0.48, p = 0.001 | r = 0.54, p = 0.001 |
| CRP (mg/dL) | r = 0.21, p = 0.01 | r = 0.14, p = 0.01 | r = 0.23, p = 0.001 | r = 0.12, p = 0.01 | r = 0.11, p = 0.02 | r = 0.15 p = 0.03 |
| HDL cholesterol (mg/dL) | r = −0.17, p = 0.01 | r = −0.09, p = 0.12 | r = −0.26, p = 0.01 | r = −0.17, p = 0.01 | r = −0.13, p = 0.02 | r = −0.17, p = 0.001 |
| Triglycerides (mg/dL) | r = 0.20, p = 0.01 | r = 0.18, p = 0.01 | r = 0.33, p = 0.001 | r = 0.29, p = 0.01 | r = 0.20, p = 0.02 | r = 0.31, p = 0.01 |
| Insulin (UI/L) | r = 0.35, p = 0.002 | r = 0.25, p = 0.002 | r = 0.38, p = 0.001 | r = 0.95, p = 0.001 | r = 0.94, p = 0.001 | r = 0.98, p = 0.001 |
| HOMA-IR | r = 0.37, p = 0.001 | r = 0.29, p = 0.001 | r = 0.48, p = 0.001 | - | - | - |
| Body weight (kg) | r = 0.67, p = 0.001 | r = 0.39, p = 0.02 | r = 0.70, p = 0.001 | r = 0.36, p = 0.01 | r = 0.25, p = 0.01 | r = 0.46, p = 0.001 |
| Total fat mass (kg) | r = 0.54, p = 0.002 | r = 0.20, p = 0.03 | r = 0.66, p = 0.001 | r = 0.34, p = 0.01 | r = 0.26, p = 0.01 | r = 0.35, p = 0.001 |
| Waist circumference (cm) | r = 0.94, p = 0.001 | r = 0.93, p = 0.001 | r = 0.94, p = 0.001 | r = 0.38, p = 0.01 | r = 0.30, p = 0.02 | r = 0.39, p = 0.001 |
| Cut-Off Point | Positive Likelihood Ratio | Negative Likelihood Ratio | Sensitivity | Specificity | |
|---|---|---|---|---|---|
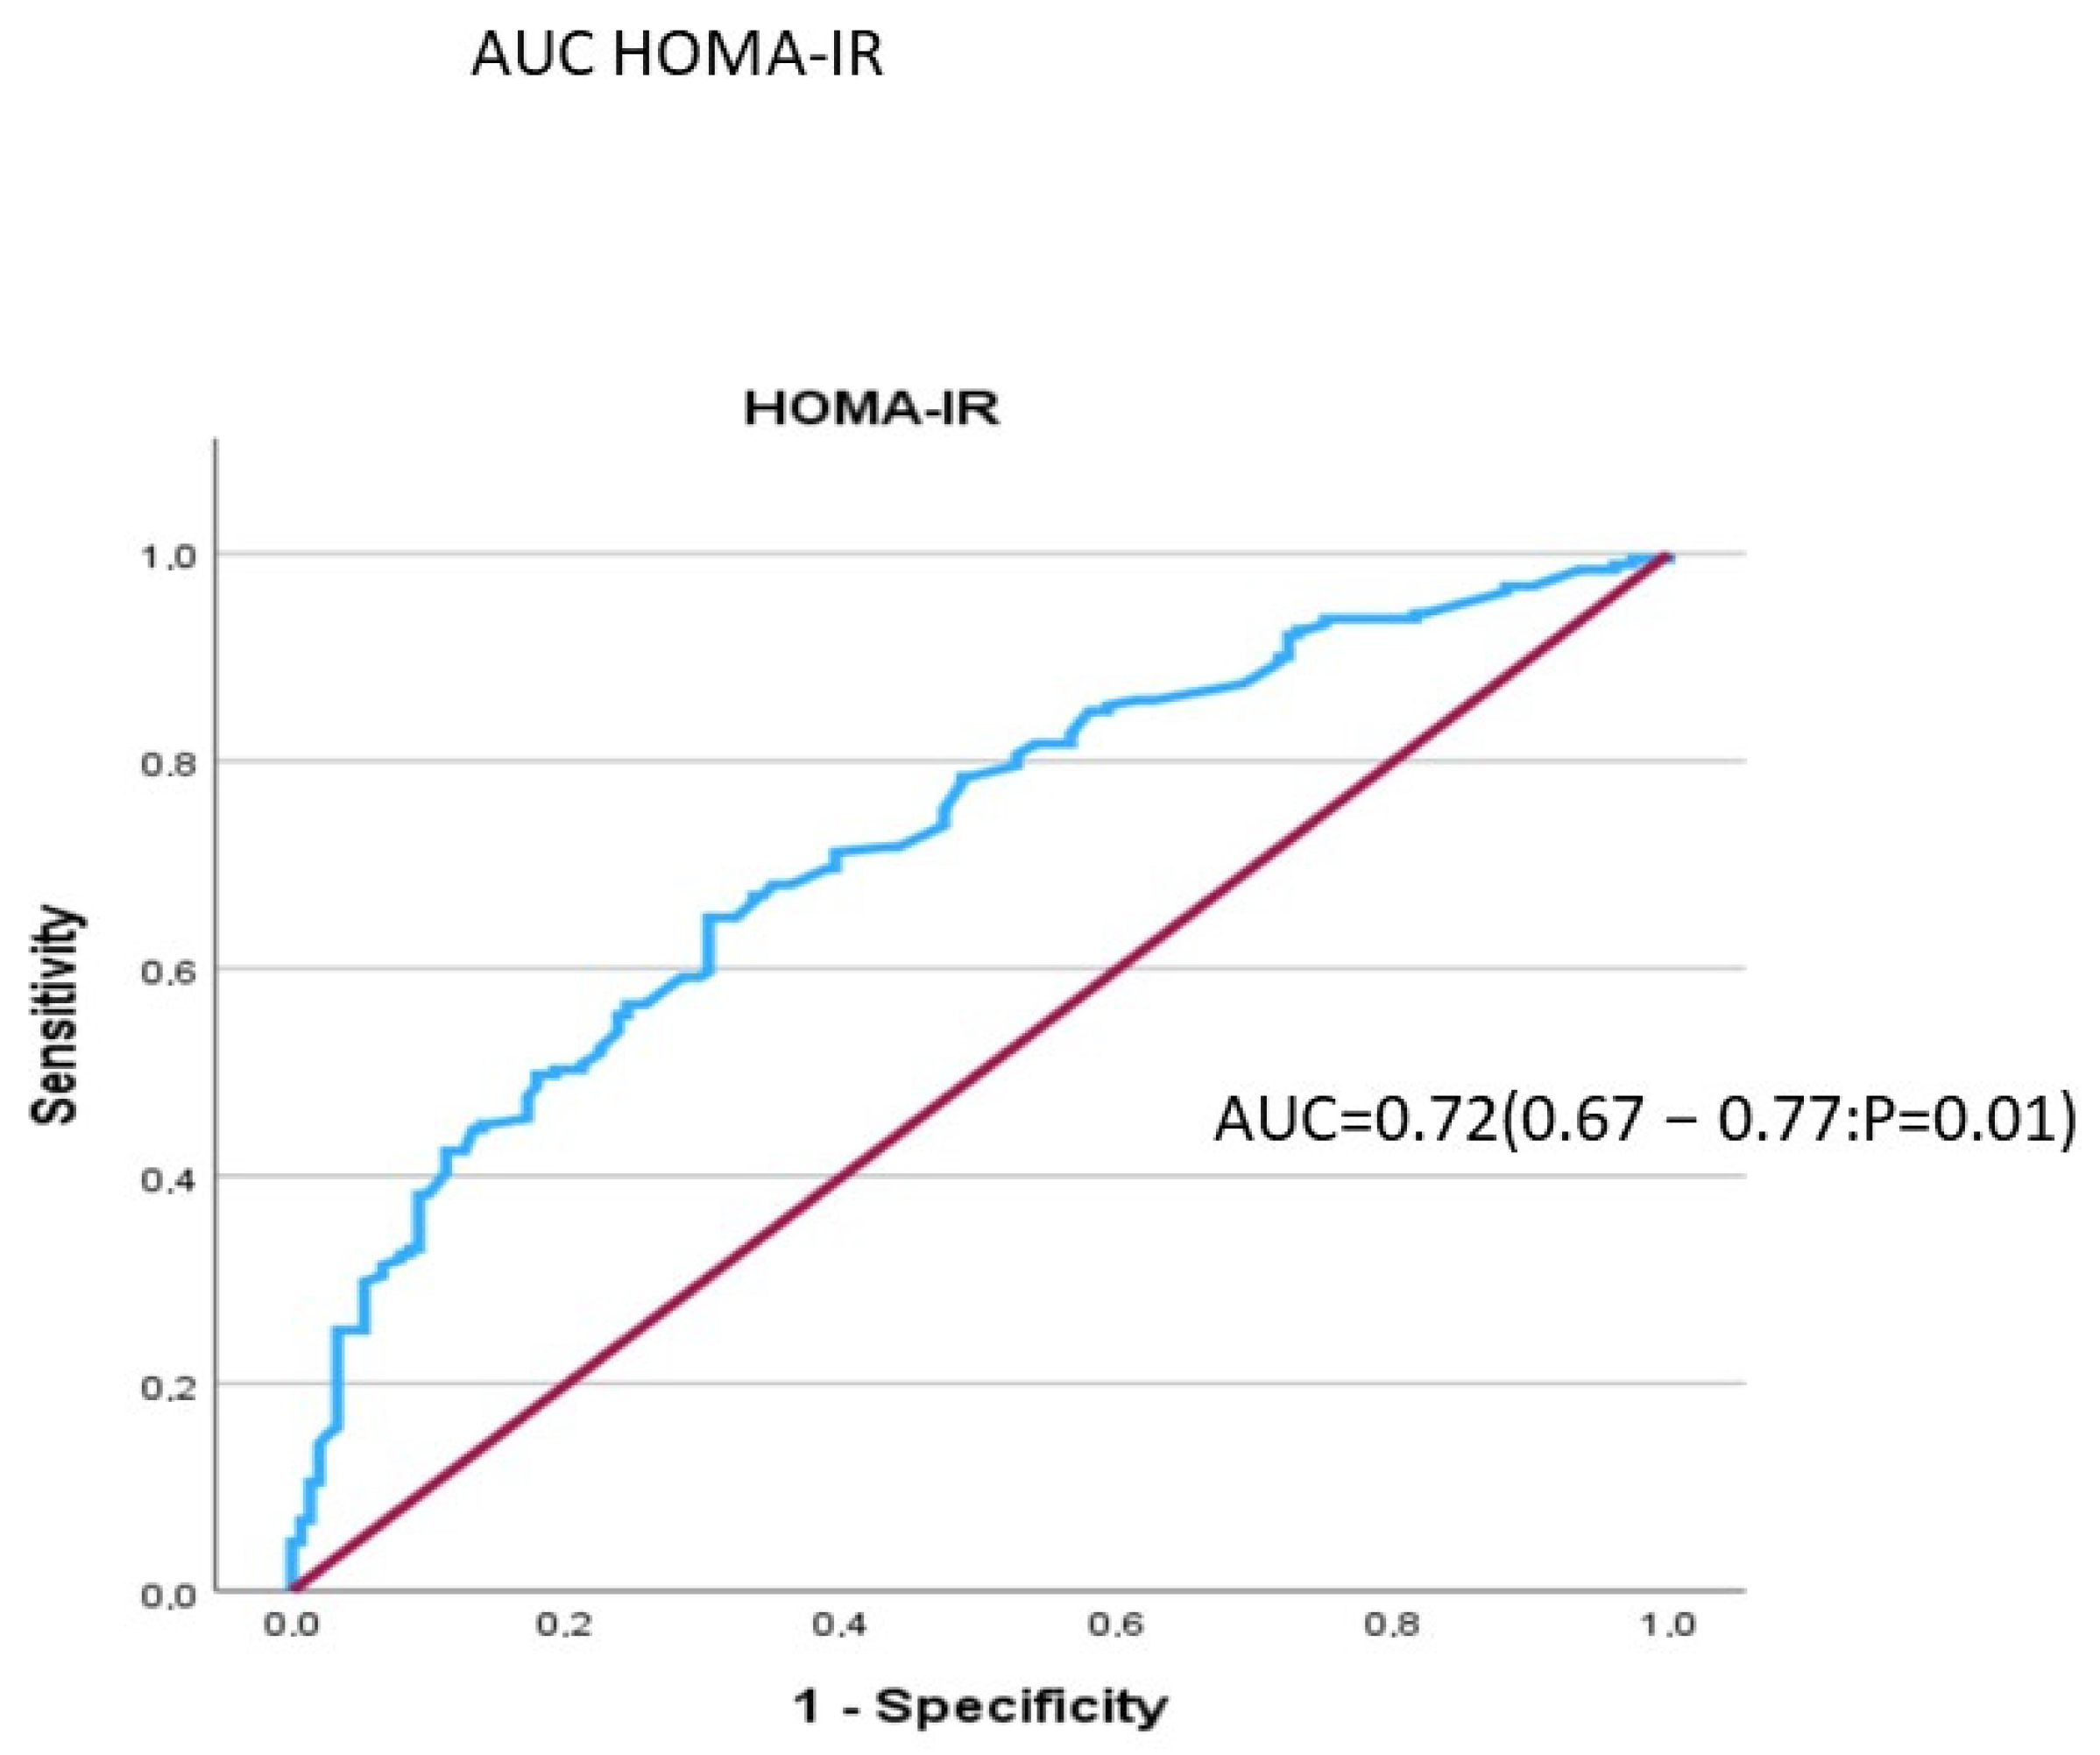
| HOMA-IR | 2.64 | 2.15 | 0.50 | 64.9% | 69.7% |
| BRI | 8.15 | 1.80 | 0.28 | 85.6% | 72.5% |
Disclaimer/Publisher’s Note: The statements, opinions and data contained in all publications are solely those of the individual author(s) and contributor(s) and not of MDPI and/or the editor(s). MDPI and/or the editor(s) disclaim responsibility for any injury to people or property resulting from any ideas, methods, instructions or products referred to in the content. |
© 2025 by the authors. Licensee MDPI, Basel, Switzerland. This article is an open access article distributed under the terms and conditions of the Creative Commons Attribution (CC BY) license (https://creativecommons.org/licenses/by/4.0/).
Share and Cite
de Luis, D.; Muñoz, M.; Izaola, O.; Lopez Gomez, J.J.; Rico, D.; Primo, D. Body Roundness Index (BRI) Predicts Metabolic Syndrome in Postmenopausal Women with Obesity Better than Insulin Resistance. Diabetology 2025, 6, 60. https://doi.org/10.3390/diabetology6070060
de Luis D, Muñoz M, Izaola O, Lopez Gomez JJ, Rico D, Primo D. Body Roundness Index (BRI) Predicts Metabolic Syndrome in Postmenopausal Women with Obesity Better than Insulin Resistance. Diabetology. 2025; 6(7):60. https://doi.org/10.3390/diabetology6070060
Chicago/Turabian Stylede Luis, Daniel, Marife Muñoz, Olatz Izaola, Juan José Lopez Gomez, Daniel Rico, and David Primo. 2025. "Body Roundness Index (BRI) Predicts Metabolic Syndrome in Postmenopausal Women with Obesity Better than Insulin Resistance" Diabetology 6, no. 7: 60. https://doi.org/10.3390/diabetology6070060
APA Stylede Luis, D., Muñoz, M., Izaola, O., Lopez Gomez, J. J., Rico, D., & Primo, D. (2025). Body Roundness Index (BRI) Predicts Metabolic Syndrome in Postmenopausal Women with Obesity Better than Insulin Resistance. Diabetology, 6(7), 60. https://doi.org/10.3390/diabetology6070060