Article

Performance of the Triglyceride-Glucose (TyG) Index for Early Detection of Insulin Resistance in Young Adults: Comparison with HOMA-IR and QUICKI in Western Mexico

by
Africa Samantha Reynoso-Roa
1,
Susan Andrea Gutiérrez-Rubio
2,3,
Araceli Castillo-Romero
4,
Trinidad García-Iglesias
2,5,
Daniel Osmar Suárez-Rico
2,3,
Karen Marcela Becerra-Orduñez
6,
Cynthia Areli Temblador-Dominguez
7 and
Teresa Arcelia García-Cobián
2,3,*
1
Doctorado en Farmacología, Centro Universitario de Ciencias de la Salud, Universidad de Guadalajara, Guadalajara 44340, Mexico
2
Departamento de Fisiología, Centro Universitario de Ciencias de la Salud, Universidad de Guadalajara, Calle Sierra Mojada 950, Independencia Oriente, Guadalajara 44340, Mexico
3
Instituto de Terapéutica Experimental y Clínica (INTEC), Centro Universitario de Ciencias de la Salud, Universidad de Guadalajara, Guadalajara 44340, Mexico
4
Departamento de Microbiología y Patología, Centro Universitario de Ciencias de la Salud, Universidad de Guadalajara, Calle Sierra Mojada 950, Independencia Oriente, Guadalajara 44340, Mexico
5
Instituto de Investigación de Cáncer de la Infancia y Adolescencia, Centro Universitario de Ciencias de la Salud, Universidad de Guadalajara, Calle Sierra Mojada 950, Independencia Oriente, Guadalajara 44340, Mexico
6
Licenciatura en Biología, Centro Universitario de Ciencias Biologicas y Agropecuarias, Universidad de Guadalajara, Ramón Padilla Sánchez 2100, Las Agujas, Zapopan 44600, Mexico
7
Licenciatura en Médico Cirujano y Partero, Centro Universitario de Ciencias de la Salud (CUCS), Universidad de Guadalajara, Guadalajara 44340, Mexico
*
Author to whom correspondence should be addressed.
Diabetology 2025, 6(11), 141; https://doi.org/10.3390/diabetology6110141 (registering DOI)
Submission received: 22 September 2025 / Revised: 17 October 2025 / Accepted: 4 November 2025 / Published: 12 November 2025

Abstract

Background/Objectives: Insulin resistance is a major public health issue in Mexico, closely linked to obesity, prediabetes, and type 2 diabetes. The euglycemic–hyperinsulinemic clamp is the diagnostic gold standard but is impractical for routine use. The triglyceride–glucose (TyG) index has been proposed as a simple alternative validated in diverse populations. We aimed to assess the utility of TyG relative to HOMA-IR and QUICKI as an early diagnostic tool in young Mexican adults. Methods: We performed an analytical cross-sectional study in young adults. Clinical, anthropometric, and fasting biochemical variables were collected to compute TyG. We compared TyG with HOMA-IR and QUICKI and evaluated diagnostic performance using receiver operating characteristic analysis to estimate area under the curve (AUC) and identify the optimal cut-off. Results: We analyzed 115 participants; 66.9% were insulin resistant by HOMA-IR, 79.1% by QUICKI, and 42.6% by TyG. TyG showed significant associations with anthropometric and biochemical measures. Diagnostic performance was good (AUC 0.707 vs. HOMA-IR; 0.960 vs. QUICKI). The optimal cut-off was 4.38, yielding sensitivity of 70.1% and specificity of 68.4% for diagnosing insulin resistance compared with HOMA-IR. Conclusions: The TyG index appears to be a useful, accessible, and cost-effective biomarker for early detection of insulin resistance in young Mexican adults. Its implementation could facilitate earlier diagnosis and prevention of cardiometabolic complications. Longitudinal, multicenter studies are warranted to establish population-specific reference values and to confirm its predictive value for adverse outcomes.

Graphical Abstract

1. Introduction

In Mexico, insulin resistance (IR) is a growing public health problem, reflected in rising rates of obesity, prediabetes, and type 2 diabetes (DT2). According to the 2022 National Health and Nutrition Survey (Ensanut), up to 22.1% of Mexican adults have prediabetes and 18.3% have diabetes, positioning these metabolic disorders among the leading causes of morbidity and mortality in the country. This translates into increased metabolic, cardiovascular, and renal complications, as well as high treatment costs for an already overburdened health system [1].
It is well established that IR represents the earliest pathophysiological alteration in the natural history of DT2; it precedes pancreatic failure and is considered a key window for preventing cardiovascular complications. Early identification of IR is therefore crucial to prevent progression to DT2 [2,3]. However, timely diagnosis is hampered by limited access to gold-standard tests such as the euglycemic–hyperinsulinemic clamp, a highly specialized, invasive, and costly procedure, contributing to underdiagnosis of IR in at-risk populations. In response, alternative indices using glucose and insulin values to indirectly assess insulin sensitivity—such as HOMA-IR, QUICKI, Matsuda, and ISSI-2—have been proposed; nevertheless, their clinical application is limited by the availability of insulin assays (which are costly for use as a screening method) and by variability in reference values by age, sex, and race, necessitating population-specific cut-offs [4,5]. In this context, the triglyceride–glucose (TyG) index has emerged as a reproducible population-level screening tool for IR that does not require insulin measurement and has shown good predictive value for metabolic syndrome, DT2, and cardiovascular complications across population studies and systematic reviews [6,7].
In Latin America and Mexico—where epidemiological transition has increased abdominal obesity, sedentary behavior, and cardiometabolic risk—the TyG index could facilitate timely identification of IR, risk stratification, and targeted prevention and treatment in selected cases [8,9]. Thus, examining TyG performance in young Mexican adults not only adds to the international evidence base but also paves the way for more affordable and feasible preventive strategies in Mexico.
Therefore, this study aimed to evaluate the utility of the triglyceride–glucose (TyG) index, relative to HOMA-IR and QUICKI, as an early diagnostic tool for insulin resistance in Mexican adults aged 18–39 years.

2. Materials and Methods

2.1. Population

An analytical cross-sectional study was conducted that included young adult Mexican subjects selected by non-probabilistic convenience sampling and recruited through free community health campaigns in various areas of Guadalajara and surrounding municipalities in the state of Jalisco, Mexico. Inclusion criteria were patients aged 18 to 39 years, male or female, apparently healthy, without known rheumatic or metabolic diseases (diabetes, hypertension, thyroid disease, polycystic ovary syndrome), and not receiving any pharmacological treatment, including dietary supplements and multivitamins. All participants signed informed consent prior to any procedure.

2.2. Clinical and Anthropometric Determinations

Each subject underwent a brief clinical interview to collect age, sex, personal pathological history, and current pharmacological treatments. Anthropometry was performed with a measuring tape; waist circumference (CC) was measured at the midpoint between the lower edge of the last rib and the iliac crest at the end of a normal expiration and expressed in centimeters. Height was measured with a stadiometer with the patient barefoot. Weight and body composition measures (body fat percentage, muscle percentage, and visceral fat amount) were obtained with a TANITA BC-568 INNERSCAN scale (TANITA Corporation; Tokio, Japan). Body mass index (IMC) was calculated using the Quetelet formula: IMC = weight (kg)/height (m2). For biochemical variables, 10 mL of venous blood was drawn from each participant by venipuncture after an 8–12 h fast. Each sample was centrifuged at 4000 rpm; serum was collected and stored at −20 °C until analysis. Serum chemistry tests included glucose, lipoproteins (total cholesterol, triglycerides, HDL, LDL, VLDL), creatinine, and liver enzymes (AST, ALT), using Byosistems reagents and an Erba Mannheim XL-180 clinical chemistry analyzer (Erba Diagnostics Mannheim GmbH; Mannheim, Germany); results were expressed in mg/dL. Serum insulin concentrations were obtained using a sandwich ELISA immunoassay with the commercial kit from DRG® International Inc. (Springfield, NJ, USA) (EIA-2935). Indices were calculated with the following formulas:
TyG index: ln[(Triglycerides (mg/dL) × Fasting glucose (mg/dL))/2]
HOMA-IR = (Fasting glucose (mg/dL) × Fasting insulin (μU/mL))/405
QUICKI = 1/[log(Fasting insulin (μU/mL)) + log(Fasting glucose (mg/dL))].
The formula used to calculate the TyG index in this study was applied exactly as described in the original definition proposed by Simental et al. (2008) [10]. Subjects were defined as positive for a diagnosis of insulin resistance if they had QUICKI < 0.33, HOMA-IR ≥ 2.6, and TyG index ≥ 4.68, according to the international literature [6].

2.3. Statistical Analysis

Data was collected in an Excel database and analyzed with IBM SPSS Statistics 25. Quantitative variables (age, height, weight, IMC, body fat percentage, muscle percentage, visceral fat amount, waist circumference, hip circumference, glucose, lipoproteins, HOMA-IR, TyG index) were expressed as means and standard deviations, medians, and ranges, while qualitative variables (sex, IMC classification, diagnosis of insulin resistance) were expressed as frequencies and percentages. Nonparametric distribution of quantitative variables was determined using the Kolmogorov-Smirnov test with Lilliefors correction. To assess associations between categorical variables such as the presence or absence of insulin resistance according to different diagnostic indices, Pearson’s chi-square tests were used, with Yates continuity correction in 2 × 2 tables and Fisher’s exact test when appropriate. Phi and Cramer’s V coefficients were also calculated to estimate the strength of association between qualitative variables. Correlations between IR indices (HOMA-IR, TyG, and QUICKI) and anthropometric and biochemical variables were analyzed using the Spearman coefficient. In addition, ROC (Receiver Operating Characteristic) curve analysis was performed to determine the diagnostic ability of the TyG index to detect IR, defined by a previously validated HOMA-IR value ≥ 2.6 in the Mexican population. The area under the curve (AUC), sensitivity, and specificity were calculated, and the optimal cut-off point was identified using Youden’s index. Based on this cut-off, 2 × 2 contingency tables were constructed to estimate the positive (PPV) and negative (NPV) predictive values of the TyG index. A p value < 0.05 was considered statistically significant for all analyses.

2.4. Ethical Considerations

This study was reviewed and approved by the Ethics and Research Committee of the Centro Universitario de Ciencias de la Salud of the Universidad de Guadalajara under registration number CI-04521 and was conducted in accordance with national and international principles governing ethical research in humans, including the Declaration of Helsinki and the Mexican Official Standard NOM-012-SSA3-2012 [11]. Participants’ personal information was handled with strict confidentiality as established by Article 17 of the Regulations of the General Health Law on Health Research, assigning a unique identification code to each participant. As a minimal-risk study, each subject was informed about the risks and benefits of participation, the anonymous and respectful handling of sensitive information, and was asked to sign the informed consent form prior to the start of the study.

3. Results

3.1. Descriptive Analysis

A total of 115 participants were included, with a mean age of 21.13 ± 4.58 years; 32.2% were men and 67.8% were women. Demographic and anthropometric characteristics are summarized in Table 1. Mean height was 1.64 ± 0.8 m and mean weight was 69.13 ± 18.25 kg, yielding a mean BMI of 25.38 ± 5.92, with a distribution of 6.1% with normal weight, 53.9% with normal BMI, 21.7% overweight, and the remaining 18.3% with some degree of obesity. The mean waist-to-hip ratio was 0.82 ± 0.09; mean body fat percentage was 29.98 ± 27.90, while mean muscle mass percentage was 46.65 ± 10.91 and visceral fat was 3.70 ± 3.23.
The results of clinical chemistry and ELISA assays are summarized in Table 2. Mean fasting glucose was 88.43 ± 18.79 mg/dL, and mean insulin was 21.97 ± 20.88 µU/mL. In the lipoprotein profile, mean total cholesterol was 169.77 ± 54.15 mg/dL and triglycerides 97.49 ± 50.68 mg/dL. Insulin resistance (IR) indices were then calculated: mean HOMA-IR was 5.09 ± 6.91, with 66.96% meeting criteria for IR; mean QUICKI was 0.31 ± 0.03, with 79.13% classified as IR; and mean TyG index was 4.46 ± 0.26, yielding an IR proportion of 21.7% of participants (Figure 1).

3.2. Correlation Analysis

The TyG index showed significant correlations with weight (ρ = 0.375, p < 0.001), body mass index (BMI) (ρ = 0.363, p < 0.001), total cholesterol (ρ = 0.525, p < 0.001), waist circumference (ρ = 0.473, p < 0.001), hip circumference (ρ = 0.341, p = 0.002), body fat percentage (ρ = 0.194, p = 0.042), muscle mass percentage (ρ = 0.317, p = 0.001), and visceral fat (ρ = 0.337, p < 0.001). Positive but non-significant correlations were also observed with age (ρ = 0.118, p = 0.209) and height (ρ = 0.148, p = 0.115).
By contrast, the QUICKI index showed negative, statistically significant correlations with weight (ρ = −0.292, p = 0.002), BMI (ρ = −0.305, p = 0.001), total cholesterol (ρ = −0.307, p = 0.001), waist circumference (ρ = −0.231, p = 0.044), muscle mass percentage (ρ = −0.204, p = 0.033), and visceral fat (ρ = −0.282, p = 0.003). Non-significant negative correlations were seen with height (ρ = −0.070, p = 0.459), hip circumference (ρ = −0.220, p = 0.053), body fat percentage (ρ = −0.174, p = 0.069), and age (ρ = −0.018, p = 0.850).
For HOMA-IR, a positive and statistically significant correlation was found with weight (ρ = 0.292, p = 0.002), BMI (ρ = 0.305, p = 0.001), total cholesterol (ρ = 0.308, p = 0.001), waist circumference (ρ = 0.231, p = 0.044), hip circumference (ρ = 0.220, p = 0.053), muscle mass percentage (ρ = 0.204, p = 0.033), and visceral fat (ρ = 0.282, p = 0.003). Positive but non-significant correlations were also observed with age (ρ = 0.019, p = 0.843), height (ρ = 0.069, p = 0.462), and body fat percentage (ρ = 0.174, p = 0.069). Table 3 contains a summary of the correlation test results.
Regarding correlations between indices, TyG correlated negatively with QUICKI (ρ = −0.440; p < 0.01) and positively with HOMA-IR (ρ = 0.440; p < 0.01), while QUICKI showed a negative, significant correlation with HOMA-IR (ρ = −1.000; p < 0.01).

3.3. ROC Analysis

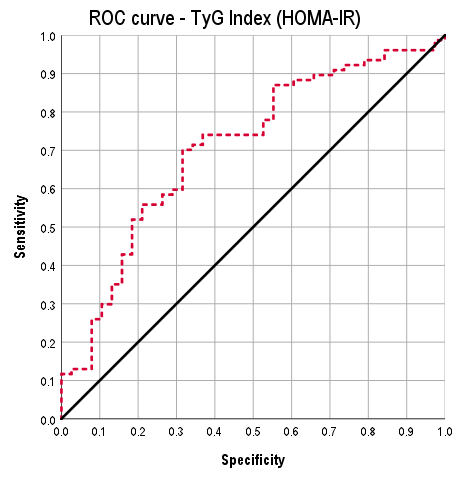
A receiver operating characteristic (ROC) curve analysis was performed to evaluate the diagnostic ability of the Triglyceride/Glucose (TyG) index to identify insulin resistance, using a diagnosis based on established HOMA-IR and QUICKI criteria as the reference. From the analysis of the curve coordinates, Youden’s index was calculated to identify the optimal cut-off point, defined as the value that maximizes the difference between the true-positive rate and the false-positive rate.
First, the ROC curve analysis for the TyG index using the binary classification of insulin resistance according to HOMA-IR showed an area under the curve (AUC) of 0.707, with a standard error of 0.052, an asymptotic significance of p = 0.000, and a 95% confidence interval for the AUC of 0.606 to 0.809. Based on the curve coordinates, an optimal TyG cut-off of 4.3811 was determined, yielding a sensitivity of 70.1%, a specificity of 68.4%, and a Youden’s index of 0.385 (Figure 2).
Regarding the ROC curve for the Triglyceride/Glucose (TyG) index, using the binary classification of insulin resistance determined by the QUICKI index as the reference, the area under the curve (AUC) was 0.960, with a standard error of 0.026 and an asymptotic significance of p = 0.000. The 95% confidence interval for the AUC ranged from 0.909 to 1.000, based on the analysis of the curve coordinates (Figure 3).
Furthermore, as shown in Figure 4, the scatterplot matrix illustrates the interrelationships among the TyG index, QUICKI, and HOMA-IR, providing additional insight into the consistency of these indicators for assessing insulin resistance. The fitted regression lines show that the TyG index is inversely associated with QUICKI (R2 = 0.218) and positively associated with HOMA-IR (R2 = 0.198), whereas QUICKI and HOMA-IR exhibit a strong negative association (R2 = 0.483).

3.4. Test Predictors

Finally, the diagnostic properties of the Triglyceride/Glucose (TyG) index were calculated using a cut-off of 4.38, relative to two reference methods for diagnosing insulin resistance: the QUICKI index and the HOMA-IR index. For QUICKI, of the 115 subjects evaluated, 91 were classified as insulin resistant (QUICKI < 0.33) and 24 as non-resistant, yielding a sensitivity of 67.0%, a specificity of 79.2%, a positive predictive value (PPV) of 92.4%, and a negative predictive value (NPV) of 38.8%. For HOMA-IR, sensitivity was 70.1%, specificity 68.4%, PPV 81.8%, and NPV 53.1% (Table 4).

4. Discussion

The findings of this study demonstrate the utility of the TyG index as a practical and accessible marker of insulin resistance in young Mexican adults. The results yielded a mean TyG index of 4.46, with a cut-off of 4.38 that showed moderate performance against reference indices; for HOMA-IR ≥ 2.6, sensitivity/specificity were 70.1%/68.4%, whereas for QUICKI < 0.33 they were 67.0%/79.2%, supporting its value as a screening tool in this age group. These results are consistent with the initial validation by Guerrero-Romero and colleagues [6] in a Mexican population, where TyG showed high sensitivity and specificity versus the euglycemic clamp and a strong negative correlation with M value (AUC = 0.858; sensitivity 96.5%/specificity 85% at a 4.68 cut-off; r = −0.681) [6].
Our findings reveal a higher prevalence and better diagnostic performance of the TyG index compared with that reported by Vega-Cárdenas and colleagues (2022) [12]. In that study of 1686 metabolically healthy adolescents aged 18 to 21 years, TyG and HOMA-IR were found to be useful parameters for assessing insulin resistance, which had a prevalence of 28.2% using TyG and 47% using HOMA-IR. A possible explanation for this discrepancy is that Vega’s study included mostly normal-weight subjects, whereas our sample comprised young individuals with normal weight, overweight, and obesity, conditions that contribute to metabolic alteration and favor the detection of insulin resistance. Although both studies agree that the TyG index is a practical, accessible, and clinically useful instrument, our results demonstrate the indicator’s ability to distinguish populations at higher cardiometabolic risk.
In an international context, the results align with other large multicenter analyses, such as the PURE study, which analyzed more than 140,000 participants from 22 countries and showed that higher TyG values are associated with greater incidence of myocardial infarction, stroke, and type 2 diabetes; moreover, effects were more pronounced in low- and middle-income countries such as Mexico [13]. The Iranian Tehran Lipid and Glucose Study, with over 10 years of follow-up, showed that both higher TyG levels and greater variability across assessments are associated with increased risk of diabetes, hypertension, and death. These findings suggest that TyG may be a dynamic indicator of cardiometabolic risk rather than merely a static diagnostic marker [14].
In Argentina, Unger and colleagues determined that the TyG index can adequately discriminate metabolic syndrome with cut-off points of 8.8 and a performance comparable to other indices such as the triglyceride/HDL ratio [15]. Meanwhile, in Sri Lanka, TyG achieved areas under the curve > 0.89 for predicting metabolic syndrome, demonstrating applicability across diverse ethnic contexts [16].
A methodological review of the current literature uncovers a significant inconsistency that could affect the interpretation and comparison of results across studies. The TyG index formula, ln[TG × glucose/2], has been utilized by various international cohorts, yielding average values between 8.5 and 8.8 (e.g., ELSA-Brasil: men 8.81 ± 0.52, women 8.53 ± 0.48; NHANES: hispanic 8.6 ± 0.03) [17,18,19]; in contrast, studies conducted in Mexican populations—this study included—has indicated values ranging from 4 to 5 [15,16]. The difference in results is mostly due to the scale used to apply the formula; both versions are mathematically equivalent and give results that are different in size but not in meaning. Consequently, mean values and cutoff points must not be directly compared without prior standardization of the scale.
To confirm this equivalence prior to the statistical analysis, the TyG index was calculated using both versions of the formula, revealing a perfect correlation between them (r = 1.000, p < 0.001). Accordingly, all analyses were conducted with the original formula proposed by Simental et al. [10] who validated the index against the euglycemic–hyperinsulinemic clamp and reported an AUC of 0.858 with 96.5% sensitivity and 85% specificity at a cut-off of 4.68 in apparently healthy adults. In the present study, we observed a higher AUC using QUICKI as the reference (AUC = 0.960) and adequate discrimination against HOMA-IR (AUC = 0.786), with a TyG cut-off of 4.38 and sensitivities/specificities of 67.0%/79.2% and 70.1%/68.4%, respectively. These differences in diagnostic performance may reflect characteristics of the evaluated population, as our sample comprised young Mexican adults—a group in which early detection of insulin resistance is particularly relevant given the rising burden of metabolic disorders in later life.
Alizargar [20] concluded, after a critical review of the literature, that the correct formula for calculating the TyG index is the one proposed by Simental [10] and that alternative versions and discrepancies in reference values are due to citation errors rather than methodological differences. Guerrero-Romero [6] further supported this position, showing a strong inverse correlation between the TyG index and insulin sensitivity measured by the reference technique (r = −0.681, p < 0.001), thereby reinforcing the validity of this formula in the Mexican population. Consequently, the values reported here are situated within a validated, empirically supported methodology, facilitating comparison with results obtained using alternative formula versions and with other national studies employing the same approach.
Comparing TyG performance with other insulin resistance indices, it tends to be more effective than HOMA-IR for predicting metabolic syndrome, according to multiple studies. In NHANES, the AUC was 0.87 for TyG and 0.82 for HOMA-IR, with a moderate correlation between them (r = 0.53) [18,19]; in ELSA-Brasil, AUCs for TyG were 0.836/0.826 (m/f) and 0.775/0.787 for HOMA-IR, with an approximate r of 0.40 and low agreement (κ ≈ 0.306–0.307) [17]. These findings suggest that the different indices capture distinct dimensions of the same metabolic phenomenon: HOMA-IR mainly reflects hepatic insulin resistance, QUICKI assesses insulin sensitivity, and TyG captures the lipid dimension of insulin resistance, integrating triglycerides as a marker of dyslipidemia and cardiovascular risk [21]. In addition, studies in Mexican populations have shown a strong correlation between TyG and the reference technique (euglycemic–hyperinsulinemic clamp), validating it as a reliable marker and potentially superior predictor of metabolic syndrome and cardiometabolic outcomes [6,22].
In this sense, while indices such as HOMA-IR remain useful in a complementary way, recent evidence positions TyG as a robust, practical marker with better diagnostic performance across diverse clinical scenarios, supporting its incorporation into routine practice for metabolic risk assessment.
Taken together, these data support TyG as suitable for early detection of metabolic abnormalities in young adults and as a longitudinal indicator of population-level cardiometabolic risk. In populations undergoing epidemiological transition, as in many Latin American countries, this dual utility is even more relevant, enabling the design of prevention policies and large-scale screening programs. However, local cut-off values must be established, and the formula and its computation standardized so that results can be compared across similar studies.
Although the sample size was sufficient for statistical analysis, the cross-sectional design does not allow causal inference between the TyG index and insulin resistance—only association can be discussed. Therefore, the reported positive and negative predictive values should be interpreted within the cross-sectional context of this study and not as predictors of future incidence. Also, the population was limited to young adults from a specific context, which prevents extrapolating the results to other ages or regions of the country. Another limitation is the absence of a reference method, such as the euglycemic–hyperinsulinemic clamp, which would have more rigorously validated the diagnostic utility of TyG against the gold standard. Finally, other unevaluated factors—such as diet, physical activity, and family history of metabolic disease—may have influenced the results and should be considered in future longitudinal, multicenter studies.

5. Conclusions

The results of our study show that the TyG index is a practical and accessible biomarker with good diagnostic performance compared with the insulin-dependent indices HOMA-IR and QUICKI in young Mexican adults. We also observed significant correlations with metabolic and anthropometric variables, as well as appropriate sensitivity and specificity at a cut-off of 4.38. These findings support its utility as an early tool to detect insulin resistance and to stratify cardiometabolic risk in this population, emphasizing the need for multicenter, longitudinal studies to establish context-specific reference values for Mexico. However, given the cross-sectional nature of the study and the absence of a gold-standard validation method, the clinical value of the TyG index cannot yet be fully determined and should be interpreted with caution until confirmed by longitudinal evidence.

Author Contributions

Conceptualization, A.S.R.-R. and T.A.G.-C.; methodology, S.A.G.-R., A.C.-R., T.A.G.-C. and A.S.R.-R.; software, D.O.S.-R.; validation, T.G.-I., S.A.G.-R., A.C.-R. and T.A.G.-C.; formal analysis, A.S.R.-R. and S.A.G.-R.; investigation, K.M.B.-O. and C.A.T.-D.; resources, T.A.G.-C. and S.A.G.-R.; data curation, K.M.B.-O. and C.A.T.-D.; writing—original draft preparation, A.S.R.-R., D.O.S.-R. and T.A.G.-C.; writing—review and editing, A.S.R.-R., T.A.G.-C. and D.O.S.-R.; project administration, T.A.G.-C.; funding acquisition, T.A.G.-C. and S.A.G.-R. All authors have read and agreed to the published version of the manuscript.

Funding

This research was funded by the Fondos para Proyectos de Impulso a la Investigación (PIN 2023-IV) Funder: University Center for Health Sciences, University of Guadalajara, Mexico.

Institutional Review Board Statement

The study was approved by the Ethics and Research Committee of the University Center for Health Sciences, University of Guadalajara, under registration number CI-04521 (12 May 2022). It was conducted in accordance with national and international principles governing ethical research in human subjects, including the Declaration of Helsinki and the Mexican Official Standard NOM-012-SSA3-201.

Informed Consent Statement

Informed consent was obtained from all subjects involved in the study.

Data Availability Statement

The data supporting the findings of this study are not publicly available due to ethical and participant confidentiality restrictions. However, anonymized versions of the data may be obtained from the corresponding authors upon reasonable request and with approval from the ethics committee.

Acknowledgments

The authors wish to express their gratitude to the University of Guadalajara and the Secretariat of Science, Humanities, Technology and Innovation (SECIHTI) for providing scholarship support.

Conflicts of Interest

The authors declare no conflicts of interest.

Abbreviations

The following abbreviations are used in this manuscript:
ALTAlanine aminotransferase
ASTAspartate aminotransferase
AUCArea under the curve
BMIBody mass index
CIConfidence interval
ELISAEnzyme-linked immunosorbent assay
HDLHigh-density lipoprotein
HOMA-IRHomeostatic model assessment of insulin resistance
IRInsulin resistance
LDLLow-density lipoprotein
NPVNegative predictive value
PPVPositive predictive value
QUICKIQuantitative insulin sensitivity check index
ROCReceiver operating characteristic
SDStandard deviation
SEStandard error
TyGTriglyceride–glucose index
VLDLVery-low density lipoprotein

References

  1. Basto-Abreu, A.; López-Olmedo, N.; Rojas-Martínez, R.; Aguilar-Salinas, C.A.; Moreno-Banda, G.L.; Carnalla, M.; Barrientos-Gutiérrez, T.; De la Cruz-Góngora, V.; Durán-Acevedo, M.E.; Hernández-Ávila, M.; et al. Prevalence of prediabetes and diabetes in Mexico: ENSANUT 2022. Salud Publica Mex. 2023, 65 (Suppl. S1), s163–s168. [Google Scholar] [CrossRef]
  2. James, D.E.; Stöckli, J.; Birnbaum, M.J. The aetiology and molecular landscape of insulin resistance. Nat. Rev. Mol. Cell Biol. 2021, 22, 751–771. [Google Scholar] [CrossRef]
  3. Khalid, M.; Alkaabi, J.; Khan, M.A.B.; Adem, A. Insulin Signal Transduction Perturbations in Insulin Resistance. Int. J. Mol. Sci. 2021, 22, 8590. [Google Scholar] [CrossRef]
  4. Placzkowska, S.; Pawlik-Sobecka, L.; Kokot, I.; Piwowar, A. Indirect insulin resistance detection: Current clinical trends and laboratory limitations. Biomed. Pap. 2019, 163, 187–199. [Google Scholar] [CrossRef] [PubMed]
  5. Tahapary, D.L.; Pratisthita, L.B.; Fitri, N.A.; Marcella, C.; Wafa, S.; Kurniawan, F.; Rizka, A.; Tarigan, T.J.E.; Harbuwono, D.S.; Purnamasari, D.; et al. Challenges in the diagnosis of insulin resistance: Focusing on the role of HOMA-IR and triglyceride/glucose index. Diabetes Metab. Syndr. Clin. Res. Rev. 2022, 16, 102581. [Google Scholar] [CrossRef] [PubMed]
  6. Guerrero-Romero, F.; Simental-Mendía, L.E.; González-Ortiz, M.; Martínez-Abundis, E.; Ramos-Zavala, M.G.; Hernández-González, S.O.; Jacques-Camarena, O.; Rodríguez-Morán, M.; Villalobos-Molina, R.; Méndez-Cruz, R.; et al. The product of triglycerides and glucose, a simple measure of insulin sensitivity: Comparison with the euglycemic-hyperinsulinemic clamp. J. Clin. Endocrinol. Metab. 2010, 95, 3347–3351. [Google Scholar] [CrossRef]
  7. Sodero, G.; Rigante, D.; Pane, L.C.; Sessa, L.; Quarta, L.; Candelli, M.; Cipolla, C.; Zanza, C.; Pignataro, G.; Franceschi, F.; et al. Cardiometabolic risk assessment in a cohort of children and adolescents diagnosed with hyperinsulinemia. Diseases 2024, 12, 119. [Google Scholar] [CrossRef]
  8. Felipe Pollak, C. Resistencia a la insulina: Verdades y controversias. Rev. Médica Clínica Las Condes 2016, 27, 171–178. [Google Scholar] [CrossRef]
  9. Santos Lozano, E. Resistencia a Insulina: Revisión de literatura. Rev. Med. Hondur. 2022, 90, 63–70. [Google Scholar] [CrossRef]
  10. Simental-Mendía, L.E.; Rodríguez-Morán, M.; Guerrero-Romero, F. The product of fasting glucose and triglycerides as surrogate for identifying insulin resistance in apparently healthy subjects. Metab. Syndr. Relat. Disord. 2008, 6, 299–304. [Google Scholar] [CrossRef]
  11. NOM-012-SSA3-2012; Mexican Official Standard for the Ethical Conduct of Health Research Involving Human Subjects. Secretaría de Salud: Mexico City, Mexico, 2012.
  12. Vega-Cárdenas, M.; Flores-Sánchez, J.; Torres-Rodríguez, M.L.; Sánchez-Armáss, O.; Vargas-Morales, J.M.; Cossío-Torres, P.E.; Terán-García, M.; Aradillas-García, C.; UP-AMIGOS Team. Distribution of triglycerides and glucose (TyG) index and homeostasis model assessment insulin resistance for the evaluation of insulin sensitivity on late adolescence in Mexicans. Nutr. Hosp. 2022, 39, 1349–1356. [Google Scholar] [CrossRef] [PubMed]
  13. Lopez-Jaramillo, P.; Gomez-Arbelaez, D.; Martinez-Bello, D.; Abat, M.E.M.; Alhabib, K.F.; Avezum, Á.; Barbarash, O.; Chifamba, J.; Diaz, M.L.; Gulec, S.; et al. Association of the triglyceride-glucose index as a measure of insulin resistance with mortality and cardiovascular disease in populations from five continents (PURE study): A prospective cohort study. Lancet Healthy Longev. 2023, 4, e23–e33. [Google Scholar] [CrossRef]
  14. Molavizadeh, D.; Cheraghloo, N.; Tohidi, M.; Azizi, F.; Hadaegh, F. The association between index-year, average, and variability of the triglyceride-glucose index with health outcomes: More than a decade of follow-up in the Tehran Lipid and Glucose Study. Cardiovasc. Diabetol. 2024, 23, 321. [Google Scholar] [CrossRef]
  15. Unger, G.; Benozzi, S.F.; Perruzza, F.; Pennacchiotti, G.L. Índice triglicéridos y glucosa: Un indicador útil de insulinorresistencia. Endocrinol. Nutr. 2014, 61, 533–540. [Google Scholar] [CrossRef]
  16. Paramanathan, T.; Sandrasegarampillai, B.; Arasaratnam, V.; Thirunavukarasu, K.; Gunasekaran, M.; Sivananthan, S.; Kumar, S.; Rajendra, S.; Hemachandra, N.; Sinnadurai, K.; et al. The discriminative ability of the triglyceride-glucose index to identify metabolic syndrome among adults of the northern Sri Lankan population. BMC Endocr. Disord. 2024, 24, 101. [Google Scholar] [CrossRef]
  17. Lelis, D.F.; Baldo, T.O.F.; Andrade, J.M.O.; Griep, R.H.; Bensenor, I.M.; Lotufo, P.A.; Santos, R.D.; Oliveira, P.P.; Silva, J.F.; Almeida, M.B.; et al. High triglyceride-glucose index and HOMA-IR are associated with different cardiometabolic profile in adults from the ELSA-Brasil study. Clin. Biochem. 2024, 131–132, 110793. [Google Scholar] [CrossRef]
  18. Cho, W.; Seo, M.-W.; Rosenberg, J.; Kim, J.Y. Single point insulin sensitivity estimator index for identifying metabolic syndrome in US adults: NHANES 2017-March 2020. Obes. Res. Clin. Pract. 2024, 18, 280–285. [Google Scholar] [CrossRef]
  19. Wan, H.; Cao, H.; Ning, P. Superiority of the triglyceride-glucose index over the homeostasis model in predicting metabolic syndrome based on NHANES data analysis. Sci. Rep. 2024, 14, 15499. [Google Scholar] [CrossRef]
  20. Alizargar, J.; Hsieh, N.-C.; Wu, S.-F.V. The correct formula to calculate triglyceride-glucose index (TyG). J. Pediatr. Endocrinol. Metab. 2020, 33, 945–946. [Google Scholar] [CrossRef] [PubMed]
  21. Moriyama, K. Mini-review on insulin resistance assessment: Advances in surrogate indices and clinical applications. World J. Clin. Cases 2025, 13, 108380. [Google Scholar] [CrossRef] [PubMed]
  22. Almeda-Valdés, P.; Bello-Chavolla, O.Y.; Caballeros-Barragán, C.R.; Gómez-Velasco, D.V.; Viveros-Ruiz, T.; Vargas-Vázquez, A.; Aguilar-Salinas, C.A. Índices para la evaluación de la resistencia a la insulina en individuos mexicanos sin diabetes. Gac. Med. Mex. 2018, 154 (Suppl. S2), S50–S55. [Google Scholar] [CrossRef] [PubMed]
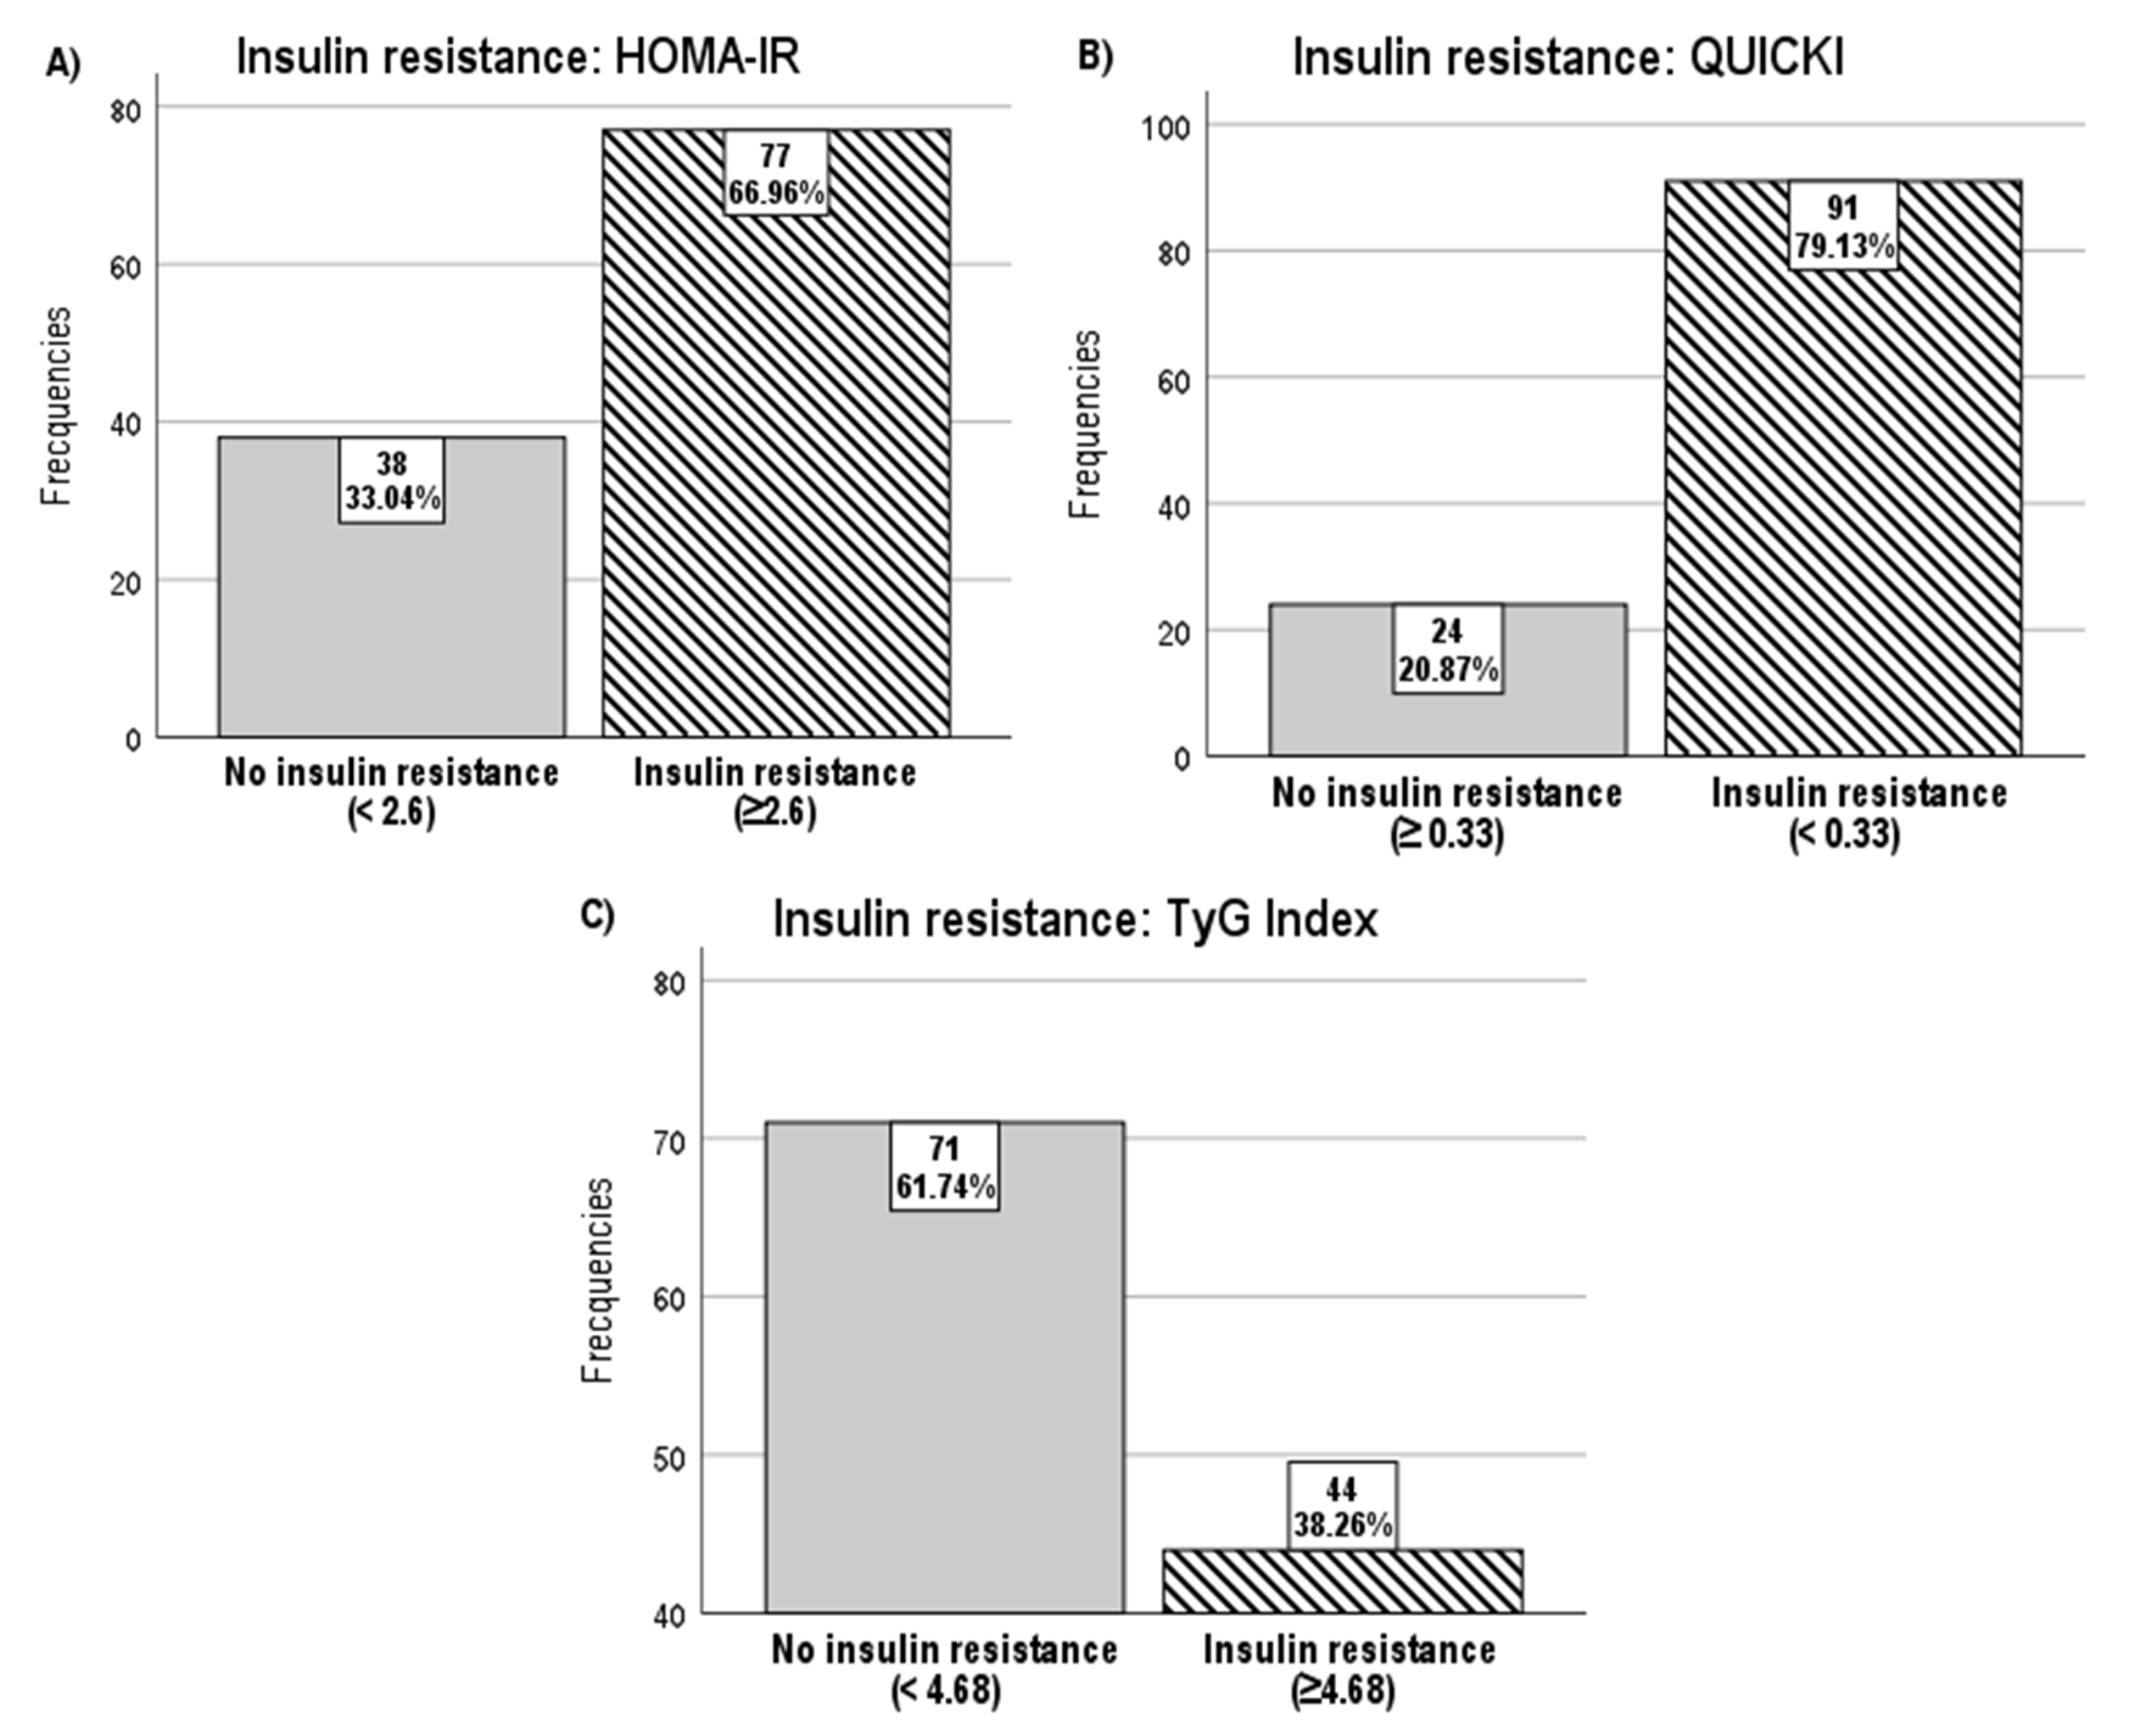
Figure 1. Frequencies and percentages of patients with and without insulin resistance according to the different indices evaluated. (A) HOMA-IR index, (B) QUICKI index, (C) TyG index.
Diabetology 06 00141 g001
Figure 2. ROC curve of the Triglyceride/Glucose (TyG) index for the detection of insulin resistance, using the binary classification by the HOMA-IR index as the reference. AUC: 0.707 (95% CI: 0.606–0.809), standard error: 0.052, p = 0.000. The optimal cut-off identified was 4.3811, with sensitivity of 70.1%, specificity of 68.4%, and Youden’s index of 0.385. The red dashed line represents the performance of the TyG index in distinguishing between subjects with and without insulin resistance; diagonal segments are produced by ties.
Diabetology 06 00141 g002
Figure 3. ROC curve of the Triglyceride/Glucose (TyG) index for the detection of insulin resistance, using the binary classification determined by the QUICKI index as the reference. AUC: 0.960, standard error: 0.026, p = 0.000. The red dashed line represents the performance of the TyG index in distinguishing between subjects with and without insulin resistance; diagonal segments are produced by ties.
Diabetology 06 00141 g003
Figure 4. Scatterplot matrix illustrating the relationships among QUICKI, the TyG index, and HOMA-IR. Each panel shows a bivariate scatterplot with a fitted linear regression line representing the association between two indices. A strong negative relationship was observed between QUICKI and HOMA-IR (R2 = 0.483). The TyG index also showed a negative association with QUICKI (R2 = 0.218) and a positive association with HOMA-IR (R2 = 0.198).
Diabetology 06 00141 g004
Table 1. Demographic and anthropometric characteristics of the study participants.
(N (%) or Mean ± SD)
Number of participants115
Demographic variables
Age (years)21.13 ± 4.58
Sex
Male37 (32.2)
Female78 (67.8)
Anthropometric characteristics
Height (m)1.64 ± 0.08
Weight (kg)69.13 ± 18.25
Body mass index (BMI)25.38 ± 5.92
Underweight7 (6.1)
Normal weight62 (53.9)
Overweight25 (21.7)
Obesity class I11 (9.6)
Obesity class II8 (7.0)
Obesity class III2 (1.7)
Waist circumference (cm)83.06 ± 13.38
Hip circumference (cm)100.89 ± 11.92
Waist-to-hip ratio0.82 ± 0.09
Body fat percentage29.98 ± 27.90
Muscle mass percentage46.65 ± 10.91
Visceral fat3.70 ± 3.23
Table 2. Biochemical characteristics of the study participants.
(N (%) or Mean ± SD)
Number of participants115
Biochemical variables
Glucose (mg/dL)88.43 ± 18.79
Lipoproteins (mg/dL)
Total cholesterol169.77 ± 54.15
Triglycerides97.49 ± 50.68
Insulin (µU/mL)21.97 ± 20.88
Calculated indices
HOMA-IR5.09 ± 6.91
With IR77 (66.96)
Without IR38 (33.04)
TyG index4.46 ± 0.26
With IR25 (21.7)
Without IR90 (78.3)
QUICKI index0.31 ± 0.03
With IR91 (79.13)
Without IR24 (20.87)
Table 3. Correlations between insulin resistance indices and anthropometric/biochemical variables.
VariableTyG Index (ρ, p)QUICKI Index (ρ, p)HOMA-IR Index (ρ, p)
Weight0.375, p < 0.001 *−0.292, p = 0.002 *0.292, p = 0.002 *
BMI0.363, p < 0.001 *−0.305, p = 0.001 *0.305, p = 0.001 *
Total cholesterol0.525, p < 0.001 *−0.307, p = 0.001 *0.308, p = 0.001 *
Waist circumference0.473, p < 0.001 *−0.231, p = 0.044 *0.231, p = 0.044 *
Hip circumference0.341, p = 0.002 *−0.220, p = 0.0530.220, p = 0.053
Body fat percentage0.194, p = 0.042 *−0.174, p = 0.0690.174, p = 0.069
Muscle mass percentage0.317, p = 0.001 *−0.204, p = 0.033 *0.204, p = 0.033 *
Visceral fat0.337, p < 0.001 *−0.282, p = 0.003 *0.282, p = 0.003 *
Age0.118, p = 0.209−0.018, p = 0.8500.019, p = 0.843
Height0.148, p = 0.115−0.070, p = 0.4590.069, p = 0.462
ρ: Spearman’s rank correlation coefficient. * p < 0.05.
Table 4. Comparison of the diagnostic properties (sensitivity, specificity, PPV, NPV) of the TyG index relative to reference methods for insulin resistance (HOMA-IR and QUICKI), using ≥4.38 as the TyG cut-off for IR-positive/IR-negative classification.
Comparator IndexSensitivity (%)Specificity (%)PPV (%)NPV (%)
HOMA-IR70.168.481.853.1
QUICKI67.079.292.438.8
Disclaimer/Publisher’s Note: The statements, opinions and data contained in all publications are solely those of the individual author(s) and contributor(s) and not of MDPI and/or the editor(s). MDPI and/or the editor(s) disclaim responsibility for any injury to people or property resulting from any ideas, methods, instructions or products referred to in the content.