
Diabetic Ketoacidosis Was Associated with High Morbidity and Mortality in Hospitalized Patients with COVID-19 in the NYC Public Health System

 ,
,  , , and
Abstract
:1. Introduction
2. Materials and Methods
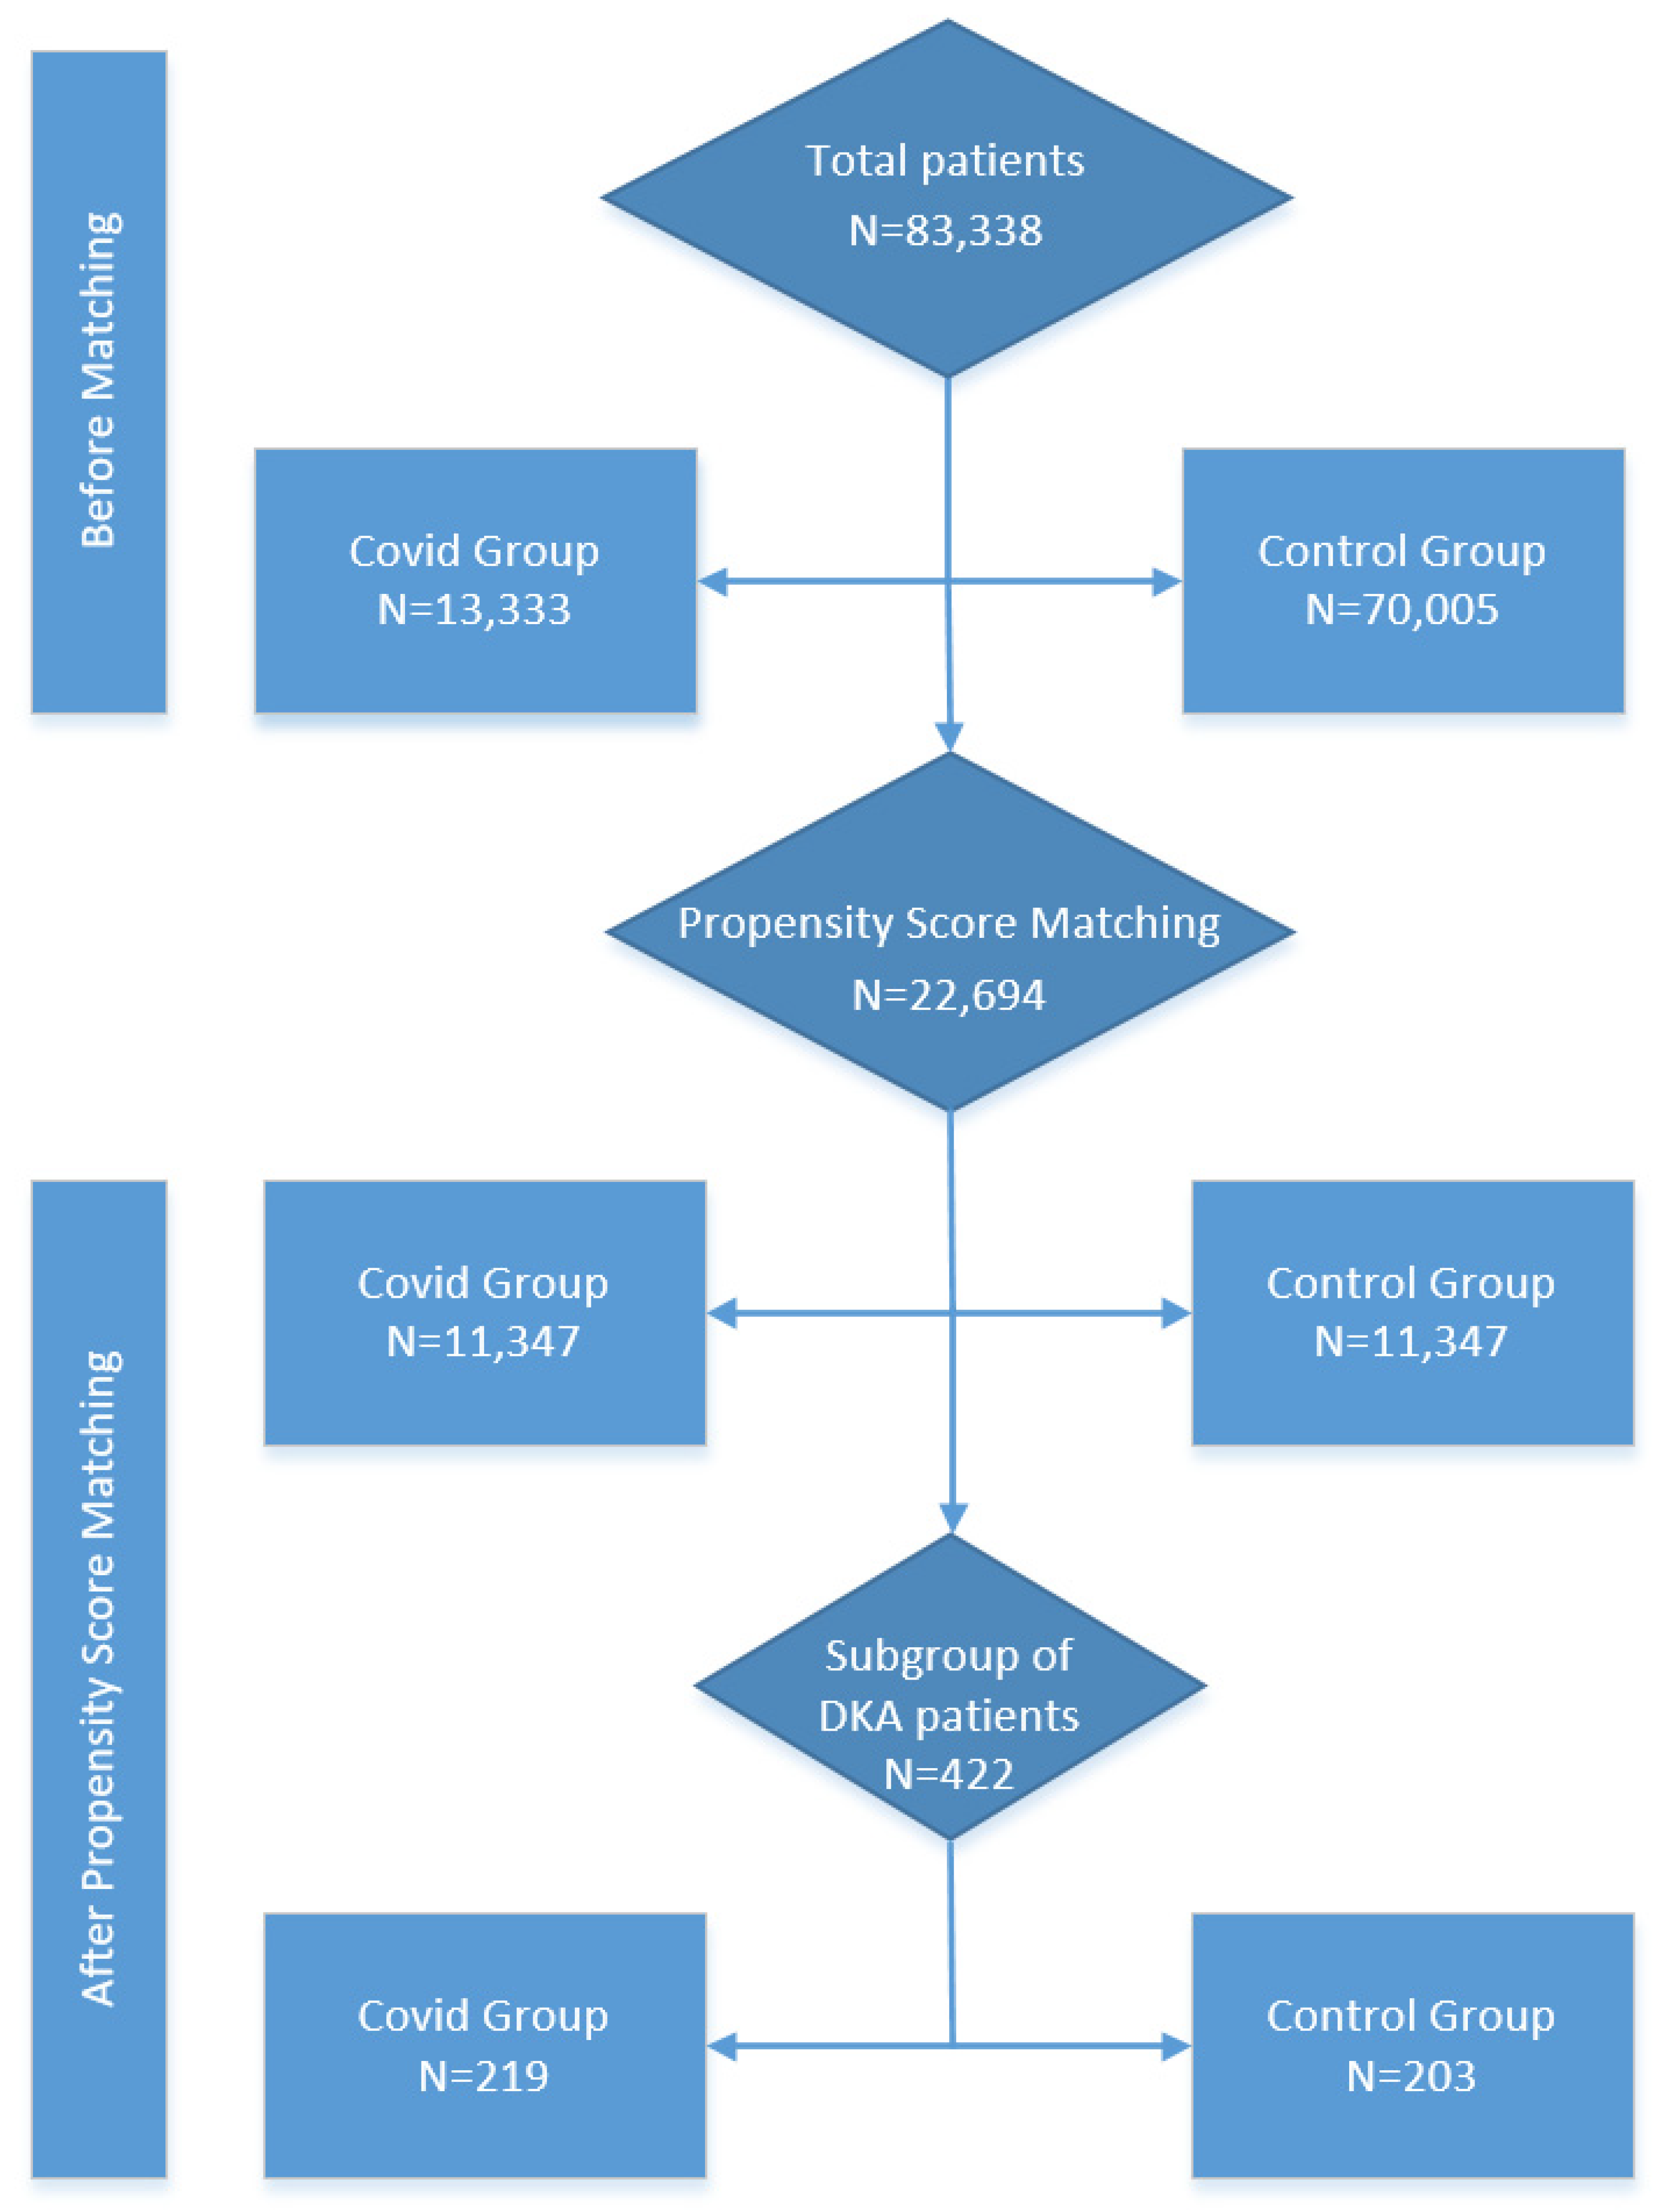
2.1. Study Design and Patient Population
2.2. Data Sources
2.3. Exposure of Interest and Outcomes
2.4. Statistical Analysis
3. Results
3.1. Descriptive Analyses
3.1.1. Baseline Characteristics
3.1.2. Inflammatory Markers
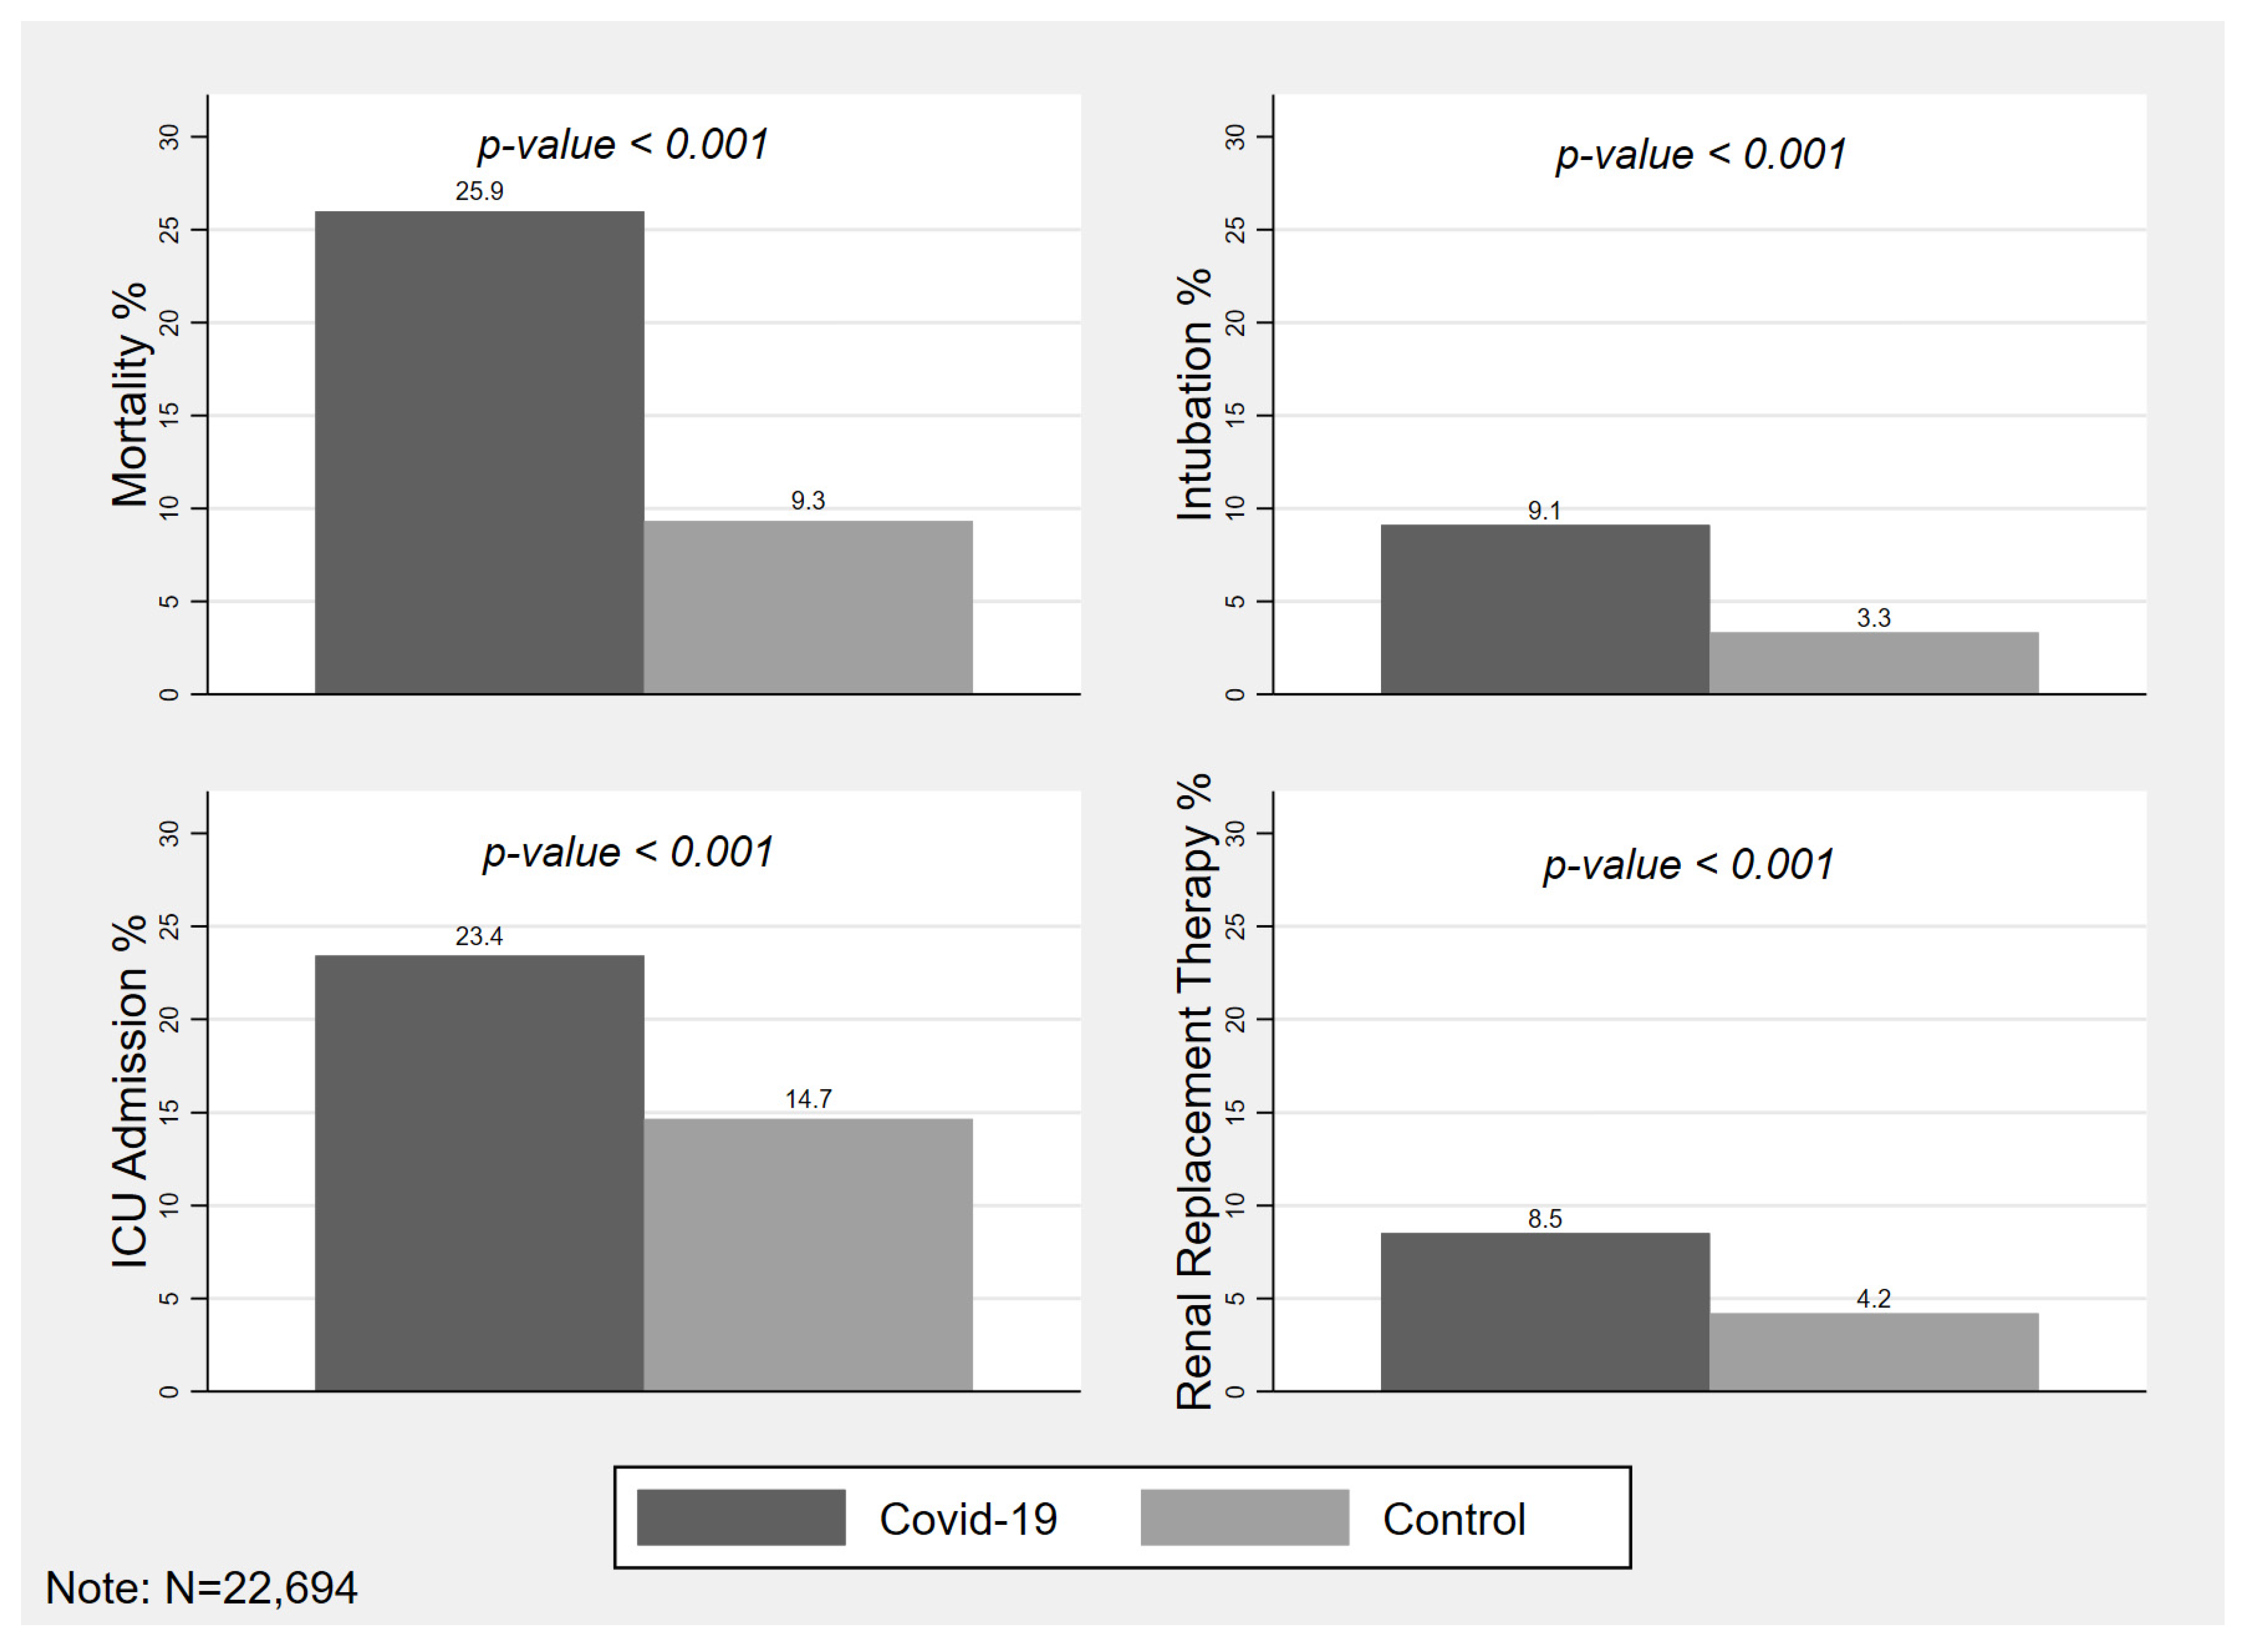
3.1.3. Outcomes
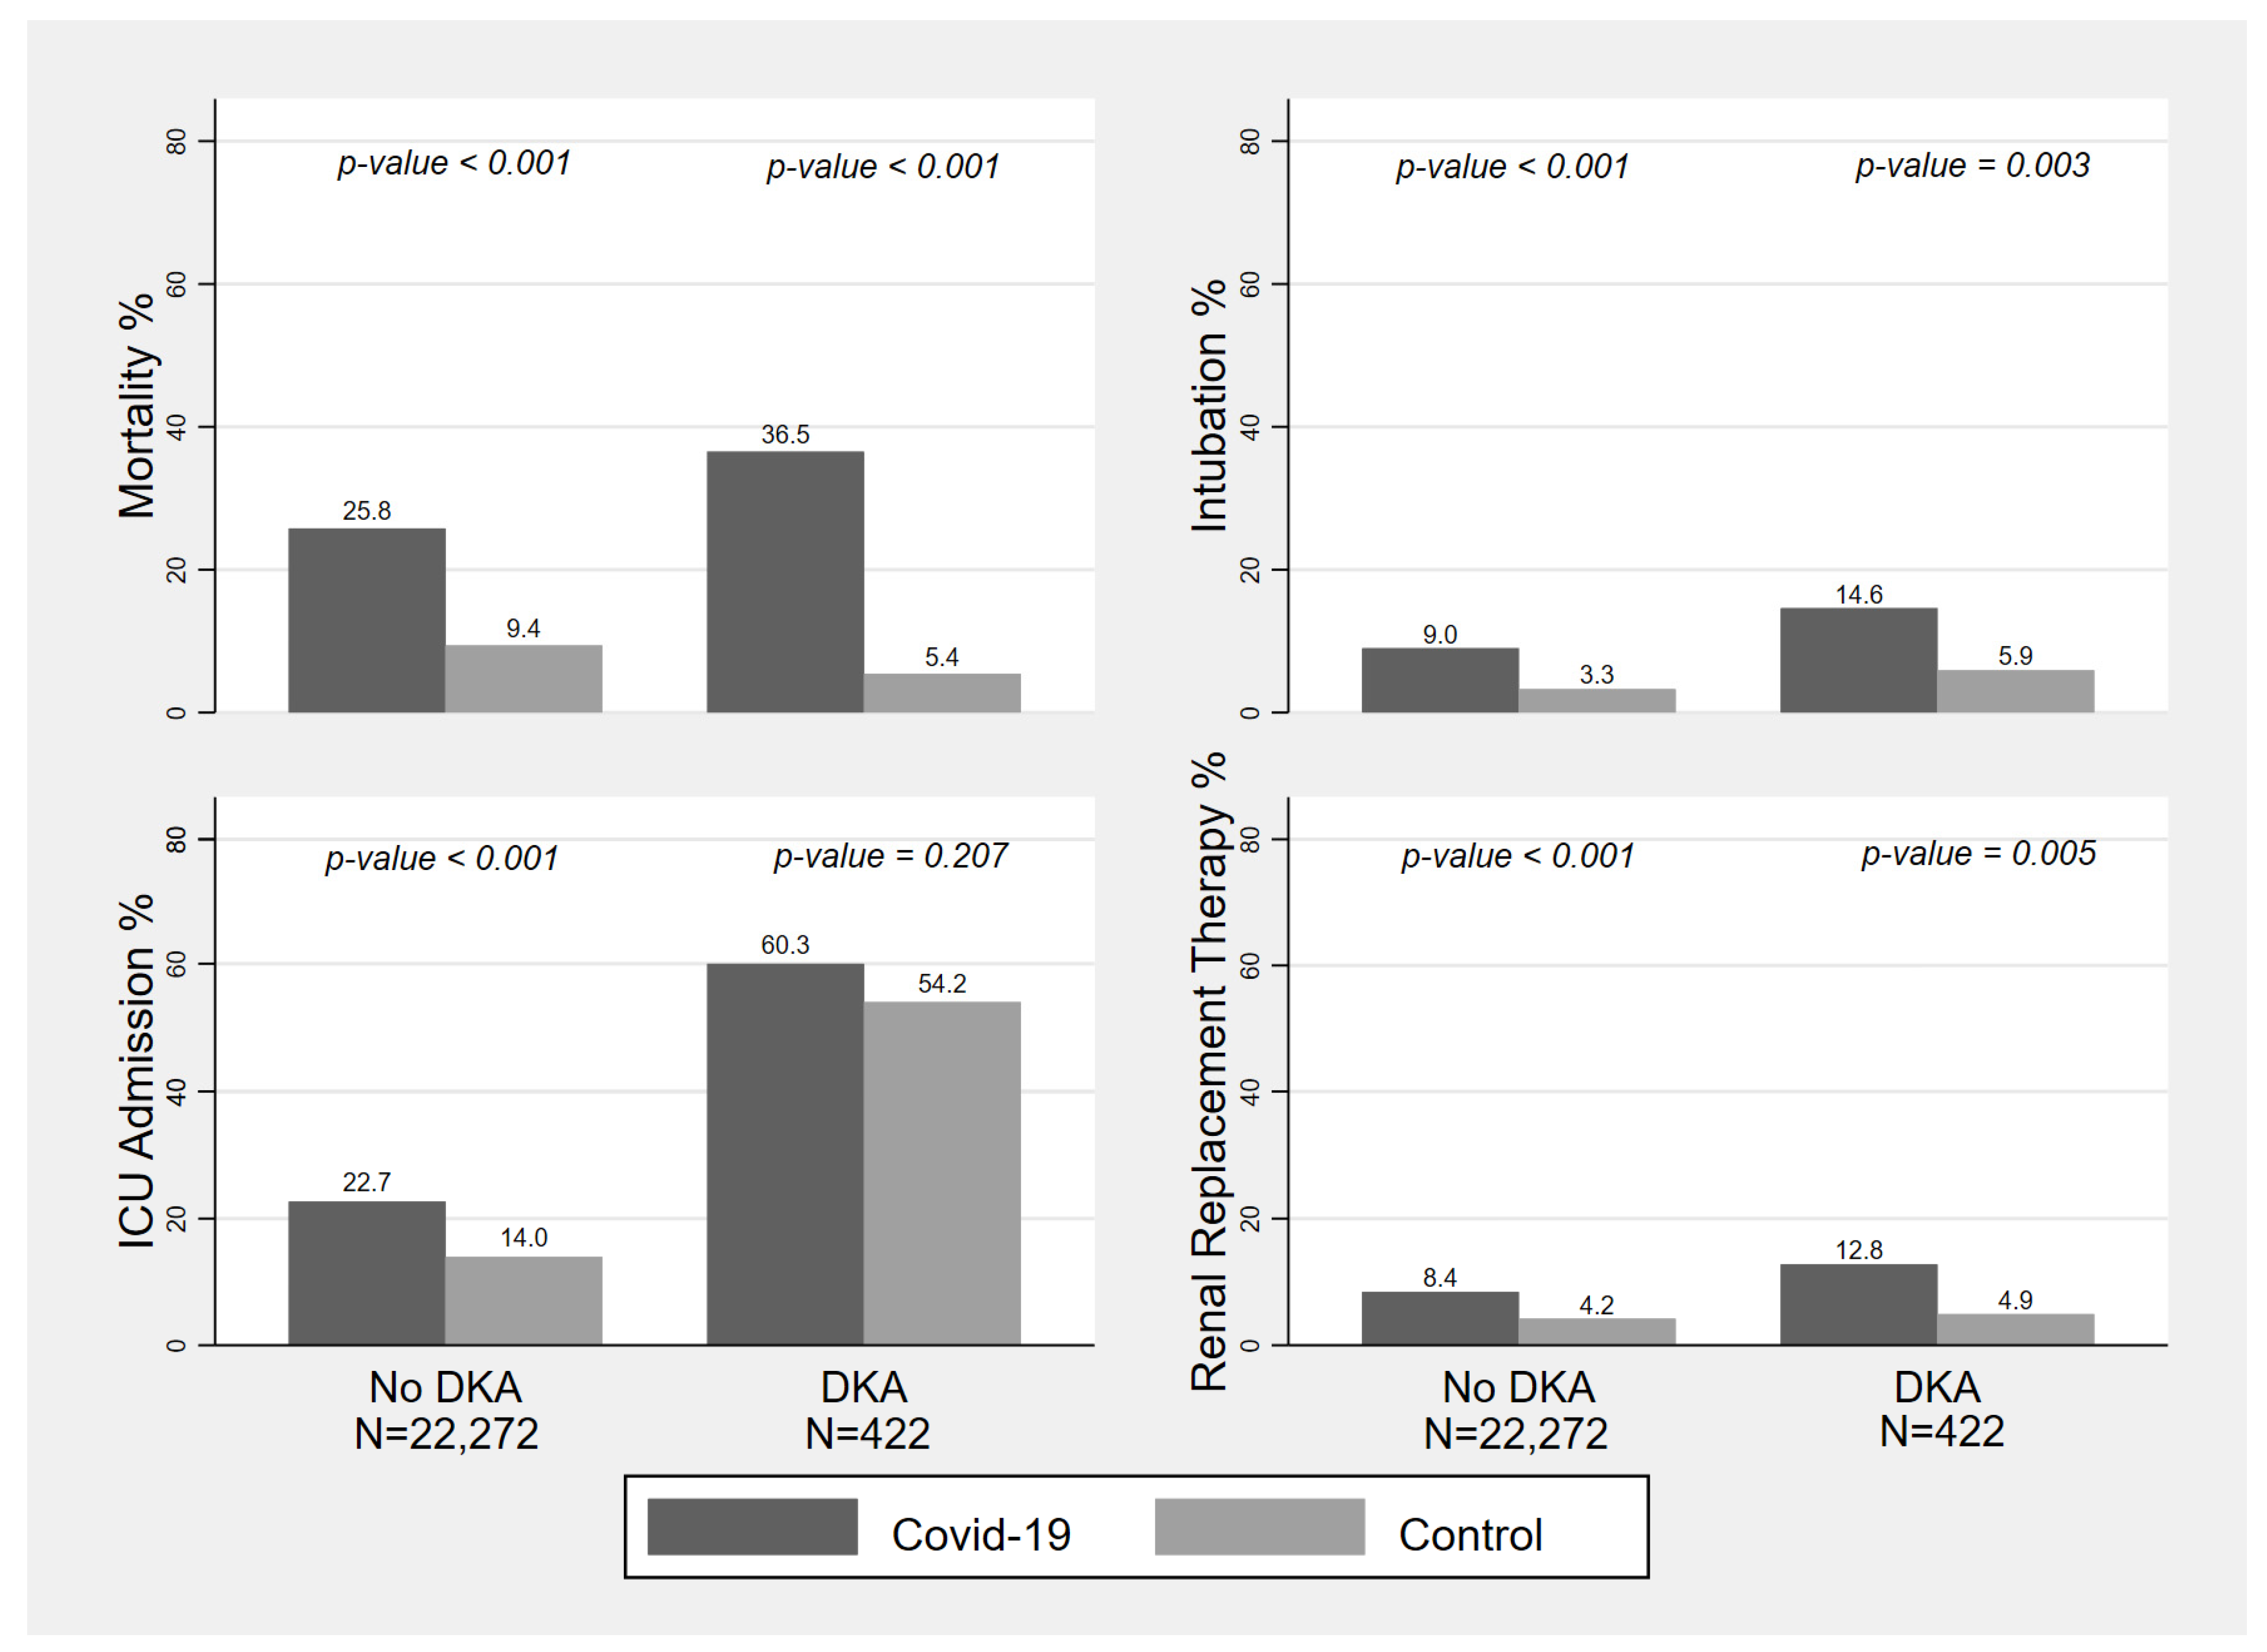
3.2. Subgroup Analysis for Patients with DKA
3.3. Logistic Regression Analysis
3.3.1. Matched Cohort (COVID-19 and Non-COVID-19)
3.3.2. COVID-19 Cohort
3.3.3. DKA Cohort
4. Discussion
5. Conclusions
Supplementary Materials
Author Contributions
Funding
Institutional Review Board Statement
Informed Consent Statement
Data Availability Statement
Acknowledgments
Conflicts of Interest
References
- Rubino, F.; Amiel, S.A.; Zimmet, P.; Alberti, G.; Bornstein, S.; Eckel, R.H.; Mingrone, G.; Boehm, B.; Cooper, M.E.; Chai, Z.; et al. New-onset diabetes in Covid-19. N. Engl. J. Med. 2020, 383, 789–790. [Google Scholar] [CrossRef] [PubMed]
- Newton, C.A.; Raskin, P. Diabetic ketoacidosis in type 1 and type 2 diabetes mellitus: Clinical and biochemical differences. Arch. Intern. Med. 2004, 164, 1925–1931. [Google Scholar] [CrossRef]
- Kamata, Y.; Takano, K.; Kishihara, E.; Watanabe, M.; Ichikawa, R.; Shichiri, M. Distinct clinical characteristics and therapeutic modalities for diabetic ketoacidosis in type 1 and type 2 diabetes mellitus. J. Diabetes Complicat. 2017, 31, 468–472. [Google Scholar] [CrossRef]
- Sathish, T.; Kapoor, N.; Cao, Y.; Tapp, R.J.; Zimmet, P. Proportion of newly diagnosed diabetes in COVID-19 patients: A systematic review and meta-analysis. Diabetes Obes. Metab. 2021, 23, 870–874. [Google Scholar] [CrossRef] [PubMed]
- de Sá-Ferreira, C.O.; da Costa, C.H.M.; Guimarães, J.C.W.; Sampaio, N.S.; Silva, L.M.L.; de Mascarenhas, L.P.; Rodrigues, N.G.; Dos Santos, T.L.; Campos, S.; Young, E.C. Diabetic ketoacidosis and COVID-19: What have we learned so far? Am. J. Physiol. Endocrinol. Metab. 2022, 322, E44–E53. [Google Scholar] [CrossRef] [PubMed]
- Kiran, R.; Saroch, A.; Pannu, A.K.; Sharma, N.; Dutta, P.; Kumar, M. Clinical profile and outcomes of diabetic ketoacidosis during COVID-19 pandemic in north India. Trop. Dr. 2022, 18, 494755221076896. [Google Scholar] [CrossRef]
- Alhumaid, S.; Al Mutair, A.; Al Alawi, Z.; Rabaan, A.A.; Alomari, M.A.; Al Salman, S.A.; Al-Alawi, A.S.; Al Hassan, M.H.; Alhamad, H.; Al-Kamees, M.A.; et al. Diabetic ketoacidosis in patients with SARS-CoV-2: A systematic review and meta-analysis. Diabetol. Metab. Syndr. 2021, 13, 120. [Google Scholar] [CrossRef] [PubMed]
- Stevens, J.S.; Bogun, M.M.; McMahon, D.J.; Zucker, J.; Kurlansky, P.; Mohan, S.; Yin, M.T.; Nickolas, T.L.; Pajvani, U.B. Diabetic ketoacidosis and mortality in COVID-19 infection. Diabetes Metab. 2021, 47, 101267. [Google Scholar] [CrossRef] [PubMed]
- Muhammad, A.; Hakim, M.; Afaq, S.; Khattak, F.A.; Shakireen, N.; Jawad, M.; Saeed, R.; Haq, Z.U. Diabetic ketoacidosis amongst patients with COVID-19: A retrospective chart review of 220 patients in Pakistan. Endocrinol. Diabetes Metab. 2022, 5, e00331. [Google Scholar] [CrossRef]
- Kempegowda, P.; Melson, E.; Johnson, A.; Wallett, L.; Thomas, L.; Zhou, D.; Holmes, C.; Juszczak, A.; Karamat, M.A.; Ghosh, S.; et al. Effect of COVID-19 on the clinical course of diabetic ketoacidosis (DKA) in people with type 1 and type 2 diabetes. Endocr. Connect. 2021, 10, 371–377. [Google Scholar] [CrossRef]
- Chamorro-Pareja, N.; Parthasarathy, S.; Annam, J.; Hoffman, J.; Coyle, C.; Kishore, P. Letter to the editor: Unexpected high mortality in COVID-19 and diabetic ketoacidosis. Metab. Clin. Exp. 2020, 110, 154301. [Google Scholar] [CrossRef] [PubMed]
- Available online: https://www.aafp.org/pubs/afp/issues/2005/0501/p1705.html#:~:text=A%20diagnosis%20of%20diabetic%20ketoacidosis,mEq%20per%20L%20or%20less (accessed on 12 May 2022).
- Austin, P.C. An introduction to propensity score methods for reducing the effects of confounding in observational studies. Multivar. Behav. Res. 2011, 46, 399–424. [Google Scholar] [CrossRef] [PubMed]
- Austin, P.C. Optimal caliper widths for propensity-score matching when estimating differences in means and differences in proportions in observational studies. Pharm. Stat. 2011, 10, 150–161. [Google Scholar] [CrossRef] [PubMed]
- Wang, Y.; Cai, H.; Li, C.; Jiang, Z.; Wang, L.; Song, J.; Xia, J. Optimal caliper width for propensity score matching of three treatment groups: A Monte Carlo study. PLoS ONE 2013, 8, e81045. [Google Scholar]
- Li, J.; Wang, X.; Chen, J.; Zuo, X.; Zhang, H.; Deng, A. COVID-19 infection may cause ketosis and ketoacidosis. Diabetes Obes. Metab. 2020, 22, 1935–1941. [Google Scholar] [CrossRef]
- Khan, F.; Paladino, L.; Sinert, R. The impact of COVID-19 on Diabetic Ketoacidosis patients. Diabetes Metab. Syndr. 2022, 16, 102389. [Google Scholar] [CrossRef]
- Kumar, A.; Arora, A.; Sharma, P.; Anikhindi, S.A.; Bansal, N.; Singla, V.; Khare, S.; Srivastava, A. Is diabetes mellitus associated with mortality and severity of COVID-19? A meta-analysis. Diabetes Metab. Syndr. 2020, 14, 535–545, Epub 2020 May 6. PMCID:PMC7200339. [Google Scholar] [CrossRef] [PubMed]
- Palaiodimos, L.; Chamorro-Pareja, N.; Karamanis, D.; Li, W.; Zavras, P.D.; Chang, K.M.; Mathias, P.; Kokkinidis, D.G. Diabetes is associated with increased risk for in-hospital mortality in patients with COVID-19: A systematic review and meta-analysis comprising 18,506 patients. Hormones 2021, 20, 305–314, Epub 2020 Oct 29. PMCID:PMC7595056. [Google Scholar] [CrossRef] [PubMed]
- Rafique, S.; Ahmed, F.W. A Case of combined diabetic ketoacidosis and hyperosmolar hyperglycemic state in a patient with COVID-19. Cureus 2020, 12, e8965. [Google Scholar] [CrossRef]
- Singh, B.; Kaur, P.; Majachani, N.; Patel, P.; Reid, R.-J.R.; Maroules, M. COVID-19 and combined diabetic ketoacidosis and hyperglycemic hyperosmolar nonketotic coma: Report of 11 cases. J. Investig. Med. High Impact Case Reports. 2021, 9, 23247096211021231. [Google Scholar] [CrossRef]
- Yang, J.K.; Lin, S.S.; Ji, X.J.; Guo, L.M. Binding of SARS coronavirus to its receptor damages islets and causes acute diabetes. Acta Diabetol. 2010, 47, 193–199, Epub 2009 Mar 31. PMCID:PMC7088164. [Google Scholar] [CrossRef] [PubMed] [Green Version]
- Wu, C.T.; Lidsky, P.V.; Xiao, Y.; Lee, I.T.; Cheng, R.; Nakayama, T.; Jiang, S.; Demeter, J.; Bevacqua, R.J.; Chang, C.A.; et al. SARS-CoV-2 infects human pancreatic β cells and elicits β cell impairment. Cell Metab. 2021, 33, 1565–1576.e5, Epub 2021 May 18. PMCID:PMC8130512. [Google Scholar] [CrossRef] [PubMed]
- Al-Kuraishy, H.M.; Al-Gareeb, A.I.; Alblihed, M.; Guerreiro, S.G.; Cruz-Martins, N.; Batiha, G.E. COVID-19 in Relation to Hyperglycemia and Diabetes Mellitus. Front Cardiovasc. Med. 2021, 8, 644095, PMCID:PMC8189260. [Google Scholar] [CrossRef] [PubMed]
- Ghimire, P.; Dhamoon, A.S. Ketoacidosis. In StatPearls; StatPearls Publishing: Treasure Island, FL, USA, 2022. Available online: https://www.ncbi.nlm.nih.gov/books/NBK534848/ (accessed on 2 June 2022).
- Chiasson, J.L.; Aris-Jilwan, N.; Bélanger, R.; Bertrand, S.; Beauregard, H.; Ekoé, J.M.; Fournier, H.; Havrankova, J. Diagnosis and treatment of diabetic ketoacidosis and the hyperglycemic hyperosmolar state. CMAJ 2003, 168, 859–866, Erratum in: CMAJ. 2003 May 13;168, 1241. PMCID:PMC151994. [Google Scholar] [PubMed]
- Lim, S.; Bae, J.H.; Kwon, H.-S.; Nauck, M.A. COVID-19 and diabetes mellitus: From pathophysiology to clinical management. Nat. Rev. Endocrinol. 2021, 17, 11–30. [Google Scholar] [CrossRef]
- Ma, R.C.W.; Holt, R.I.G. COVID-19 and diabetes. Diabet. Med. 2020, 37, 723–725, Epub 2020 Apr 3. PMCID:PMC7228343. [Google Scholar] [CrossRef] [PubMed]
- Jafar, N.; Edriss, H.; Nugent, K. The effect of short-term hyperglycemia on the innate immune system. Am. J. Med. Sci. 2016, 351, 201–211. [Google Scholar] [CrossRef] [PubMed]
- Geerlings, S.E.; Hoepelman, A.I. Immune dysfunction in patients with diabetes mellitus (DM). FEMS Immunol. Med. Microbiol. 1999, 26, 259–265. [Google Scholar] [CrossRef] [PubMed]
- Mehta, P.; McAuley, D.F.; Brown, M.; Sanchez, E.; Tattersall, R.S.; Manson, J.J. HLH across speciality collaboration, UK. COVID-19: Consider cytokine storm syndromes and immunosuppression. Lancet 2020, 395, 1033–1034, Epub 2020 Mar 16. PMCID:PMC7270045. [Google Scholar] [CrossRef] [PubMed]
- Huang, I.; Lim, M.A.; Pranata, R. Diabetes mellitus is associated with increased mortality and severity of disease in COVID-19 pneumonia—A systematic review, meta-analysis, and meta-regression. Diabetes Metab. Syndr. 2020, 14, 395–403, Epub 2020 Apr 17. PMCID:PMC7162793. [Google Scholar] [CrossRef] [PubMed]
- Wu, C.; Chen, X.; Cai, Y.; Xia, J.; Zhou, X.; Xu, S.; Huang, H.; Zhang, L.; Zhou, X.; Du, C.; et al. Risk Factors associated with acute respiratory distress syndrome and death in patients with coronavirus disease 2019 pneumonia in Wuhan, China. JAMA Intern. Med. 2020, 180, 934–943, Erratum in: JAMA Intern Med. 2020 Jul 1;180, 1031. PMCID:PMC7070509. [Google Scholar] [CrossRef] [PubMed] [Green Version]
- Tikellis, C.; Thomas, M.C. Angiotensin-converting enzyme 2 (ACE2) is a key modulator of the renin angiotensin system in health and disease. Int. J. Pept. 2012, 2012, 256294, Epub 2012 Mar 20. PMCID:PMC3321295. [Google Scholar] [CrossRef] [PubMed]
- Pal, R.; Bhansali, A. COVID-19, diabetes mellitus and ACE2: The conundrum. Diabetes Res. Clin. Pract. 2020, 162, 108132, Epub 2020 Mar 29. PMCID:PMC7118535. [Google Scholar] [CrossRef] [PubMed]
- Yakou, F.; Saburi, M.; Hirose, A.; Akaoka, H.; Hirota, Y.; Kobayashi, T.; Awane, N.; Asahi, N.; Amagawa, T.; Ozawa, S.; et al. A case series of ketoacidosis after coronavirus disease 2019 vaccination in patients with type 1 diabetes. front endocrinol (Lausanne). Front. Endocrinol. 2022, 13, 840580, PMCID:PMC8971718. [Google Scholar] [CrossRef] [PubMed]
- Makiguchi, T.; Fukushima, T.; Tanaka, H.; Taima, K.; Takayasu, S.; Tasaka, S. Diabetic ketoacidosis shortly after COVID-19 vaccination in a non–small-cell lung cancer patient receiving combination of PD-1 and CTLA-4 inhibitors: A case report. Thorac. Cancer 2022, 13, 1220–1223. [Google Scholar] [CrossRef]
- Lee, H.J.; Sajan, A.; Tomer, Y. Hyperglycemic emergencies associated with COVID-19 vaccination: A Case series and discussion. J. Endocr. Soc. 2021, 5, bvab141. [Google Scholar] [CrossRef]


| COVID-19 and Control Group | DKA/COVID-19 vs. DKA/Non-COVID-19 | |||||||
|---|---|---|---|---|---|---|---|---|
| Total (N = 22,694) | COVID-19 Group (N = 11,347) | Control Group (N = 11,347) | p-Value | Total (N = 422) | COVID-19 Group (N = 219) | Control Group (N = 203) | p-Value | |
| Male sex—no. (%) | 13,224 (52.2) | 6672 (58.8) | 6552 (57.7) | 0.106 | 275 (65.1) | 139 (63.4) | 136 (67.0) | 0.448 |
| Age—years—Median (IQR) | 62 (48–74) | 62 (49–74) | 62 (48–75) | 0.233 | 53 (40–66) | 56 (41–69) | 50 (38–63) | 0.004 |
| BMI—kg/m2—Median (IQR) | 27.9 (24.1–33.1) | 28.1 (24.4–32.8) | 27.9 (23.8–33.3) | 0.063 | 25.8 (22.5–30.4) | 25.7 (22.6–30.2) | 26.1 (22.4–30.8) | 0.429 |
| Race/Ethnicity—no. (%) | ||||||||
| Asian | 1395 (6.21) | 643 (5.7) | 752 (6.7) | <0.001 | 16 (3.8) | 9 (4.1) | 7 (3.5) | 0.255 |
| Black | 7264 (32.3) | 3577 (31.8) | 3687 (32.8) | 153 (36.7) | 74 (34.1) | 79 (45.2) | ||
| White | 3003 (13.3) | 1174 (10.4) | 1829 (16.3) | 40 (9.6) | 17 (7.8) | 23 (11.5) | ||
| Other/Latino | 10,791 (48.0) | 5846 (52.0) | 4945 (44.1) | 207 (49.7) | 117 (53.9) | 90 (45.2) | ||
| Coexisting disorder—no. (%) | ||||||||
| Diabetic Ketoacidosis | 422 (1.8) | 219 (1.9) | 203 (1.7) | 0.432 | 422 (100) | 219 (100) | 203 (100) | - |
| History of DM | 9951 (43.8) | 4938 (43.5) | 5013 (44.1) | 0.316 | 422 (100) | 219 (100) | 203 (100) | - |
| Type 1 Diabetes | 139 (0.6) | 61 (0.5) | 78 (0.6) | 0.148 | 93 (22.0) | 44 (20.0) | 49 (24.1) | 0.316 |
| HTN | 5127 (22.5) | 2532 (22.3) | 2595 (22.8) | 0.317 | 99 (23.4) | 46 (21.0) | 53 (26.1) | 0.216 |
| HLD | 2114 (9.3) | 1042 (9.1) | 1072 (9.4) | 0.493 | 45 (10.6) | 24 (10.9) | 21 (10.3) | 0.838 |
| Pulmonary HTN | 108 (0.4) | 45 (0.4) | 63 (0.5) | 0.083 | 1 (0.2) | 1 (0.4) | 0 (0.0) | 0.335 |
| COPD | 474 (2.0) | 218 (1.9) | 256 (2.2) | 0.078 | 1 (0.2) | 0 (0.0) | 1 (0.4) | 0.298 |
| Asthma | 976 (4.3) | 474 (4.1) | 502 (4.4) | 0.360 | 13 (3.0) | 4 (1.8) | 9 (4.4) | 0.121 |
| CAD | 707 (3.1) | 347 (3.0) | 360 (3.1) | 0.619 | 5 (1.1) | 4 (1.8) | 1 (0.4) | 0.206 |
| Heart Failure | 1225 (5.4) | 592 (5.2) | 633 (5.5) | 0.228 | 16 (3.7) | 8 (3.6) | 8 (3.9) | 0.877 |
| Stroke/TIA | 304 (1.3) | 163 (1.4) | 141 (1.2) | 0.204 | 3 (0.7) | 2 (0.9) | 1 (0.4) | 0.607 |
| ESRD | 1032 (4.5) | 513 (4.5) | 519 (4.5) | 0.848 | 18 (4.2) | 9 (4.1) | 9 (4.4) | 0.869 |
| Chronic Kidney Disease | 1339 (5.9) | 660 (5.8) | 679 (5.9) | 0.592 | 29 (6.8) | 12 (5.4) | 17 (8.3) | 0.241 |
| COVID-19 vs. Non COVID-19 | DKA with COVID-19 vs. DKA without COVID-19 | |||||||
|---|---|---|---|---|---|---|---|---|
| Inflammatory Markers | Total (N = 22,694) | COVID-19 Group (N = 11,347) | Control Group (N = 11,347) | p-Value | Total (N = 422) | COVID-19 Group (N = 219) | Control Group (N = 203) | p-Value |
| CRP (mg/L)—Median (IQR) | 18.1 (5.7–602) | 18.7 (6–60.1) | 11.5 (2.98–61) | 0.035 | 13.1 (4.4–52.3) | 12.7 (4.4–52.3) | 14.1 (6.3–20.7) | 0.247 |
| LDH (U/L)—Median (IQR) | 388 (279–568) | 399 (290–577) | 271 (197–402) | <0.001 | 424 (301–619) | 427 (309–631.5) | 268 (169–584) | 0.141 |
| Ferritin (ng/mL)—Median (IQR) | 631 (263–1310) | 731 (344–1418) | 212 (72–593) | <0.001 | 820 (454–1501) | 914 (490.6–1606) | 410 (158–655) | 0.026 |
| D-Dimer (ng/mL)—Median (IQR) | 721 (333–2272.5) | 736 (351–2314) | 471 (236–1331.5) | 0.008 | 1143 (471–2698) | 1093 (481.5–2774.5) | 1686.8 (294.5–2284) | 0.491 |
| Creatinine (mg/dL)—Median (IQR) | 0.9 (0.7–1.3) | 0.9 (0.7–1.6) | 0.9 (0.7–1.2) | <0.001 | 0.9 (0.6–1.5) | 1 (0.6–2.2) | 0.8 (0.6–1.12) | <0.001 |
| AST (U/L)—Median (IQR) | 30 (20–52) | 38 (25–65) | 24 (17–36) | <0.001 | 28 (18–50) | 35 (21–66) | 22 (15–37) | 0.017 |
| ALT (U/L)—Median (IQR) | 25 (15–47) | 33 (19–60) | 19 (13–32) | <0.001 | 22 (15–43) | 24 (16–48) | 20 (14–34) | 0.041 |
| HbA1c (%)—Median (IQR) | 6.4 (5.7–8.2) | 6.6 (5.8–8.6) | 6.3 (5.6–7.9) | <0.001 | 12.8 (10.8–14.8) | 13.1 (10.7–15.2) | 12.4 (10.8–14.6) | 0.371 |
| Vitamin D (ng/mL)/Admission—Median (IQR) | 21.3 (14–29.8) | 20.8 (13–29.8) | 22 (14.7–29.8) | 0.768 | 14.3 (9.4–29.5) | 13.6 (9.7–29) | 17.8 (9–30) | 0.892 |
| Vitamin D (ng/mL)/Pre COVID-19—Median (IQR) | 24.9 (16.5–33.5) | 24.9 (16.5–33.5) | 23.7 (15–32.3) | 23.7 (15–32.3) | ||||
| Outcomes | COVID-19 vs. Non COVID-19 | |||
|---|---|---|---|---|
| Total (N = 22,694) | COVID-19 Group (N = 11,347) | Control Group (N = 11,347) | p-Value | |
| Length of Stay—Median (IQR) | 5 (2–10) | 6 (3–13) | 4 (2–8) | <0.001 |
| Death—no. (%) | 4007 (17.6) | 2949 (25.9) | 1058 (9.3) | <0.001 |
| Intubation—no. (%) | 1413 (6.2) | 1034 (9.1) | 379 (3.3) | <0.001 |
| ICU Admission—no. (%) | 4324 (19.0) | 2658 (23.4) | 1666 (14.6) | <0.001 |
| Renal Replacement Therapy—no. (%) | 1445 (6.3) | 967 (8.5) | 478 (4.2) | <0.001 |
| Outcomes | DKA with COVID-19 vs. DKA without COVID-19 | |||
|---|---|---|---|---|
| Total (N = 422) | COVID-19 Group (N = 219) | Control Group (N = 203) | p-Value | |
| Length of Stay—Median (IQR) | 5 (3–10) | 7 (4–13) | 4 (2–7) | 0.003 |
| Death—no. (%) | 91 (21.5) | 80 (36.5) | 11 (5.4) | <0.001 |
| Intubation—no. (%) | 44 (10.4) | 32 (14.6) | 12 (5.9) | 0.003 |
| ICU Admission—no. (%) | 242 (57.3) | 132 (60.2) | 110 (54.1) | 0.207 |
| Renal Replacement Therapy—no. (%) | 38 (9.0) | 28 (12.7) | 10 (4.9) | 0.005 |
| Univariate Analysis | Multivariate Analysis | Multivariate Analysis | Multivariate Analysis | Multivariate Analysis | |
|---|---|---|---|---|---|
| Model 1 | Model 2 | Model 3 | Model 4 | ||
| n = 22,694 | n = 22,694 | n = 22,694 | n = 22,694 | ||
| Variables | OR (95% CI), p-Value | OR (95% CI), p-Value | OR (95% CI), p-Value | OR (95% CI), p-Value | OR (95% CI), p-Value |
| Age per 10 years | 1.49 ** (1.46–1.52) p < 0.001 | 1.64 ** (1.60–1.67) p < 0.001 | 1.63 ** (1.59–1.68) p < 0.001 | 1.66 ** (1.61–1.70) p < 0.001 | 1.66 ** (1.62–1.71) p < 0.001 |
| Male sex | 1.18 ** (1.10–1.26) p < 0.001 | 1.42 ** (1.31–1.53) p < 0.001 | 1.40 ** (1.29–1.51) p < 0.001 | 1.42 ** (1.31–1.53) p < 0.001 | 1.33 ** (1.23–1.45) p < 0.001 |
| BMI | 1.00 (0.99–1.00) p = 0.693 | 1.03 ** (1.02–1.03) p < 0.001 | 1.03 ** (1.02–1.03) p < 0.001 | 1.03 ** (1.02–1.03) p < 0.001 | 1.03 ** (1.02–1.03) p < 0.001 |
| COVID-19 | 3.41 ** (3.17–3.68) p < 0.001 | 3.95 ** (3.64–4.28) p < 0.001 | 4.11 ** (3.78–4.46) p < 0.001 | 4.10 ** (3.78–4.45) p < 0.001 | 3.62 ** (3.30–3.98) p < 0.001 |
| Diabetic Ketoacidosis | 1.29 * (1.02–1.63) p = 0.034 | 1.89 ** (1.47–2.43) p < 0.001 | 1.50 ** (1.14–1.96) p = 0.003 | 1.51 ** (1.15–1.99) p = 0.003 | 1.46 ** (1.10–1.94) p = 0.009 |
| History of DM | 2.02 ** (1.88–2.16) p < 0.001 | 1.88 ** (1.74–2.04) p < 0.001 | 2.17 ** (1.97–2.38) p < 0.001 | 1.68 ** (1.52–1.85) p < 0.001 | |
| Type 1 Diabetes | 0.40 ** (0.22–0.74) p = 0.004 | 0.52 (0.26–1.03) p = 0.061 | 0.50 (0.25–1.00) p = 0.051 | 0.56 (0.28–1.14) p = 0.112 | |
| Hypertension | 0.93 (0.85–1.01) p = 0.079 | 0.64 ** (0.58–0.71) p < 0.001 | 0.69 ** (0.62–0.77) p < 0.001 | 0.70 ** (0.63–0.78) p < 0.001 | |
| Hyperlipidemia | 0.88 * (0.78–0.99) p = 0.035 | 0.77 ** (0.67–0.89) p < 0.001 | 0.87 (0.75–1.01) p = 0.064 | 0.95 (0.82–1.11) p = 0.544 | |
| Pulmonary Hypertension | 1.56 * (1.01–2.41) p = 0.047 | 1.61 (0.95–2.73) p = 0.079 | 1.56 (0.91–2.67) p = 0.109 | 1.55 (0.87–2.77) p = 0.138 | |
| COPD | 1.19 (0.95–1.49) p = 0.135 | 1.15 (0.89–1.49) p = 0.275 | 1.19 (0.92–1.54) p = 0.176 | 0.96 (0.73–1.26) p = 0.781 | |
| Asthma | 0.51 ** (0.41–0.63) p < 0.001 | 0.60 ** (0.48–0.75) p < 0.001 | 0.61 ** (0.48–0.76) p < 0.001 | 0.51 ** (0.40–0.64) p < 0.001 | |
| CAD | 1.03 (0.85–1.25) p = 0.751 | 0.74 ** (0.59–0.93) p = 0.009 | 0.78 * (0.62–0.99) p = 0.038 | 0.81 (0.63–1.03) p = 0.085 | |
| Heart Failure | 1.31 ** (1.14–1.50) p < 0.001 | 1.00 (0.84–1.19) p = 0.973 | 1.08 (0.90–1.29) p = 0.398 | 1.21 * (1.00–1.46) p = 0.045 | |
| Stroke/TIA | 0.87 (0.64–1.19) p = 0.390 | 0.62 ** (0.44–0.87) p = 0.006 | 0.66 * (0.46–0.93) p = 0.019 | 0.73 (0.50–1.05) p = 0.093 | |
| ESRD | 1.84 ** (1.60–2.12) p < 0.001 | 2.11 ** (1.76–2.53) p < 0.001 | 2.03 ** (1.69–2.44) p < 0.001 | 1.76 ** (1.45–2.15) p < 0.001 | |
| Chronic Kidney Disease | 1.47 ** (1.29–1.68) p < 0.001 | 1.06 (0.90–1.25) p = 0.460 | 1.06 (0.89–1.25) p = 0.510 | 1.12 (0.94–1.34) p = 0.215 | |
| Biguanides | 0.65 ** (0.57–0.74) p < 0.001 | 0.63 ** (0.54–0.73) p < 0.001 | 0.72 ** (0.62–0.85) p < 0.001 | ||
| DPP4 inhibitors | 0.86 * (0.76–0.99) p = 0.031 | 0.75 ** (0.64–0.87) p < 0.001 | 0.77 ** (0.65–0.91) p = 0.002 | ||
| SGLT-2 inhibitors | 0.60 (0.24–1.52) p = 0.278 | 0.93 (0.35–2.48) p = 0.881 | 0.83 (0.24–2.82) p = 0.764 | ||
| GLP-1 agonists | 0.80 (0.52–1.22) p = 0.297 | 0.92 (0.56–1.51) p = 0.742 | 0.95 (0.57–1.57) p = 0.842 | ||
| Insulin | 1.48 ** (1.38–1.59) p < 0.001 | 1.08 (0.99–1.19) p = 0.100 | 1.09 (0.99–1.20) p = 0.092 | ||
| ACE inhibitors | 0.86 ** (0.79–0.94) p = 0.001 | 0.71 ** (0.64–0.78) p < 0.001 | 0.75 ** (0.67–0.83) p < 0.001 | ||
| Sulfonylureas | 0.75 * (0.57–0.99) p = 0.046 | 0.72 * (0.53–0.97) p = 0.033 | 0.78 (0.56–1.08) p = 0.129 | ||
| Statins | 1.34 ** (1.25–1.43) p < 0.001 | 0.83 ** (0.76–0.90) p < 0.001 | 0.79 ** (0.72–0.86) p < 0.001 | ||
| Heparin | 2.14 ** (2.00–2.30) p < 0.001 | 1.51 ** (1.38–1.65) p < 0.001 | |||
| Enoxaparin | 1.37 ** (1.28–1.47) p < 0.001 | 0.92 (0.84–1.01) p = 0.096 | |||
| Apixaban | 1.27 ** (1.15–1.41) p < 0.001 | 0.61 ** (0.54–0.69) p < 0.001 | |||
| Steroids | 3.84 ** (3.57–4.13) p < 0.001 | 2.71 ** (2.48–2.97) p < 0.001 | |||
| Tocilizumab | 3.44 ** (2.92–4.06) p < 0.001 | 1.49 ** (1.22–1.82) p < 0.001 | |||
| Remdesivir | 1.61 ** (1.29–2.02) p < 0.001 | 0.54 ** (0.42–0.71) p < 0.001 | |||
| Convalescent Plasma | 3.97 ** (3.34–4.72) p < 0.001 | 1.10 (0.88–1.39) p = 0.406 | |||
| Cefepime | 5.63 ** (5.15–6.17) p < 0.001 | 3.06 ** (2.74–3.41) p < 0.001 |
| Univariate Analysis | Multivariate Analysis | Multivariate Analysis | Multivariate Analysis | Multivariate Analysis | |
|---|---|---|---|---|---|
| Model 1 | Model 2 | Model 3 | Model 4 | ||
| n = 11,371 | n = 11,371 | n = 11,371 | n = 11,371 | ||
| Variables | OR (95% CI), p-Value | OR (95% CI), p-Value | OR (95% CI), p-Value | OR (95% CI), p-Value | OR (95% CI), p-Value |
| Age per 10 years | 1.61 ** (1.57–1.65) p < 0.001 | 1.67 ** (1.62–1.72) p < 0.001 | 1.69 ** (1.63–1.74) p < 0.001 | 1.71 ** (1.65–1.77) p < 0.001 | 1.76 ** (1.70–1.83) p < 0.001 |
| Male sex | 1.18 ** (1.10–1.28) p < 0.001 | 1.47 ** (1.34–1.61) p < 0.001 | 1.46 ** (1.32–1.61) p < 0.001 | 1.47 ** (1.33–1.62) p < 0.001 | 1.34 ** (1.20–1.48) p < 0.001 |
| BMI | 1.00 (1.00–1.01) p = 0.154 | 1.04 ** (1.03–1.04) p < 0.001 | 1.03 ** (1.03–1.04) p < 0.001 | 1.04 ** (1.03–1.04) p < 0.001 | 1.03 ** (1.03–1.04) p < 0.001 |
| Diabetic Ketoacidosis | 1.94 ** (1.51–2.49) p < 0.001 | 2.57 ** (1.92–3.43) p < 0.001 | 1.95 ** (1.42–2.68) p < 0.001 | 1.95 ** (1.41–2.70) p < 0.001 | 1.95 ** (1.37–2.76) p < 0.001 |
| History of DM | 2.09 ** (1.93–2.26) p < 0.001 | 2.09 ** (1.90–2.30) p < 0.001 | 2.54 ** (2.28–2.85) p < 0.001 | 1.85 ** (1.64–2.09) p < 0.001 | |
| Type 1 Diabetes | 0.65 (0.36–1.19) p = 0.166 | 0.36 * (0.16–0.81) p = 0.014 | 0.35 * (0.15–0.82) p = 0.016 | 0.37 * (0.16–0.88) p = 0.024 | |
| Hypertension | 0.73 ** (0.66–0.80) p < 0.001 | 0.53 ** (0.46–0.60) p < 0.001 | 0.59 ** (0.51–0.68) p < 0.001 | 0.56 ** (0.48–0.65) p < 0.001 | |
| Hyperlipidemia | 0.80 ** (0.69–0.92) p = 0.001 | 0.85 (0.71–1.01) p = 0.064 | 0.96 (0.80–1.16) p = 0.658 | 1.09 (0.90–1.33) p = 0.376 | |
| Pulmonary Hypertension | 0.95 (0.49–1.83) p = 0.871 | 1.06 (0.47–2.35) p = 0.895 | 0.99 (0.43–2.26) p = 0.982 | 1.02 (0.37–2.83) p = 0.962 | |
| COPD | 1.02 (0.77–1.35) p = 0.904 | 1.19 (0.86–1.65) p = 0.288 | 1.25 (0.90–1.75) p = 0.190 | 1.06 (0.73–1.53) p = 0.773 | |
| Asthma | 0.49 ** (0.38–0.62) p < 0.001 | 0.64 ** (0.49–0.84) p = 0.001 | 0.66 ** (0.50–0.87) p = 0.003 | 0.56 ** (0.42–0.75) p < 0.001 | |
| CAD | 0.97 (0.77–1.21) p = 0.773 | 0.85 (0.64–1.12) p = 0.249 | 0.93 (0.69–1.24) p = 0.615 | 0.98 (0.72–1.34) p = 0.919 | |
| Heart Failure | 0.78 ** (0.65–0.94) p = 0.010 | 0.62 ** (0.49–0.79) p < 0.001 | 0.68 ** (0.54–0.87) p = 0.002 | 0.83 (0.64–1.07) p = 0.144 | |
| Stroke/TIA | 0.66 * (0.46–0.97) p = 0.032 | 0.48 ** (0.31–0.75) p = 0.001 | 0.51 ** (0.33–0.81) p = 0.004 | 0.56 * (0.35–0.91) p = 0.018 | |
| ESRD | 1.33 ** (1.11–1.59) p = 0.002 | 1.63 ** (1.29–2.07) p < 0.001 | 1.58 ** (1.24–2.02) p < 0.001 | 1.15 (0.89–1.49) p = 0.295 | |
| Chronic Kidney Disease | 1.24 * (1.05–1.46) p = 0.010 | 1.05 (0.85–1.29) p = 0.677 | 1.02 (0.82–1.27) p = 0.864 | 1.08 (0.86–1.37) p = 0.497 | |
| Biguanides | 0.55 ** (0.47–0.65) p < 0.001 | 0.57 ** (0.47–0.69) p < 0.001 | 0.70 ** (0.57–0.87) p = 0.001 | ||
| DPP4 inhibitors | 0.75 ** (0.64–0.88) p < 0.001 | 0.78 * (0.64–0.95) p = 0.014 | 0.84 (0.68–1.03) p = 0.100 | ||
| SGLT-2 inhibitors | 0.77 (0.28–2.07) p = 0.601 | 1.13 (0.33–3.89) p = 0.847 | 0.86 (0.16–4.60) p = 0.858 | ||
| GLP-1 agonists | 1.03 (0.65–1.64) p = 0.896 | 1.22 (0.66–2.24) p = 0.523 | 1.35 (0.71–2.57) p = 0.364 | ||
| Insulin | 1.34 ** (1.24–1.45) p < 0.001 | 0.94 (0.84–1.06) p = 0.343 | 0.95 (0.84–1.08) p = 0.434 | ||
| ACE inhibitors | 0.69 ** (0.62–0.76) p < 0.001 | 0.58 ** (0.51–0.65) p < 0.001 | 0.61 ** (0.53–0.70) p < 0.001 | ||
| Sulfonylureas | 0.77 (0.58–1.04) p = 0.088 | 0.83 (0.57–1.21) p = 0.334 | 0.86 (0.57–1.29) p = 0.460 | ||
| Statins | 1.28 ** (1.19–1.39) p < 0.001 | 0.92 (0.82–1.02) p = 0.109 | 0.85 ** (0.76–0.95) p = 0.004 | ||
| Heparin | 2.69 ** (2.48–2.91) p < 0.001 | 2.02 ** (1.81–2.26) p < 0.001 | |||
| Enoxaparin | 0.92 * (0.85–0.99) p = 0.036 | 0.98 (0.87–1.11) p = 0.760 | |||
| Apixaban | 0.97 (0.86–1.09) p = 0.588 | 0.52 ** (0.44–0.61) p < 0.001 | |||
| Steroids | 3.51 ** (3.23–3.81) p < 0.001 | 3.01 ** (2.69–3.38) p < 0.001 | |||
| Tocilizumab | 2.07 ** (1.76–2.42) p < 0.001 | 1.37 ** (1.11–1.69) p = 0.003 | |||
| Remdesivir | 0.93 (0.74–1.17) p = 0.557 | 0.54 ** (0.41–0.71) p < 0.001 | |||
| Convalescent Plasma | 2.38 ** (2.00–2.83) p < 0.001 | 1.05 (0.82–1.34) p = 0.708 | |||
| Cefepime | 4.52 ** (4.08–5.02) p < 0.001 | 3.13 ** (2.74–3.58) p < 0.001 |
| Univariate Analysis | Multivariate Analysis | Multivariate Analysis | Multivariate Analysis | Multivariate Analysis | |
|---|---|---|---|---|---|
| Model 1 | Model 2 | Model 3 | Model 4 | ||
| n = 422 | n = 422 | n = 422 | n = 422 | ||
| Variables | OR (95% CI), p-Value | OR (95% CI), p-Value | OR (95% CI), p-Value | OR (95% CI), p-Value | OR (95% CI), p-Value |
| Age per 10 | 1.61 ** (1.38–1.88) p < 0.001 | 1.64 ** (1.38–1.94) p < 0.001 | 1.67 ** (1.37–2.05) p < 0.001 | 1.72 ** (1.40–2.12) p < 0.001 | 1.81 ** (1.44–2.27) p < 0.001 |
| Male | 0.87 (0.54–1.41) p = 0.568 | 1.35 (0.73–2.49) p = 0.333 | 1.47 (0.75–2.85) p = 0.261 | 1.70 (0.86–3.39) p = 0.130 | 2.08 (0.92–4.70) p = 0.079 |
| BMI | 1.02 (1.00–1.05) p = 0.100 | 1.05 ** (1.02–1.08) p = 0.003 | 1.05 ** (1.02–1.09) p = 0.002 | 1.05 ** (1.02–1.09) p = 0.003 | 1.04 (1.00–1.09) p = 0.074 |
| COVID-19 | 10.05 ** (5.15–19.59) p < 0.001 | 10.08 ** (4.91–20.70) p < 0.001 | 10.31 ** (5.12–20.76) p < 0.001 | 10.26 ** (4.91–21.40) p < 0.001 | 8.56 ** (3.23–22.74) p < 0.001 |
| Type 1 Diabetes | 0.32 ** (0.16–0.67) p = 0.002 | 0.67 (0.28–1.62) p = 0.379 | 0.63 (0.25–1.56) p = 0.317 | 0.66 (0.23–1.90) p = 0.440 | |
| Hypertension | 0.83 (0.47–1.46) p = 0.513 | 0.50 (0.24–1.05) p = 0.066 | 0.62 (0.29–1.32) p = 0.216 | 0.57 (0.24–1.32) p = 0.188 | |
| Hyperlipidemia | 2.22 * (1.15–4.30) p = 0.018 | 3.13 * (1.13–8.66) p = 0.028 | 3.84 ** (1.44–10.28) p = 0.007 | 6.91 ** (2.49–19.22) p < 0.001 | |
| Asthma | 0.65 (0.14–3.01) p = 0.585 | 1.06 (0.35–3.25) p = 0.914 | 1.04 (0.29–3.73) p = 0.955 | 0.43 (0.11–1.76) p = 0.241 | |
| CAD | 0.91 (0.10–8.25) p = 0.932 | 0.25 (0.01–7.41) p = 0.422 | 0.18 (0.01–6.28) p = 0.343 | 0.17 (0.01–3.43) p = 0.246 | |
| Heart Failure | 0.51 (0.11–2.28) p = 0.378 | 0.20 (0.01–2.91) p = 0.241 | 0.18 (0.01–3.64) p = 0.261 | 0.58 (0.05–6.33) p = 0.655 | |
| ESRD | 1.04 (0.33–3.25) p = 0.945 | 2.54 (0.22–29.04) p = 0.455 | 2.98 (0.19–46.75) p = 0.437 | 5.62 (0.76–41.46) p = 0.090 | |
| CKD | 0.74 (0.28–2.01) p = 0.559 | 0.58 (0.12–2.92) p = 0.513 | 0.60 (0.10–3.84) p = 0.594 | 0.46 (0.04–4.67) p = 0.509 | |
| Biguanides | 0.87 (0.42–1.82) p = 0.718 | 1.00 (0.42–2.41) p = 0.999 | 1.35 (0.53–3.43) p = 0.532 | ||
| DPP4 inhibitors | 0.78 (0.43–1.42) p = 0.421 | 0.50 (0.22–1.12) p = 0.094 | 0.52 (0.21–1.27) p = 0.153 | ||
| GLP-1 agonists | 1.83 (0.16–20.44) p = 0.624 | 1.54 (0.26–9.04) p = 0.634 | 0.78 (0.13–4.53) p = 0.780 | ||
| Insulin | 0.67 (0.41–1.09) p = 0.109 | 0.89 (0.48–1.67) p = 0.721 | 1.05 (0.52–2.12) p = 0.893 | ||
| ACE inhibitors | 0.52 * (0.29–0.91) p = 0.022 | 0.51 (0.23–1.10) p = 0.085 | 0.46 (0.19–1.14) p = 0.093 | ||
| Sulfonylureas | 1.47 (0.28–7.69) p = 0.652 | 2.01 (0.42–9.66) p = 0.384 | 3.38 (0.46–24.84) p = 0.232 | ||
| Statins | 1.10 (0.69–1.75) p = 0.699 | 0.89 (0.48–1.63) p = 0.706 | 0.91 (0.44–1.89) p = 0.808 | ||
| Heparin | 1.78 * (1.08–2.94) p = 0.024 | 1.66 (0.79–3.46) p = 0.178 | |||
| Enoxaparin | 1.51 (0.93–2.44) p = 0.094 | 0.96 (0.40–2.32) p = 0.929 | |||
| Apixaban | 1.84 (0.86–3.94) p = 0.116 | 0.35 (0.11–1.16) p = 0.086 | |||
| Steroids | 10.44 ** (6.12–17.82) p < 0.001 | 9.15 ** (4.25–19.73) p < 0.001 | |||
| Tocilizumab | 7.16 ** (2.33–21.96) p = 0.001 | 2.39 (0.36–15.97) p = 0.370 | |||
| Remdesivir | 3.70 (0.51–26.67) p = 0.195 | 1.54 (0.13–18.66) p = 0.735 | |||
| Convalescent Plasma | 4.51 ** (1.48–13.80) p = 0.008 | 0.16 * (0.03–0.89) p = 0.037 | |||
| Cefepime | 5.87 ** (3.29–10.48) p < 0.001 | 2.85 ** (1.40–5.79) p = 0.004 |
Publisher’s Note: MDPI stays neutral with regard to jurisdictional claims in published maps and institutional affiliations. |
© 2022 by the authors. Licensee MDPI, Basel, Switzerland. This article is an open access article distributed under the terms and conditions of the Creative Commons Attribution (CC BY) license (https://creativecommons.org/licenses/by/4.0/).
Share and Cite
Parthasarathy, S.; Chamorro-Pareja, N.; Kharawala, A.; Hupart, K.H.; Curcio, J.; Coyle, C.; Buchnea, D.; Karamanis, D.; Faillace, R.; Palaiodimos, L.; et al. Diabetic Ketoacidosis Was Associated with High Morbidity and Mortality in Hospitalized Patients with COVID-19 in the NYC Public Health System. Diabetology 2022, 3, 477-493. https://doi.org/10.3390/diabetology3030036
Parthasarathy S, Chamorro-Pareja N, Kharawala A, Hupart KH, Curcio J, Coyle C, Buchnea D, Karamanis D, Faillace R, Palaiodimos L, et al. Diabetic Ketoacidosis Was Associated with High Morbidity and Mortality in Hospitalized Patients with COVID-19 in the NYC Public Health System. Diabetology. 2022; 3(3):477-493. https://doi.org/10.3390/diabetology3030036
Chicago/Turabian StyleParthasarathy, Sahana, Natalia Chamorro-Pareja, Amrin Kharawala, Kenneth H Hupart, Joan Curcio, Christina Coyle, Daniel Buchnea, Dimitris Karamanis, Robert Faillace, Leonidas Palaiodimos, and et al. 2022. "Diabetic Ketoacidosis Was Associated with High Morbidity and Mortality in Hospitalized Patients with COVID-19 in the NYC Public Health System" Diabetology 3, no. 3: 477-493. https://doi.org/10.3390/diabetology3030036
APA StyleParthasarathy, S., Chamorro-Pareja, N., Kharawala, A., Hupart, K. H., Curcio, J., Coyle, C., Buchnea, D., Karamanis, D., Faillace, R., Palaiodimos, L., & Kishore, P. (2022). Diabetic Ketoacidosis Was Associated with High Morbidity and Mortality in Hospitalized Patients with COVID-19 in the NYC Public Health System. Diabetology, 3(3), 477-493. https://doi.org/10.3390/diabetology3030036