
Comparison between Policaptil Gel Retard and Metformin by Testing of Temporal Changes in Patients with Metabolic Syndrome and Type 2 Diabetes


 ,
, 
Abstract
:1. Introduction
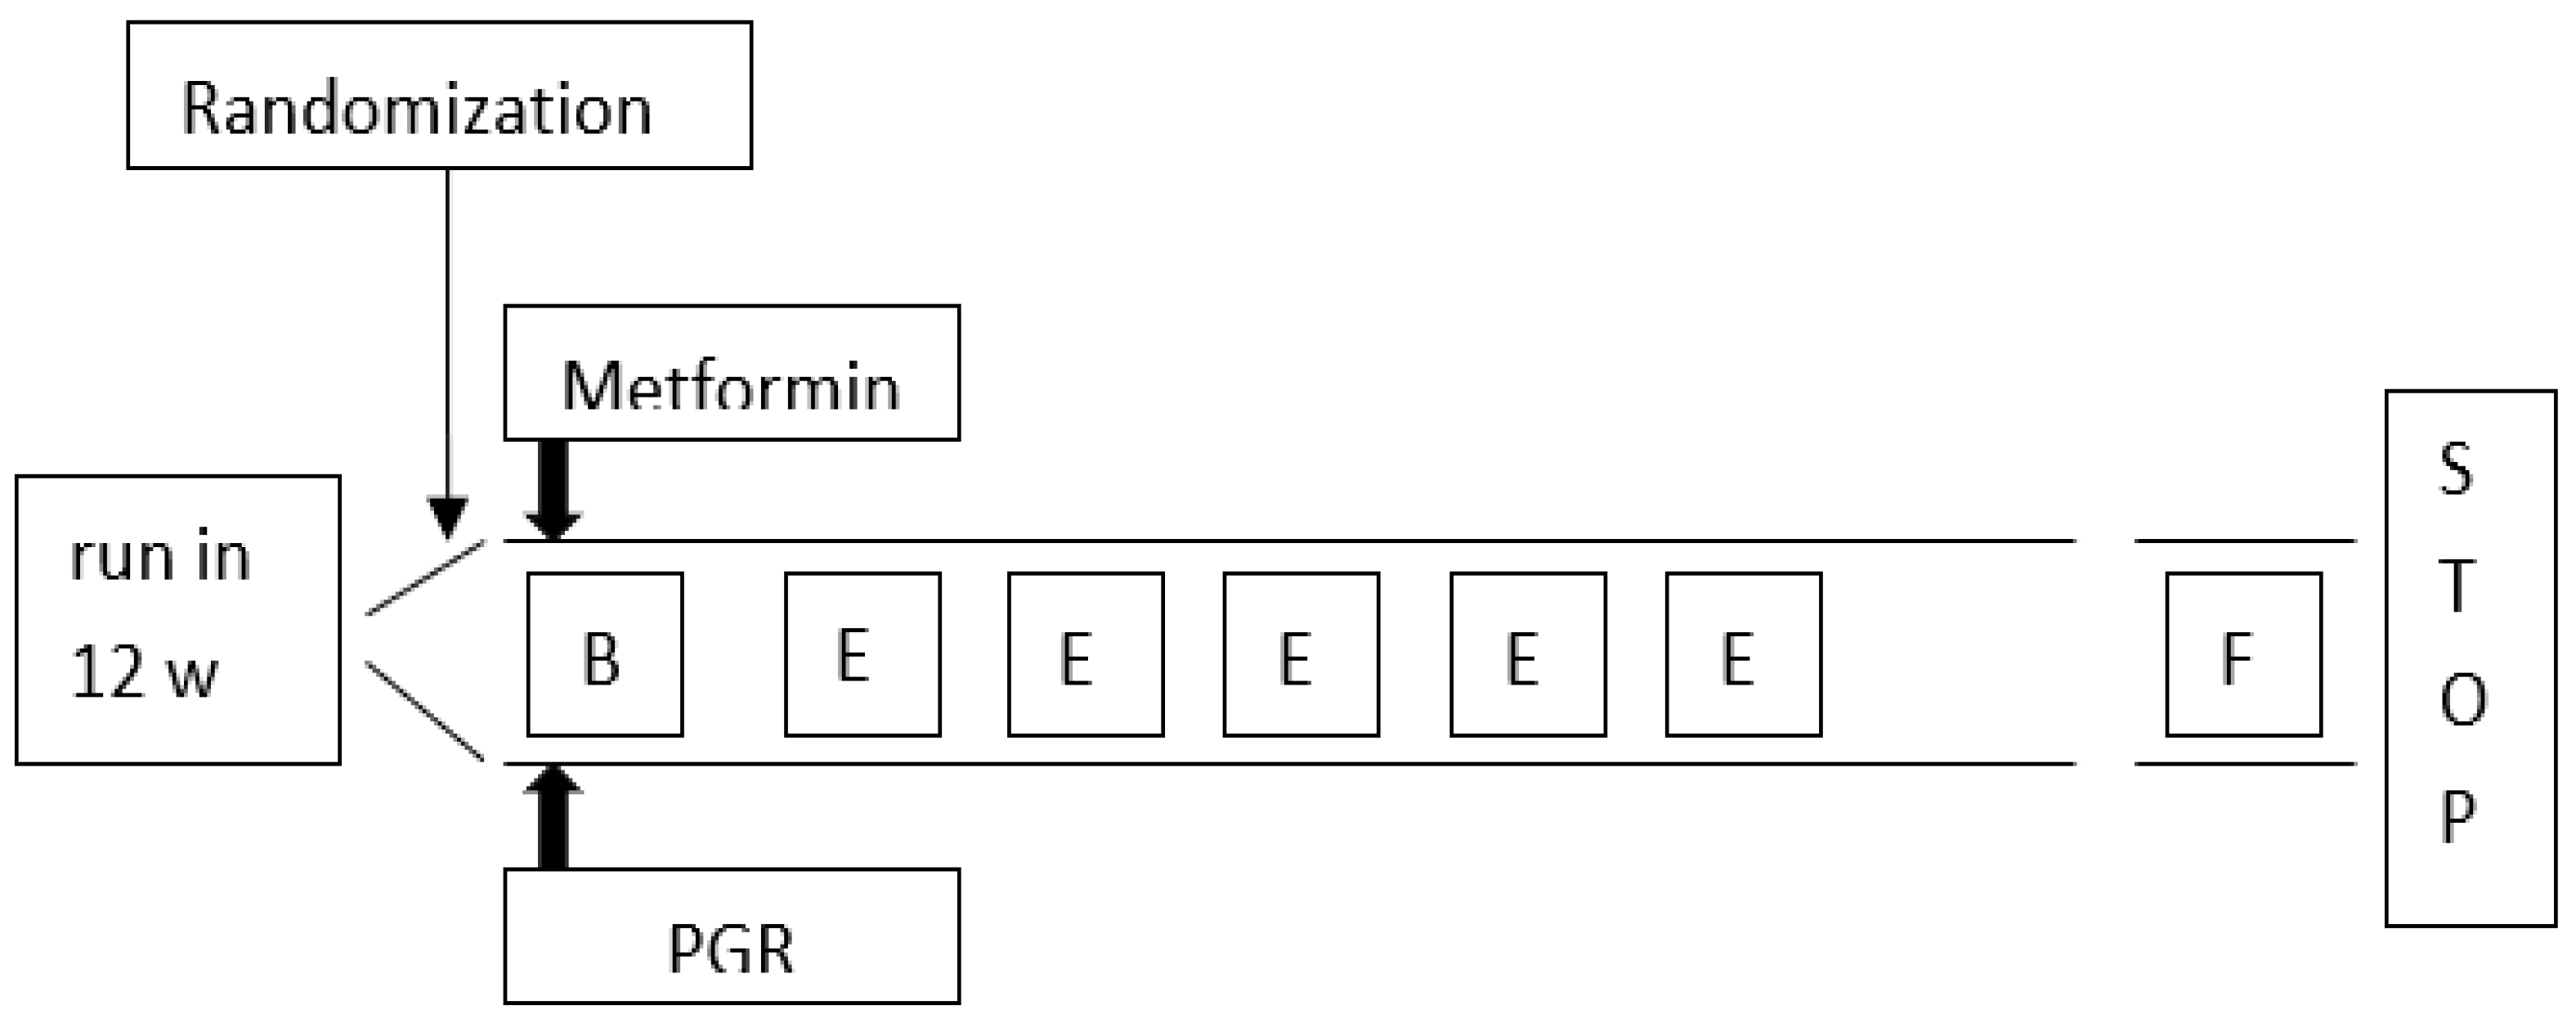
2. Methods
- MS (defined according to the consensus document 2009) [17];
- Age > 39 and <69 years;
- Body mass index (BMI) > 30 kg/m2;
- No previous major CV events (MACE);
- T2DM, known for no more than 1 year (±0.5) (ADA criteria 2021) [19];
- Altered lipid profile (TC ≥ 200 mg/dL, LDL- C ≥ 100 mg/dL);
- Reliability (visiting the clinic regularly);
- Acceptance of informed consent;
- Normal estimated glomerular filtration rate (eGFR) (60–90 mL/min/1.73 m2);
- No micro-macro-albuminuria.
- Exclusion criteria:
- Blood pressure and plasma lipid levels exceeding the above-mentioned range applicable to the individual CV risk calculator of the Heart Project;
- Previous bariatric or coronary surgery interventions;
- Pregnancy or breastfeeding;
- Disabling conditions, severe liver, kidney or neoplastic diseases, dementia and/or inability to regularly comply with prescriptions;
- Known hypersensitivity/intolerance to treatment or history of drug allergy or known allergic disease;
- Irritable bowel disease or dyspepsia.
3. Results
4. Discussion
5. Limitations
Supplementary Materials
Author Contributions
Funding
Institutional Review Board Statement
Informed Consent Statement
Data Availability Statement
Acknowledgments
Conflicts of Interest
References
- Scheen, A.J. Management of the metabolic syndrome. Minerva Endocrinol. 2004, 29, 31–45. [Google Scholar] [PubMed]
- Bianchi, C.; Penno, G.; Romero, F.; Del Prato, S.; Miccoli, R. Treating the metabolic syndrome. Expert Rev. Cardiovasc. Ther. 2007, 5, 491–506. [Google Scholar] [CrossRef]
- Gogia, A.; Agarwal, P.K. Metabolic syndrome. Indian J. Med. Sci. 2006, 60, 72–81. [Google Scholar] [CrossRef] [PubMed]
- Baños, G.; Perez-Torres, I.; El Hafidi, M. Medicinal Agents in the Metabolic Syndrome. Cardiovasc. Hematol. Agents Med. Chem. 2008, 6, 237–252. [Google Scholar] [CrossRef]
- Fornari, E.; Morandi, A.; Piona, C.; Tommasi, M.; Corradi, M.; Maffeis, C. Policaptil Gel Retard Intake Reduces Postprandial Triglycerides, Ghrelin and Appetite in Obese Children: A Clinical Trial. Nutrients 2020, 12, 214. [Google Scholar] [CrossRef] [Green Version]
- Stagi, S.; Lapi, E.; Seminara, S.; Pelosi, P.; Del Greco, P.; Capirchio, L.; Strano, M.; Giglio, S.; Chiarelli, F.; De Martino, M. Policaptil Gel Retard significantly reduces body mass index and hyperinsulinism and may decrease the risk of type 2 diabetes mellitus (T2DM) in obese children and adolescents with family history of obesity and T2DM. Ital. J. Pediatr. 2015, 41, 10. [Google Scholar] [CrossRef] [Green Version]
- Ellis, P.R.; Roberts, F.G.; Low, A.G.; Morgan, L.M. The effect of high-molecular-weight guar gum on net apparent glucose absorption and net apparent insulin and gastric inhibitory polypeptide production in the growing pig: Relationship to rheological changes in jejunal digesta. Br. J. Nutr. 1995, 74, 539–556. [Google Scholar] [CrossRef] [Green Version]
- Stagi, S.; Ricci, F.; Bianconi, M.; Sammarco, M.A.; Municchi, G.; Toni, S.; Lenzi, L.; Verrotti, A.; De Martino, M. Retrospective Evaluation of Metformin and/or Metformin Plus a New Polysaccharide Complex in Treating Severe Hyperinsulinism and Insulin Resistance in Obese Children and Adolescents with Metabolic Syndrome. Nutrients 2017, 9, 524. [Google Scholar] [CrossRef] [PubMed] [Green Version]
- Dludla, P.V.; Nyambuya, T.M.; Johnson, R.; Silvestri, S.; Orlando, P.; Mazibuko-Mbeje, S.E.; Gabuza, K.B.; Mxinwa, V.; Mokgalaboni, K.; Tiano, L.; et al. Metformin and heart failure-related outcomes in patients with or without diabetes: A systematic review of randomized controlled trials. Heart Fail. Rev. 2021, 26, 1437–1445. [Google Scholar] [CrossRef]
- Guarino, G.; Della Corte, T.; Strollo, F.; Gentile, S.; Nefrocenter Research Study Group. Policaptil Gel Retard in adult subjects with the metabolic syndrome: Efficacy, safety, and tolerability compared to metformin. Diabetes Metab. Syndr. Clin. Res. Rev. 2021, 15, 901–907. [Google Scholar] [CrossRef]
- Giampaoli, S.; Palmieri, L.; Donfrancesco, C.; Noce, C.L.; Pilotto, L.; Vanuzzo, D.; Osservatorio Epidemiologico Cardiovascolare/Health Examination Survey Research Group. Cardiovascular health in Italy. Ten-year surveillance of cardiovascular diseases and risk factors: Osservatorio Epidemiologico Cardiovascolare/Health Examination Survey 1998–2012. Eur. J. Prev. Cardiol. 2015, 22 (Suppl. S2), 9–37. [Google Scholar] [CrossRef] [PubMed]
- Giampaoli, S.; Palmieri, L.; Panico, S.; Vanuzzo, D.; Ferrario, M.; Chiodini, P.; Pilotto, L.; Donfrancesco, C.; Cesana, G.; Sega, R.; et al. Favorable Cardiovascular Risk Profile (Low Risk) and 10-Year Stroke Incidence in Women and Men: Findings from 12 Italian Population Samples. Am. J. Epidemiol. 2006, 163, 893–902. [Google Scholar] [CrossRef] [PubMed] [Green Version]
- Palmieri, L.; Donfrancesco, C.; Giampaoli, S.; Trojani, M.; Panico, S.; Vanuzzo, D.; Pilottoc, L.; Cesana, G.; Ferrario, M.M.; Chiodini, P.; et al. Favorable cardiovascular risk profile and 10-year coronary heart disease incidence in women and men: Results from the Progetto CUORE. Eur. J. Cardiovasc. Prev. Rehabil. 2006, 13, 562–570. [Google Scholar] [CrossRef] [PubMed]
- Ferrario, M.; Chiodini, P.; Chambless, L.E.; Cesana, G.; Vanuzzo, D.; Panico, S.; Sega, R.; Pilotto, L.; Palmieri, L.; Giampaoli, S.; et al. Prediction of coronary events in a low incidence population. Assessing accuracy of the CUORE Cohort Study prediction equation. Int. J. Epidemiol. 2005, 34, 413–421. [Google Scholar] [CrossRef] [Green Version]
- Giorda, C.B.; Nicolucci, A.; Pellegrini, F.; Kristiansen, C.K.; Hunt, B.; Valentine, W.J.; Vespasiani, G. Improving quality of care in people with Type 2 diabetes through the Associazione Medici Diabetologi-annals initiative: A long-term cost-effectiveness analysis. Diabet. Med. 2014, 31, 615–623. [Google Scholar] [CrossRef]
- Manicardi, V.; Clemente, G.; De Cosmo, S.; Manti, R.; Mazzucchelli, C.; Pisanu, P.; Rocca, A. Valutazione Degli Indicatori AMD di Qualità Dell’assistenza al Diabete Tipo 1 e 2 in Italia. The Monograph of AMD Annals 2018; Idelson Gnocchi: Naples, Italy; Available online: https://aemmedi.it/wp-content/uploads/2018/11/Annali_AMD-_2018_prot.pdf (accessed on 22 December 2021).
- Alberti, K.G.M.M.; Eckel, R.H.; Grundy, S.M.; Zimmet, P.Z.; Cleeman, J.I.; Donato, K.A.; Fruchart, J.C.; James, W.P.T.; Loria, C.M.; Smith, S.C., Jr.; et al. Harmonizing the metabolic syndrome: A joint interim statement of the international diabetes federation task force on epidemiology and prevention. Circulation 2009, 120, 1640–1645. [Google Scholar] [CrossRef] [Green Version]
- National Center for Health Statistics. International Classification of Diseases, 9th Revision, Clinical Modification (ICD-9-CM). Available online: http://www.cdc.gov/nchs/icd/icd9cm.htm (accessed on 15 March 2022).
- American Diabetes Association. 2. Classification and Diagnosis of Diabetes: Standards of Medical Care in Diabetes. Diabetes Care 2021, 44 (Suppl. S1), S15–S33, Erratum in Diabetes Care 2021, 44, 2182. [Google Scholar] [CrossRef]
- Cicero, A.F.; Nascetti, S.; Noera, G.; Gaddi, A.V.; Massa Lombarda Project team. Metabolic syndrome prevalence in Italy. Nutr. Metab. Cardiovasc. Dis. 2006, 16, e5–e6. [Google Scholar] [CrossRef]
- Baranauskas, M.N.; Johnson, K.E.; Juvancic-Heltzel, J.A.; Kappler, R.M.; Richardson, L.; Jamieson, S.; Otterstetter, R. Seven-site versus three-site method of body composition using Body Metrix ultrasound compared to dual-energy X-ray absorptiometry. Clin. Physiol. Funct. Imaging 2017, 37, 317–321. [Google Scholar] [CrossRef]
- Guarino, G.; Ragozzino, G.; Della Corte, T.; Fontana, S.; Strollo, F.; Cecaro, M.; Gentile, S. Selenium supplementation in obese patients with subclinical hypothyroidism and type 2 diabetes. J. Nutr. Health Sci. 2018, 5, 202. Available online: http://www.annexpublishers.co/articles/JNH/5202-Selenium-Supplementation-in-Obese-Patients-with-Subclinical-Hypothyroidism-and-Type-2-Diabetes.pdf (accessed on 22 December 2021).
- Dekker, J.M.; Girman, C.; Rhodes, T.; Nijpels, G.; Stehouwer, C.D.A.; Bouter, L.M.; Heine, R.J. Metabolic Syndrome and 10-Year Cardiovascular Disease Risk in the Hoorn Study. Circulation 2005, 112, 666–673. [Google Scholar] [CrossRef] [PubMed]
- Expert Panel on Detection, Evaluation, and Treatment of High Blood Cholesterol in Adults. Executive Summary of the Third Report of the National Cholesterol Education Program (NCEP) Expert Panel on Detection, Evaluation, and Treatment of High Blood Cholesterol in Adults (Adult Treatment Panel III). JAMA 2001, 285, 2486–2497. [CrossRef]
- Tocci, G.; Ferrucci, A.; Bruno, G.; Mannarino, E.; Nati, G.; Trimarco, B.; Volpe, M. Prevalence of metabolic syndrome in the clinical practice of general medicine in Italy. Cardiovasc. Diagn. Ther. 2015, 5, 271–279. [Google Scholar] [CrossRef] [PubMed] [Green Version]
- Rubio-Ruiz, M.; El Hafidi, M.; Perez-Torres, I.; Banos, G.; Guarner, V. Medicinal agents and metabolic syndrome. Curr. Med. Chem. 2013, 20, 2626–2640. [Google Scholar] [CrossRef]
- Rodondi, N.; Locatelli, I.; Aujesky, D.; Butler, J.; Vittinghoff, E.; Simonsick, E.; Satterfield, S.; Newman, A.B.; Wilson, P.W.F.; Pletcher, M.J.; et al. Framingham Risk Score and Alternatives for Prediction of Coronary Heart Disease in Older Adults. PLoS ONE 2012, 7, e34287. [Google Scholar] [CrossRef] [PubMed] [Green Version]
- D’Agostino, R.B., Sr.; Vasan, R.S.; Pencina, M.J.; Wolf, P.A.; Cobain, M.; Massaro, J.M.; Kannel, W.B. General Cardiovascular Risk Profile for Use in Primary Care: The Framingham Heart Study. Circulation 2008, 117, 743–753. [Google Scholar] [CrossRef] [PubMed] [Green Version]
- Genest, J.; McPherson, R.; Frohlich, J.; Anderson, T.; Campbell, N.; Carpentier, A.; Couture, P.; Dufour, R.; Fodor, G.; Francis, G.A.; et al. 2009 Canadian Cardiovascular Society/Canadian guidelines for the diagnosis and treatment of dyslipidemia and prevention of cardiovascular disease in the adult—2009 recommendations. Can. J. Cardiol. 2009, 25, 567–579. [Google Scholar] [CrossRef] [Green Version]
- Ridker, P.M.; Buring, J.E.; Rifai, N.; Cook, N.R. Development and Validation of Improved Algorithms for the Assessment of Global Cardiovascular Risk in Women: The Reynolds Risk Score. JAMA 2007, 297, 611–619, Erratum in JAMA 2007, 297, 1433. [Google Scholar] [CrossRef] [PubMed]
- Ridker, P.M.; Paynter, N.P.; Rifai, N.; Gaziano, J.M.; Cook, N.R. C-Reactive Protein and Parental History Improve Global Cardiovascular Risk Prediction. Circulation 2008, 118, 2243–2251. [Google Scholar] [CrossRef] [Green Version]
- Artigao-Rodenas, L.M.; Carbayo-Herencia, J.A.; Divisón-Garrote, J.A.; Gil-Guillén, V.F.; Massó-Orozco, J.; Simarro-Rueda, M.; Molina-Escribano, F.; Sanchis, C.; Carrión-Valero, L.; de Coca, E.L.; et al. Framingham Risk Score for Prediction of Cardiovascular Diseases: A Population-Based Study from Southern Europe. PLoS ONE 2013, 8, e73529. [Google Scholar] [CrossRef] [PubMed] [Green Version]
- Istituto Superiore di Sanità. Carta del Rischio Cardiovascolare. Progetto CUORE 2016. Web Site. Available online: http://www.cuore.iss.it/valutazione/carte-pdf.pdf (accessed on 22 December 2021).
- Nesti, L.; Natali, A. Metformin effects on the heart and the cardiovascular system: A review of experimental and clinical data. Nutr. Metab. Cardiovasc. Dis. 2017, 27, 657–669. [Google Scholar] [CrossRef] [PubMed]
- Cosentino, F.; Grant, P.J.; Aboyans, V.; Bailey, C.J.; Ceriello, A.; Delgado, V.; Federici, M.; Filippatos, G.; Grobbee, D.E.; Hansen, T.B.; et al. 2019 ESC Guidelines on diabetes, pre-diabetes, and cardiovascular diseases developed in collaboration with the EASD. Eur. Heart J. 2020, 41, 255–323, Erratum in Eur. Heart J. 2020, 41, 4317. [Google Scholar] [CrossRef] [PubMed] [Green Version]
- Briones, R.; Sarmah, A.K.; Padhye, L. A global perspective on the use, occurrence, fate and effects of anti-diabetic drug metformin in natural and engineered ecosystems. Environ. Pollut. 2016, 219, 1007–1020. [Google Scholar] [CrossRef] [PubMed]


| Group A PGR | Group B Metformin | p | |
| Subjects (n) | 75 | 75 | - |
| Male (n) | 35 | 34 | n.s. |
| Age (year) | 64 ± 6 | 64 ± 8 | n.s. |
| Waist circumference (cm) | 115 ± 11 | 115 ± 10 | n.s. |
| BMI (kg/m2) | 35 ± 6 | 35 ± 4 | n.s. |
| Systolic Blood Pressure (mmHg) | 135.8 ± 12.4 | 136.7 ± 11.5 | n.s. |
| Diastolic Blood Pressure (mmHg) | 83.4 ± 7.6 | 82.8 ± 7.6 | n.s. |
| Heart rate (beats/min) | 76.5 ± 6.6 | 74.8 ± 9.1 | n.s. |
| Fasting plasma glucose (mg/dL) | 189 ± 10.2 | 190 ± 9.9 | n.s. |
| HbA1c (%) | 7.8 ± 0.9 | 7.8 ± 0.9 | n.s. |
| Total cholesterol (mg/dL) | 231 ± 23 | 238 ± 25 | n.s. |
| LDL cholesterol (mg/dL) | 157 ± 16 | 155 ± 19 | n.s. |
| HDL-Cholesterol (mg/dL) | 35 ± 6 | 35 ± 5 | n.s. |
| Triglycerides (mg/dL) | 199 ± 28 | 203 ± 25 | n.s. |
| AST (UI/L) | 32 ± 7 | 38 ± 7 | n.s. |
| ALT (UI/L) | 27 ± 9 | 28 ± 8 | n.s. |
| γGT (UI/L) | 27 ± 6 | 25 ± 8 | n.s. |
| Uric Acid (mg/dL) | 7.1 ± 1.4 | 7.3 ± 1.6 | n.s. |
| Creatinine (mg/dL) | 0.8 ± 0.2 | 0.8 ± 0.1 | n.s. |
| Cardio-vascular risk factors | |||
| Meeting diagnostic criteria for metabolic syndrome (%) | 100 | 100 | - |
| Visceral fat (% of total body weight) (M ± SD) | 24 ± 8 | 24 ± 5 | n.s. |
| Recent or current smokers (%) | 55 | 55 | n.s. |
| Low HDL cholesterol concentrations (%) | 60 | 62 | n.s. |
| Family history of premature heart disease (%) | 16 | 15 | n.s. |
| Hypertension (%) | 58 | 59 | n.s. |
|
Group A PGR (n = 72) |
Group B Metformin (n = 70) | |||||
|---|---|---|---|---|---|---|
| Baseline (T0) | End of Follow-up (T6) | p | Baseline (T0) | End of Follow-up (T6) | p | |
| Age (years) | 62 ± 5 | 62 ± 7 | - | 62 ± 4 | 62 ± 6 | - |
| Sex (M/F) | 35/40 | 35/40 | - | 34/41 | 34/41 | - |
| FPG (mg/dL) a | 189 ± 10.2 | 128 ± 13 | <0.01 | 190 ± 9.9 | 137 ± 11 | <0.01 |
| Smoking (n) b | 58 | 58 | n.s. | 55 | 55 | n.s. |
| SBP (1st) mmHg | 135.8 ± 12.4 | 129 ± 12 | n.s. | 136.7 ± 11.5 | 130 ± 10 | n.s. |
| SBP (2nd) mmHg | 134.7 ± 10.6 | 130 + 14 | n.s. | 134.9 ± 10.3 | 131 ± 09 | n.s. |
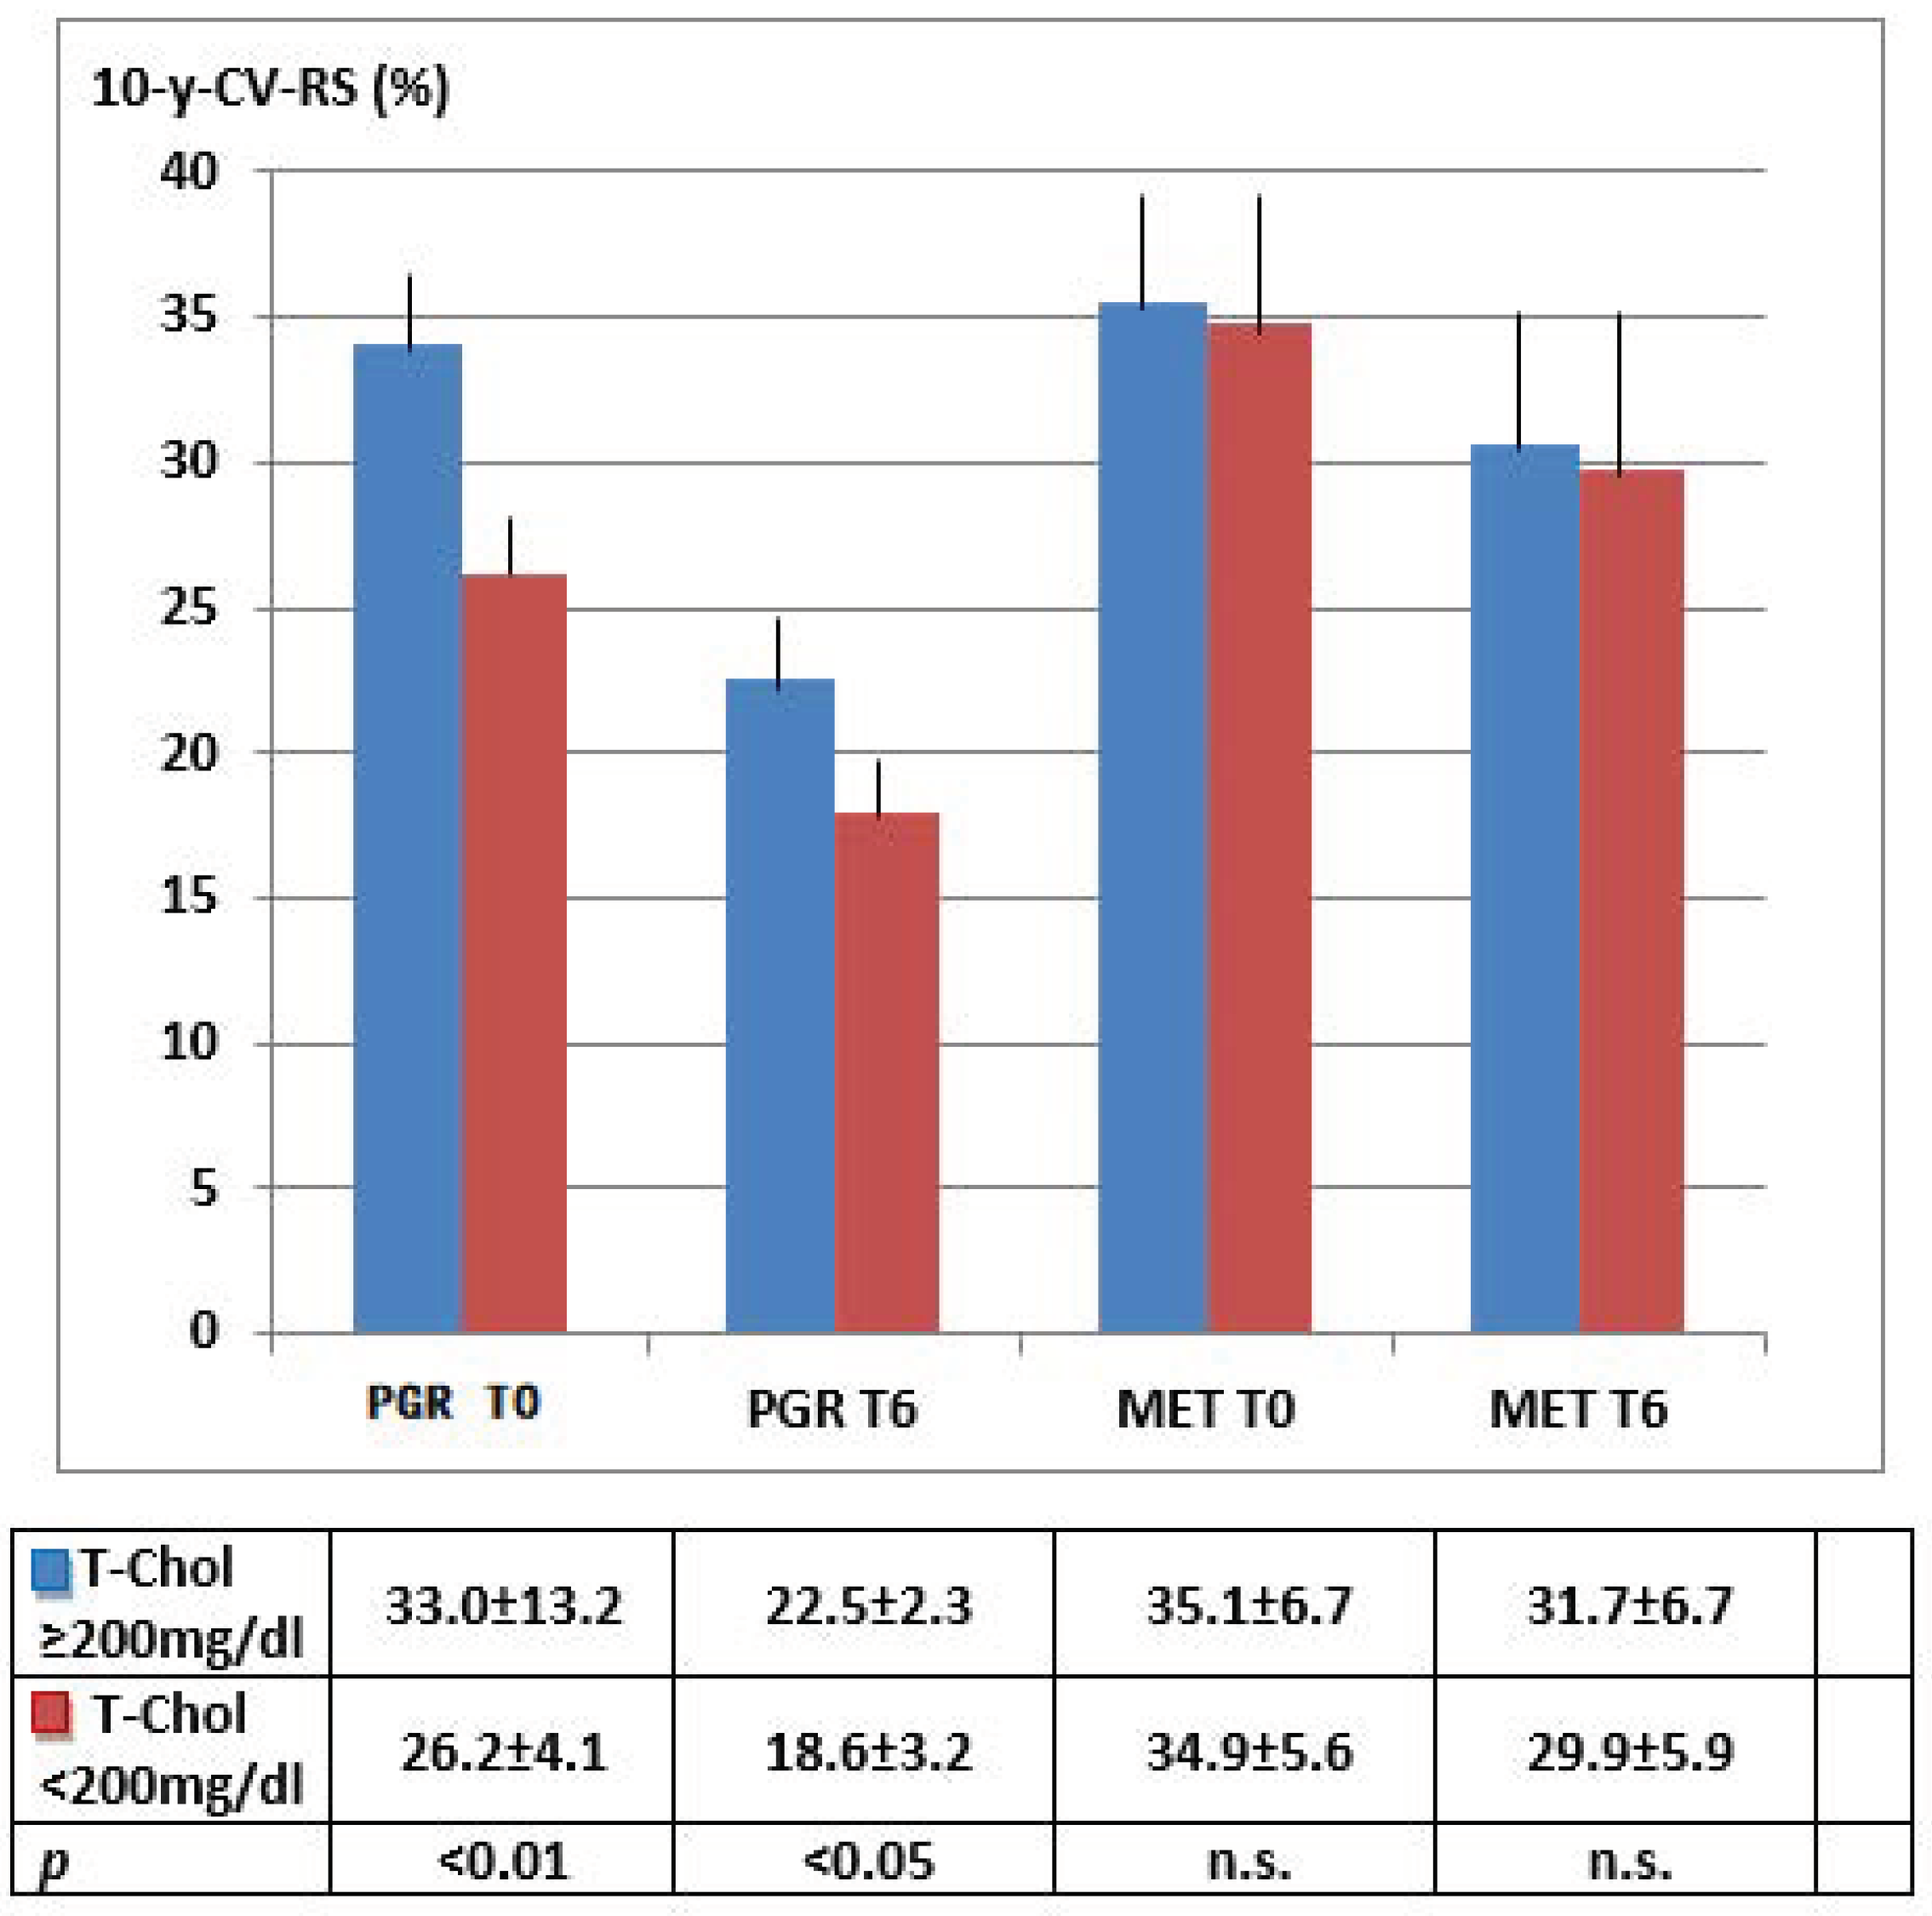
| TC (mg/dL) | 231 ± 23 | 184 ± 11 | <0.01 | 238 ± 25 | 224 ± 12 | n.s. |
| HDL-C (mg/dL) | 35 ± 6 | 44 ± 4 | <0.05 | 35 ± 5 | 38 ± 6 | n.s. |
| Hypertension (%) c | 56 | 56 | - | 59 | 59 | - |
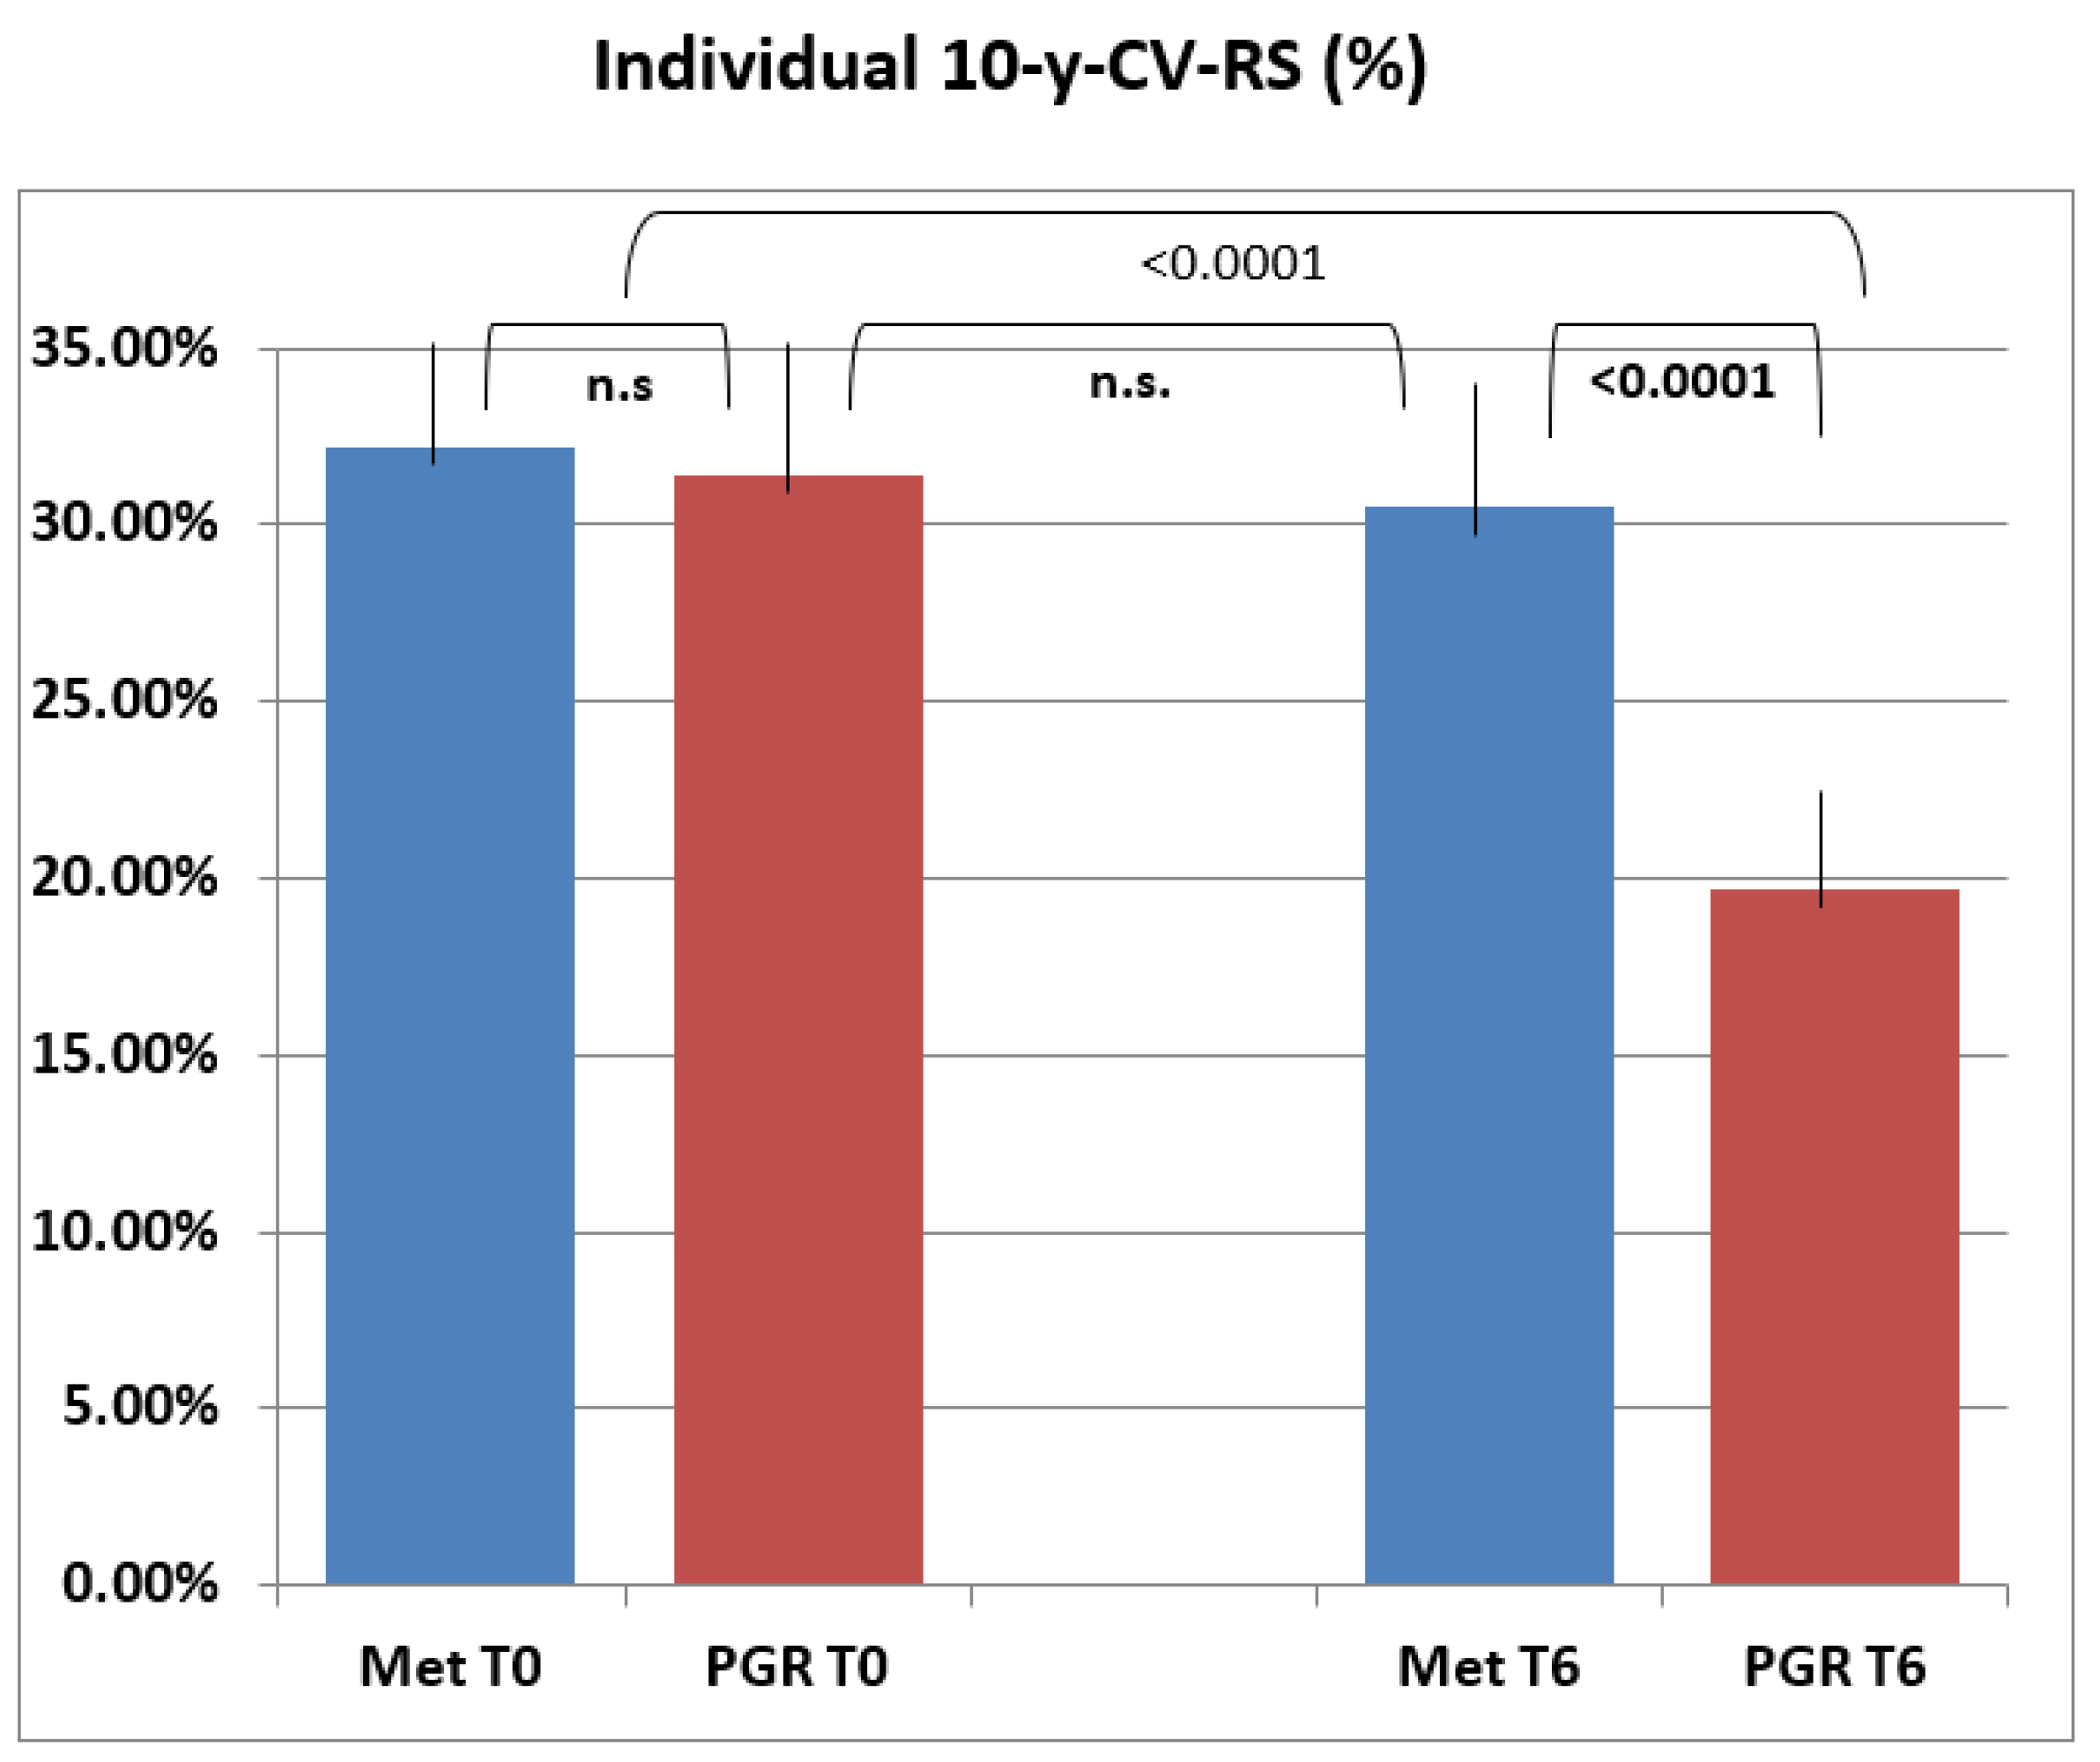
| 10-y-CV-RS | 31.4 ± 8.0 | 19.7 ± 5.2 | <0.0001 | 32.2 ± 3.3 | 30.5 ± +8.7 | n.s. |
| OTHER METABOLIC PARAMETERS | ||||||
| BMI (kg/m2) | 35 ± 6 | 28 ± 3 | <0.01 | 35 ± 4 | 30 ± 3 | <0.05 |
| Visceral fat (% of total body weight) (M + SD) | 24 ± 8 | 14 ± 3 | <0.01 | 24 ± 5 | 15 ± 9 | <0.01 |
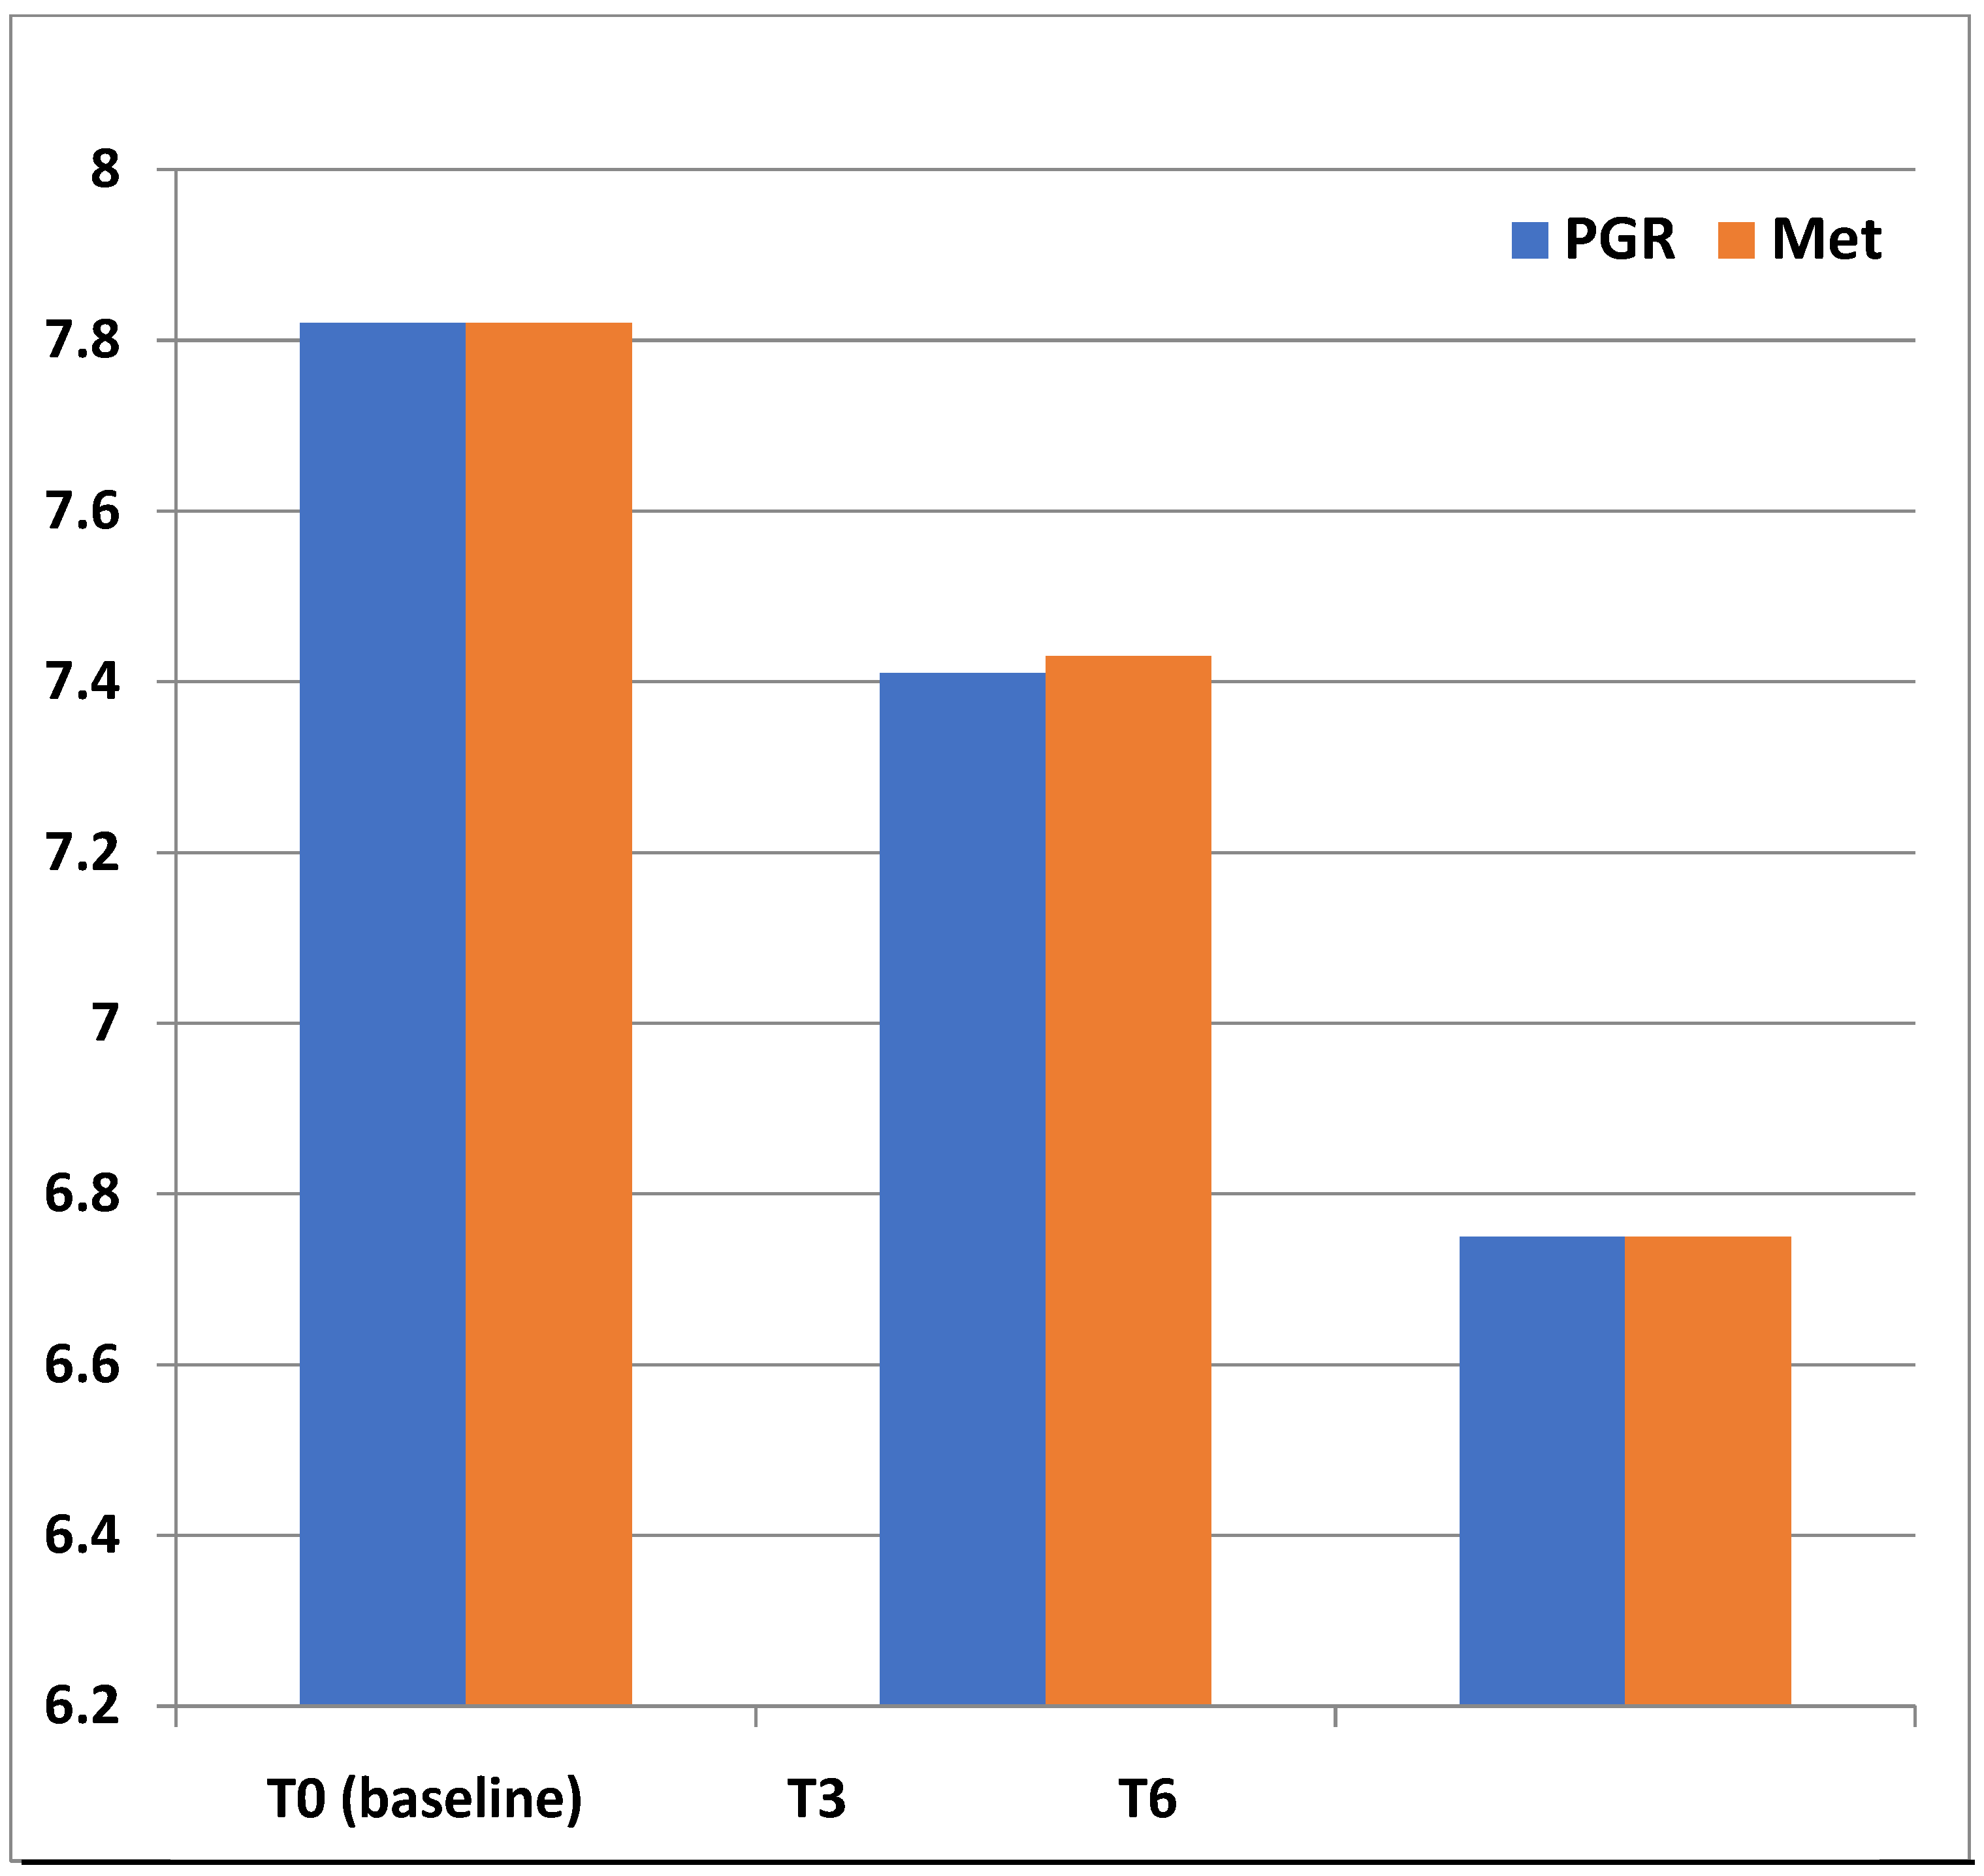
| HbA1c (%) | 7.8 ± 0.9 | 6.0 ± 1.4 | <0.001 | 7.8 ± 0.9 | 6.0 ± 1.1 | <0.001 |
| DBP (mmHg) | 83.4 ± 7.6 | 79.5 ± 6.4 | n.s. | 82.8 ± 7.6 | 78.5 ± 6.3 | n.s. |
| LDL-C (mg/dL) | 157 ± 16 | 101.3 ± 2.5 | <0.01 | 155 ± 12 | 148.5 ± 7.4 | n.s. |
| Triglycerides (mg/dL) | 199 ± 28 | 148.7 ± 8.6 | <0.01 | 203 ± 25 | 189.4 ± 9.9 | n.s. |
| Uric Acid (mg/dL) | 7.1 ± 1.4 | 5.8 ± 2.2 | <0.01 | 7.3 ± 1.6 | 5.5 ± 2.1 | <0.01 |
| eGFR (mL/min/1.73 m2) | 89.5 ± 8.1 | 88.5 ± 9.2 | n.s. | 87.9 ± 8.4 | 88.6 ± 7.9 | n.s. |
| Hazard Ratio | ||
|---|---|---|
| Age (years) | 1.151 | <0.01 |
| Sex | 1.121 | <0.01 |
| Diabetes | 1.428 | <0.001 |
| Smoking habit (n) | 1.099 | <0.05 |
| T-Cl (mg/dL) | 1.687 | <0.0001 |
| HDL-C (mg/dL) | 1.423 | <0.001 |
| LDL-C (mg/dL) | 1.511 | <0.0001 |
| Triglycerides (mg/dL) | 1.139 | <0.01 |
| Hypertension/treatment (%) | 1.337 | <0.001 |
| BMI (kg/m2) | 1.284 | <0.01 |
| Visceral fat (% of total body weight) (M + SD) | 1.389 | <0.001 |
| HbA1c (%) | 1.376 | <0.001 |
| Uric Acid (mg/dL) | 1.099 | <0.05 |
Publisher’s Note: MDPI stays neutral with regard to jurisdictional claims in published maps and institutional affiliations. |
© 2022 by the authors. Licensee MDPI, Basel, Switzerland. This article is an open access article distributed under the terms and conditions of the Creative Commons Attribution (CC BY) license (https://creativecommons.org/licenses/by/4.0/).
Share and Cite
Guarino, G.; Strollo, F.; Della-Corte, T.; Satta, E.; Romano, C.; Alfarone, C.; Corigliano, G.; Corigliano, M.; Cozzolino, G.; Brancario, C.; et al. Comparison between Policaptil Gel Retard and Metformin by Testing of Temporal Changes in Patients with Metabolic Syndrome and Type 2 Diabetes. Diabetology 2022, 3, 315-327. https://doi.org/10.3390/diabetology3020022
Guarino G, Strollo F, Della-Corte T, Satta E, Romano C, Alfarone C, Corigliano G, Corigliano M, Cozzolino G, Brancario C, et al. Comparison between Policaptil Gel Retard and Metformin by Testing of Temporal Changes in Patients with Metabolic Syndrome and Type 2 Diabetes. Diabetology. 2022; 3(2):315-327. https://doi.org/10.3390/diabetology3020022
Chicago/Turabian StyleGuarino, Giuseppina, Felice Strollo, Teresa Della-Corte, Ersilia Satta, Carmine Romano, Carmelo Alfarone, Gerardo Corigliano, Marco Corigliano, Giuseppe Cozzolino, Clementina Brancario, and et al. 2022. "Comparison between Policaptil Gel Retard and Metformin by Testing of Temporal Changes in Patients with Metabolic Syndrome and Type 2 Diabetes" Diabetology 3, no. 2: 315-327. https://doi.org/10.3390/diabetology3020022
APA StyleGuarino, G., Strollo, F., Della-Corte, T., Satta, E., Romano, C., Alfarone, C., Corigliano, G., Corigliano, M., Cozzolino, G., Brancario, C., Martino, C., Oliva, D., Vecchiato, A., Lamberti, C., Franco, L., & Gentile, S. (2022). Comparison between Policaptil Gel Retard and Metformin by Testing of Temporal Changes in Patients with Metabolic Syndrome and Type 2 Diabetes. Diabetology, 3(2), 315-327. https://doi.org/10.3390/diabetology3020022