1. Introduction
Atrazine (Atz) is one of the most imported herbicides in Thailand, used to eliminate weeds [
1]. It contaminates soil and natural waters by spray drift, leaching and runoff [
2]. The toxicity of Atz for humans and aquatic animals includes endocrine disruptors and carcinogens. Conventionally, Atz can be investigated using various techniques including high-performance liquid chromatography/diode array detector (HPLC/DAD) [
3], high performance liquid chromatography tandem-mass spectrometer (HPLC-MS/MS) [
4] and gas chromatography/mass spectrometer (GC/MS) [
5]. These techniques require costly equipment and expert practitioners. Most uses have been modified; by employing a functional group or fluorescent probe before the detection to unlock any strong fluorescence [
6,
7], Atz can emit fluorescence lightly without modification [
8]. This can be used to determine Atz in each part of the solution of a sample preparation, incurring a cheaper cost and easier operation.
Molecular imprinting polymers (MIPs) are used to obtain a selective cavity of a polymeric material to recognize an analyte. A template is added as a target molecule to the polymerization along with monomers, cross-linkers and additives to achieve the MIPs.
Recently, a variety of materials based on molecularly imprinted polymers (MIPs) using Atz as a template have been widely studied. These MIP-Atz materials have been employed in several techniques, including electrochemical methods, chromatography, UV-visible spectroscopy and fluorescence. An electrochemical sensor was developed using Atz imprinted on a glassy carbon electrode combined with a PtNPs/C
3N
4 NTs nanocomposite and detected by cyclic voltammetry [
9]. Another approach used methacrylic acid (MAA) as a functional monomer for MIP, also using cyclic voltammetry for detection [
10]. A nanohybrid material of SCN-AuNPs was fabricated in a glassy carbon electrode for the amperometric detection of Atz [
11]. Even though these processes offered good sensitivity, many steps, a high temperature, and expert practitioners were needed for the synthesis concerned.
A semiIPN-based MIP membrane was synthesized from methacrylic acid, tri (ethylene glycol) dimethacrylate and oligourethane acrylate with the template by using UV-initiated co-polymerization and was used as a sorbent for solid-phase extraction and to determine Atz by HPLC-MS [
12]. Atz was detected using HFM-protected-MI-MSPE combined with HPLC-UV, involving a selective binding to MIP microspheres inside a hollow fiber, followed by elution [
13]. Additionally, a modified QuEChERS method based on MIPs coupled with GC–MS/MS enabled the simultaneous analysis of herbicides, including Atz, in bivalve shellfish samples [
14]. For UV-visible spectroscopy, photonic-based molecularly imprinted polymers (MIPs) to detect Atz were introduced. The rebinding of Atz leads to the deformation of the polymer, translated to a readable optical signal using Bragg diffraction. A shift in the peak wavelength was correlated to the concentration of the Atz in the sample [
15]. Fluorescence detection is another technique employed for Atz. A competitive fluorescence assay was developed, where Atz competed with a fluorescent probe (5-DTAF) to bind to MMIP based on Fe
3O
4–chitosan nanoparticles, with fluorescence intensity changes at 515 nm used to quantify Atz concentration [
16]. A highly fluorescent quantum dot (CdSeTe/ZnS)–MIP was also proposed for selective fluorescence detection of Atz in water, with the interaction between Atz and the MIP resulting in a decrease in fluorescence intensity, used to quantify the presence of Atz [
17].
In addition to the high selectivity, sensitivity and recovery rates of these methods, they involve complex and time-consuming synthesis processes. These included steps such as synthesis under an inert gas, the use of toxic solvents, heating and extensive preparation time, which were highlighted in these studies. Polyurethane foam (PUF) is well-known and has been used for sample preparation for more than half a century. Simple synthesis, high stability, good robustness and ease of modification using a functional group, polymers, nanoparticles or reagents have produced distinctive benefits. PUFs, which were recently reported by our lab, were positively charged for iron and copper removal before nickel assay [
18] and with gold nanoparticles to detect hexavalent chromium [
19]. Molecularly imprinted polyurethane foam (MIPUF) has been developed to overcome some drawbacks of the common MIPs, including short preparation time, no need for an oxygen-free environment, no added initiator, and cost-effectiveness. In recent years, MIPUFs with many templates have been reported, such as Escherichia coli [
20], alprazolam [
21], caffeine [
22] and monocrotaline [
23]. A MIPUF using Atz as a template has not been reported elsewhere. Here, a simple and easy preparation of MIPUF for the selective solid-phase extraction of Atz prior to using fluorescence spectroscopy without derivatization before detection was proposed. The imprinted foam was prepared in a lab using simple equipment, at room temperature, without an oxygen-free environment and packed in a plastic syringe. The proposed materials were characterized by Fourier-transform infrared spectroscopy (FT-IR) and scanning electron microscope (SEM). The solid-phase extraction was set up for sample preparation of Atz before collecting an eluate to measure fluorescence intensity. The concentration of Atz was then calculated using a linear calibration curve, and selectivity and interferences were investigated. Both surface and river water samples were tested, and the recovery (%) was chosen to disclose the accuracy of the proposed method.
2. Materials and Methods
2.1. Apparatus
Fluorescence detection was measured using a fluorescence spectrometer (HITACHI F-2500, Ibaraki, Japan). A Fourier-transform infrared spectrometer (Thermo Scientific, Nicolet 6700, Waltham, MA, USA) and SEM, (JEOL, JSM-6610 LV, Tokyo, Japan) were used to characterize all non-imprinted and imprinted polymers. A peristaltic pump (Cole-Parmer, Masterflex L/S Model 7534-08, Vernon Hills, IL, USA) was used to propel the solution. An ultrasonic sonicator (Elma™, Elmasonic EASY, Singen, Germany) was used for all imprinted preparation and a digital pH meter (METTLER TOLEDO, AG 204, Greifensee, Switzerland) was employed to adjust the pH.
2.2. Chemicals
All pesticides, namely, Atz, simazine (Sim), carbaryl (Car) and cypermethrin (Cyp), were certified reference material grade (Dr. Ehrenstorfer™, Augsburg, Germany). Other reagents used in this work were of analytical grade. A stock solution of 0.01 M Atz was prepared by weighing 0.1078 g of Atz following dissolving by acetonitrile. A working solution of Atz was diluted by 0.1 M HCl or DI water for daily use.
2.3. Preparation of MIPUF
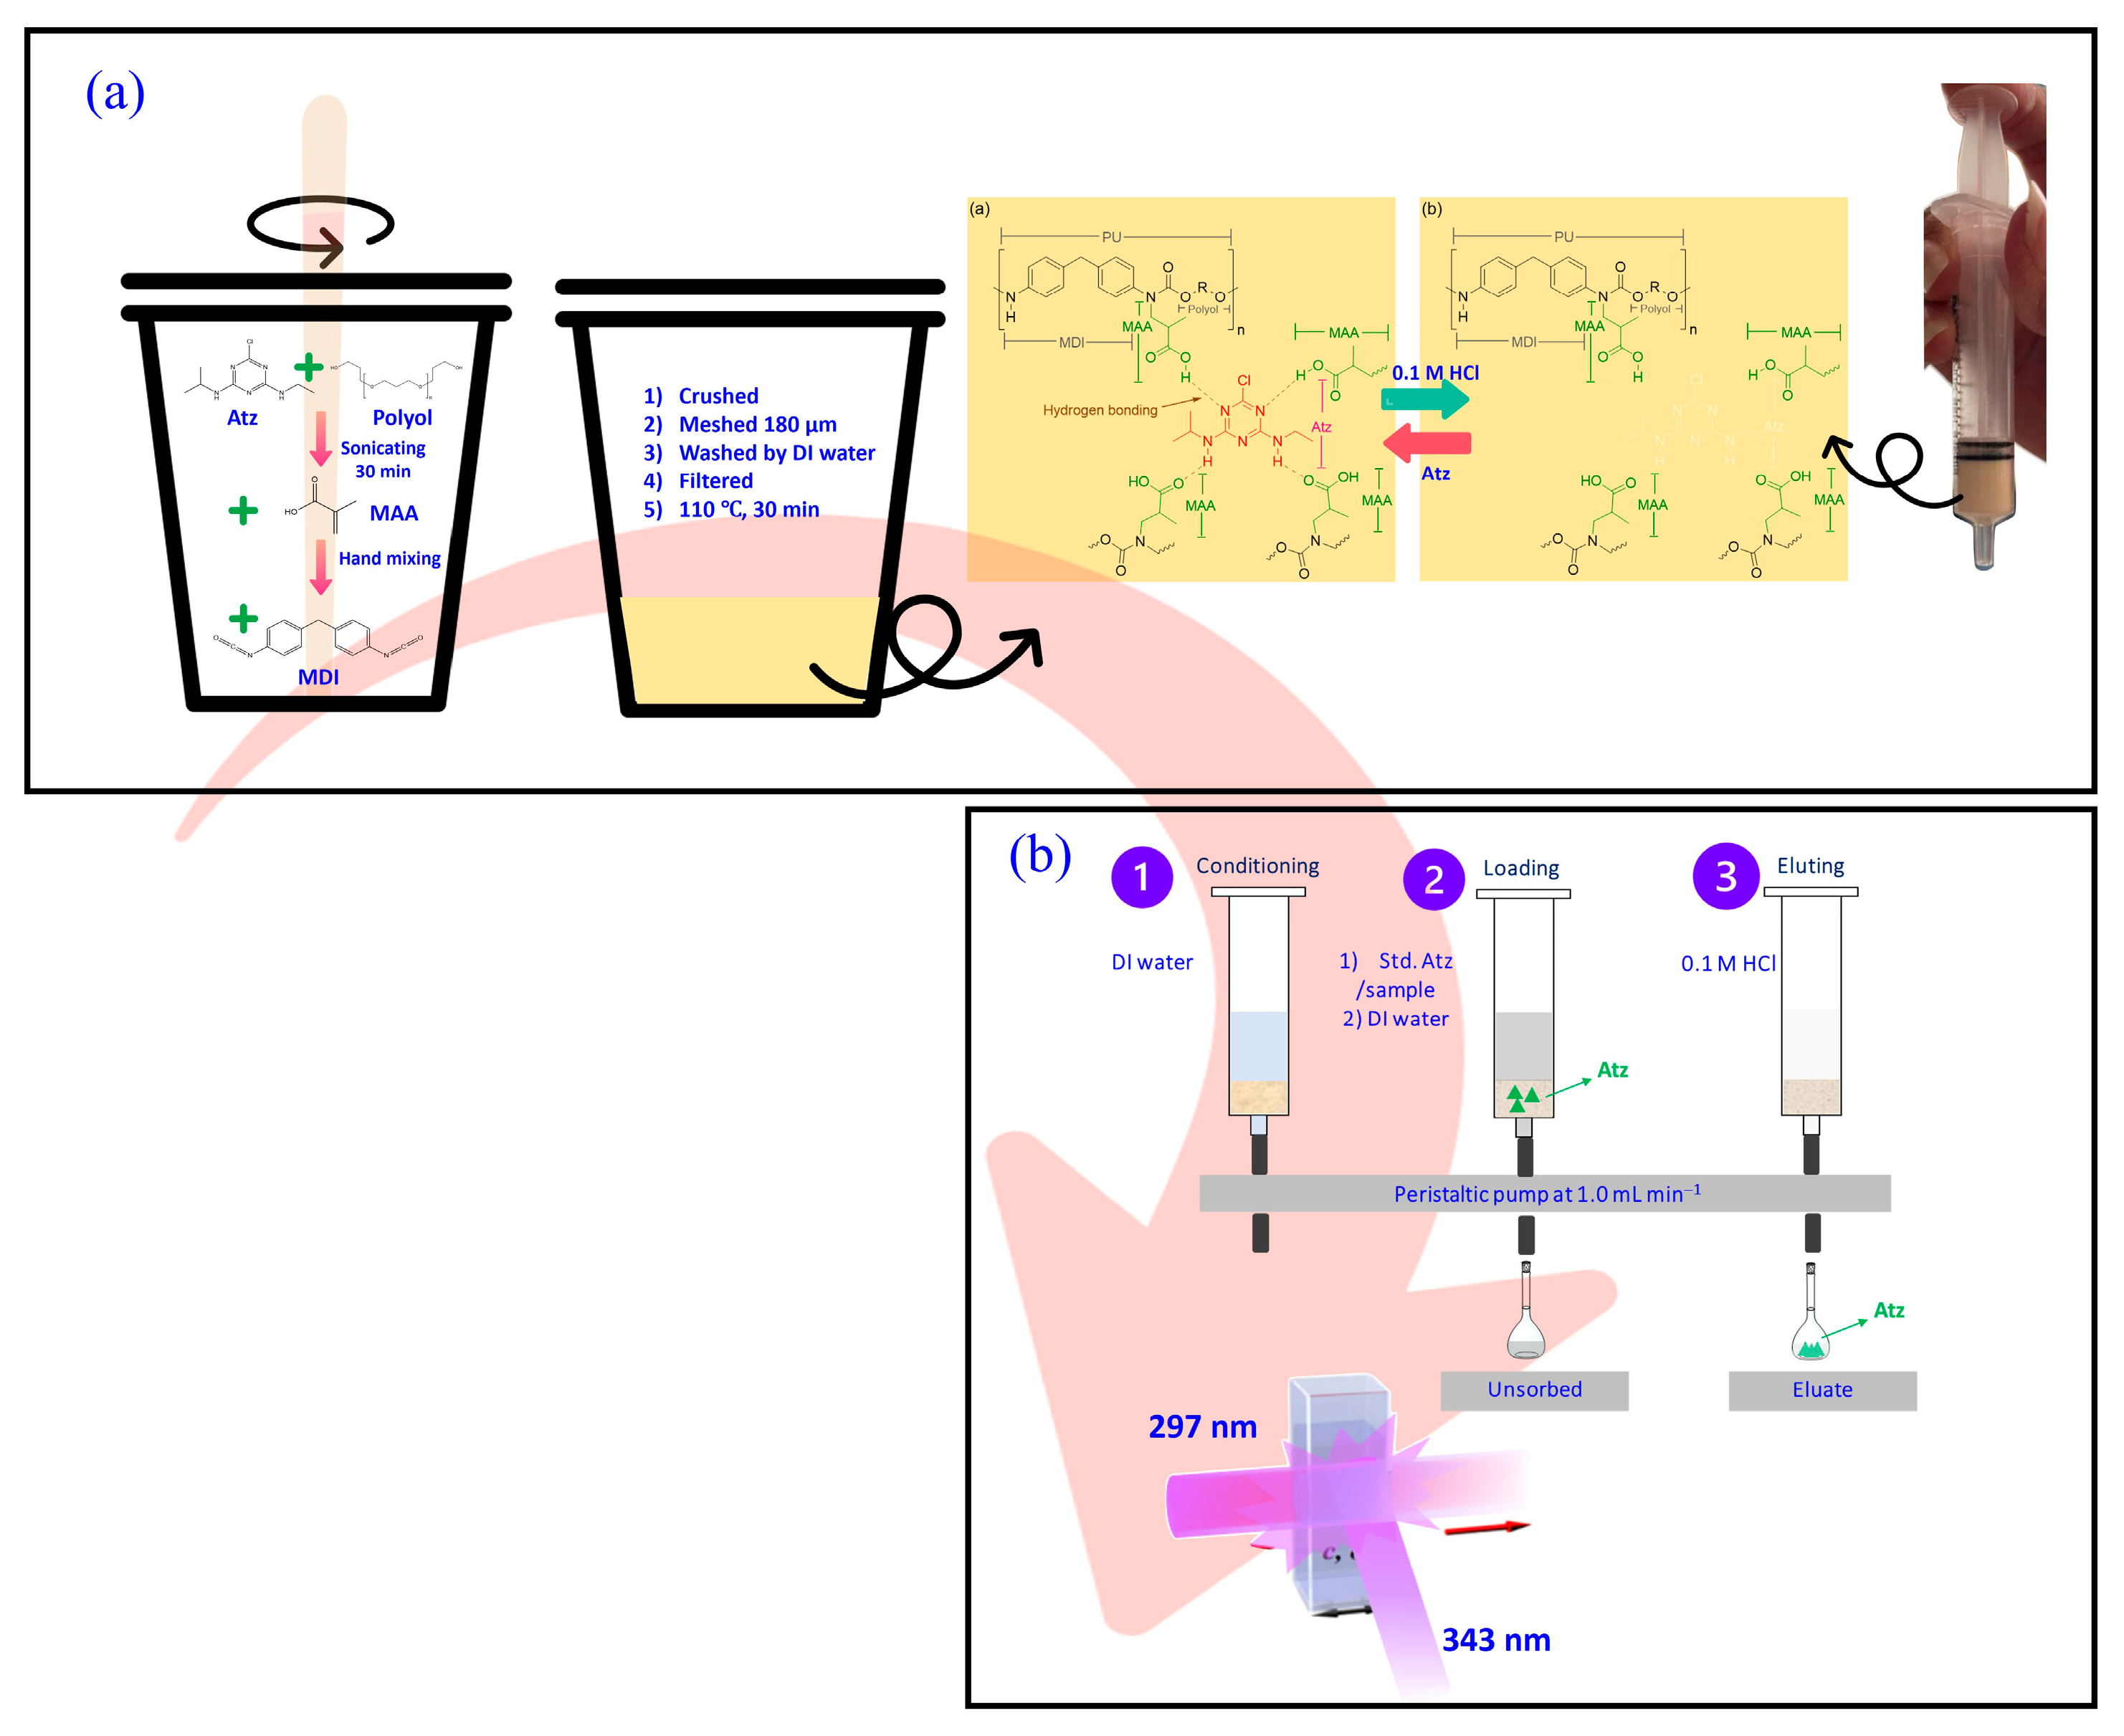
The preparation of MIPUF was adapted from a related study. A 1.0 g polyol (polyether; IRPC, Rayong, Thailand) was weighed in a plastic cup. Then, 100 µL of 1 mM Atz in acetonitrile was added before dispersion using an ultrasonic sonicator at 120 rpm for 30 min. Then, 0.5 g methacrylic acid (MAA, Sigma-Aldrich, St. Louis, MA, USA) was added as a functional monomer and further mixed for 10 min. Methylene diphenyl diisocyanate (MDI; IRPC, Rayong, Thailand) was added in the molecularly imprinted pre-polymer and vigorously stirred for 1 min and left at room temperature for about 2 h to complete the curing reaction. The MIPUF template was then obtained. An initiator was unnecessary due to the self-initiator of MDI to the pre-polymer [
21]. The imprinted foam was ground to powder and sieved to be about 180 µm of diameter. The MIPUF template was packed in a minicolumn coupled with a peristaltic pump and rinsed with 50 mL of 0.1 M HCl to remove the template in the cavities, followed by DI water until the filtrate became a neutral pH. MIPUF was then dried in an oven at 110 °C for 30 min and cooled to room temperature (
Figure 1a). The ready-to-use MIPUF was stored in a zip lock bag for rebinding Atz. NIPUF was prepared using the same procedure without adding the template.
2.4. Set up of MIPUF/NIPUF Minicolumn and General Procedure for Atz Assay
A cut filter paper was placed in a 5 mL plastic syringe before packing with 0.5 g of MIPUF/NIPUF. This was connected to a peristaltic pump with a flow rate of 1.0 mL min
−1. The minicolumn and tubes were passed by DI water to remove air bubbles. A certain concentration and volume of standard Atz/sample solution was percolated in the minicolumn and then washed with 3.0 mL DI water to remove the residual solution in the tube and unsorbed Atz from the minicolumn. The elution by 0.1 M HCl was then achieved using 25.0 mL. The eluate was collected and measured for fluorescence intensity (
Figure 1b).
3. Results and Discussion
3.1. Detection of Atz Using Fluorescence Spectrometry
Atz can emit a weak fluorescence [
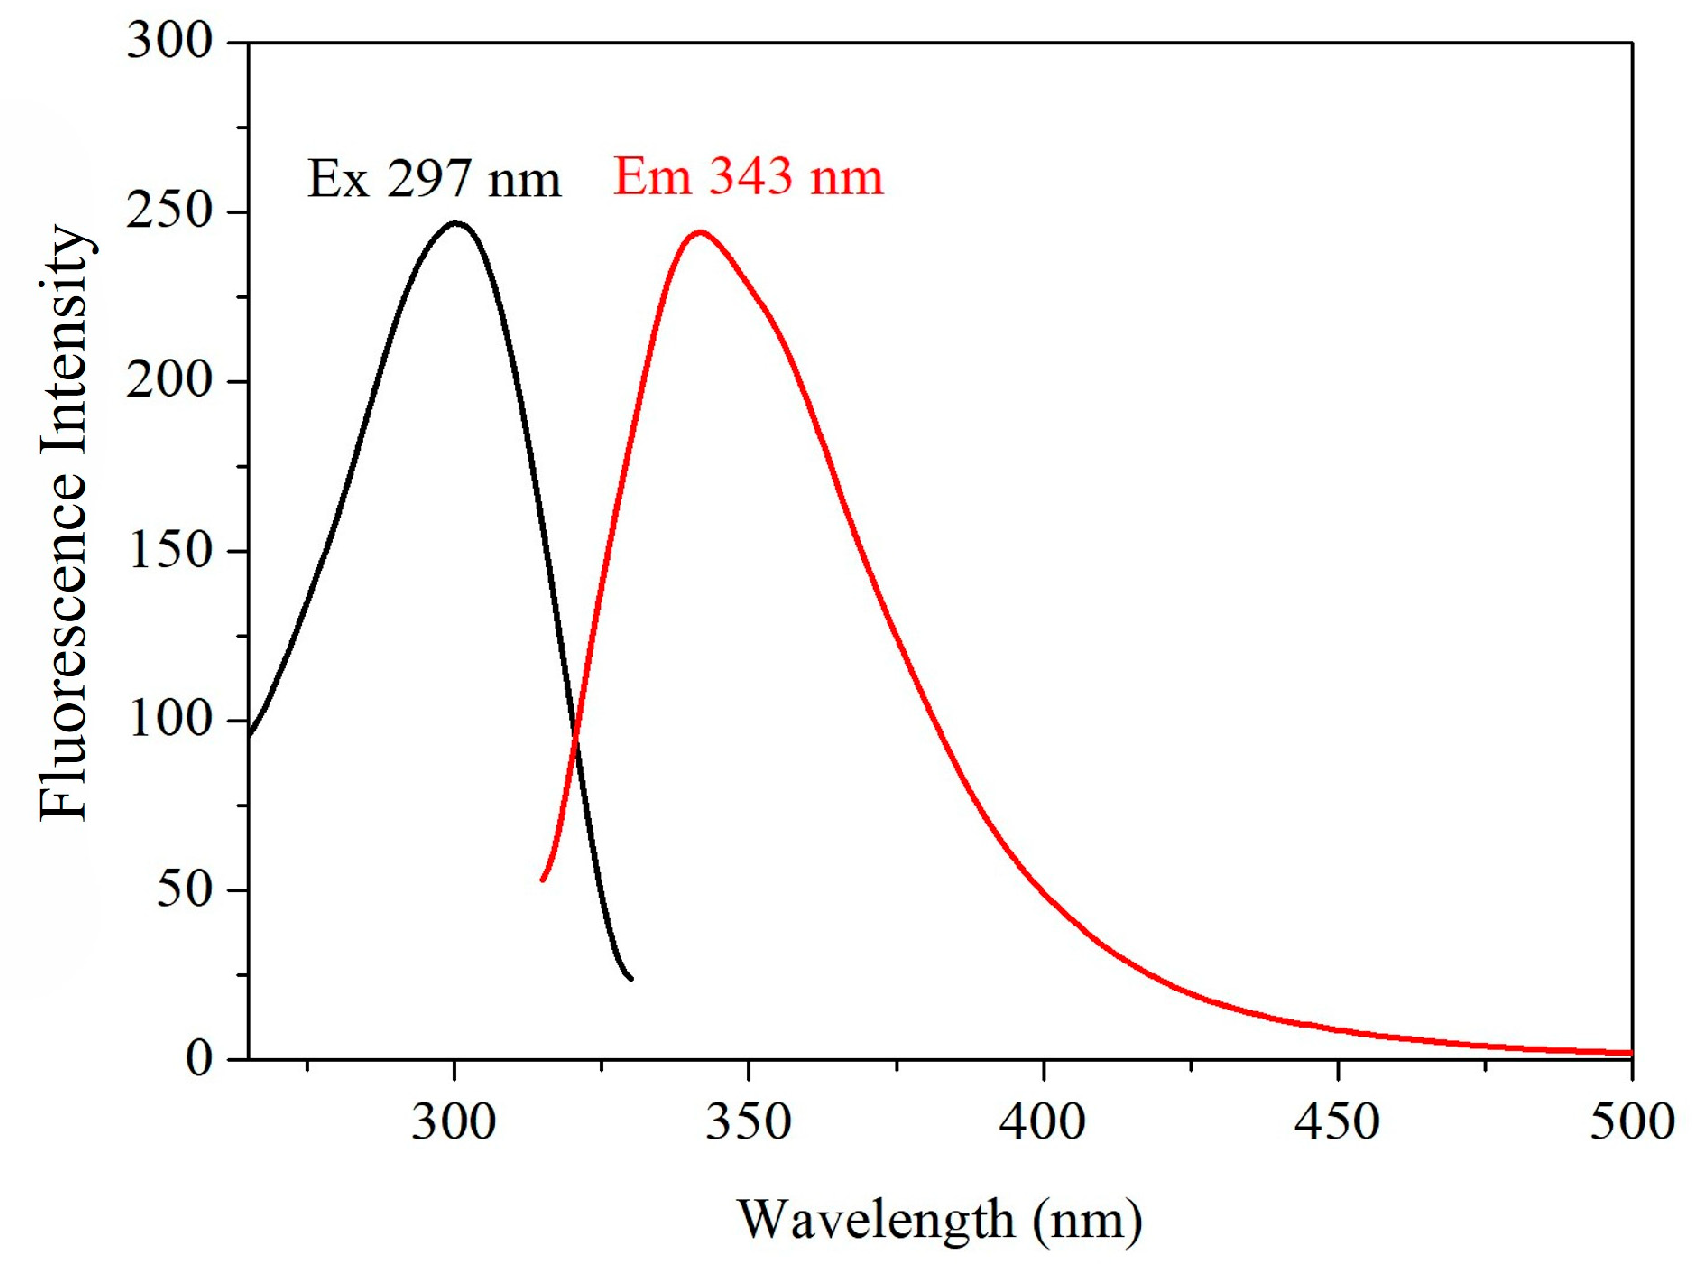
8]. In the proposed work, the fluorescence was used for detection after eluting Atz from the MIPUF column without further derivatization. This would constitute an advantage for simple, fast observation, and low-cost detection when compared with chromatographic and derivatization techniques. The aqueous solutions, specifically, Atz, Sim, Car and Cyp, were scanned for the excitation wavelengths from 220 to 800 nm. After that, an optimum excitation wavelength was fixed for emission scanning from 220 to 800 nm, and then the optimum emission wavelength was recorded. All spectra were recorded with a 10 nm slit-width for the emission monochromator and 10 nm for the excitation monochromator, with a scanning speed of 1500 nm/min. With the excitation at 297 nm for Atz, the wavelength for the emission appeared at 343 nm (
Figure 2). For this reason, the emission at 343 nm was chosen for the detection. For other pesticides, the fluorescence in the same manner as Atz was optimized.
3.2. MIPUF
Briefly, a low-cost MIPUF was initiated by sonicating Atz as a template for dispersion with polyol as a cross-linker. A common MAA was added as a functional monomer to form a pre-polymer before ending with a cross-linker of MDI. In the primary reaction, the polyol reacts with MDI to form a urethane bond, while the double bond (methacrylate group) of MAA might covalently incorporate MDI as a secondary reaction. This leads to cross-linking at the N atom of urethan bonds. Without an initiator and heating, the MIPUF rapidly grew in 5 min in the polymerization step. The MAA can creates a cavity inside the foam. An optimum amount of 0.5 g MAA was chosen in this work [
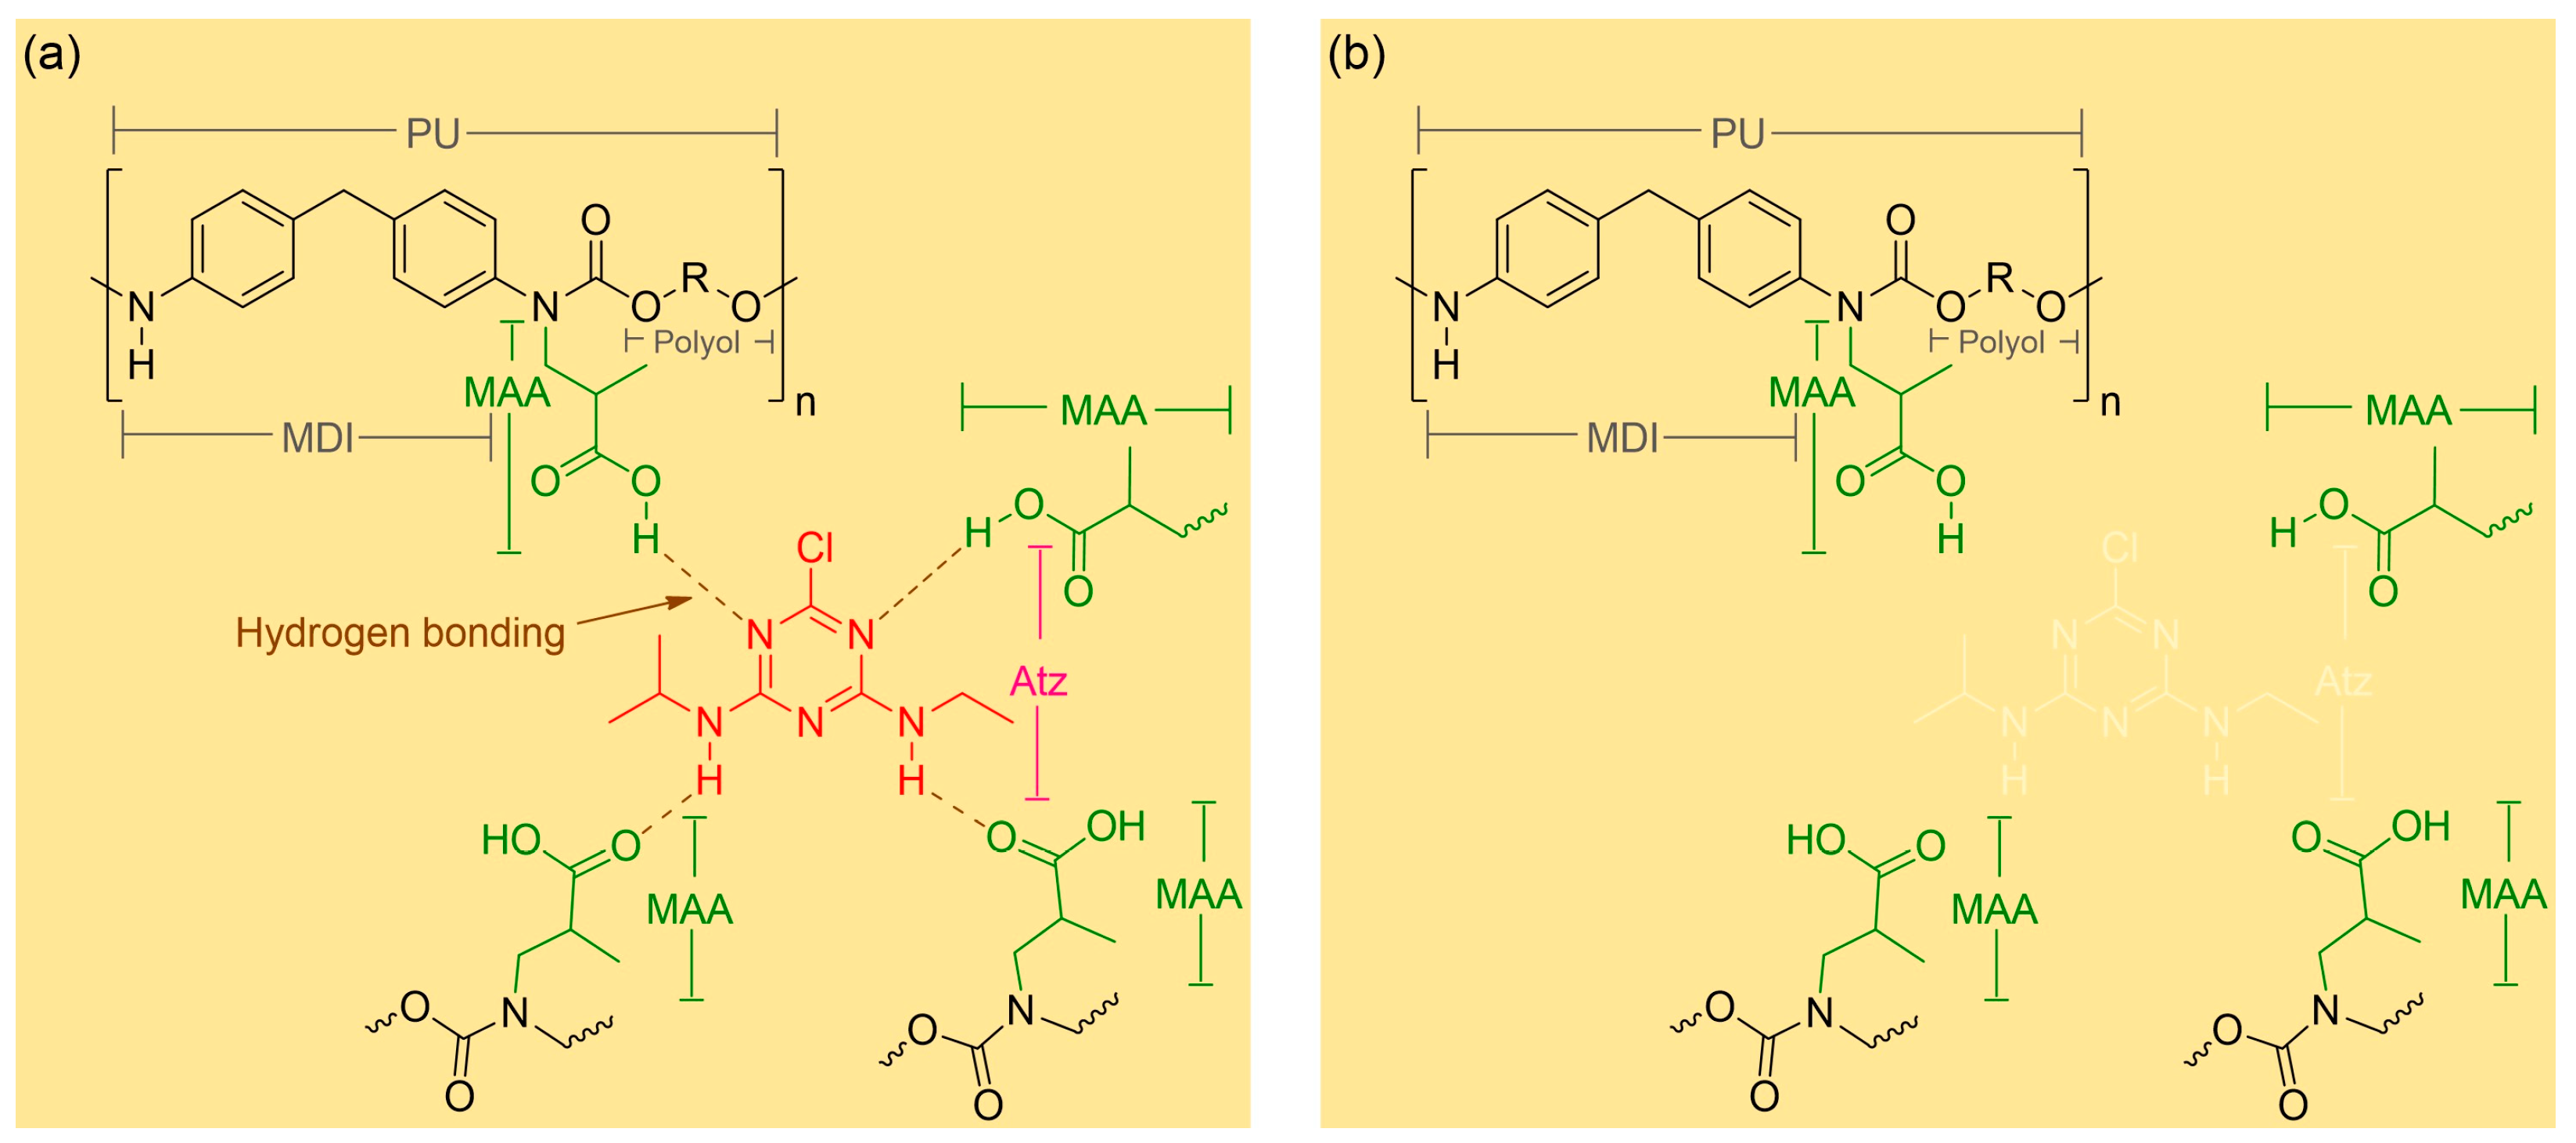
21]. Nonetheless, a very high amount of MAA, about two times this, would make a weak foam structure and change the mechanical properties of the foam. The cavities of the MIPUFs were shaped and recognized as complimentary to Atz. The foam was completely set, ground into small pieces, and sieved to obtain 180 to 600 µm size. The MIPUF powder was washed using DI water before drying at 110 °C for one half hour. The MIPUF from PUF as a base polymer allows for synthesis under an oxygen atmosphere, which reduces the cost of synthesis, and the overall procedure was finished within 2 h. Alternatively, some MIPs required at least 24 h to complete the polymerization in an oxygen-free environment. Apart from the sonicator in the pre-polymerization step, a plastic cup and bamboo chopstick were chosen for mixing all the materials. The interaction between Atz and the functional groups in the cavities of MIPUF for the sorption might be dependent on hydrogen bonding. The -OH and -CO groups from MAA could interact with the nitrogen atoms of Atz (
Figure 3a) [
23]. The eluting of Atz was achieved by protonation with 0.1 M HCl (
Figure 3b). Many related studies [
21,
22,
23] have revealed that a neutral pH is efficient for Atz sorption by MIPs based on hydrogen bonding. Acidic conditions can disrupt the hydrogen bonding through protonation, while basic conditions might degrade the MIPUF cavities. The proposed MIPUF was used in neutral pH without adjusting the Atz solution before use. This would reduce the steps for sample preparation.
3.3. Characterizations of MIPUF
Fourier Transform Infrared Spectrometer, FT-IR
All samples were ground to a powder and mixed with potassium bromide in a ratio of 1:100 in weight before measurement by FT-IR to obtain a transmission spectrum. The IR spectra were recorded from 4000 to 600 cm
−1 and transmission spectra were collected. Pure Atz (blue line) was examined (
Figure 4a). Vibrations of -NH and -C=N stretching at 3257 and 1559 were observed, indicating Atz. For pure PUF (see
Figure 4b: green line) with a ratio of MDI to polyol at 1:1, -NH stretching and bending at 3408 and 1510 cm
−1, -CO and -C-N stretching in 1716 and 1232 cm
−1 indicated the urethane bond of PU. A strong absorption peak of -NCO stretching at 2277 cm
−1 was also revealed. Notably in the spectra of MIPUF after washing the template (red line), a sharp -NH stretching band characteristic of PUF appears in the same region as the -OH stretching (3400–3500 cm
−1). The -CO stretching bands of carboxylic groups at 1716 cm
−1 were observed. Both -OH and -CO groups might be from MAA [
24]. The IR spectra of unwashed MIPUF (purple line) were broad at the peaks of -OH functional groups (
Figure 4c). This might have stemmed from the interaction between Atz and those functional groups, such as through hydrogen bonding. The -NCO stretching could not be detected from the MIPUFs and NIPUF. This could indicate the interaction of the -NCO group with MAA and polyol during the polymerization (see
Figure 3 and
Figure 4). However, the IR spectra of NIPUF (orange line) scarcely differed from that of the washed MIPUF.
Scanning Electron Microscope
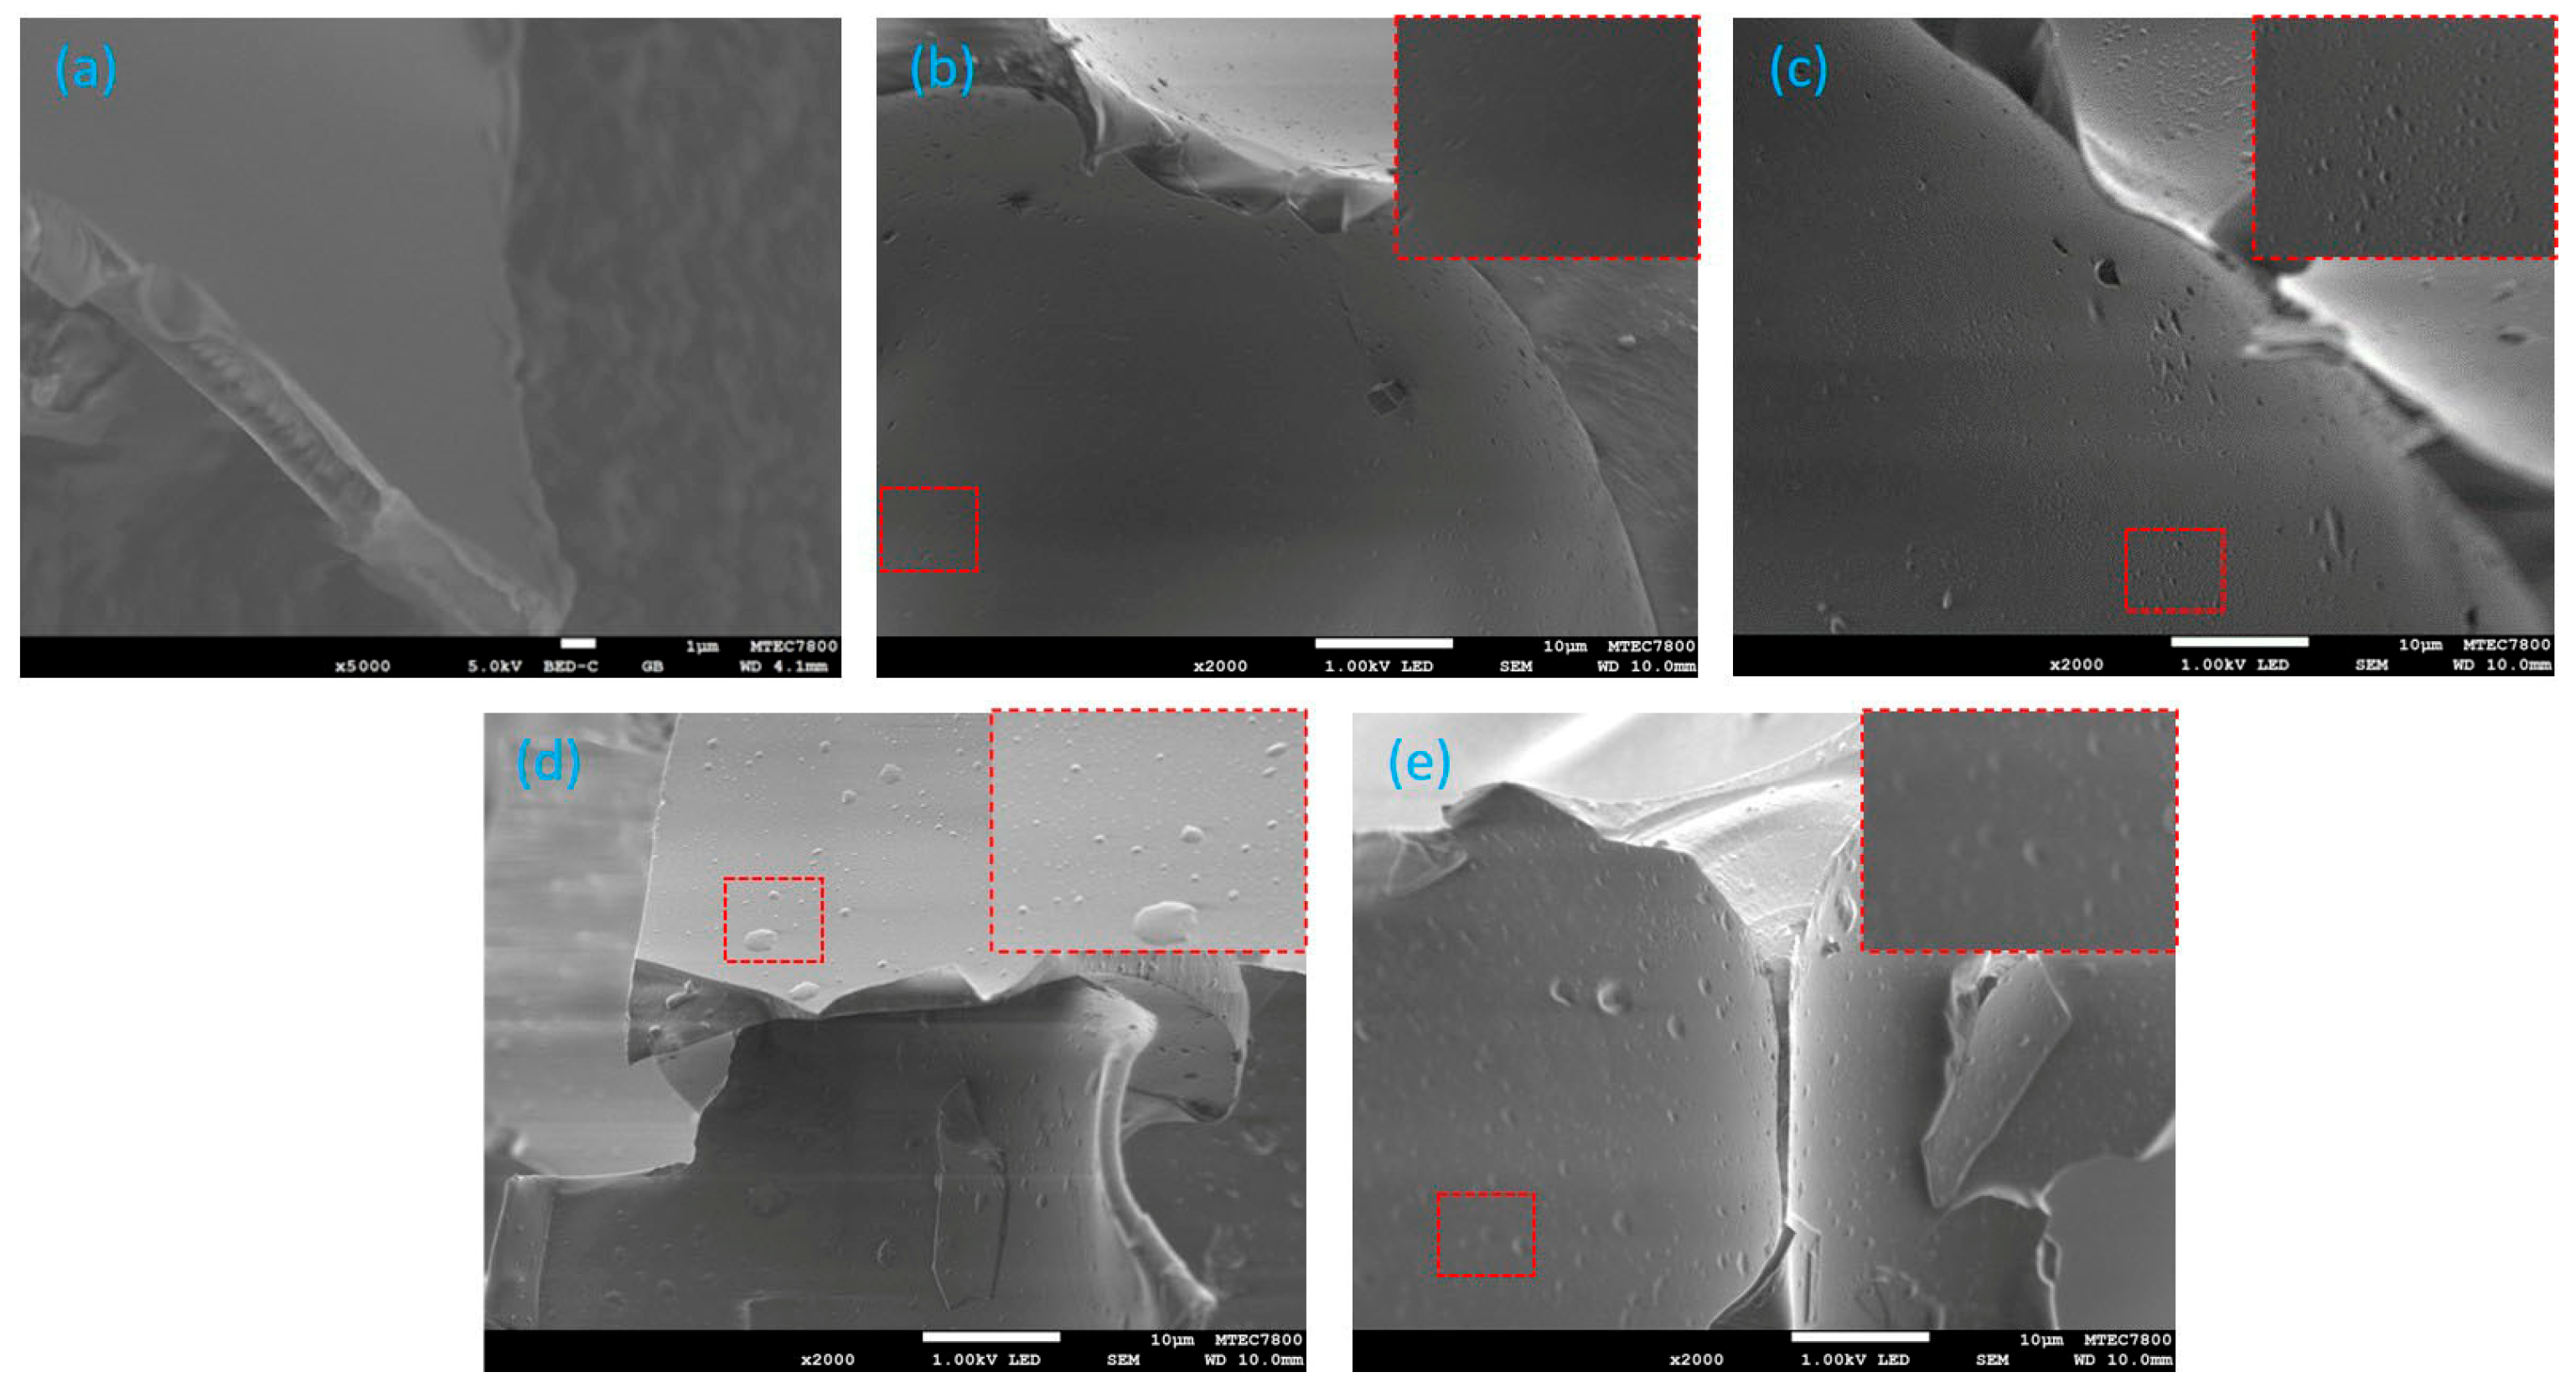
From the SEM images, without a functional monomer and template, a smooth surface could be observed on the pure PUF at 5000× (
Figure 5a). The surface of the unwashed MIPUF (
Figure 5b) was rough, with an unclear cavity. This might indicate that the template was plugged inside the porous membrane. After washing the template from the unwashed MIPUF with 0.1 M HCl, many small cavities of a certain size appeared at 2000× (
Figure 5c). This implies the potential of the template interacting with functional monomers. At 2000× magnification (
Figure 5d,e), both unwashed and washed NIPUF exhibited an analogous surface and cavity size. Without the template added, a random cavity size was obtained.
3.4. Optimization
Removal template
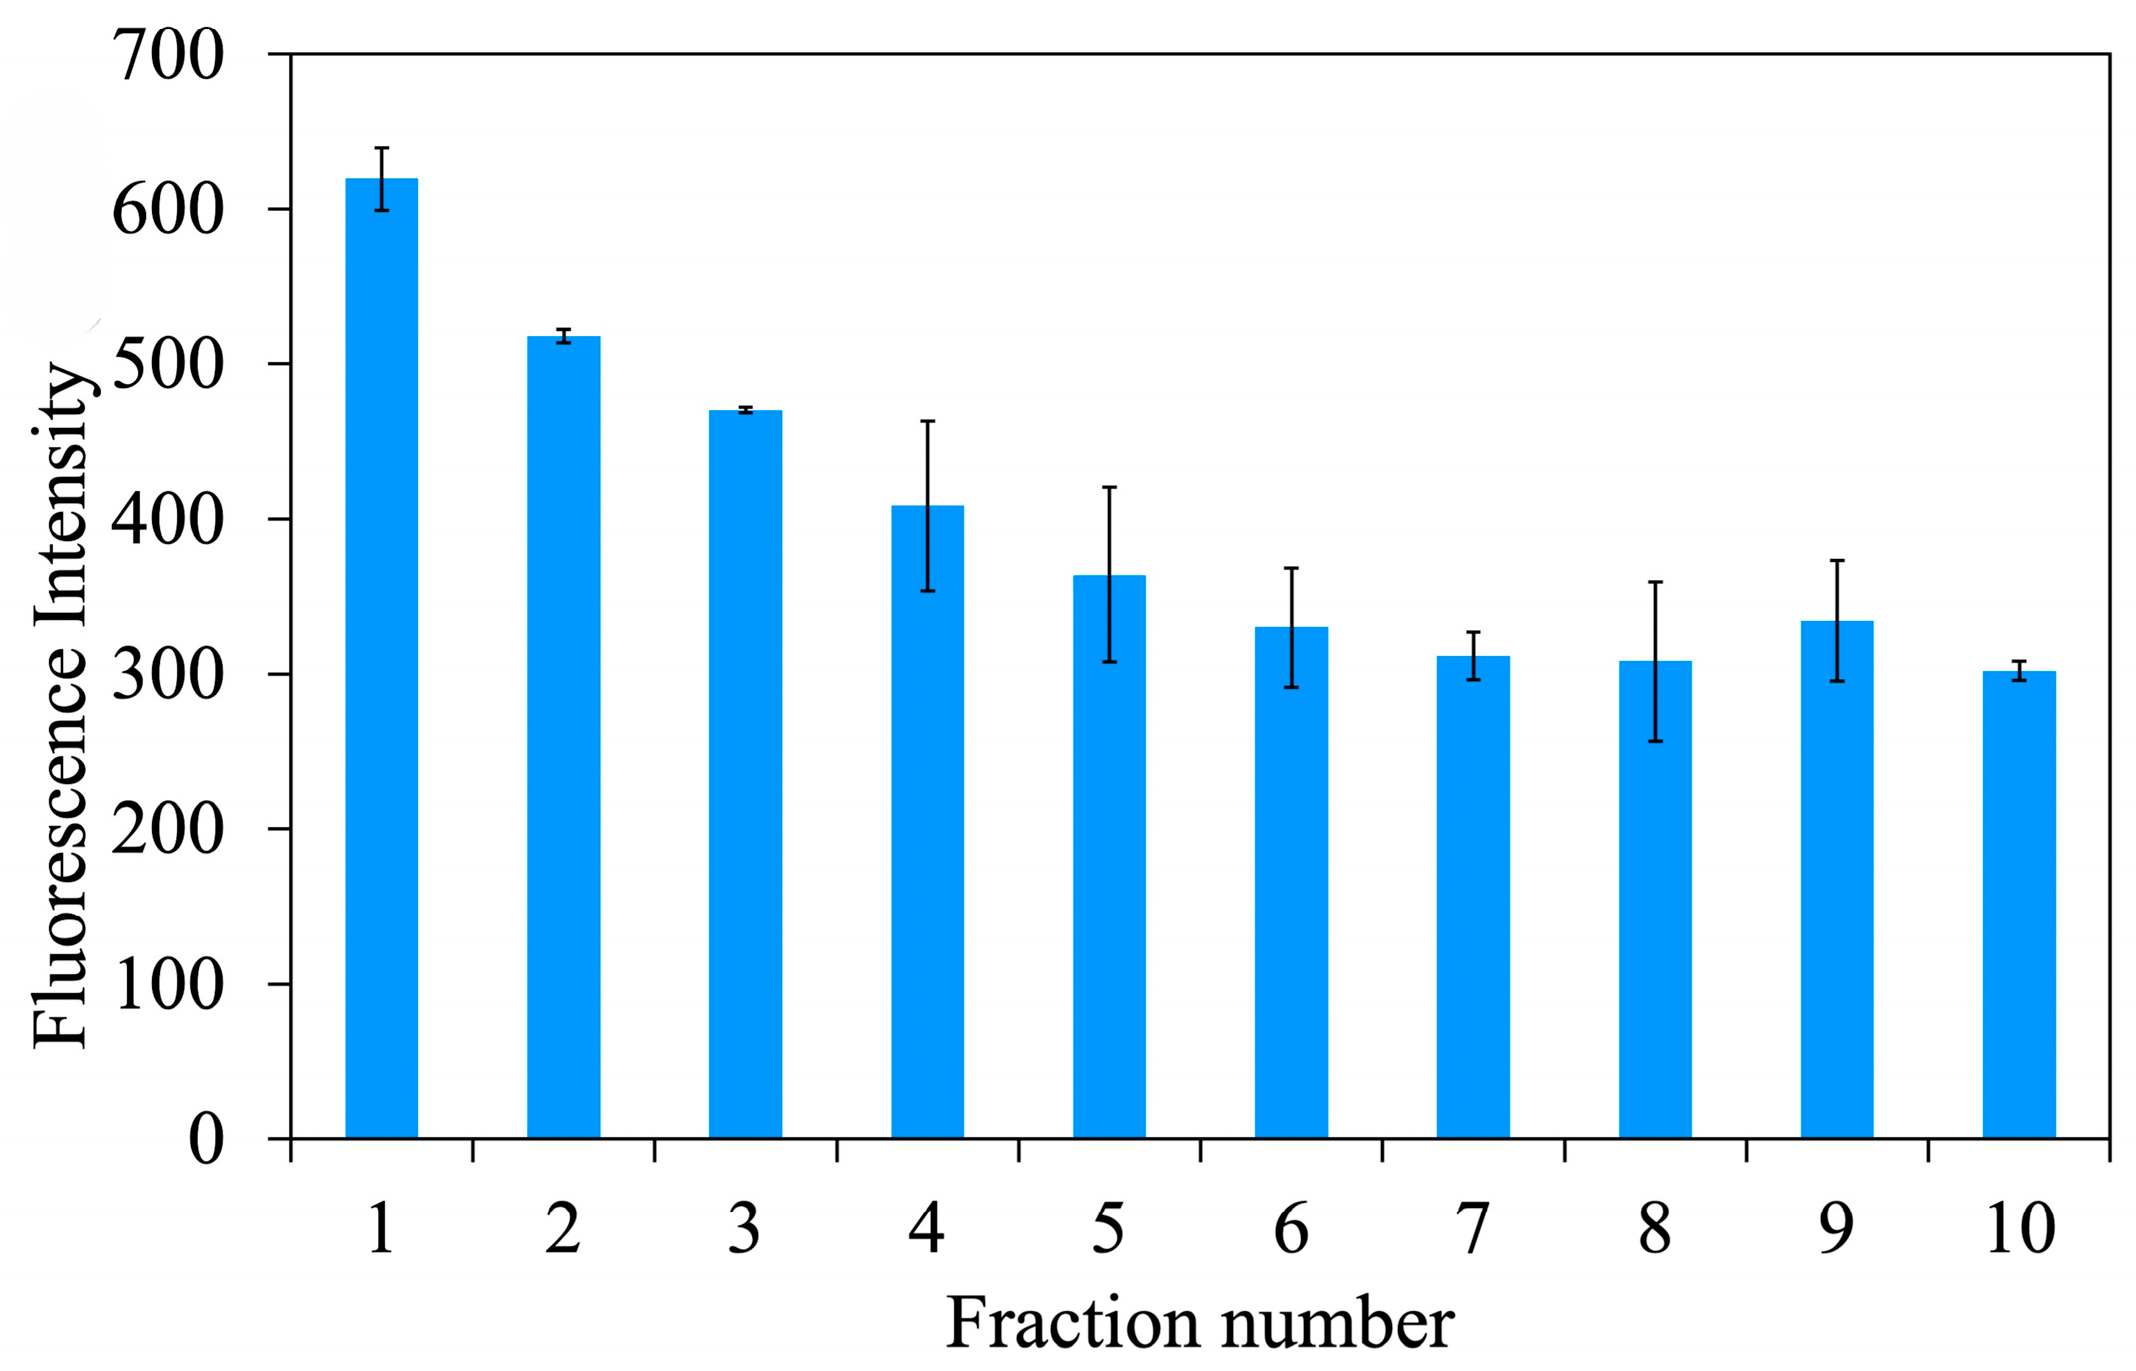
The Atz template could be removed to obtain a specific cavity of MIPUF (
Figure 6). Further, 0.5 g unwashed MIPUF was packed in a minicolumn before passing 100 mL of 0.1 M HCl at a flow rate of 1.0 mL min
−1. After washing and eluting, the eluate with 10.0 mL was collected for 10 fractions. Then, the fluorescence intensity was plotted against each fraction of the eluate. After the 5th faction, the fluorescence intensity did not significantly differ, and the amount of Atz was not detected. The 5th fraction or 50.0 mL of 0.1 M HCl was chosen to eliminate the template from MIPUF.
Eluting volume
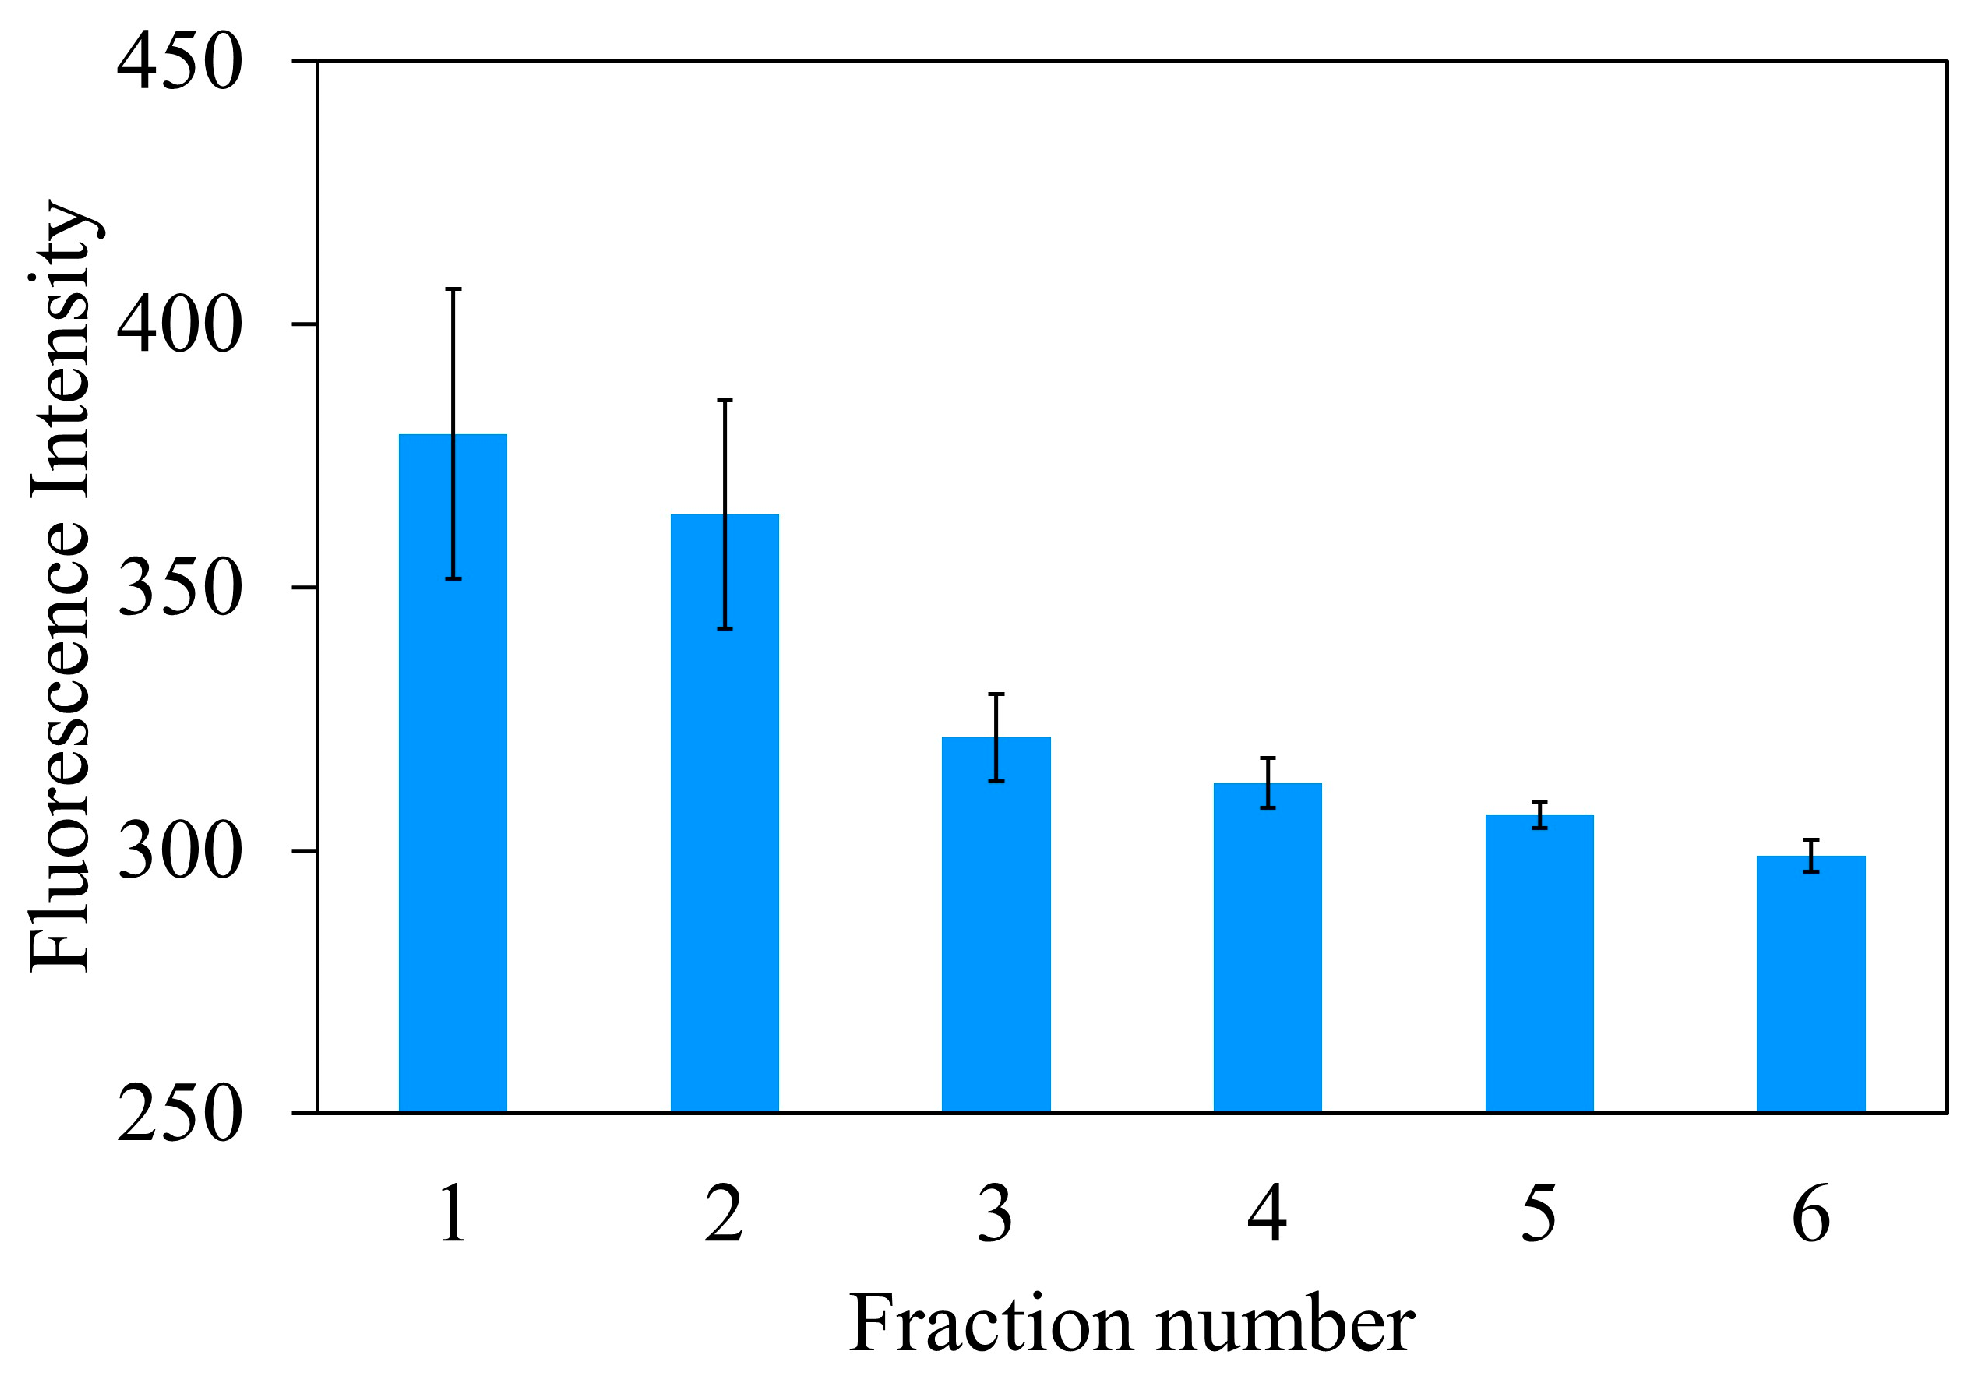
After rebinding 10 nmol (1 µM × 10.0 mL) Atz, the eluent volume of 0.1 M HCl was important to completely elute Atz from the imprinted cavities. A 0.2 g MIPUF in a minicolumn was percolated by 10 mL of 0.1 M HCl with a flow rate of 1.0 mL min
−1. After the 2nd fraction, Atz was fully carried out from MIPUF and collected in a 25.0 mL volumetric flask (
Figure 7) that would contain the eluting volume for further work.
Amount of MIPUF
The minicolumn packed with various amounts of MIPUF was loaded with 10 nmol Atz before eluting was performed as the general procedure. The eluate was measured to obtain a fluorescence intensity and then the obtained amount of Atz was calculated (
Figure 8). Recoveries (%) were given as 94 and 95% for 100 and 200 mg, respectively, and 86% for 50 mg. At least 100 mg of MIPUF was needed for proper packing in the minicolumn.
Flow rate
A series of flow rates for the proposed procedure, namely, loading, washing and eluting, were set up at 1.0, 1.5, 2.0, 2.5 and 3.0 mL min−1. The 1.0 mL min−1 flow rate provided an effective result for the sorption and desorption of Atz through the MIPUF minicolumn. A higher flow rate than that chosen resulted in a lower amount of Atz after eluting.
HCl concentration
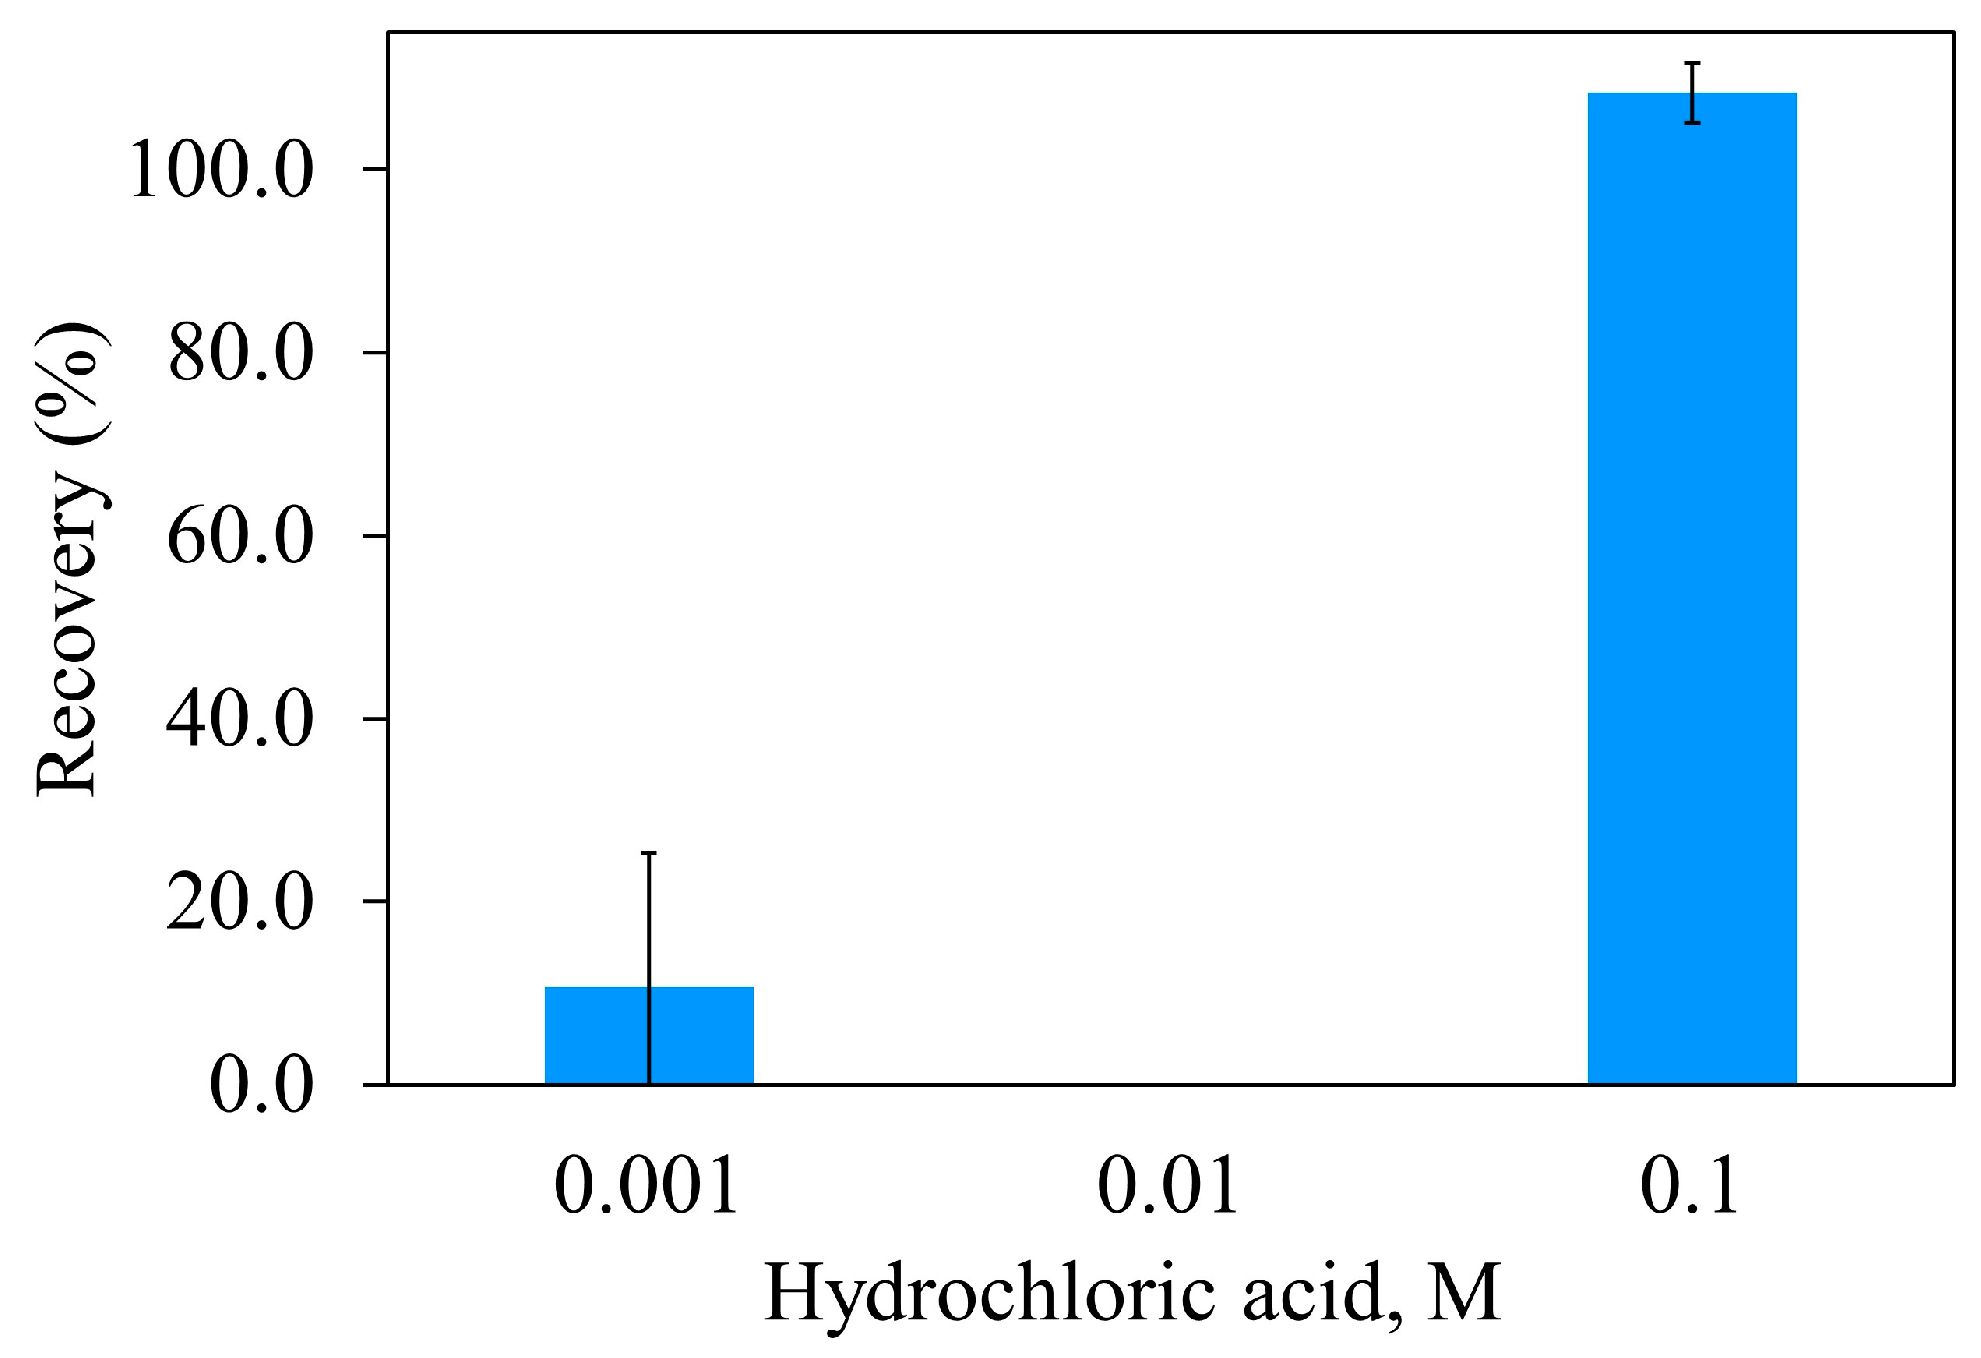
The desorption of Atz from the MIPUF cavities was based on protonation by H
+. The functional groups from MAA and PUF, such as -OH and -NH groups, would be protonated, and the expected hydrogen bonding was broken. Atz was free from it. At less than 0.1 M HCl, recovery (%) was near to zero, implying a weak protonation (
Figure 9). As such, 0.1 M HCl was selected for further experiment on Atz elution.
3.5. MIPUF and NIPUF
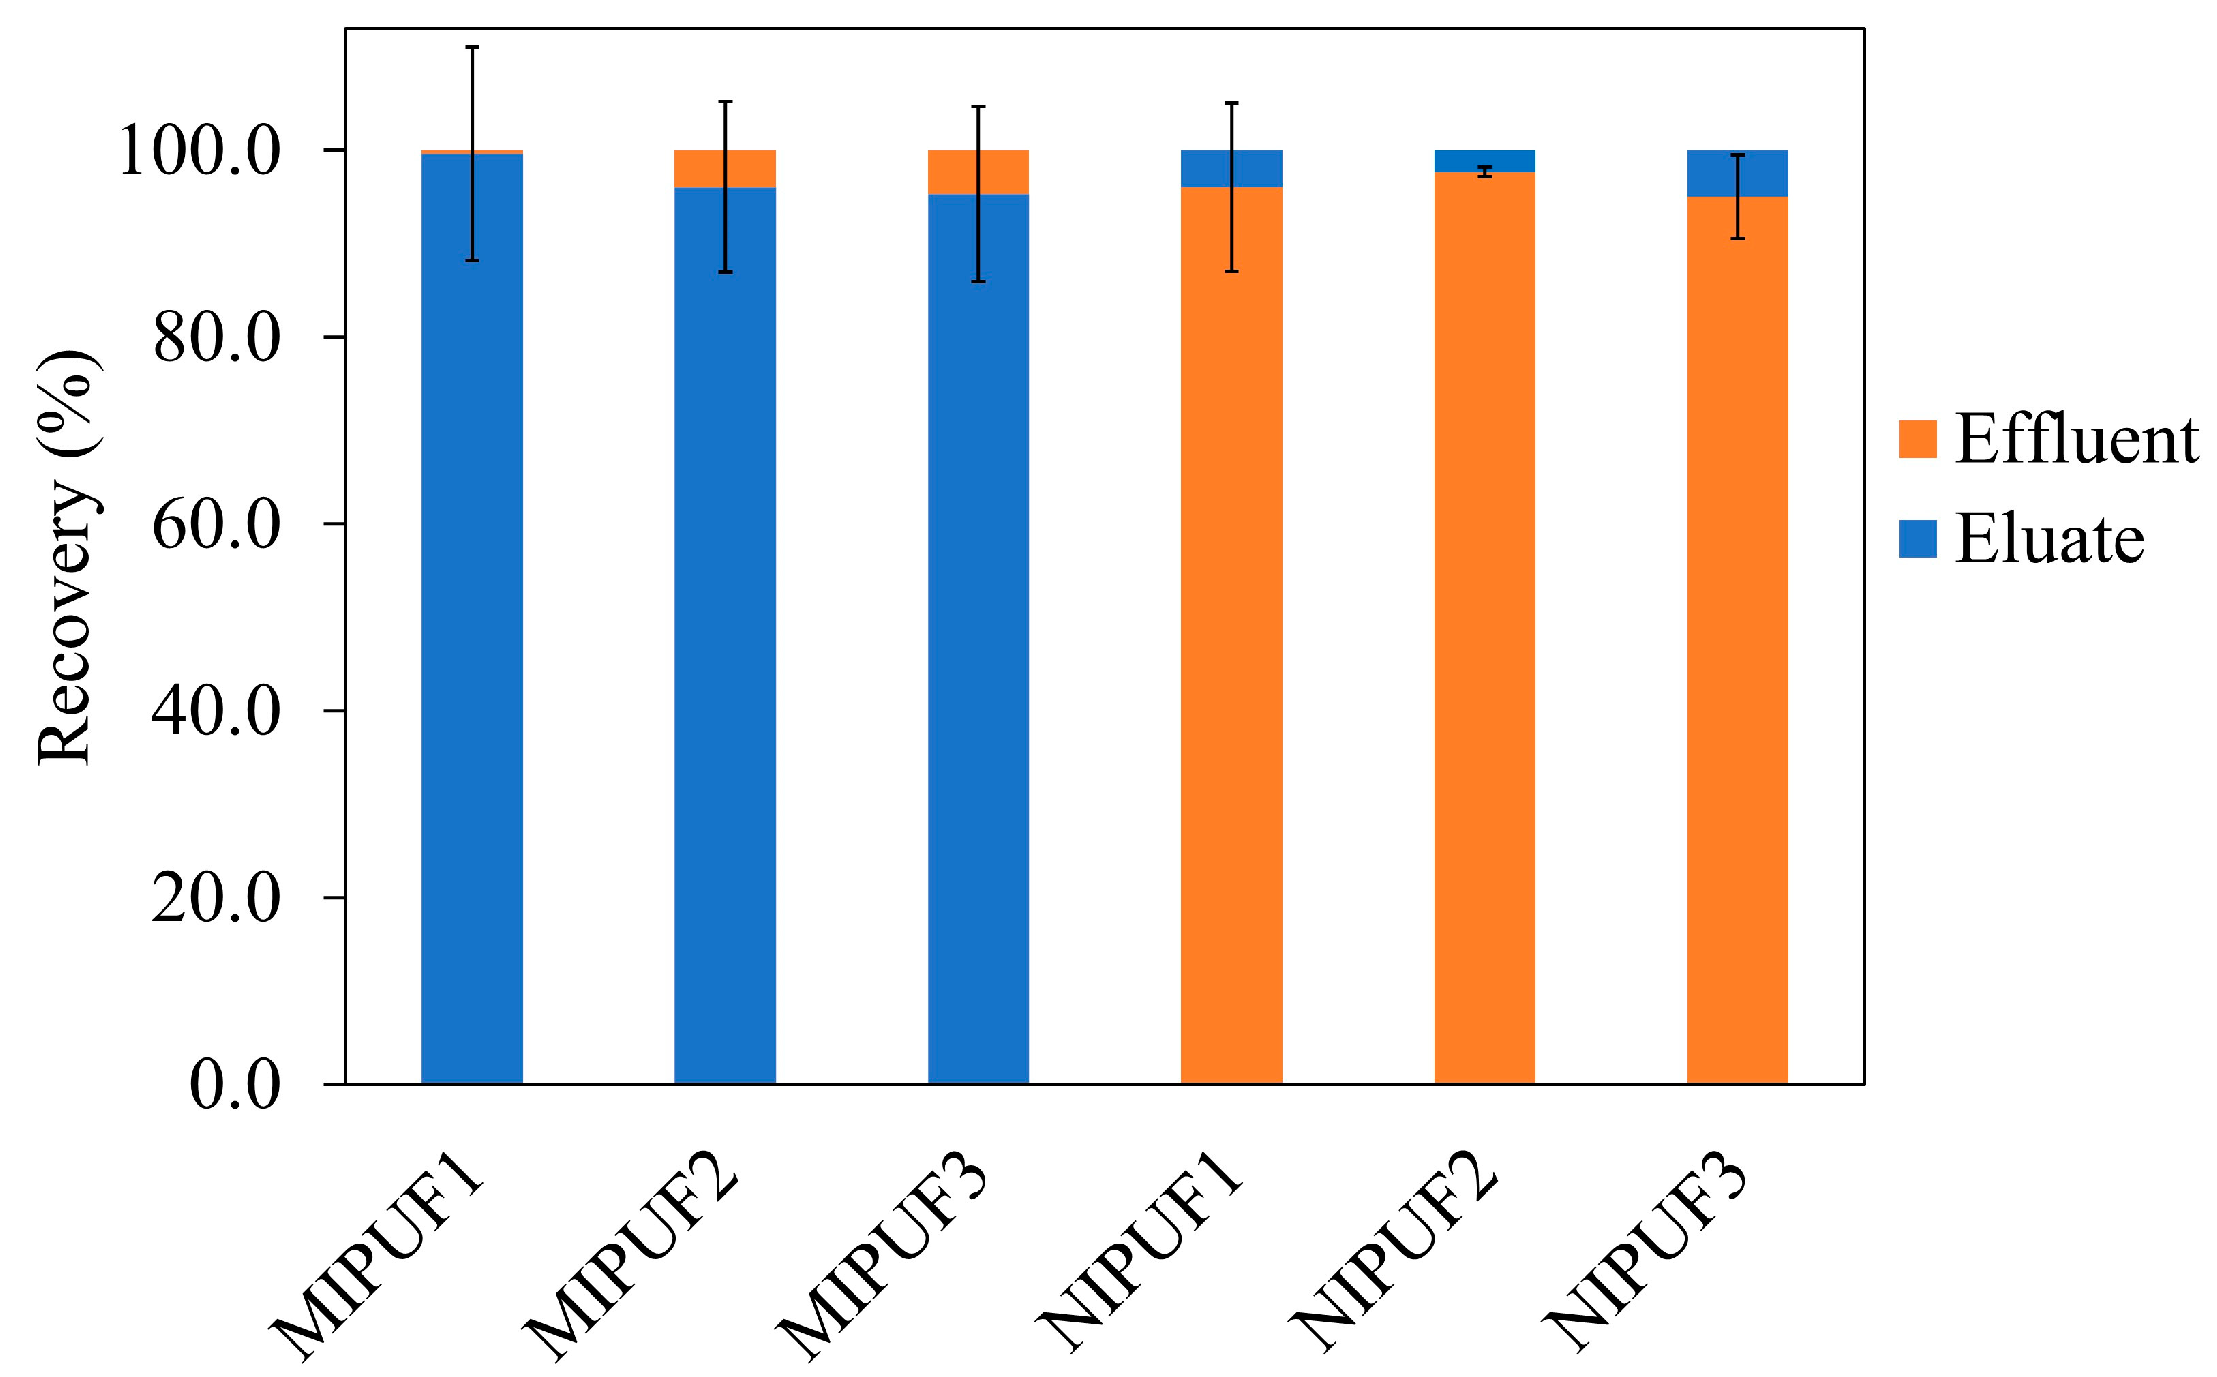
The efficiency of MIPUF and NIPUF was shown as recovery (%) of Atz. Thus, 100 mg of MIPUF/NIPUF in a minicolumn was passed with a certain amount of 10 μmol Atz before washing and eluting, respectively. The effluent and eluate were collected to determine the amount of Atz using a fluorometer. The obtained recovery (%) of Atz was then calculated (see Equation (1) and
Figure 10). The recovery (%) of Atz from an eluate of 95 ± 9–100 ± 10 was given by MIPUFs, while Atz was scarcely detected in the eluate from NIPUF. Conversely, NIPUF could detect the Atz with a recovery (%) of Atz in an effluent between 95 ± 5 and 98 ± 1. A good sorption and desorption of Atz were given by MIPUF over NIPUF. This was related to the appropriate cavities of MIPUF for Atz. On the other hand, the sorption capacity of Atz in the minicolumn could be calculated as μmol of Atz divided by the amount of MIPUF/NIPUF in grams. A sorption capacity of 94 ± 4 μmol
Atz/g
MIPUF and 4 ± 1 μmol
Atz/g
NIPUF for MIPUF and NIPUF, respectively, were given.
3.6. Analytical Characteristics
Under optimum conditions, the MIPUF minicolumn was loaded with a certain amount of Atz at 0.01 μmol, with different concentrations and volumes, before eluting with 10.0 mL of 0.1 M HCl. The loaded Atz in μmol on a minicolumn could be computed by Atz in μmol = CAtz × Vanalyte solution, where CAtz is the initial atrazine concentration during the loading step and Vanalyte solution is the loading volume.
The fluorescence intensity in each condition is shown (
Table 1). It can be seen that the intensity did not significantly differ (
p-value = 0.48 > 0.05) at the 95% confidence level. This implies that the proposed minicolumn could be applied for various Atz concentrations and volumes.
Two calibration curves of a series of Atz concentrations from 0.2 to 1.0 µM were obtained after passing MIPUF (y = 87.25x + 311.58, R
2 = 0.9887) and NIPUF (y = 5.6x + 288.51, R
2 = 0.0087) minicolumns (
Figure 11). The calibration curve from MIPUF (red) revealed good linearity due to its uniformity and the suitable size of the cavity for Atz, in contrast to converse properties found for NIPUF (blue). The fluorescence intensity was enhanced by 15.6 times. This indicates the efficiency of MIPUF in retaining an analyte, compared with that of NIPUF.
The LOD and LOQ were determined to be 0.035 and 0.11 µM (35 and 110 nM), respectively, calculated using the formulas LOD = 3 SD/m and LOQ = 10 SD/m, where SD is the standard deviation of the blank measurements and m is the slope of the calibration curve of eluted Atz solutions after passing through MIPUF. It should be noted that, for samples containing very low Atz concentrations, the loading volume can be increased to bring the measured value within the range of the available calibration curve. The time for loading should be considered. The relative standard deviation was 0.6% (n = 10).
3.7. Selectivity
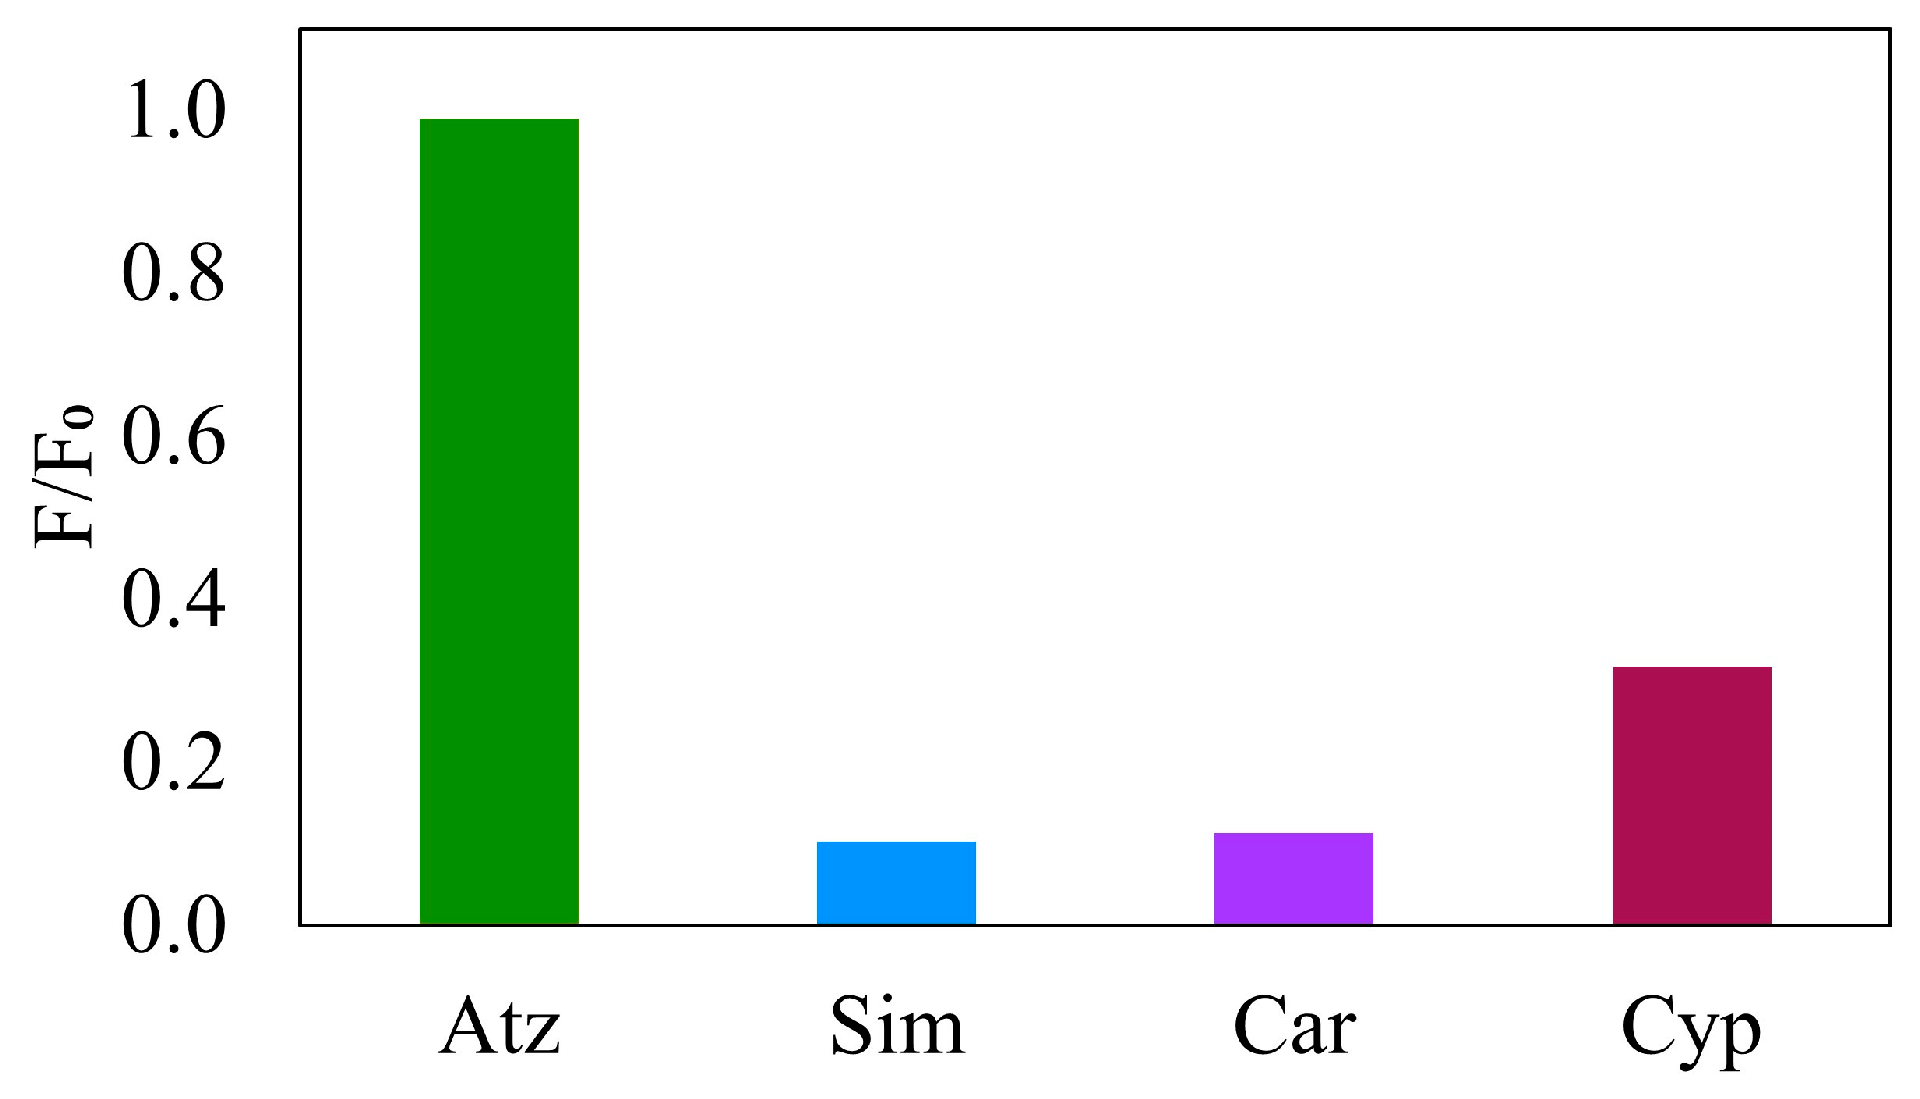
Some analogous structures and available pesticides in Thailand were chosen for selectivity study (
Figure 12). MIPUF-Atz was percolated by 1 µM of each pesticide in each MIPUF minicolumn, namely, Atz, Sim, Car, and Cyp, before eluting and detection by fluorescence as a ratio of F/F
0 (n = 10), in which F is the fluorescence intensity of an eluate and F
0 is the fluorescence intensity of each pesticide not passed through the column. Atz depicted a higher ratio than the others, indicating the high selectivity of MIPUF for Atz.
3.8. Interference Study
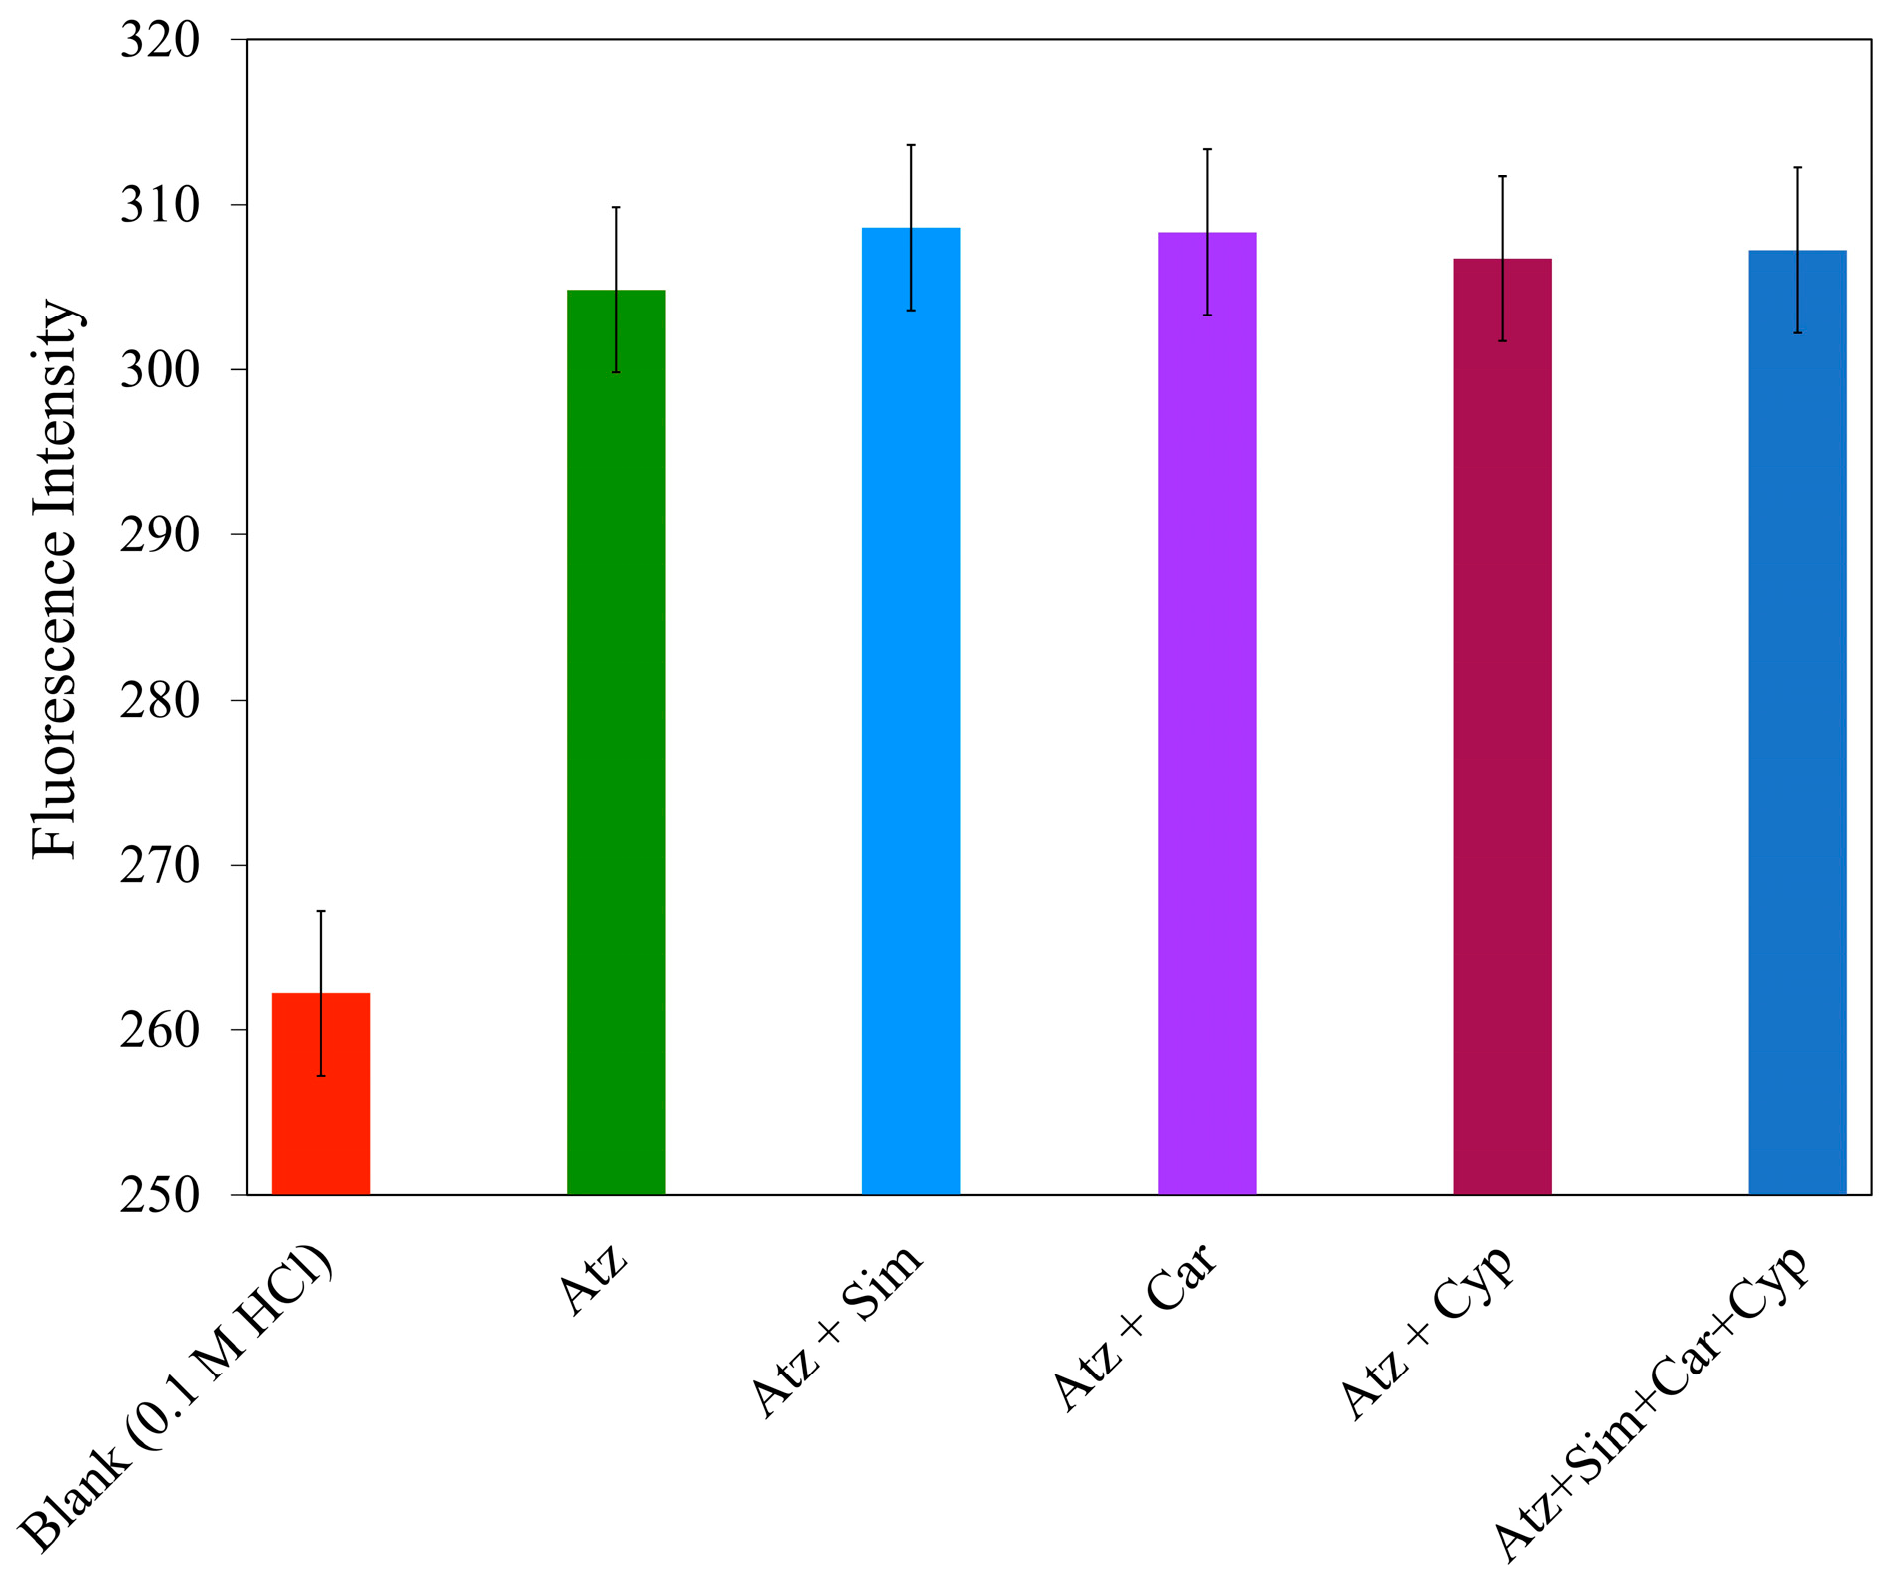
Then, 1.25 µM Atz and other solutions, namely, Sim, Car, and Cyp at 10, 40, and 0.05 µM, were prepared. The concentration of the other pesticides was based on the concentration that may be found in a real water sample, such as in rivers and surface water. They were passed through the proposed minicolumn. Each eluent was measured to obtain the fluorescence intensity. All mixed pesticides solutions (n = 10) showed fluorescence intensities that did not significantly differ from pure Atz, with a
p-value = 0.45 at the 95% confidence level (
Figure 13). This result confirmed the selectivity of the proposed minicolumn to Atz. Another predominant advantage, apart from effective selectivity of MIPUF to Atz, is that the fluorescence can be used specifically to measure a certain pesticide by choosing a proper excitation and emission wavelength; indeed, pesticides like Cyp could dramatically interfere with Atz determination if the MIPUF was not involved, owing to their similar ranges of wavelengths.
3.9. Application to Real Water Samples
The proposed method was tested for real application for Atz determination in natural water. Surface water samples (1–4) from several orchards and river water samples (1–2) in Thailand were collected. All water samples with pH values 6.0 ± 0.5 were filtrated by using filter paper to eliminate any solids before direct loading into the MIPUF minicolumn without further sample pretreatment, allowing for on-site sampling. Three samples were spiked by 0.20 µM Atz std, and the amounts found are summarized in
Table 2. The % recoveries were between 90 and 110%, with the %RSD less than 5%, indicating the good accuracy and precision of the proposed procedure.
Good sensitivity and simple preparation of MIPUF, cost-effectiveness, fewer steps for detection, and effective selectivity for Atz comprise its distinctive advantages. Some materials present a disadvantageous condition for synthesis, e.g., a high temperature [
9,
11,
17]. The LOD of the presented work could be compared with other recent MIPs for Atz, as shown in
Table 3, especially the fluorescence technique. Detection by fluorescence offered a cheaper cost and greater ease of operation than other techniques such as HPLC and electrochemical detection. The MIPUF can be prepared using simple procedures including room temperature and without an oxygen-free environment. Although the total detection time was about 30 min, the MIPUF minicolumn can be set up in more than one column simultaneously. For instance, the peristaltic pump used can be installed with the Tygon tube at the roller for up to eight channels with eight MIPUF minicolumns. The LOD was 35 nM, and the loading volume may be increased to enhance the sensitivity. The impact factor was high compared with that of NIPUF. This implies the selectivity of the target molecule.
