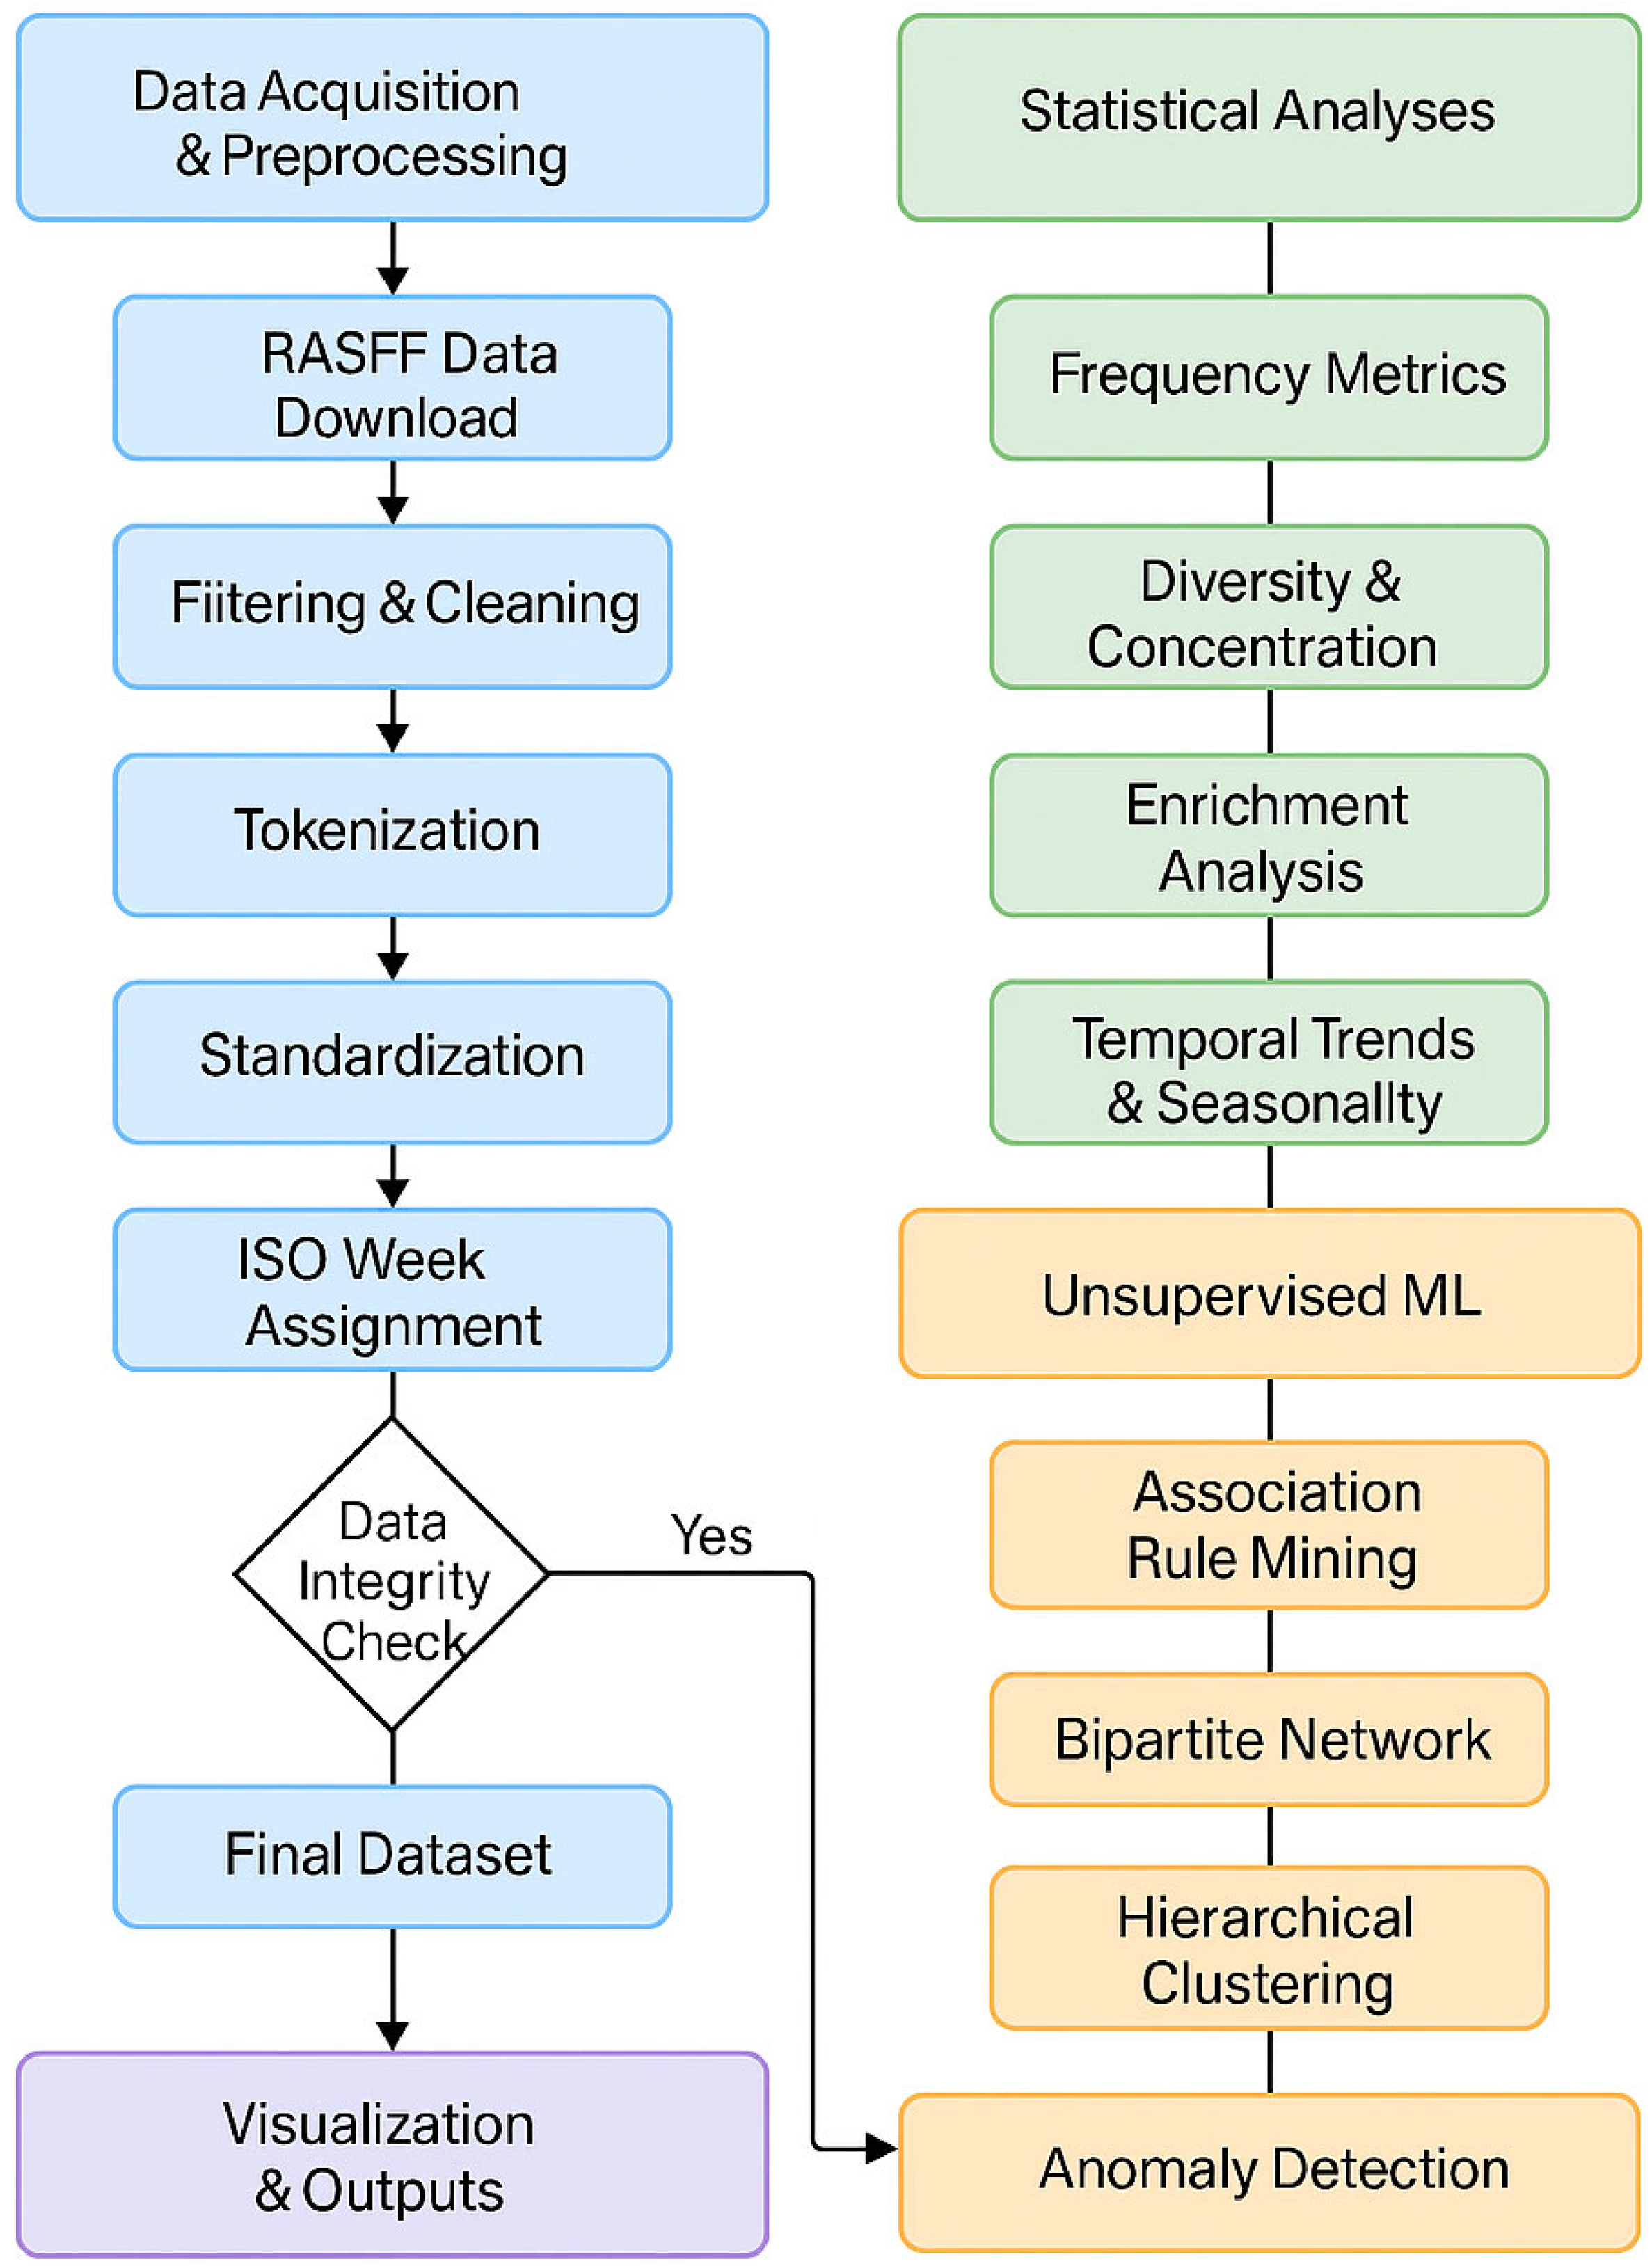
1. Introduction
The pesticide residues in agricultural products constitute significant health and trade concerns globally due to their potential to adversely impact consumer health and disrupt international trade flows [
1,
2]. International commerce in fruits and vegetables particularly faces stringent regulatory oversight, primarily through maximum residue limits (MRLs), to safeguard consumer safety and ensure fair trade practices [
3]. Non-compliance with these regulatory thresholds frequently results in substantial economic repercussions, including shipment rejections, financial losses, and reputational damage for exporting countries [
4,
5].
Turkey stands out as a significant agricultural exporter to the European Union (EU); however, recurrent compliance failures due to pesticide residue violations underscore critical vulnerabilities within its export infrastructure [
6]. The EU’s Rapid Alert System for Food and Feed (RASFF), designed to swiftly communicate food safety issues, consistently records pesticide residue exceedances in Turkish fruit and vegetable exports, reflecting persistent regulatory challenges [
6]. Despite the availability of these alerts, comprehensive investigations into the underlying patterns, seasonal dynamics, and crop-specific associations have been limited, leaving gaps in proactive food safety risk management.
The complexities surrounding pesticide residues are intensified by variability linked to specific commodity types, regional agricultural practices, pesticide application methods, and seasonal fluctuations in farming activities [
7,
8]. Prior research highlights that residue levels can substantially differ not only between crops but also within individual commodities across different seasons, complicating regulatory compliance and risk mitigation strategies [
8]. Thus, there exists a compelling need for systematic, data-driven studies aimed at elucidating these variations to inform targeted monitoring and intervention approaches.
Addressing this critical research gap, the present study provides an extensive analysis of confirmed pesticide residue rejection alerts for Turkish agricultural exports reported through RASFF from January 2020 to May 2025. Utilizing advanced statistical techniques and interpretable machine learning methods, this investigation aims to: (1) characterize the frequency and diversity of pesticide residue rejections across commodities, (2) identify statistically significant pesticide–commodity associations indicative of systemic contamination patterns, (3) detect long-term trends and seasonal fluctuations in residue violations, and (4) uncover hidden contamination structures through unsupervised analytical approaches. This multi-layered analytical framework is expected to yield valuable operational insights, facilitating the development of commodity-specific and seasonally optimized regulatory surveillance strategies.
The novelty of this study lies in bridging statistical and machine learning-based analyses with food science and agricultural perspectives. While most prior work has remained descriptive or purely data-analytical, here the findings are interpreted through crop biology, pesticide use practices, and food safety implications, providing a cross-disciplinary contribution. Nevertheless, the study is limited to RASFF data, which excludes undetected domestic violations and lacks residue concentration values. Future studies could integrate national monitoring datasets and quantitative residue levels to refine risk characterization and predictive insight.
3. Results
3.1. Frequency Analysis and Diversity Metrics
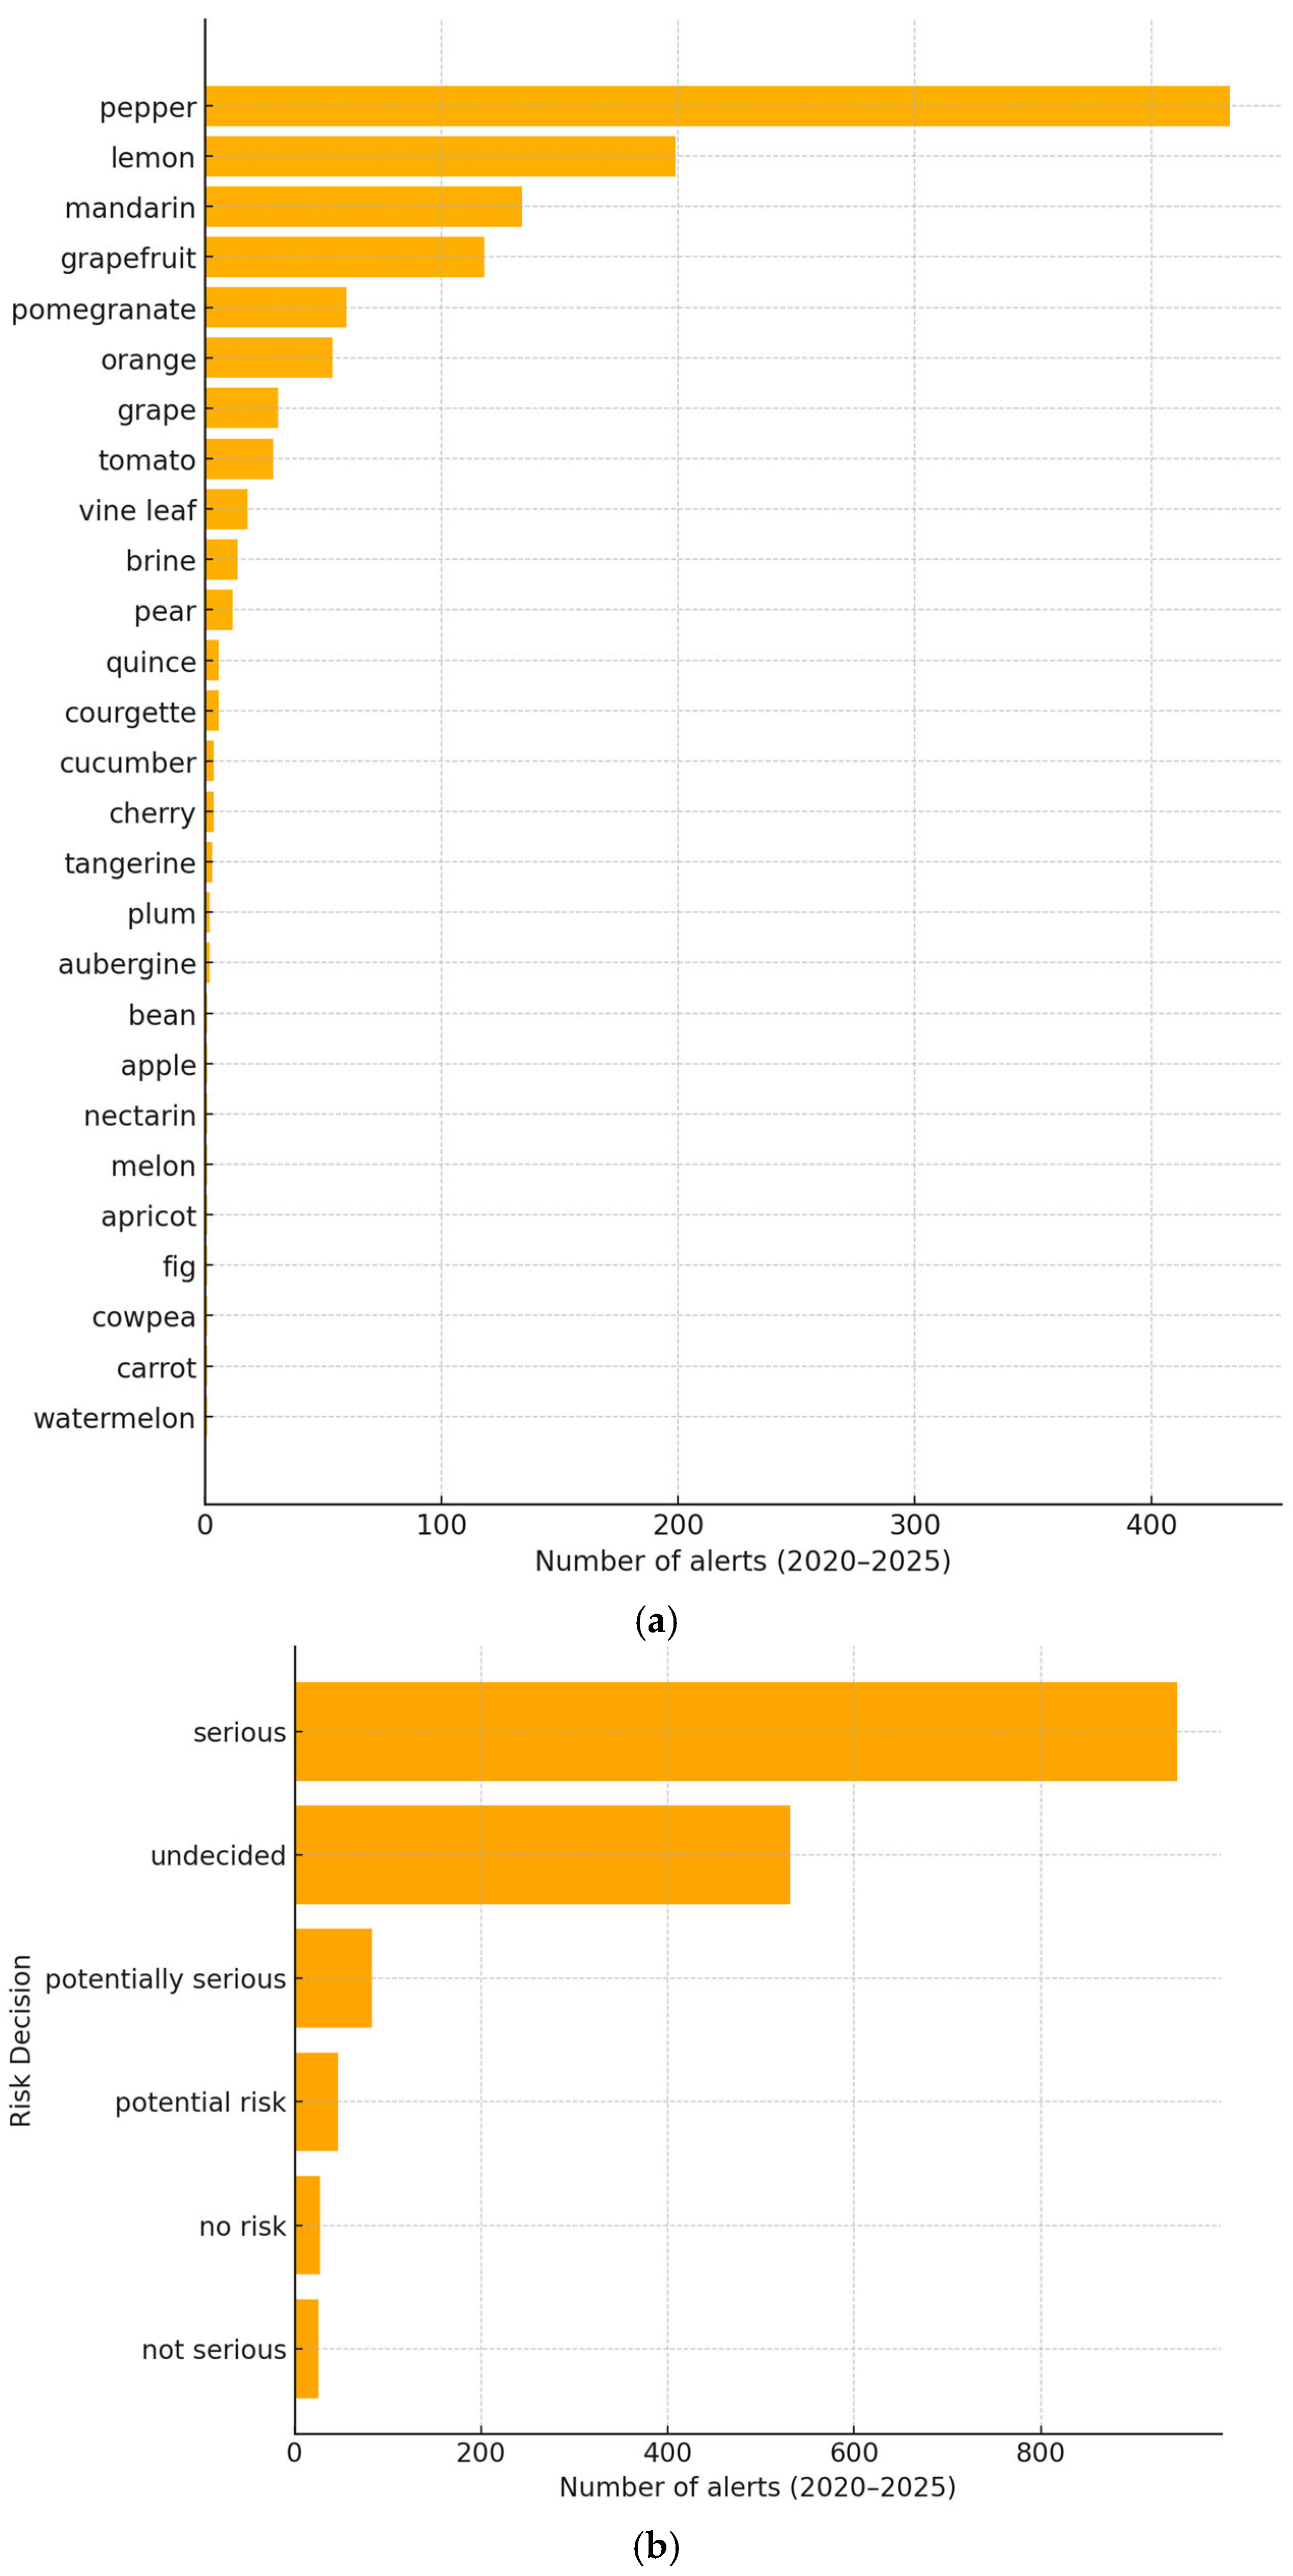
The frequency analysis of pesticide residue alerts recorded by the Rapid Alert System for Food and Feed (RASFF) from January 2020 to May 2025 revealed significant variations across commodities, pesticide types, and risk decisions. Among commodities, pepper was notably predominant, exhibiting over 400 alerts, followed by lemon, mandarin, and grapefruit, which collectively constituted the top four commodities implicated in residue violations (
Figure 2a). Conversely, watermelon, carrot, and cowpea were among commodities least frequently associated with pesticide alerts.
The analysis by risk decision revealed a clear predominance of alerts classified as “serious,” accounting for over 800 notifications (
Figure 2b). Alerts with an “undecided” risk assessment were also abundant, surpassing 600 alerts, while categories such as “potentially serious” and “potential risk” represented comparatively fewer notifications.
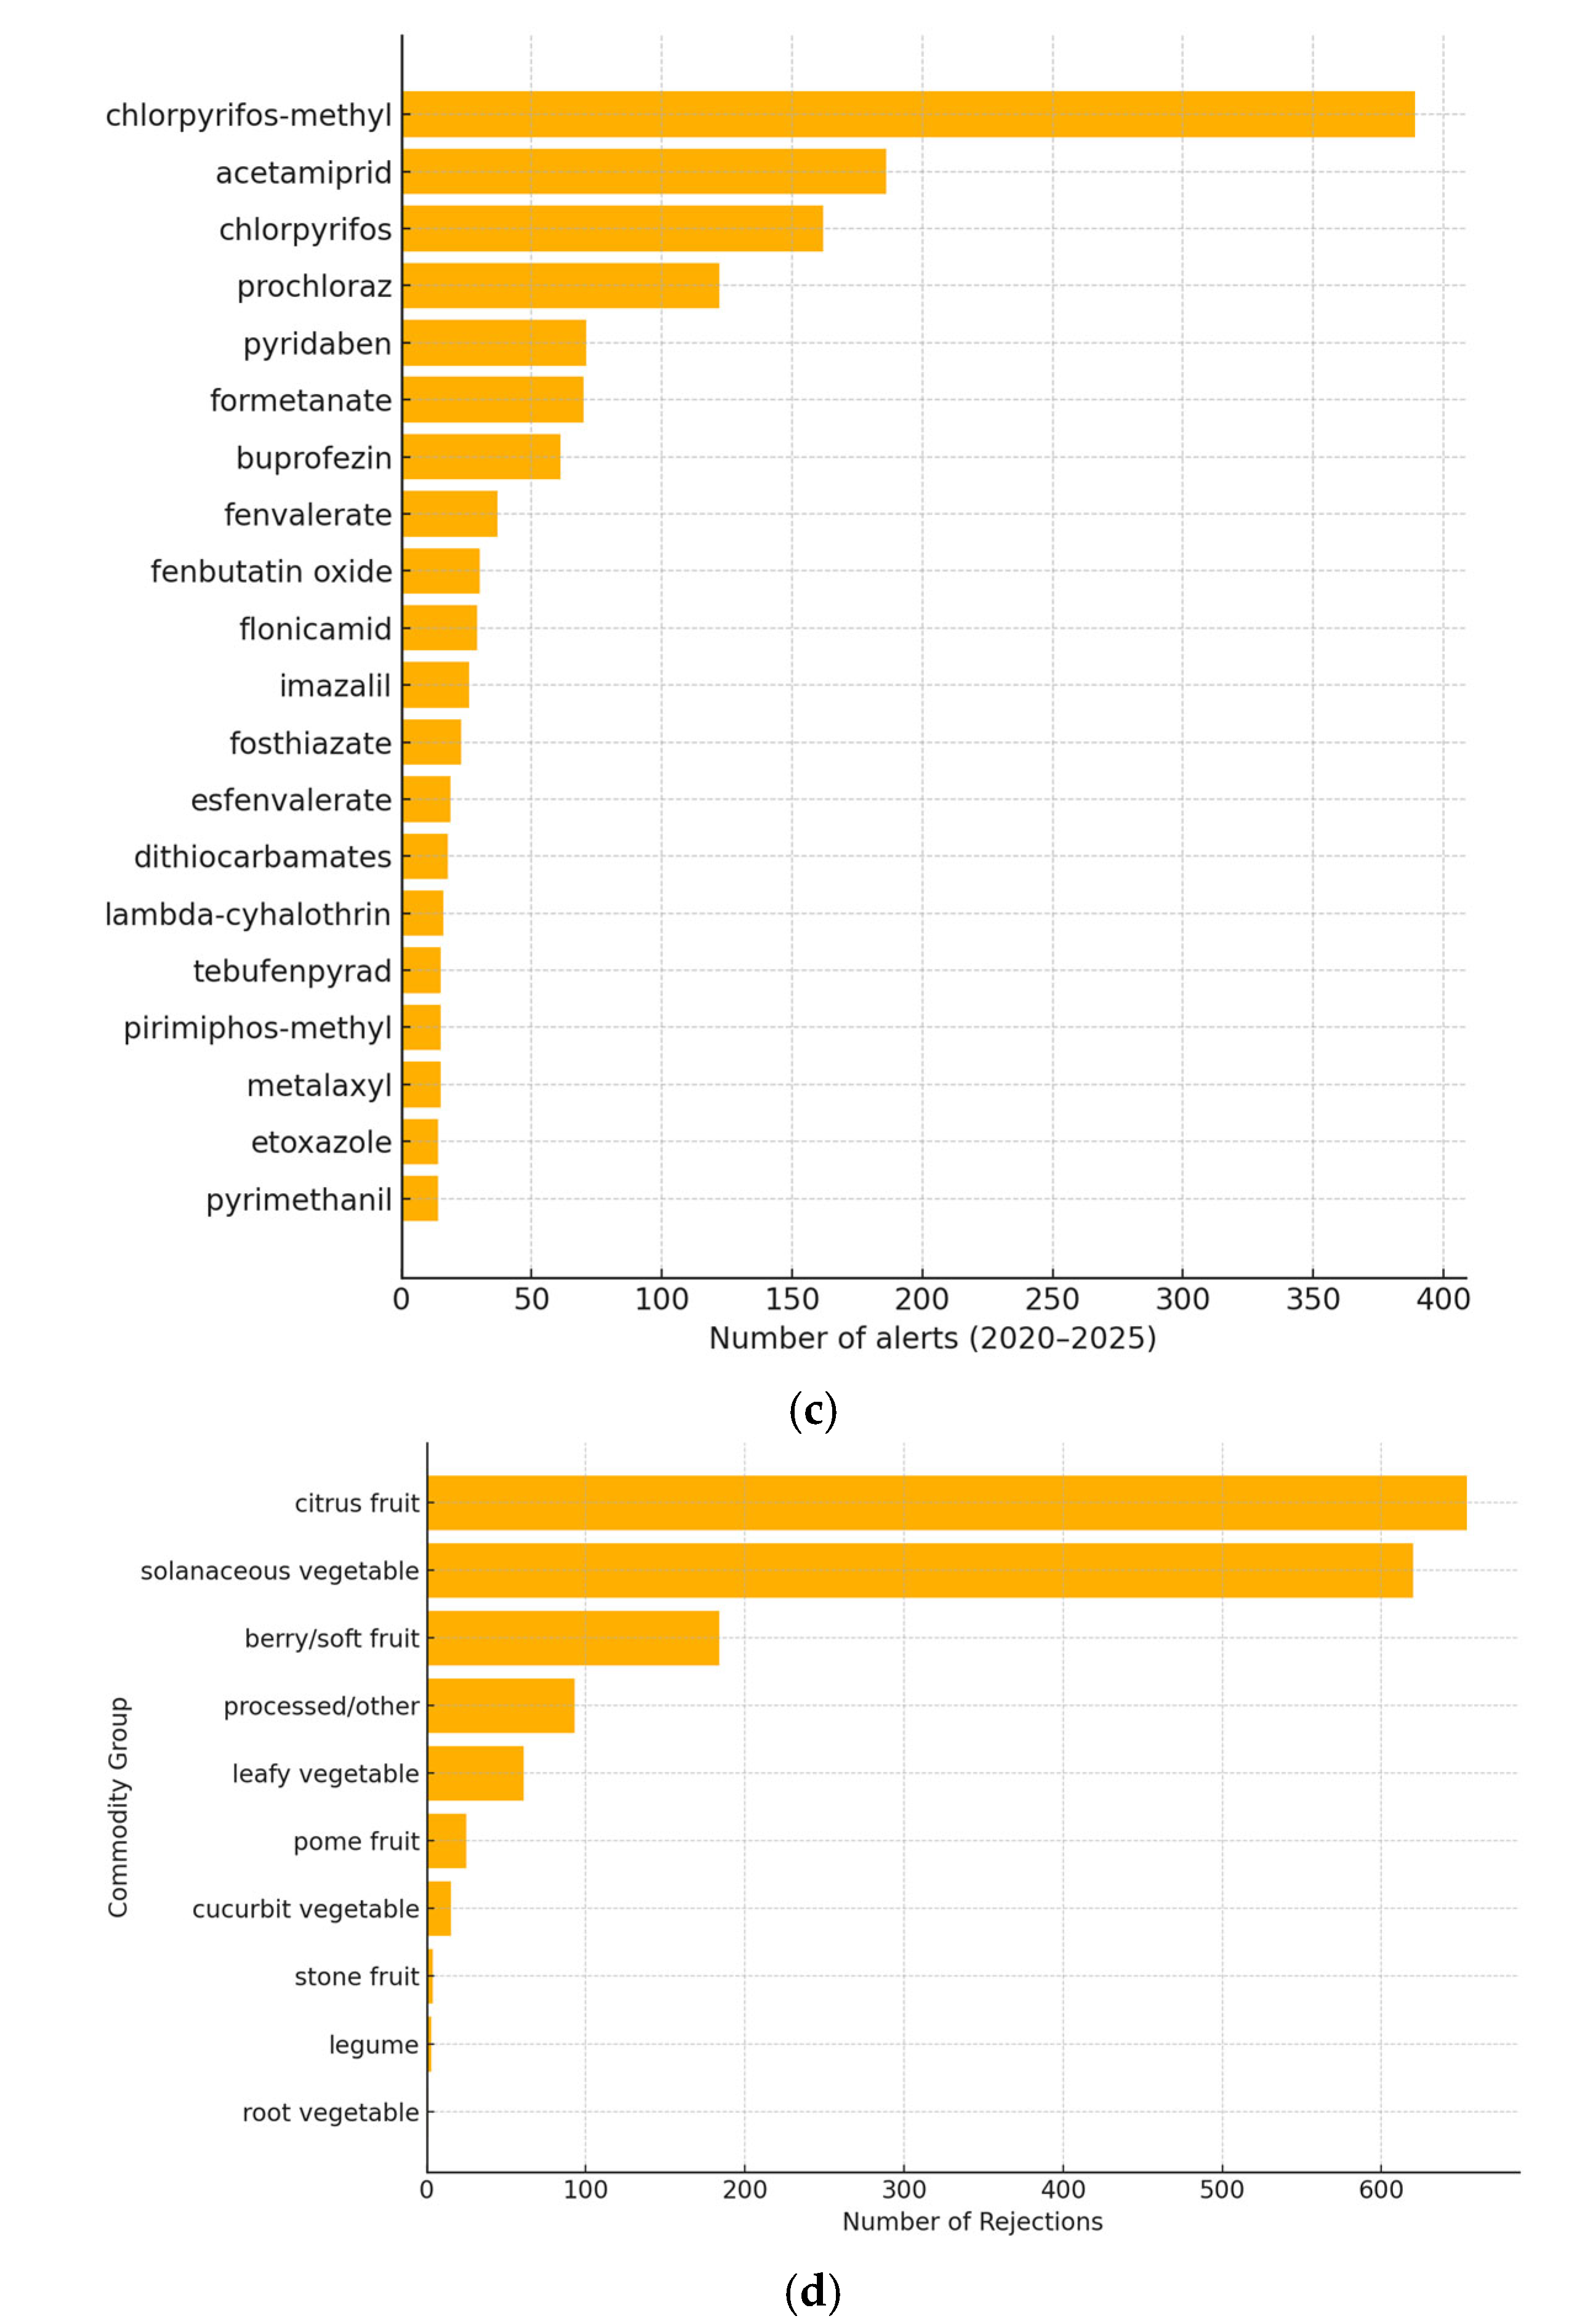
Regarding pesticide residues identified, chlorpyrifos-methyl emerged as the most frequently detected compound, surpassing 350 alerts. Acetamiprid and chlorpyrifos were also prominently detected, each exceeding 150 alerts, indicating notable persistence of these residues within affected commodities (
Figure 2c). Other significant pesticide residues included prochloraz, pyridaben, formetanate, and buprofezin.
Commodity group analysis indicated citrus fruits and solanaceous vegetables as the leading groups, each associated with more than 600 rejections (
Figure 2d). Berry/soft fruit and processed/other categories showed intermediate levels of rejections, whereas legume and root vegetable groups displayed the fewest incidents.
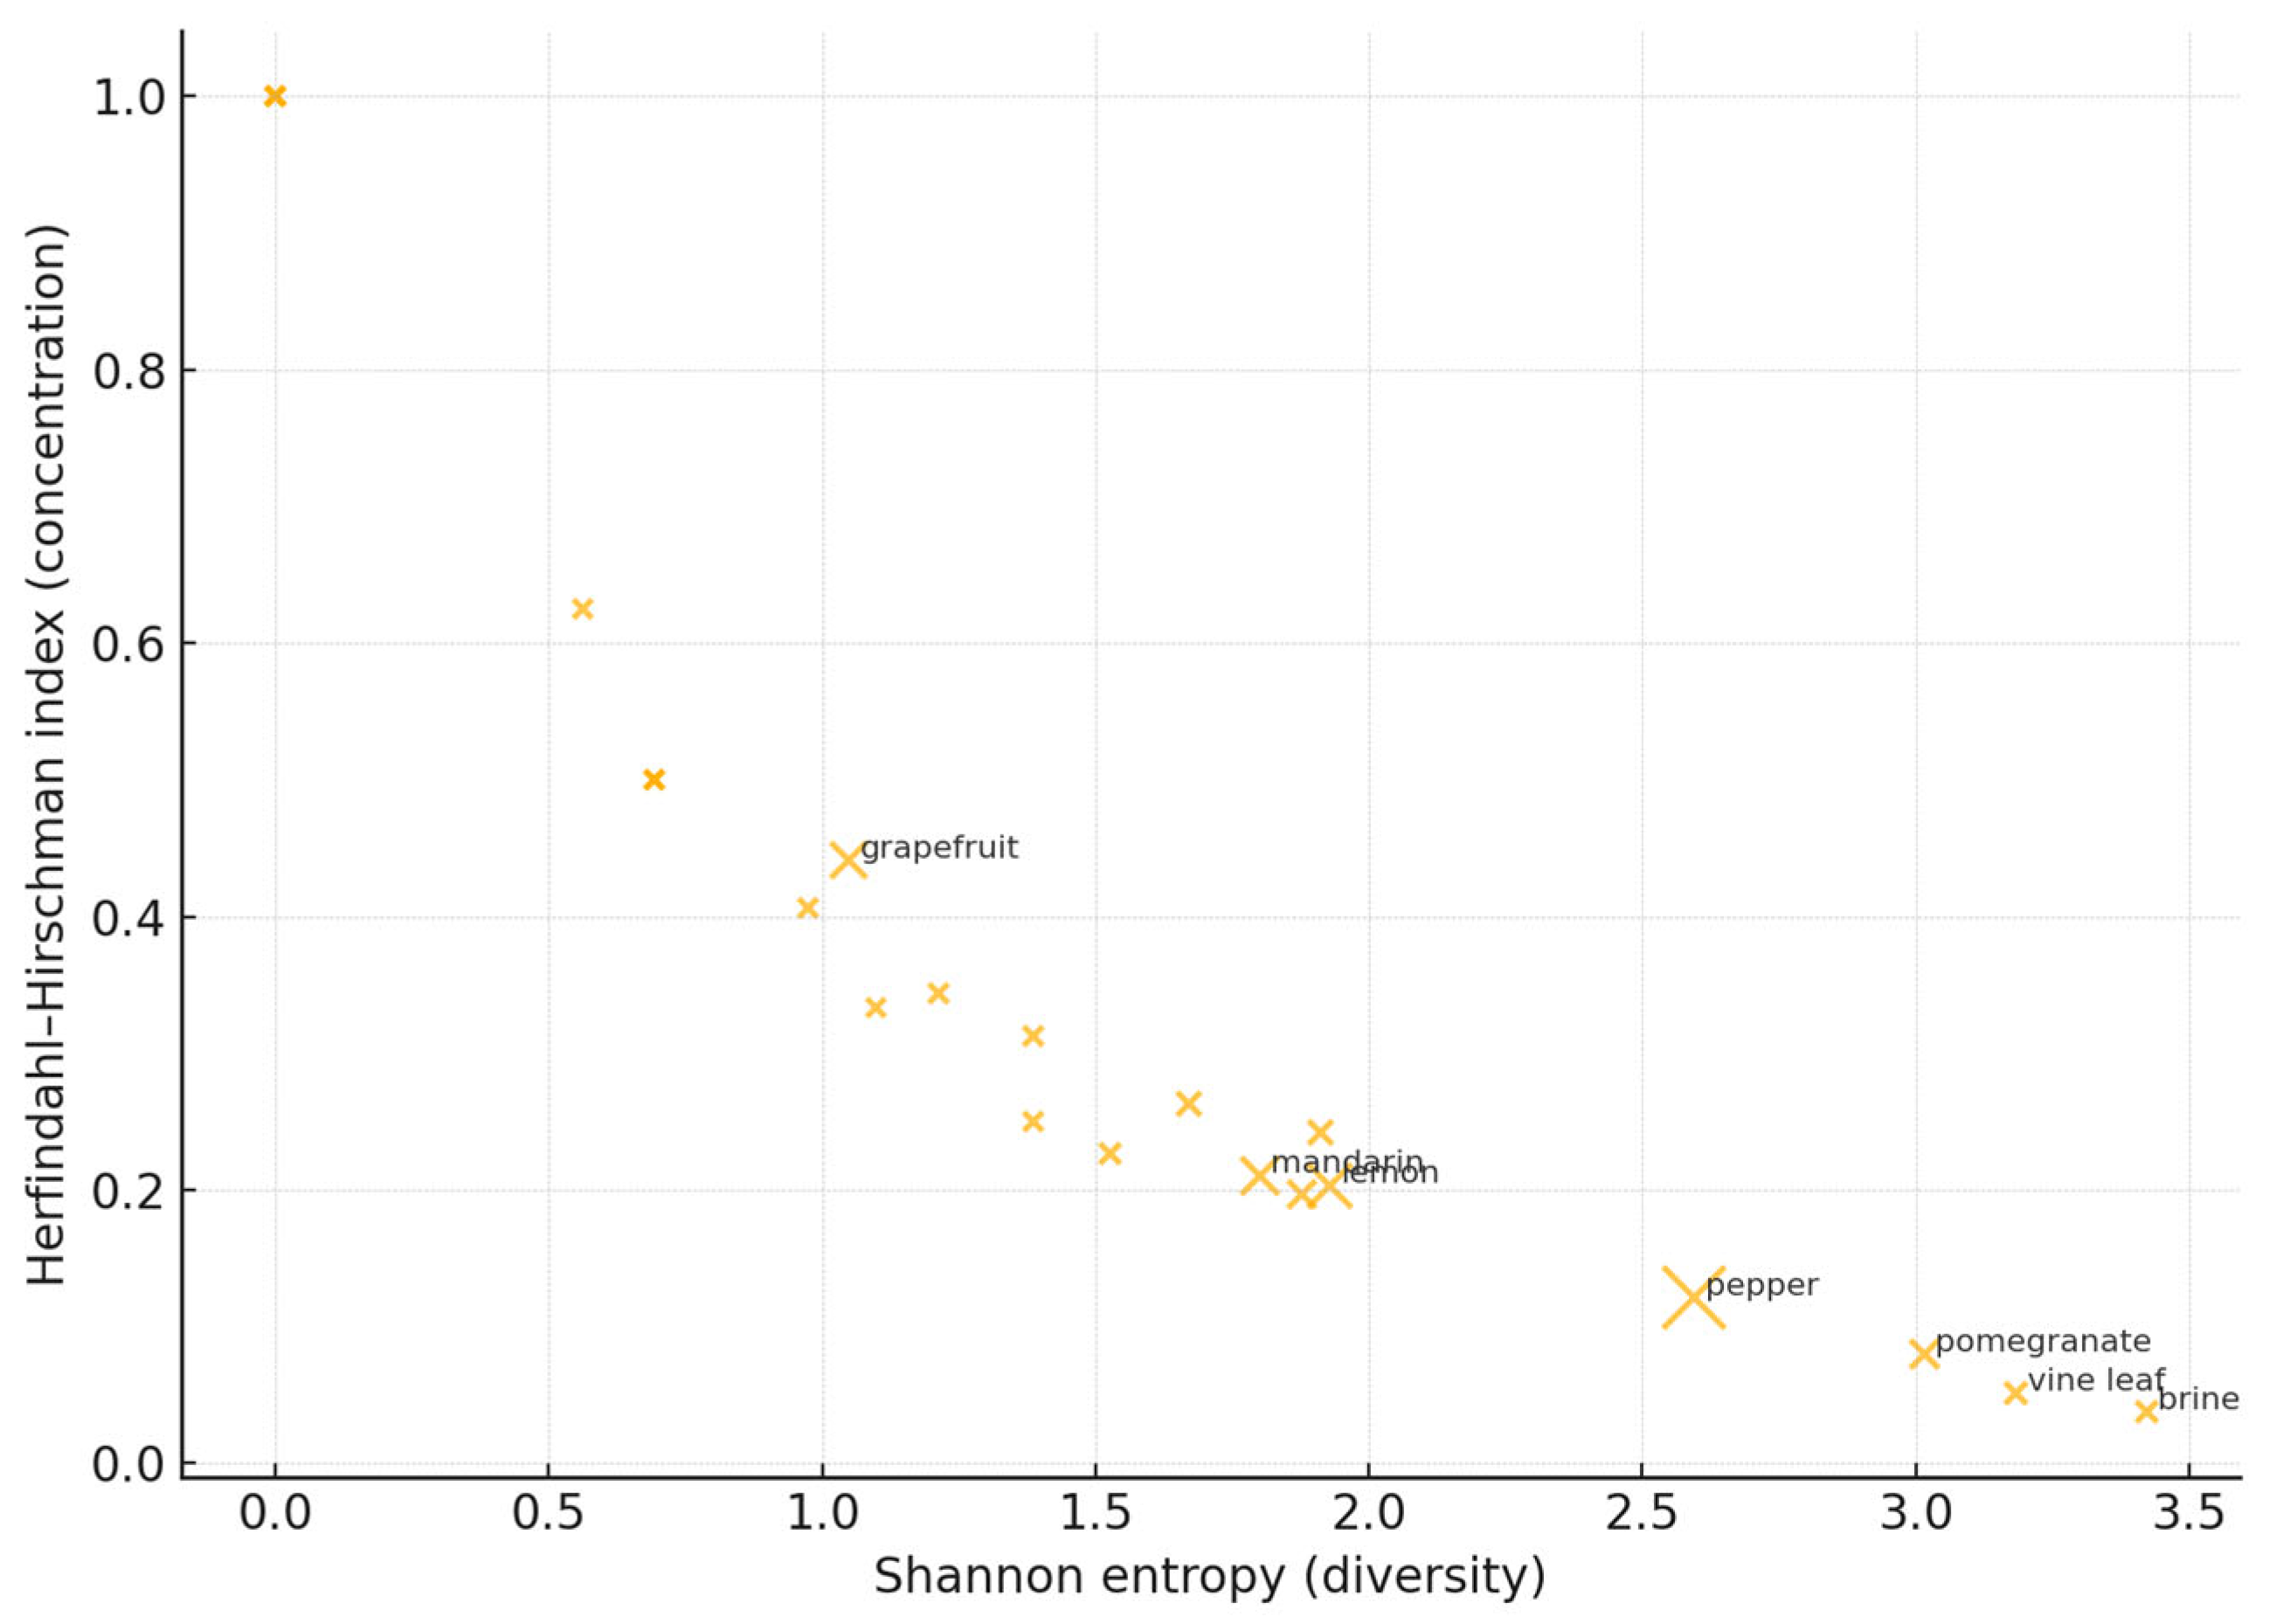
To further characterize contamination patterns, pesticide residue diversity was assessed using Shannon entropy (H) and the Herfindahl–Hirschman index (HHI), providing quantitative measures of residue diversity and concentration, respectively [
20]. Results are shown in
Figure 3. Brine-cured olives and vine leaves demonstrated the highest diversity, with H values approximately between 3.2 and 3.4, indicating contamination by a wide array of pesticide residues rather than dominance by specific compounds. Pomegranate and pepper also exhibited substantial diversity (H > 2.5), suggesting complex contamination profiles involving multiple pesticides. Conversely, commodities such as apricot, fig, carrot, bean, and apple showed extremely low diversity (H ≈ 0), each being predominantly contaminated by a single pesticide residue, highlighting highly specific contamination scenarios.
Analysis of residue concentration using HHI further clarified these contamination patterns. Brine-cured olives and vine leaves, characterized by their diverse pesticide profiles, had notably low HHI values (<0.10), reinforcing their broad contamination spectrum. Lemon exhibited moderate pesticide concentration (HHI ≈ 0.20), suggesting fewer pesticide residues were predominantly responsible for alerts. Commodities like apricot, fig, carrot, bean, and apple displayed maximum concentration (HHI = 1.00,
Figure 3), each strongly dominated by a single pesticide residue, indicating clear focal points for targeted mitigation strategies.
3.2. Commodity–Pesticide Enrichment Analysis
Commodity–pesticide enrichment analysis was performed to quantitatively identify statistically significant associations, thereby highlighting commodities frequently contaminated by specific pesticides beyond random occurrence [
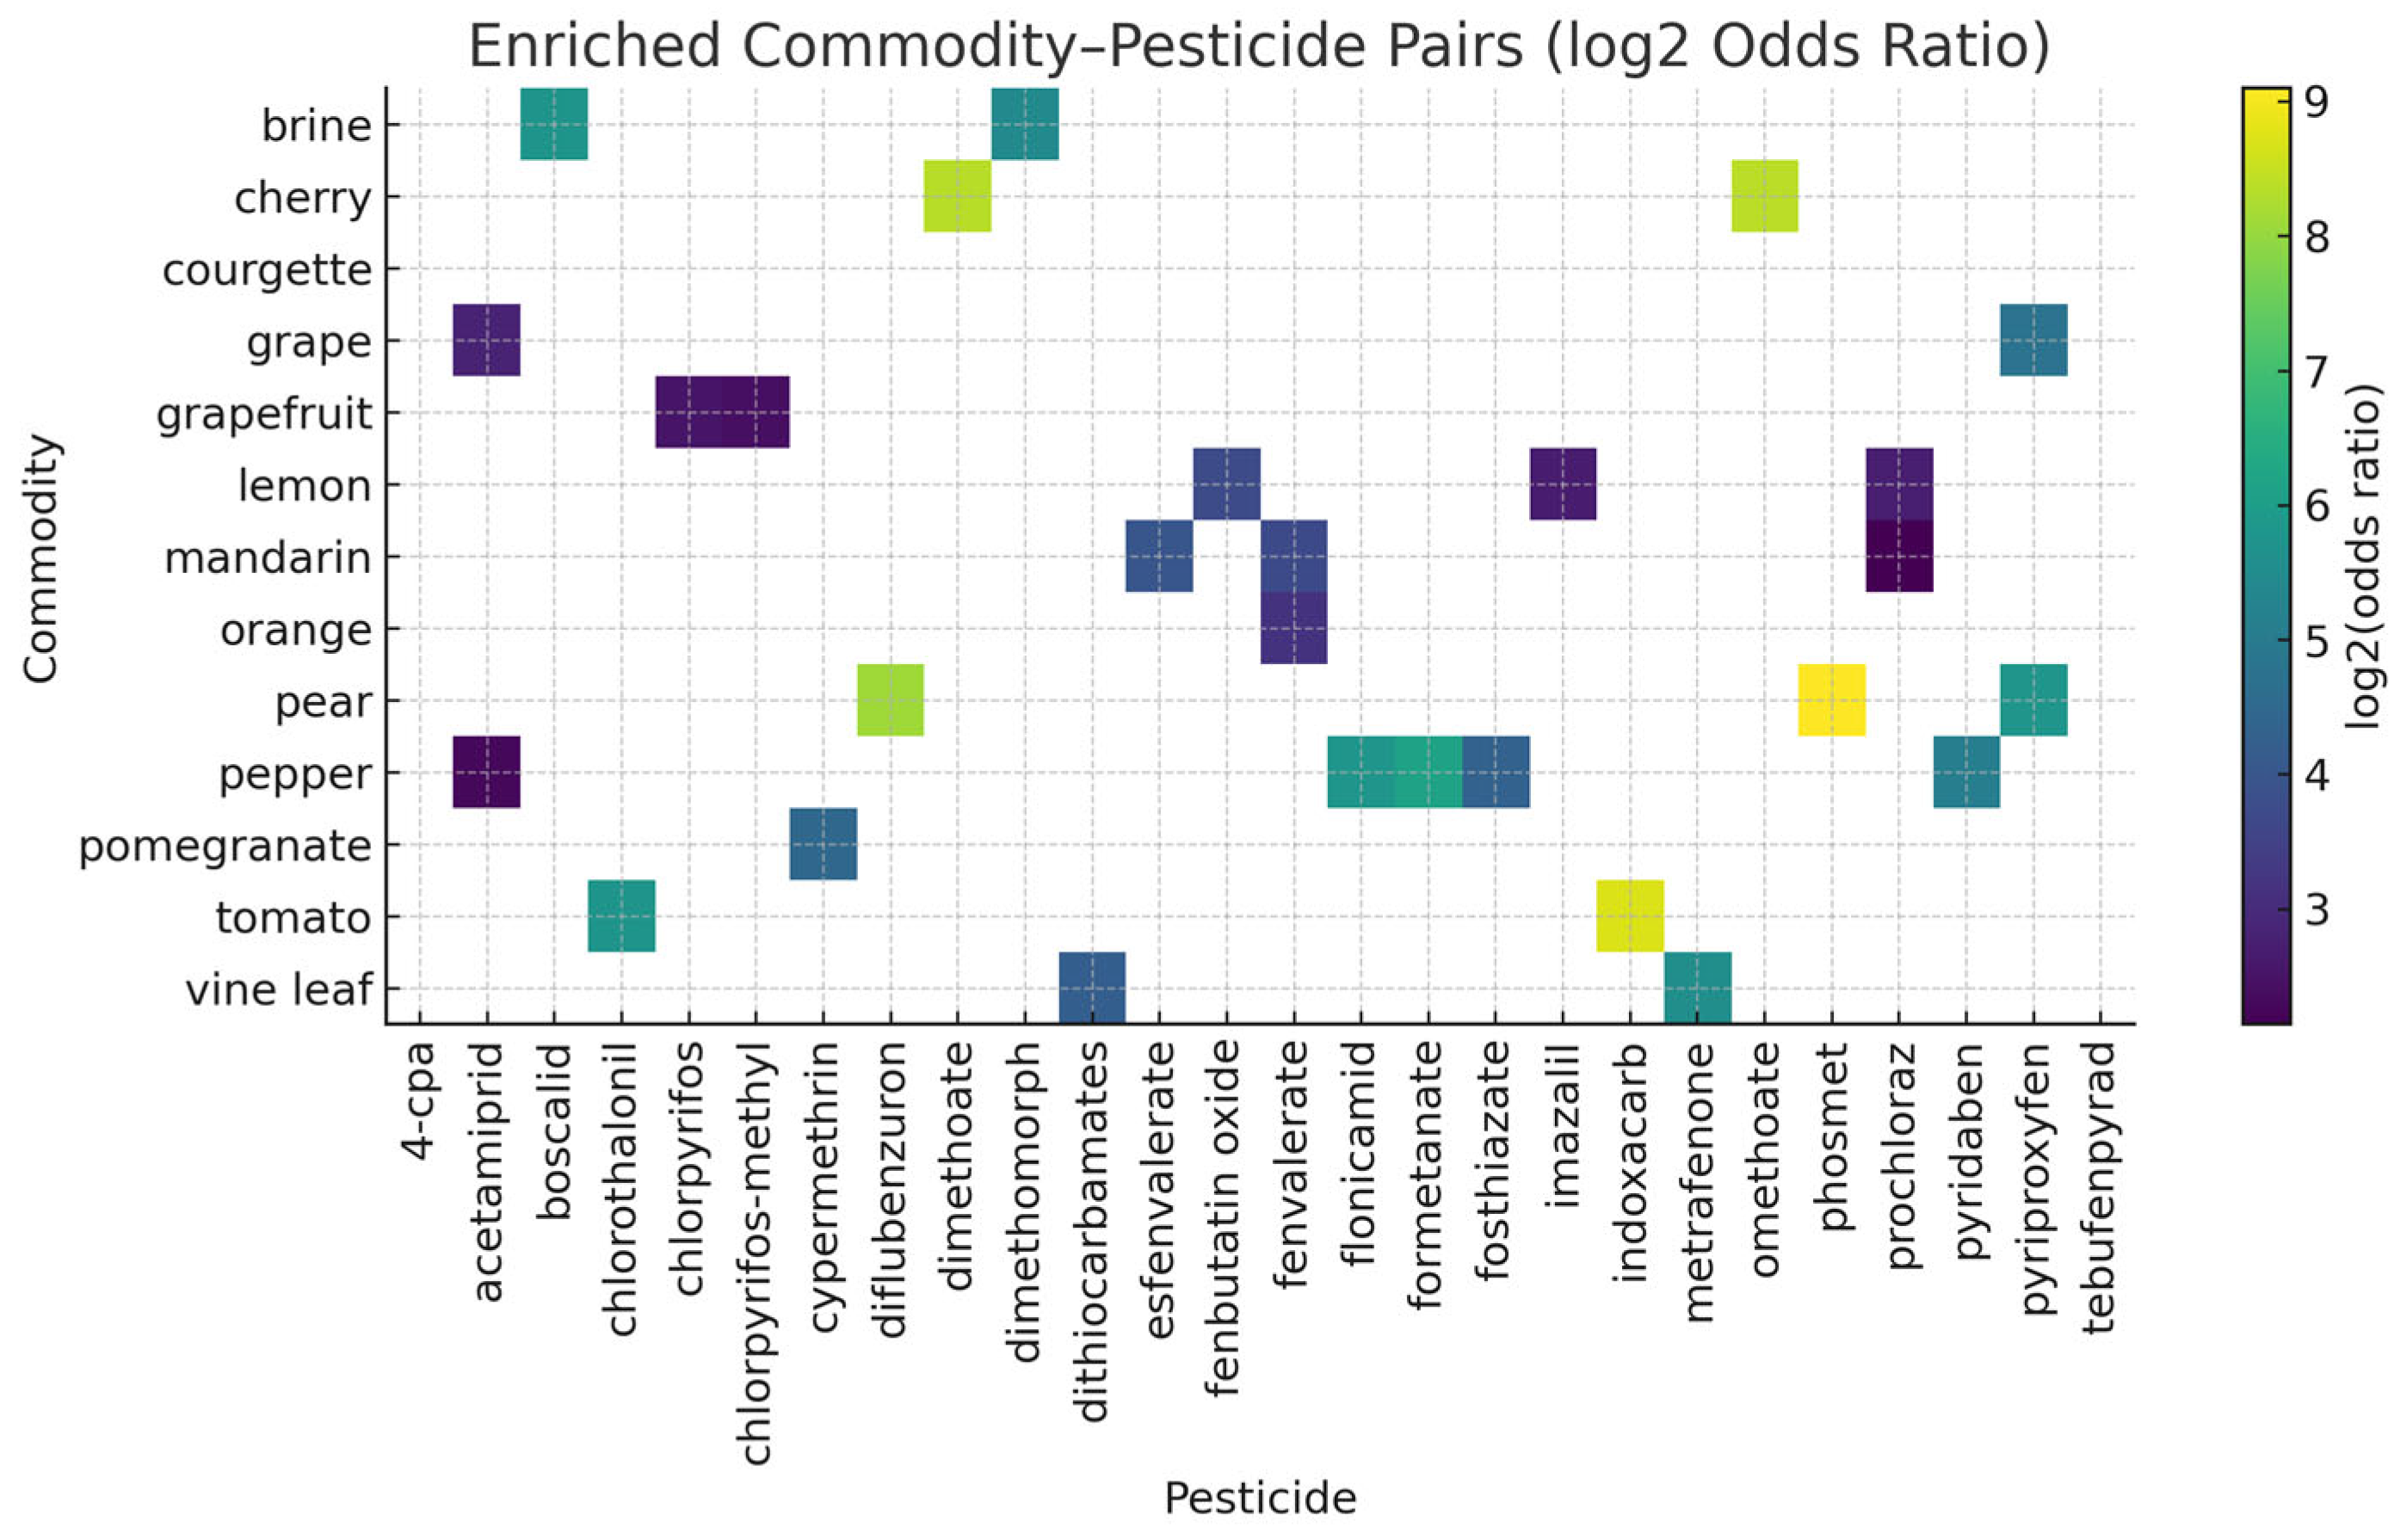
21]. The enrichment results, represented by log2 odds ratios, are illustrated in
Figure 4.
The analysis revealed pronounced associations between certain pesticides and commodities. Acetamiprid exhibited significant enrichment with grapefruit, whereas chlorpyrifos-methyl was notably enriched in lemon and mandarin. Indoxacarb showed a strong enrichment association specifically with vine leaf. Pepper displayed enrichment primarily with formetanate and pyridaben, whereas pomegranate had pronounced associations with fenvalerate and tebufenpyrad.
Less prevalent yet statistically significant enrichments were also identified, such as the association of prochloraz with cherry and grape, pyriproxyfen with courgette, and boscalid with grape. The commodities brine and pear showed distinct enrichments with specific pesticides like cypermethrin and imazalil, respectively.
Quantitative assessment highlighted notably high odds ratios for pepper associated with formetanate (71×, FDR-adjusted p-value: 2.4 × 10⁻²⁷) and pyridaben (35×, FDR-adjusted p-value: 7.0 × 10⁻²⁵). Acetamiprid also showed substantial enrichment in pepper with an odds ratio of 4.9× (FDR-adjusted p-value: 2.1 × 10⁻²¹). Grapefruit showed significant enrichment with chlorpyrifos-methyl (5.4×, FDR-adjusted p-value: 1.5 × 10⁻¹⁸), and lemon exhibited strong association with prochloraz (6.6×, FDR-adjusted p-value: 1.5 × 10⁻¹⁸).
3.3. Temporal Trend Analysis of Enriched Commodity–Pesticide Pairs
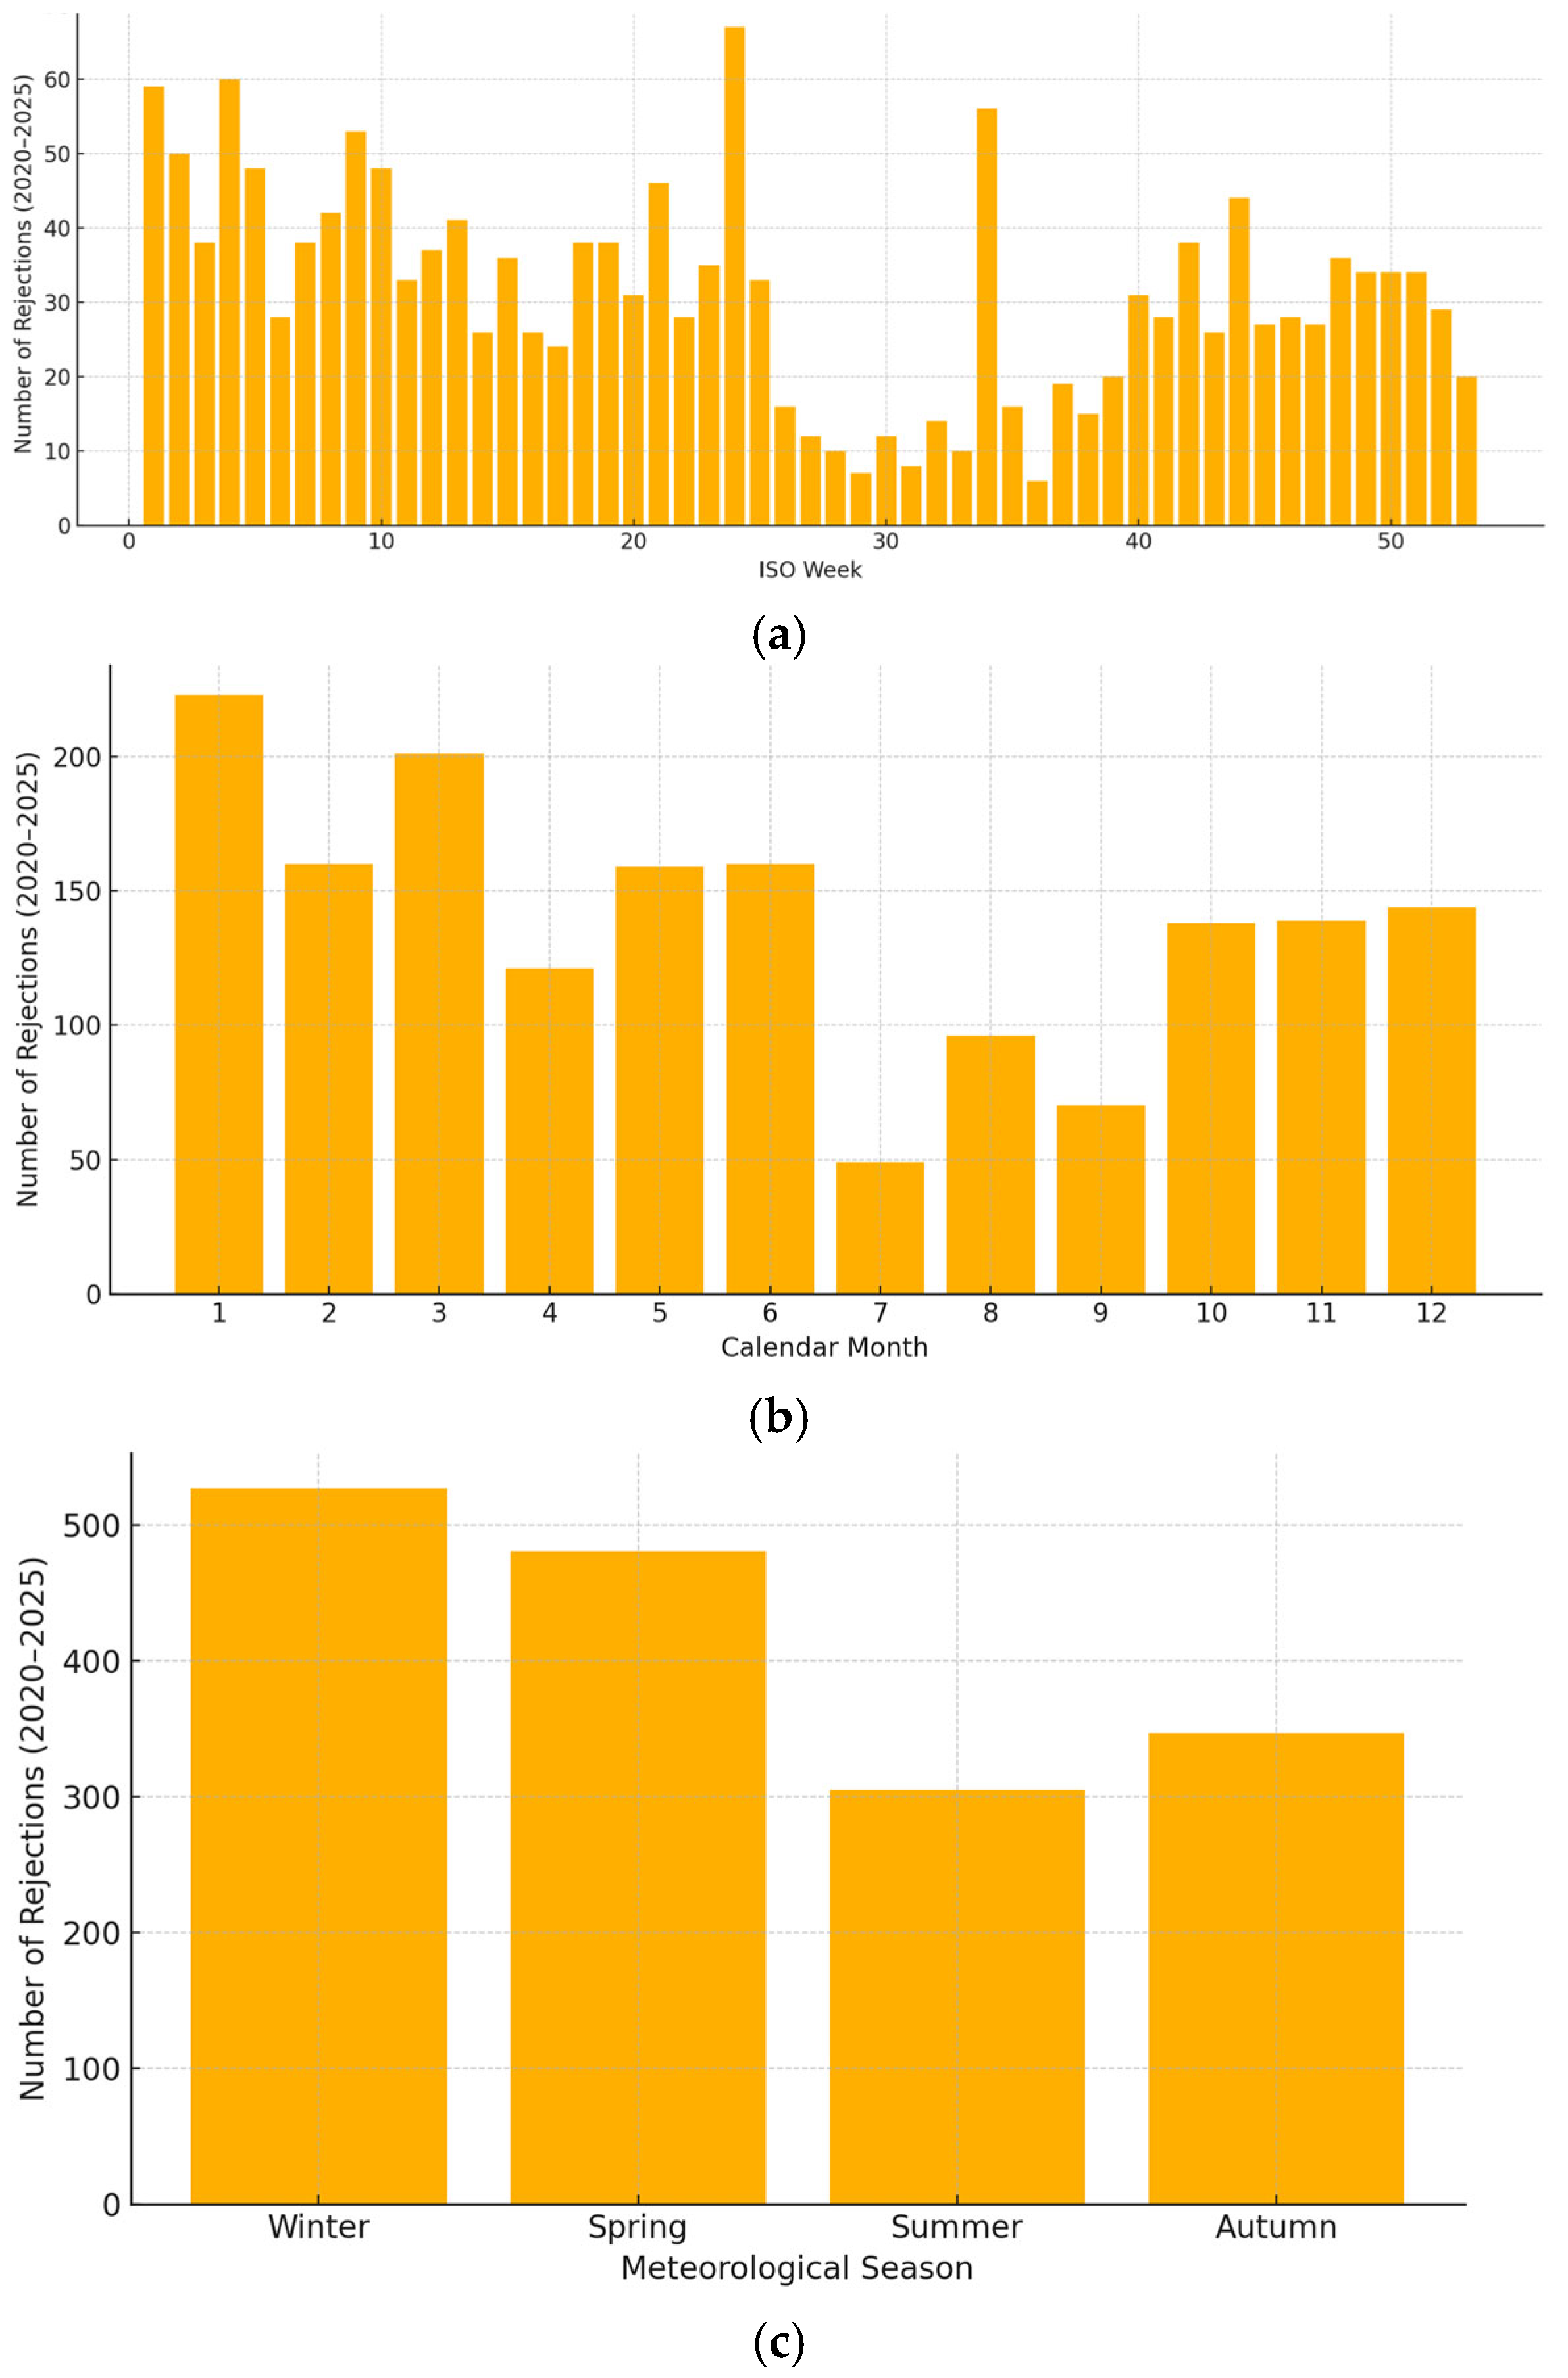
Time trend analysis was conducted to identify temporal patterns in pesticide residue rejections, providing insights into seasonal and periodic variations influencing residue alerts. Results were given in
Figure 5 and
Figure 6. Weekly analysis revealed fluctuations throughout the year, with notable peaks observed during weeks 1–4, 24 and 34, corresponding to January, early July and the end of August, respectively (
Figure 5a). These peaks reached approximately 65 and 60 rejections, indicating specific intervals of elevated pesticide-related incidents within the analyzed period.
Monthly analysis further clarified these trends, demonstrating a clear seasonal pattern of pesticide rejections. The highest frequencies of alerts were recorded during January, February, and March, each exceeding 200 rejections, with a secondary peak in May-June (
Figure 5b). Conversely, July and September recorded the fewest rejections, each falling below 100, signifying periods of reduced pesticide residue issues.
Seasonal analysis underscored a distinct variability, with winter exhibiting the highest rejection frequency, totaling over 500 incidents (
Figure 5c). Spring followed closely, surpassing 450 rejections. The lowest rejection frequencies were observed during summer, with approximately 300 rejections, reflecting a significant seasonal variation in pesticide residue occurrence.
Temporal trend analysis was conducted to identify monotonic trends and seasonal patterns for significantly enriched commodity–pesticide pairs, providing insights into the dynamics of pesticide residue violations over time [
13,
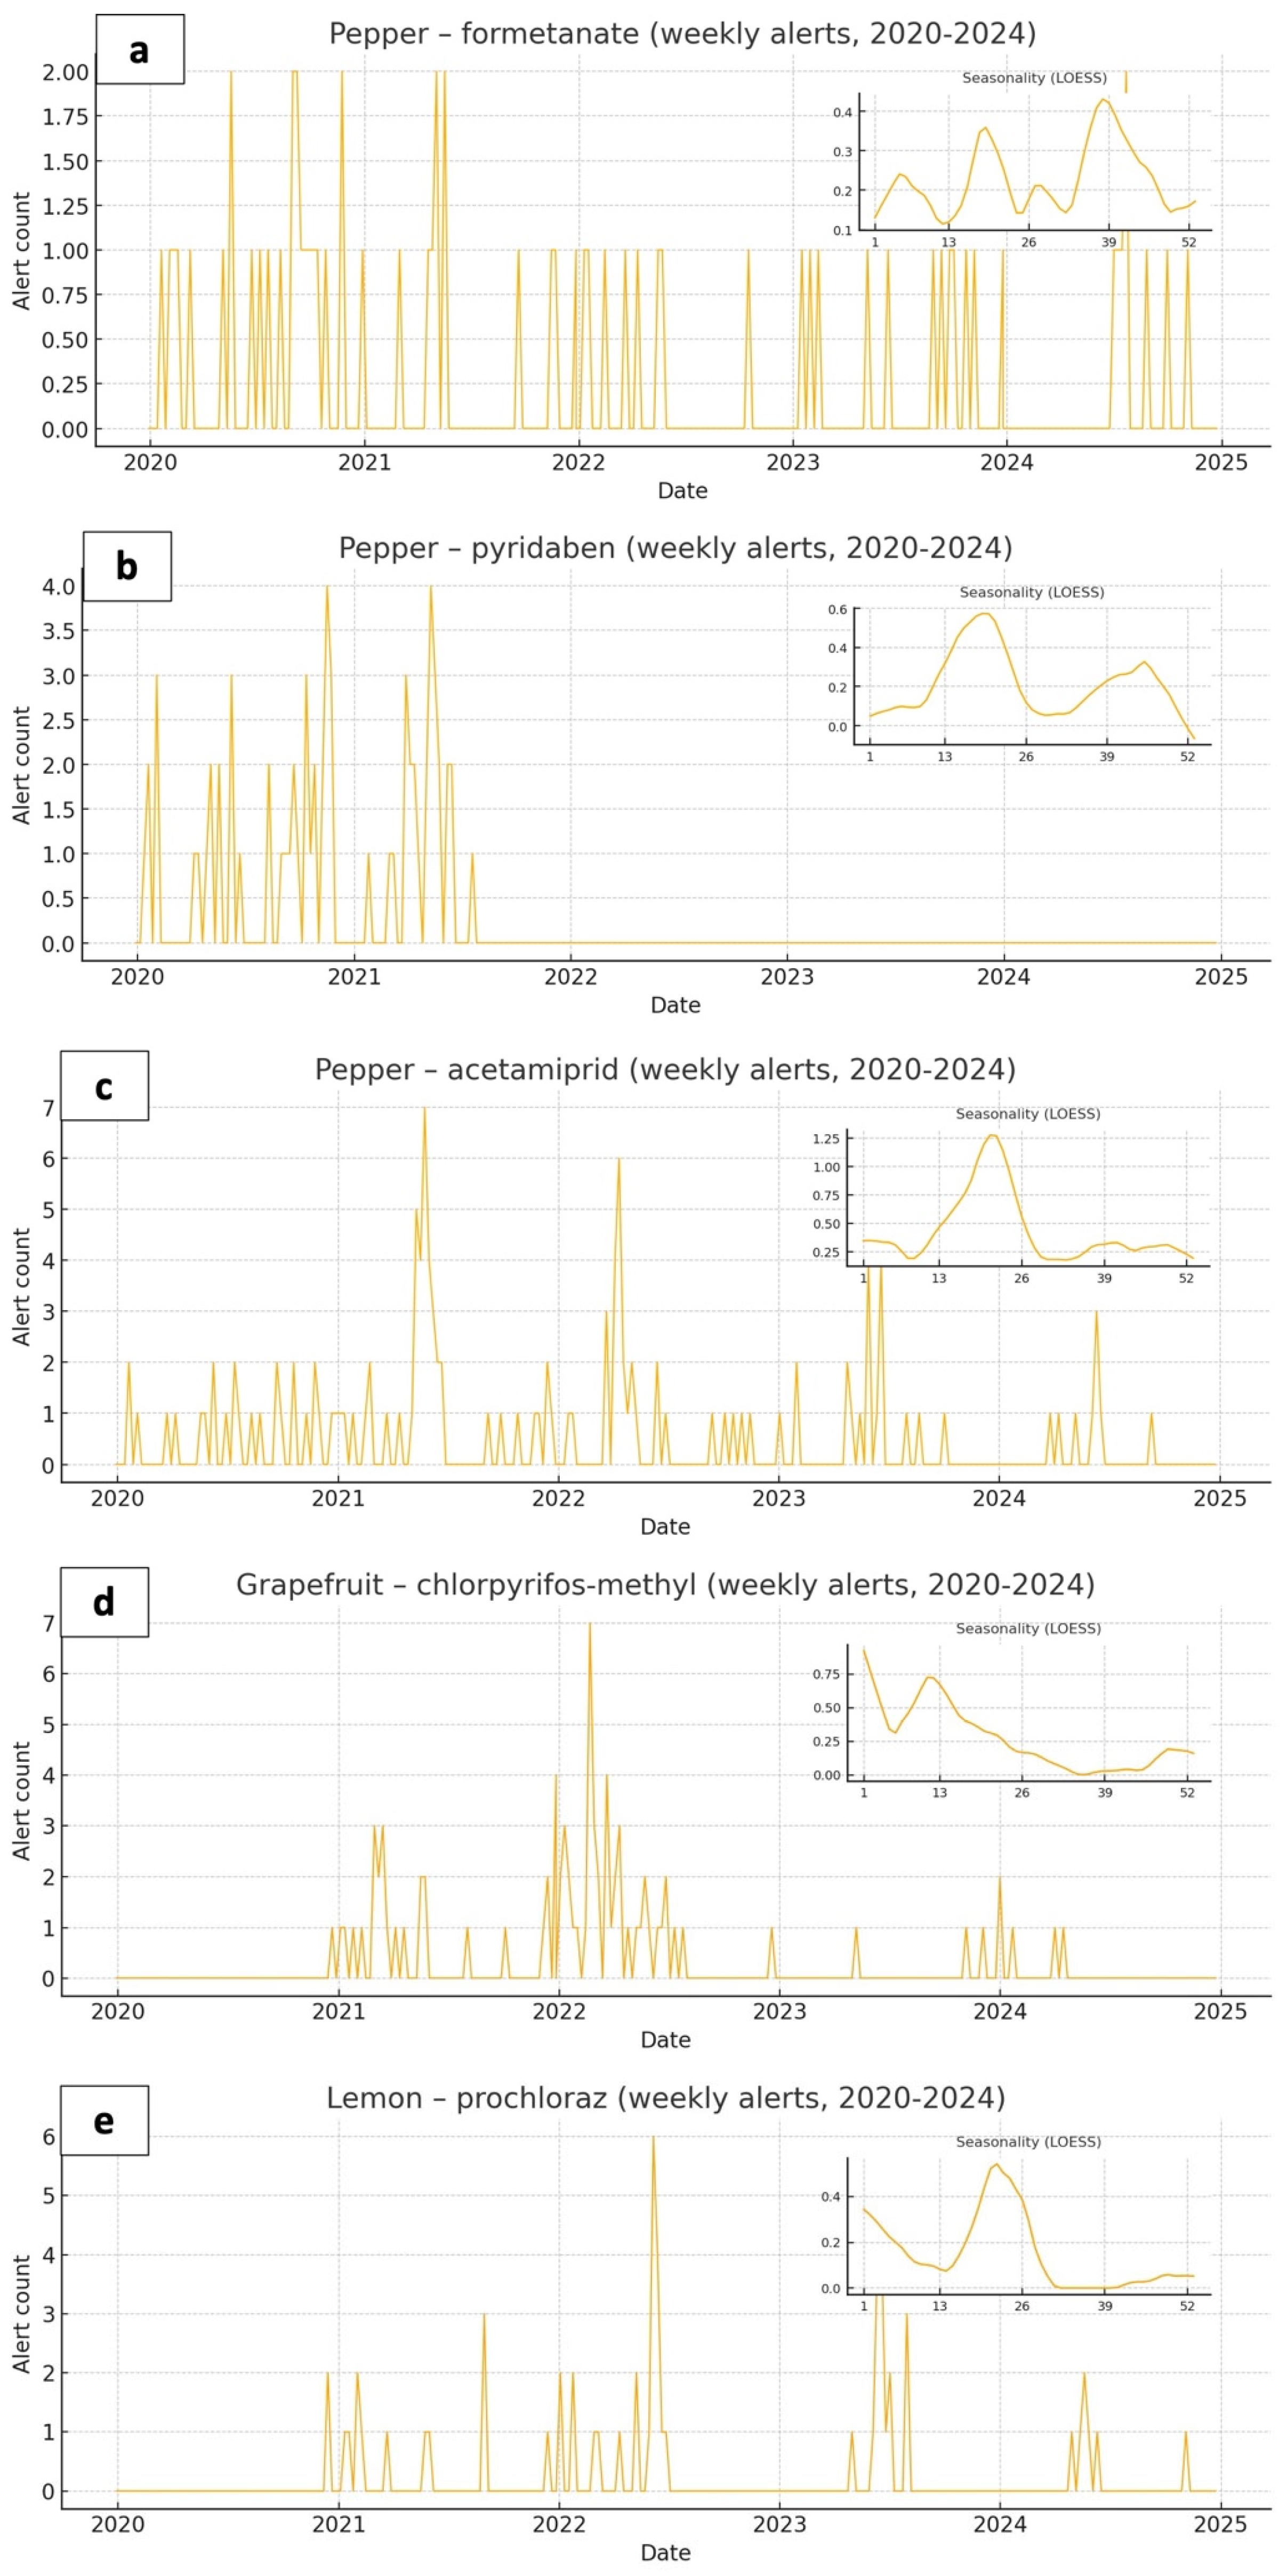
22]. Weekly alerts from the five-year period (2020–2024) were analyzed using the Mann–Kendall test and locally estimated scatterplot smoothing (LOESS) to characterize trends and seasonal peaks, respectively. Results are shown in
Figure 6.
For pepper–formetanate, alerts displayed consistent but intermittent occurrences, predominantly observed during late summer and early autumn (weeks 35–42). The LOESS-smoothed seasonal analysis indicated a distinct peak at approximately week 38, underscoring seasonal concentration of residue violations within this period (
Figure 6a). Despite these clear seasonal fluctuations, no statistically significant monotonic trend was detected.
Pepper–pyridaben alerts showed a pronounced peak early in the study period, notably from late 2020 through early 2021, with a substantial reduction afterward. LOESS revealed a prominent seasonal peak centered around weeks 15–20, indicating heightened alerts during late spring and early summer (
Figure 6b). The substantial drop post-2021 led to an overall significant decreasing trend (τ negative, adjusted
p < 0.05).
Pepper–acetamiprid alerts demonstrated regularity throughout the study period, with peaks generally recurring annually around spring through early summer (weeks 15–24). LOESS-smoothed analysis highlighted a distinct peak around week 21, coinciding with late spring (
Figure 6c). However, no statistically significant monotonic trend was observed.
Grapefruit–chlorpyrifos-methyl alerts were concentrated primarily in 2022, exhibiting intermittent peaks with a clear reduction thereafter. Seasonality analysis through LOESS indicated maximum alert frequency during early winter (weeks 1–6), suggesting seasonal dependency early in the calendar year (
Figure 6d). Despite the evident concentration within a specific period, no statistically significant monotonic trend emerged.
Lemon–prochloraz alerts revealed a concentration of incidents in mid-to-late 2021, later peaking in mid 2022, then followed by sporadic occurrences afterward. Seasonal analysis illustrated peak alerts during, late spring to early summer (weeks 20–25), aligning with periods of increased detection frequency as shown by LOESS (
Figure 6e). Similar to other pairs, no statistically significant monotonic trend was detected.
3.4. Association Rule Mining
To uncover frequently co-occurring pesticide residues within rejected exports, we applied association rule mining using the Apriori algorithm [
15], a widely used unsupervised learning method for identifying meaningful itemsets in transactional datasets. This approach enables the discovery of pesticide combinations that appear together more often than expected by chance, thereby highlighting potential patterns of multi-residue contamination.
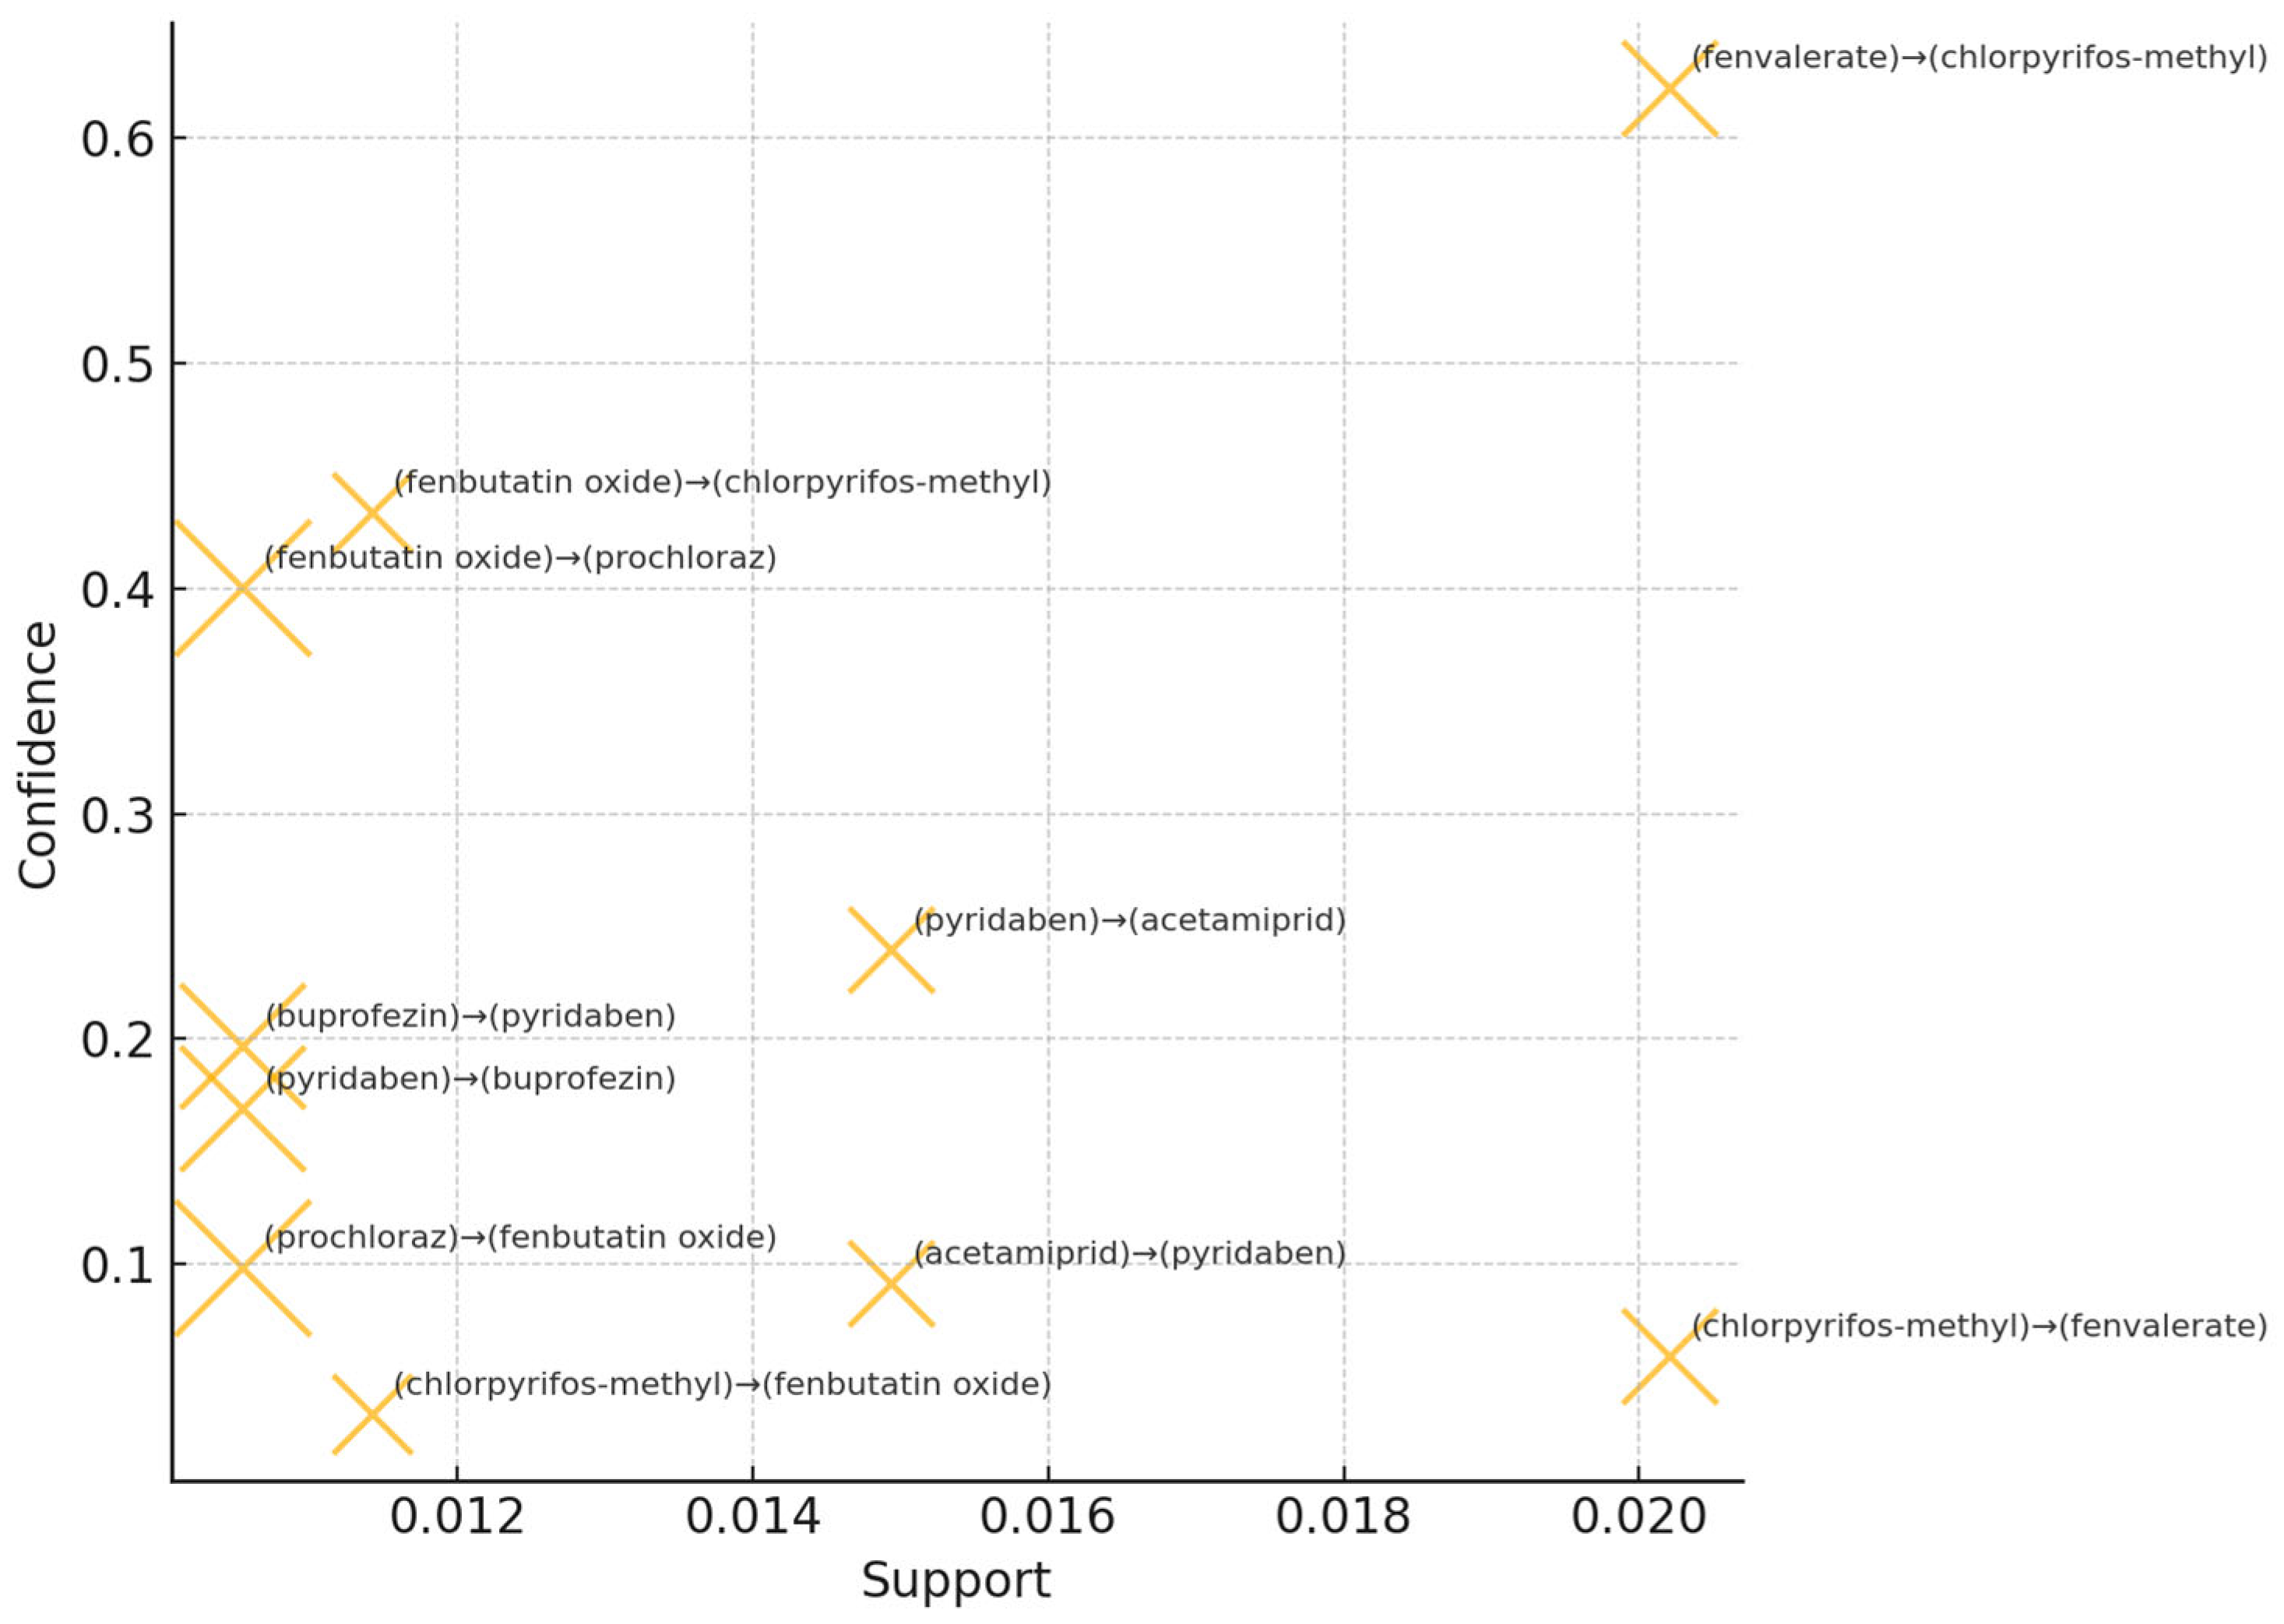
The scatter plot of association rules (
Figure 7) visualizes the top rules according to support and confidence metrics, with lift encoded by marker size. The strongest co-occurrence was observed for the rule (fenvalerate)→(chlorpyrifos-methyl), which displayed the highest confidence (0.62) and support (~0.021), indicating that chlorpyrifos-methyl appeared in over 62% of alerts where fenvalerate was also detected. The large marker size further highlights its high lift (3.17), confirming a substantially increased likelihood of joint occurrence compared to chance.
Another prominent rule was (fenbutatin oxide)→(prochloraz), with a support of ~0.011 and confidence of 0.40, accompanied by the highest lift value among all pairs (3.71), suggesting a strong and non-random co-appearance of these two residues. This was closely followed by the rule (prochloraz)→(fenbutatin oxide), indicating a reciprocal relationship with similarly high lift and confidence, emphasizing the bidirectional predictability between these compounds.
Notably, the buprofezin↔pyridaben pair exhibited moderate support (~0.010) and symmetric bidirectional associations, each with confidence values near 0.20 and lift around 3.18, suggesting frequent co-detection. The association (pyridaben)→(acetamiprid) also emerged as a frequent rule (support = 0.015; confidence = 0.26; lift = 1.82), indicating a relatively high conditional likelihood of acetamiprid detection when pyridaben is present.
The corresponding bar plot of lift values (
Figure 8) reinforces these findings, with the top four rules exhibiting lift values greater than 3, clearly marking them as non-random, high-confidence co-contaminants. The lift values gradually decline below 2 for rules such as (acetamiprid)→(pyridaben) and (pyridaben)→(acetamiprid), suggesting weaker, though still meaningful, associations.
These patterns suggest several recurrent residue pairs that may stem from combined usage patterns in agricultural practices, shared sources of contamination, or formulation co-occurrence.
3.5. Bipartite Network Analysis of Commodity–Pesticide Co-Occurrence
To quantitatively assess co-occurrence patterns between commodities and pesticide residues, a bipartite network was constructed using confirmed RASFF alerts. Nodes represent either commodities or pesticide actives, with weighted edges reflecting the number of alerts in which the respective pair co-occurred [
17]. Community detection was performed using the Louvain algorithm to identify structurally cohesive modules.
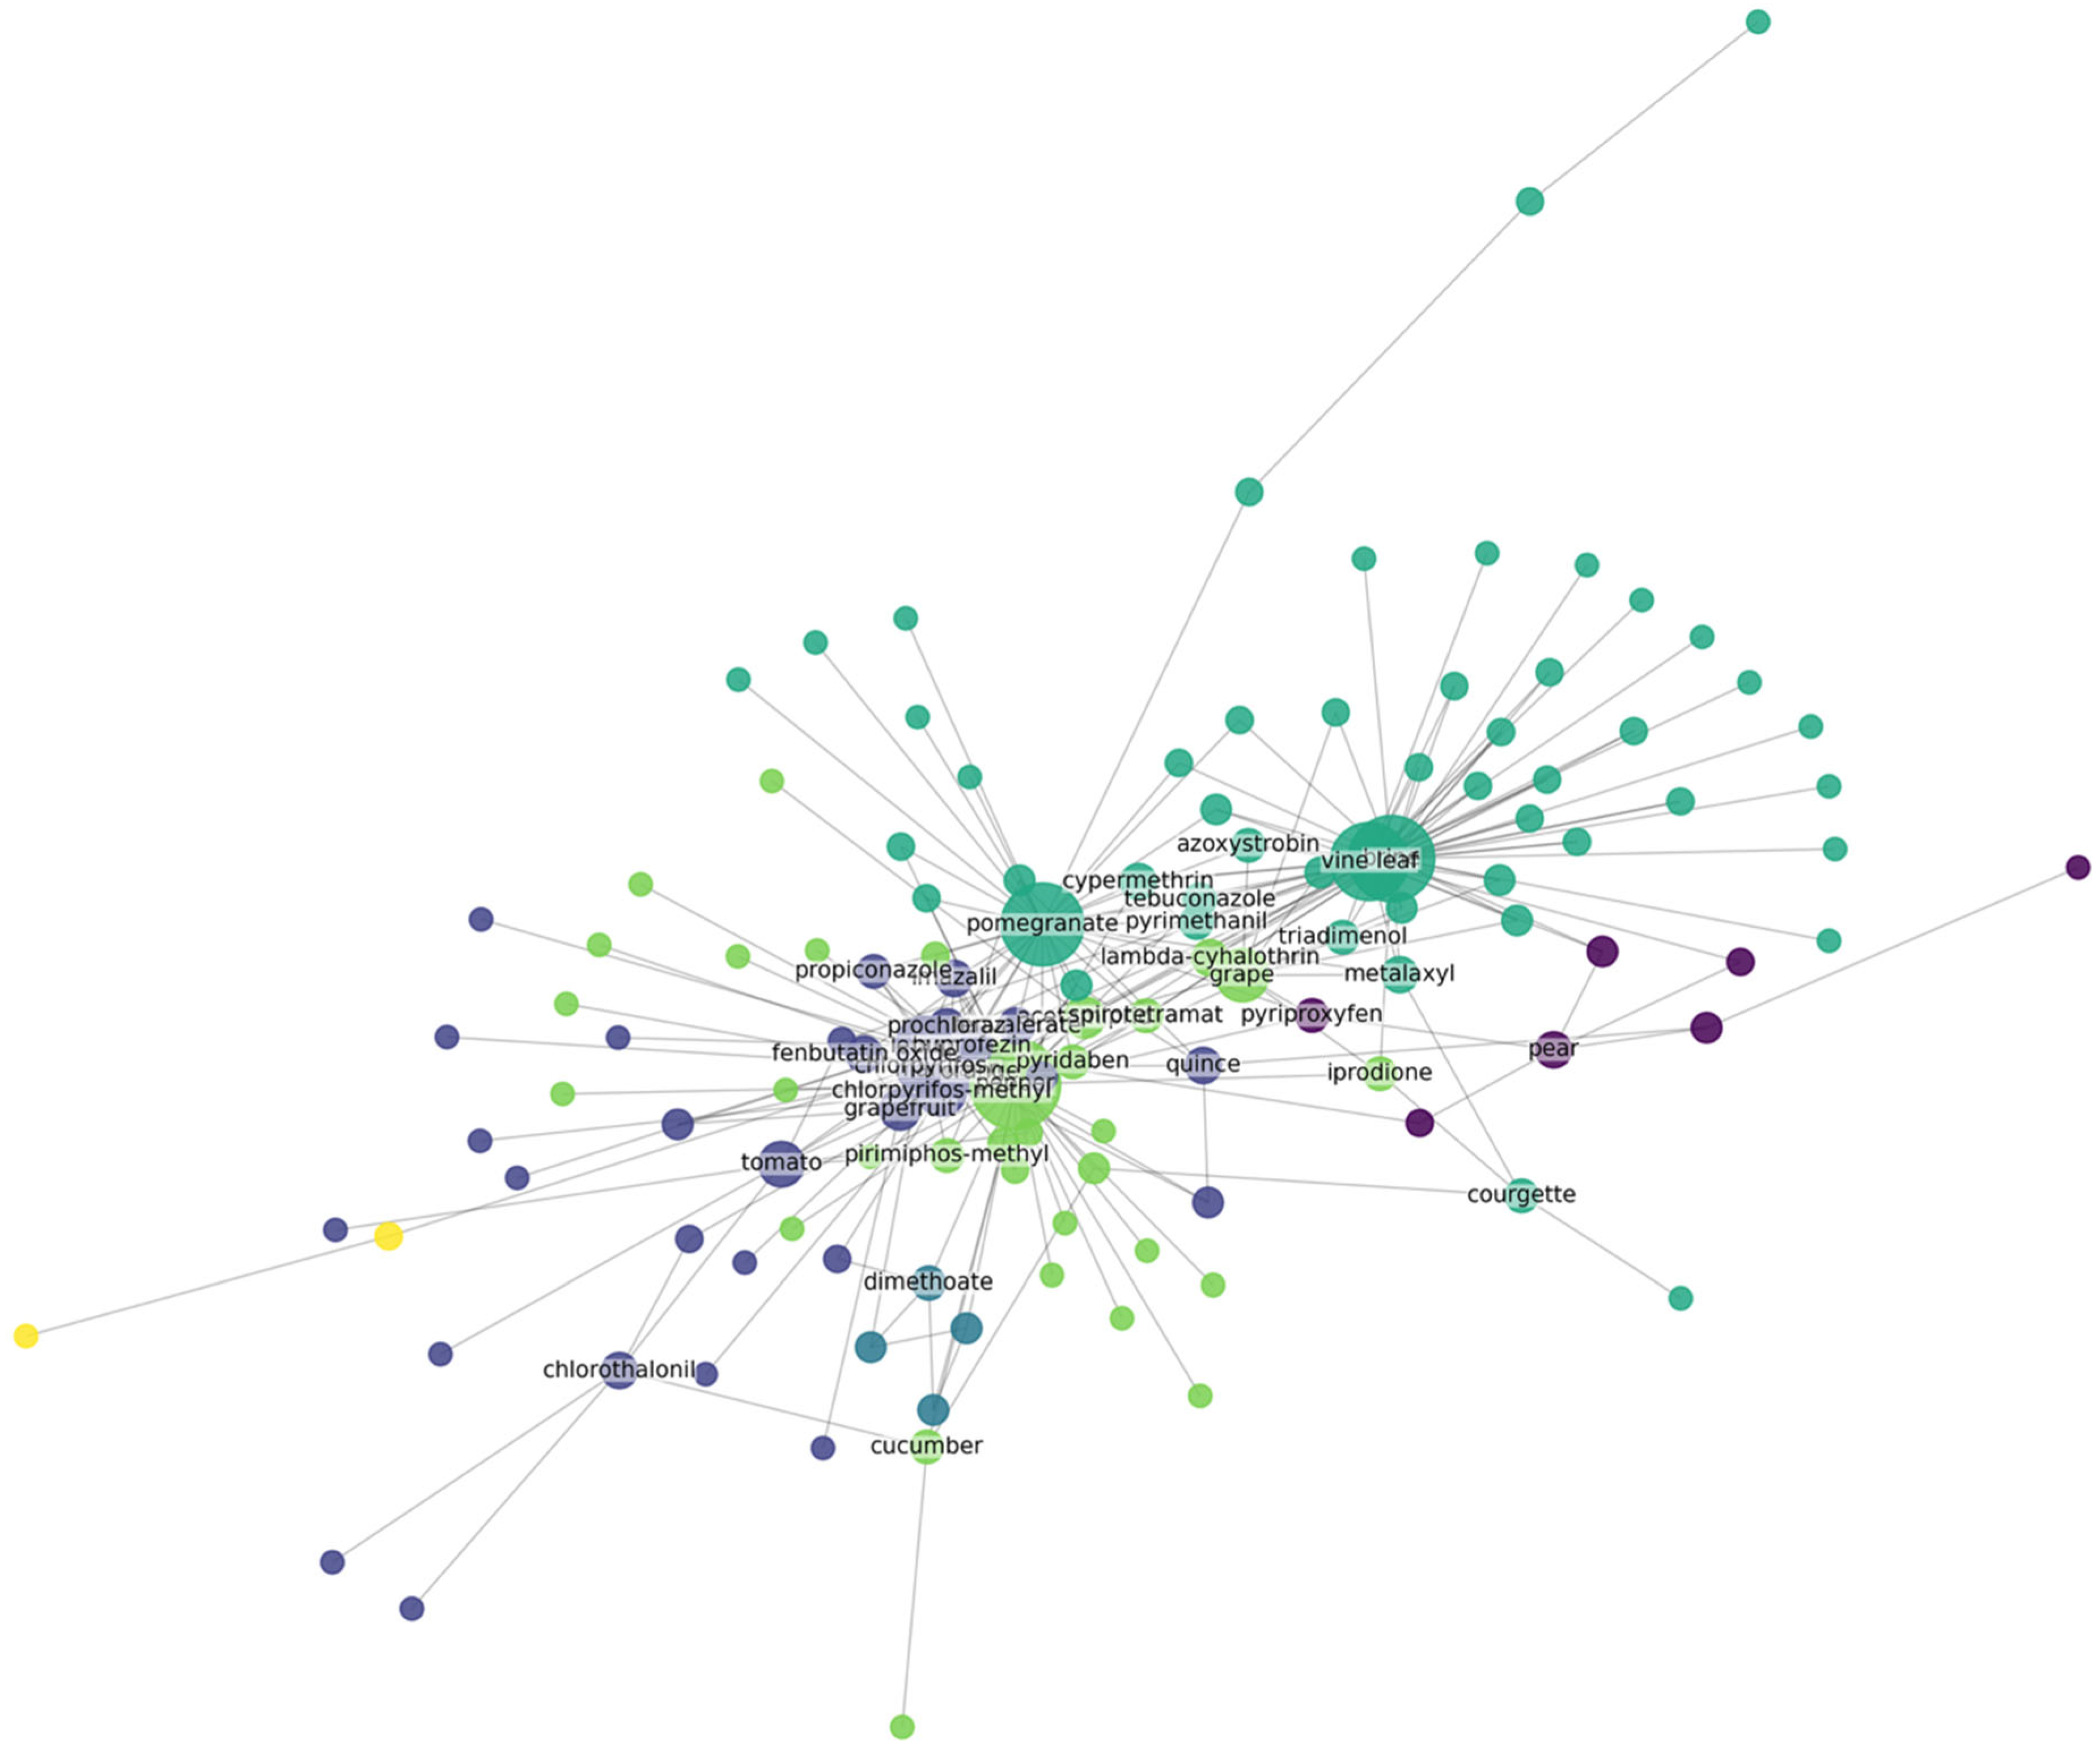
The resulting network (shown in
Figure 9) comprised five non-overlapping communities with a modularity score of 0.41. Three commodities exhibited the highest node degrees: vine leaf (degree = 57), pepper (52), and pomegranate (46). These nodes were centrally positioned within the network. Among pesticide actives, the highest degrees were recorded for chlorpyrifos-methyl (38), prochloraz (35), pyridaben (32), and fenbutatin oxide (30).
Community C1 (turquoise) grouped vine leaf with multiple fungicides (e.g., azoxystrobin, metalaxyl) and insecticides (e.g., lambda-cyhalothrin). Community C2 (light green) clustered pepper, grapefruit, and associated actives including pyridaben, chlorpyrifos-methyl, and formetanate. Community C3 (navy) included grape and cherry, connected to pesticides such as buprofezin and dimethoate. Community C4 (purple) contained courgette and pear, with links to iprodione and fenvalerate. Community C5 (yellow) consisted of a single citrus–chlorantraniliprole pair.
Edge weight analysis showed that the strongest connections involved pepper–pyridaben, pepper–formetanate, and grapefruit–chlorpyrifos-methyl. Low-degree nodes (degree ≤ 3) represented infrequent commodity–pesticide pairs and were excluded from labeling for visual clarity. The results indicate a modular co-occurrence structure driven by high-frequency residue profiles and commodity-specific pesticide distributions.
3.6. Hierarchical Clustering of Commodities Based on Pesticide-Detection Profiles
Hierarchical agglomerative clustering using Ward’s minimum-variance method [
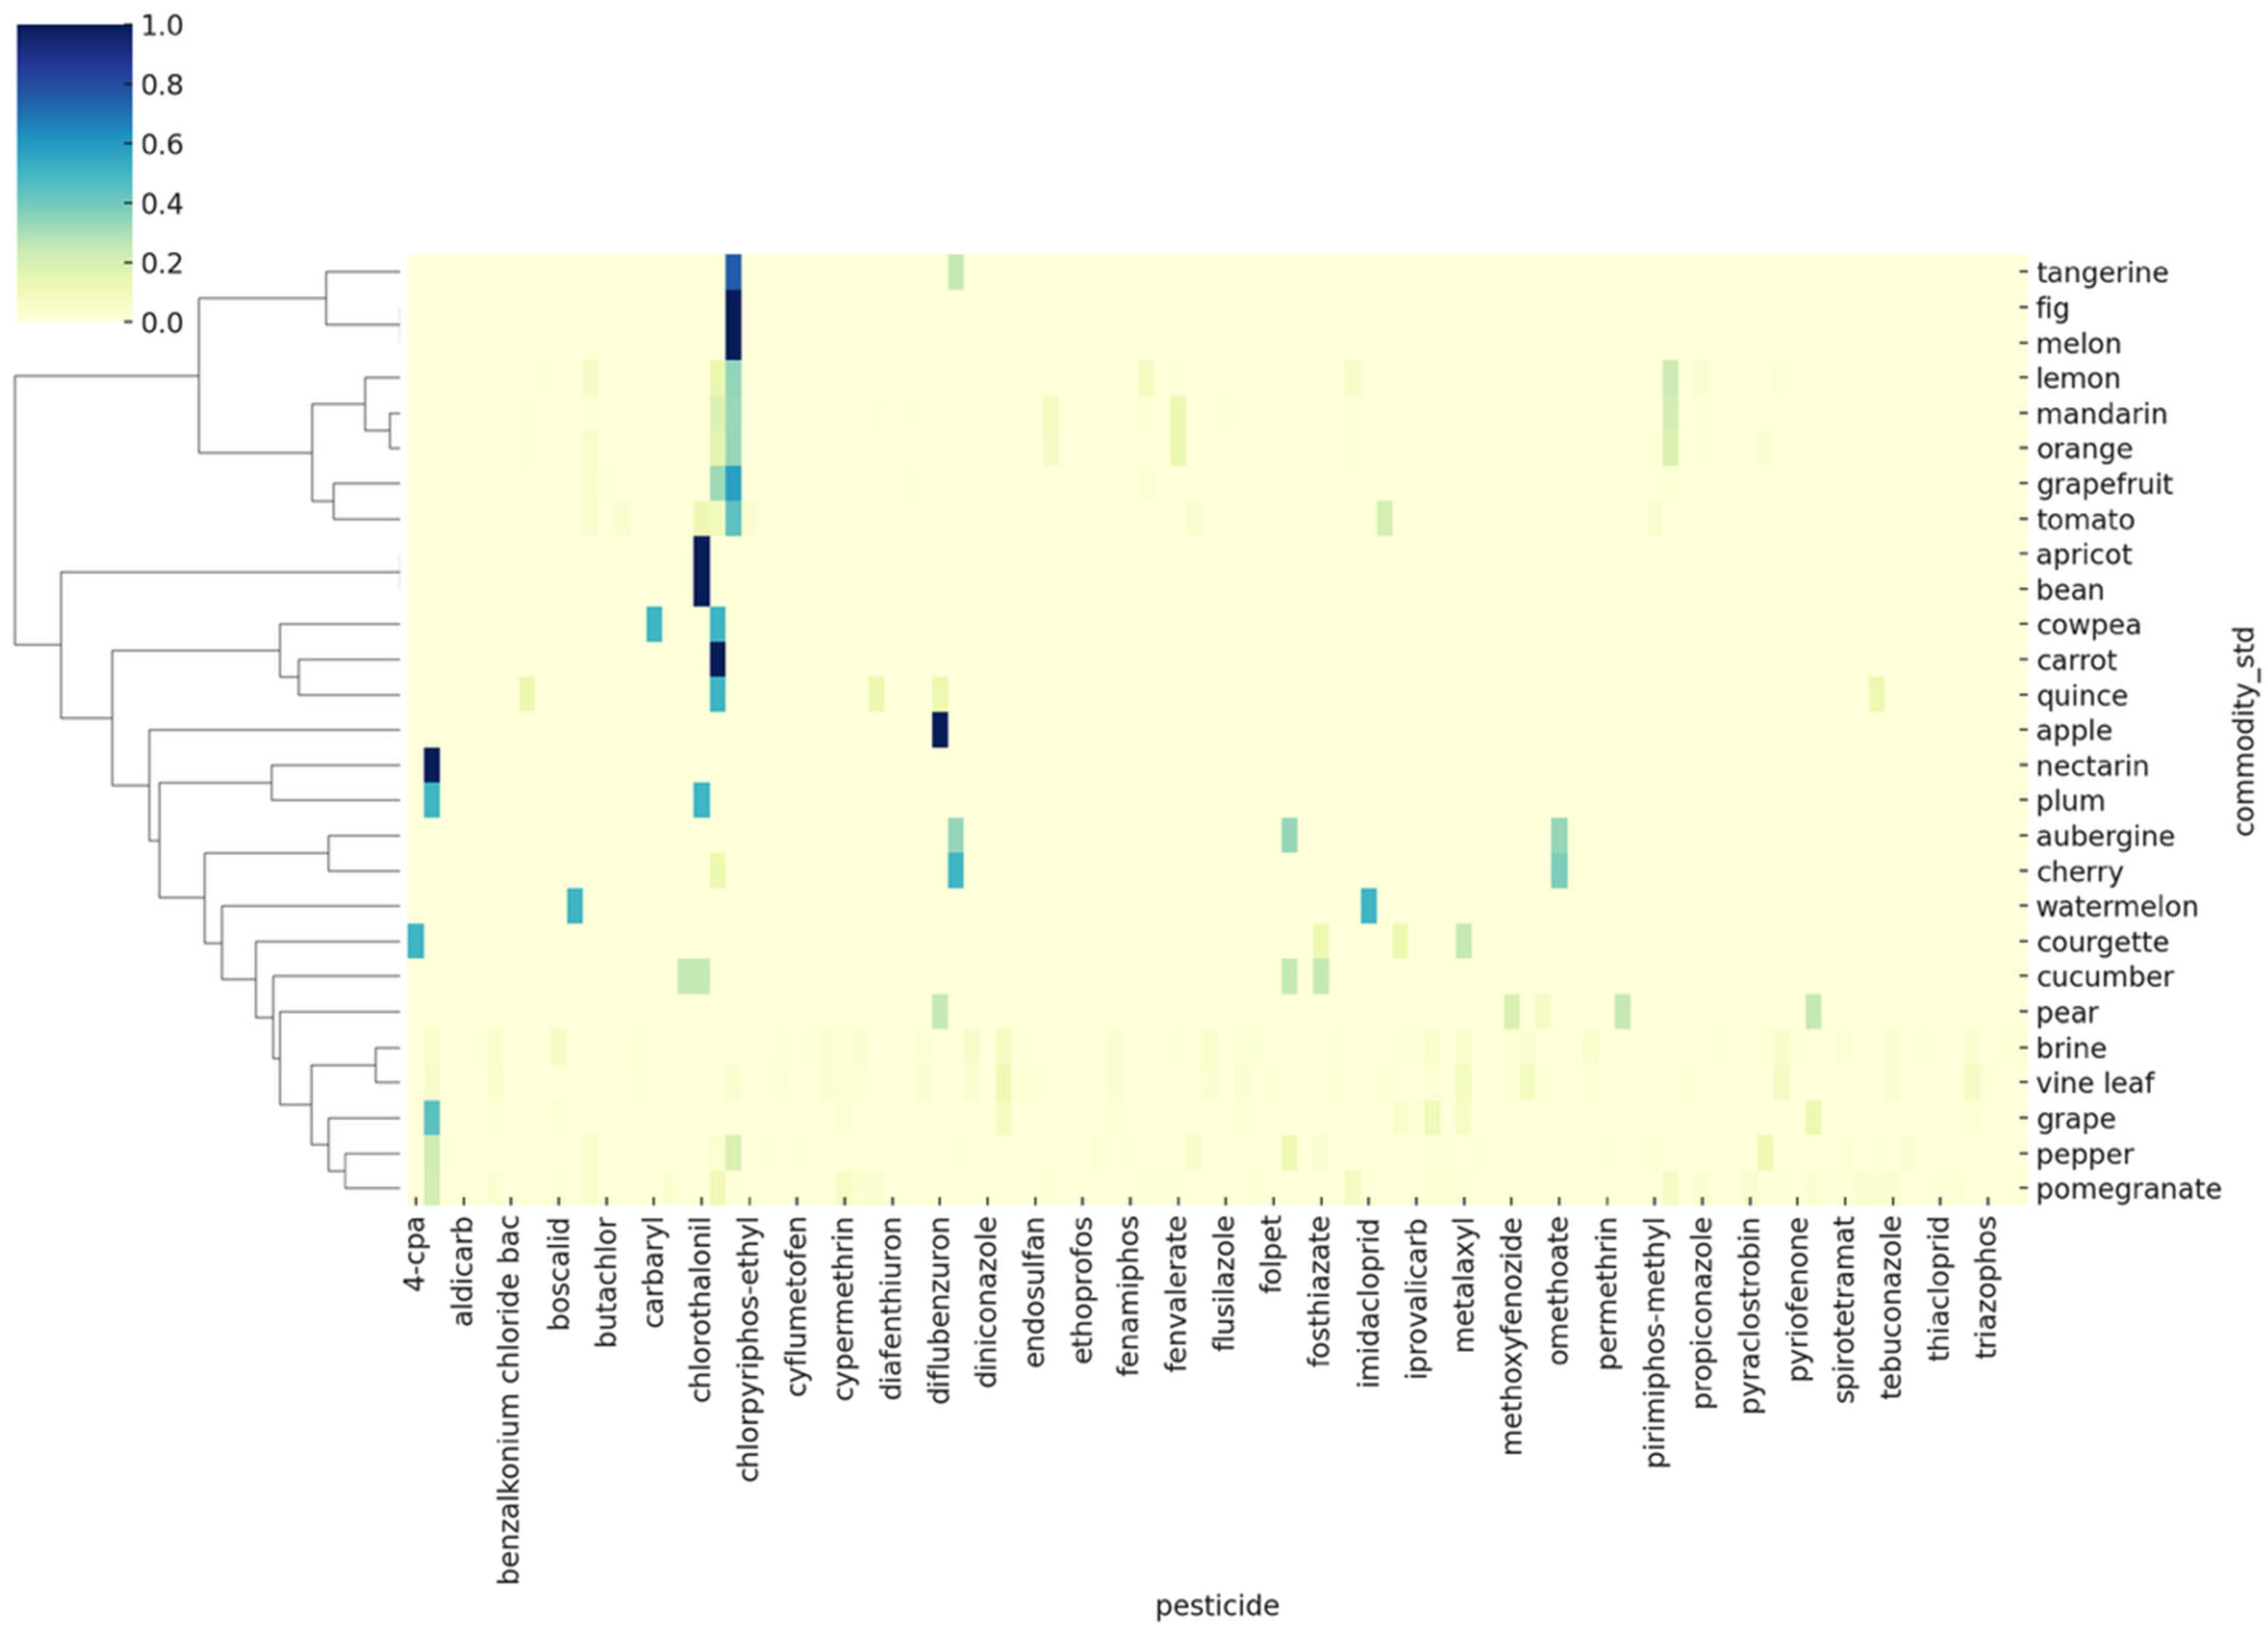
18] was applied to an L1-normalized commodity × pesticide alert-frequency matrix to identify groups of commodities exhibiting similar residue profiles. The resulting dendrogram and heatmap are shown in
Figure 10. Based on a cophenetic distance threshold of 5, five distinct clusters were identified.
Table 1 shows the clusters identified. Cluster 1 comprised vine leaf, brine, and grape. These commodities showed the highest normalized alert frequencies for chlorpyrifos-methyl, fenvalerate, and lambda-cyhalothrin, indicating a relatively broad and high-intensity residue pattern. Cluster 2 included pepper, pomegranate, courgette, and cucumber, characterized by elevated signals for pyridaben, formetanate, and chlorpyrifos-methyl. These residues appeared frequently and consistently across the cluster members.
Cluster 3 grouped citrus commodities, namely grapefruit, orange, lemon, mandarin, and tangerine. This group exhibited predominant detections of prochloraz and chlorpyrifos-methyl, with relatively homogeneous residue profiles within the citrus subset. Cluster 4 included fig, melon, nectarine, plum, cherry, apricot, apple, pear, and quince. These commodities showed lower overall frequencies, with sparse but variable signals, including moderate detections of buprofezin and metalaxyl.
Cluster 5 consisted of aubergine, bean, cowpea, carrot, tomato, and watermelon. This cluster was characterized by uniformly low pesticide detection frequencies, and no single pesticide active showed pronounced dominance. These five clusters collectively delineate distinct commodity groups based on the similarity of their pesticide residue detection patterns, as defined by alert frequencies across the five-year dataset.
3.7. Anomaly Detection in Weekly Pesticide-Class Profiles
Isolation-Forest modeling [
19] was applied to z-score-standardized weekly pesticide-class vectors for each commodity group. This unsupervised technique detects anomalies by recursively partitioning the dataset using random splits and identifying samples that require fewer splits to isolate, thereby assigning higher anomaly scores. Anomaly scores were calculated for every ISO-year/week combination from 2020 to 2025. The top 2% of the score distribution was defined as the anomaly threshold.
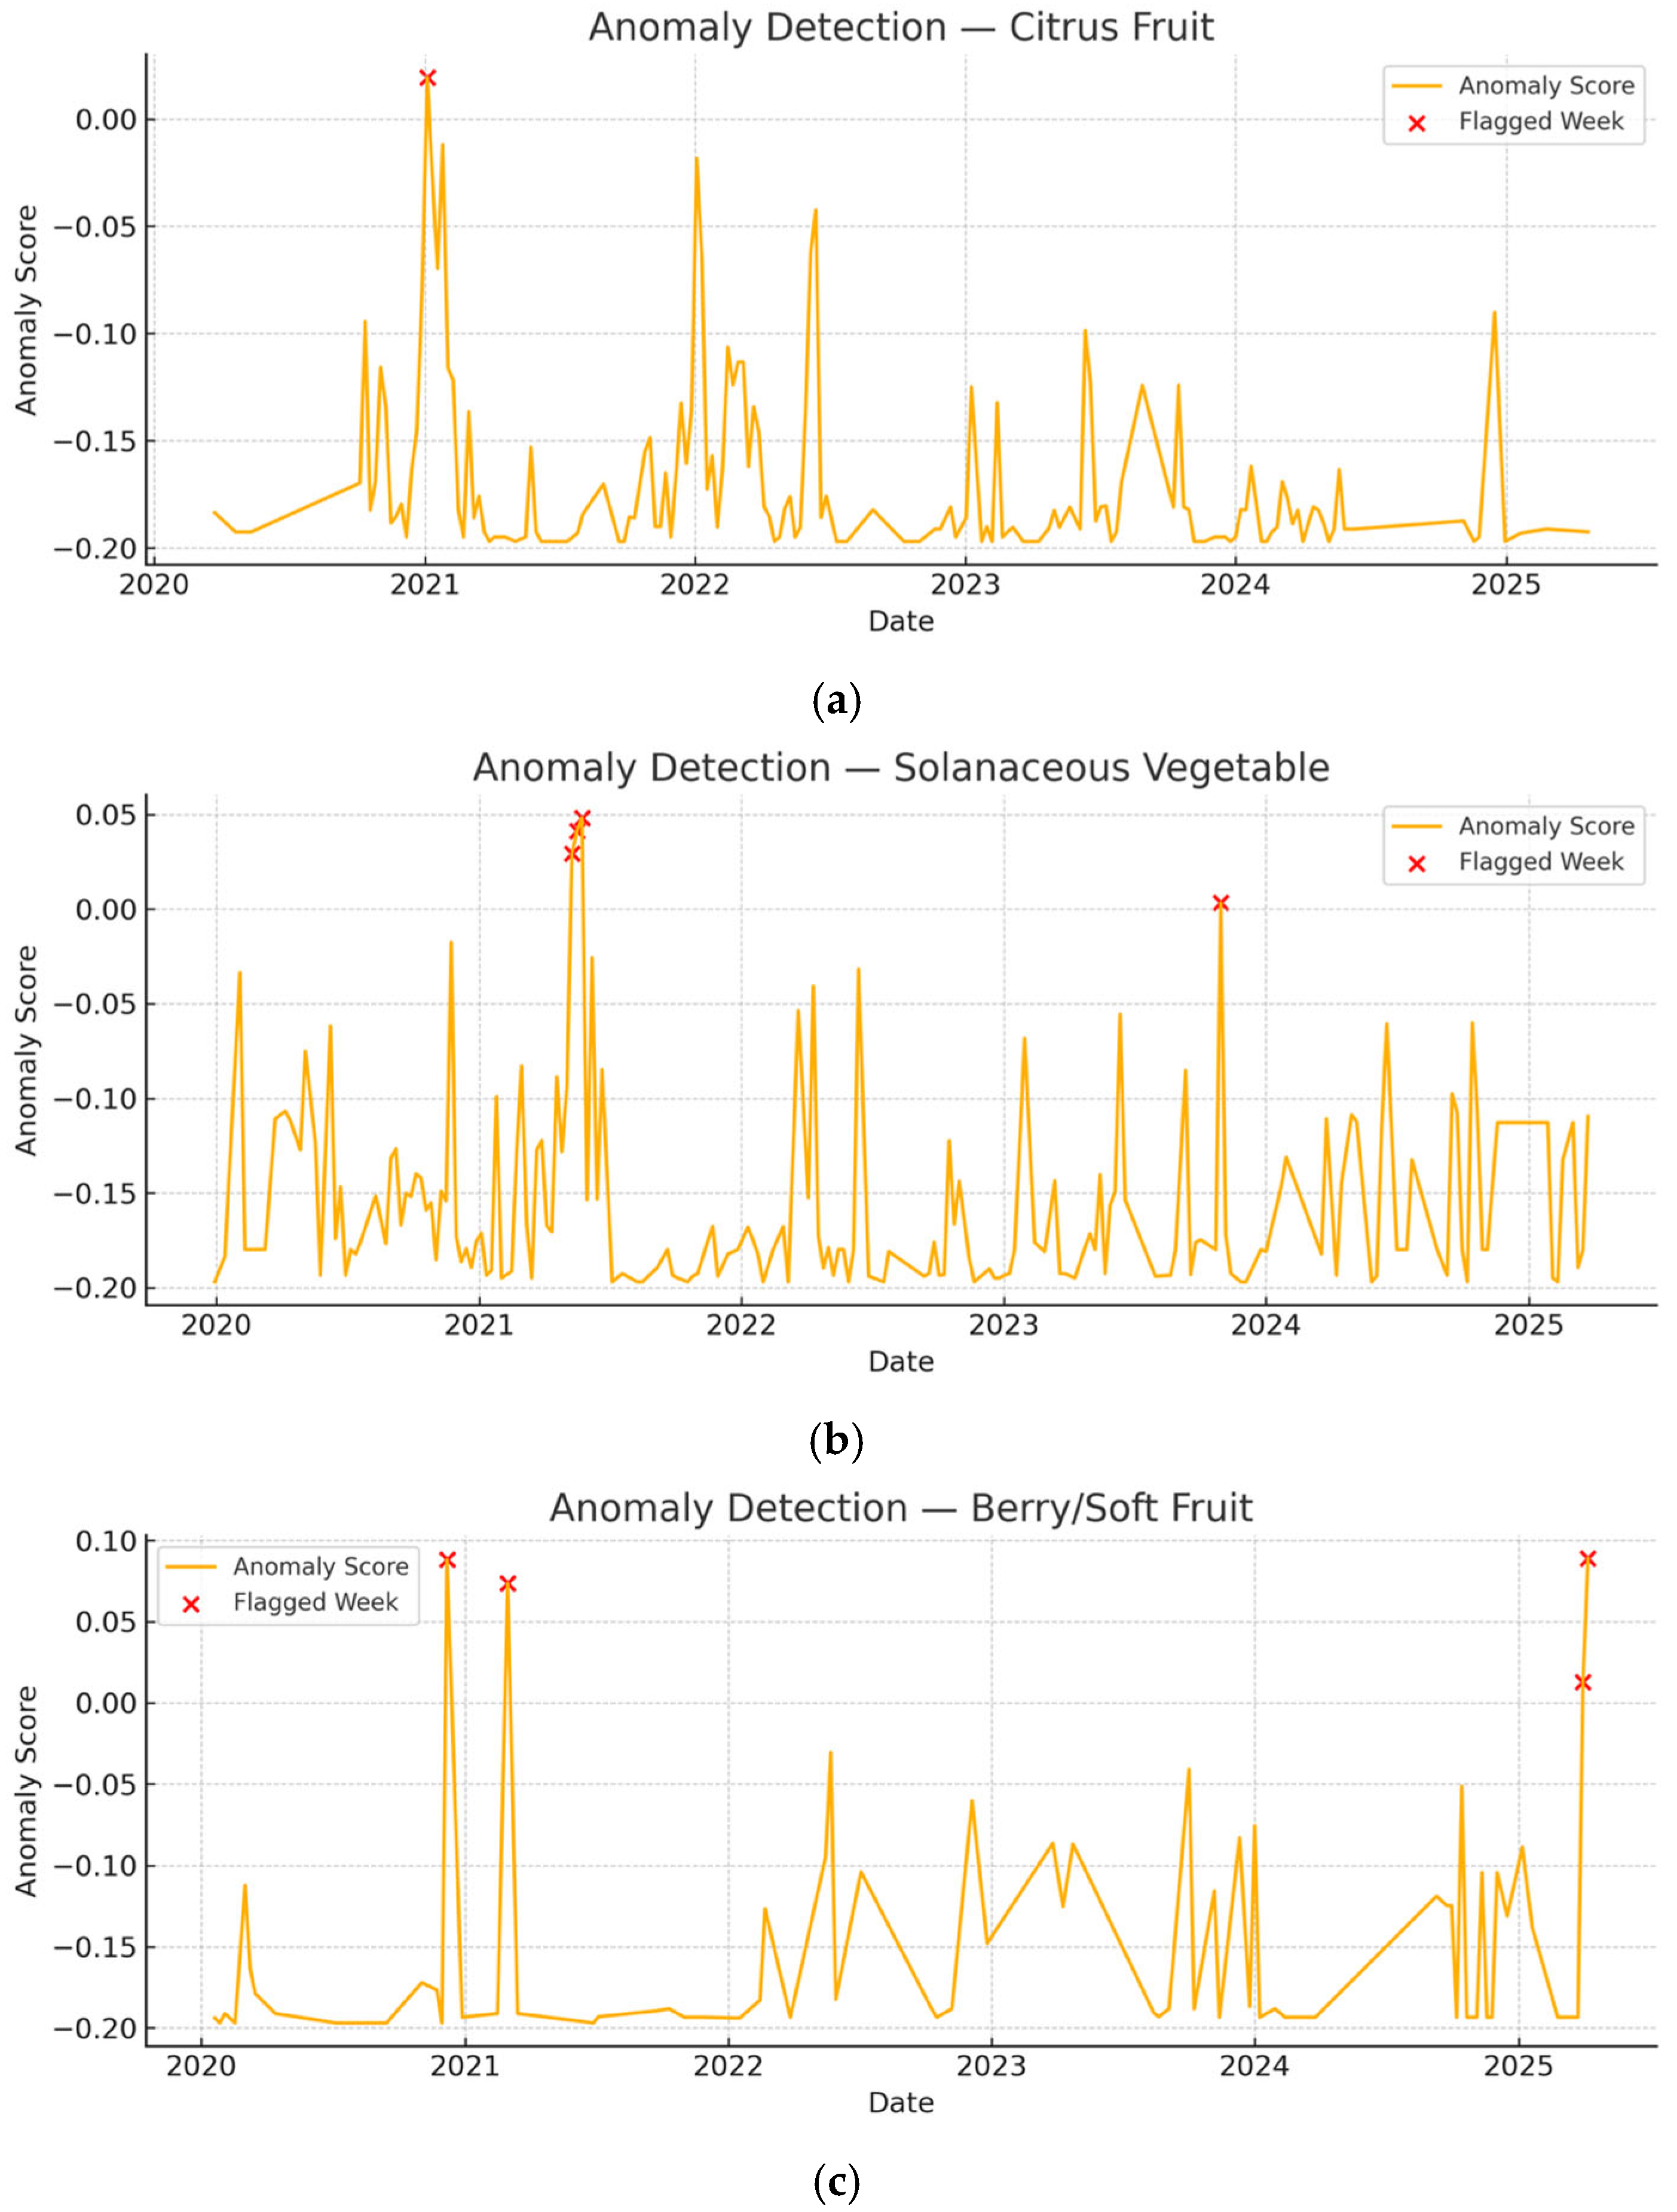
Time-series plots for three most common commodity groups in the dataset are shown in
Figure 11. Each point represents the weekly anomaly score, with higher values indicating greater deviation from typical residue-class patterns.
In citrus fruits, anomaly detection flagged only one week as anomalous in early 2021 (
Figure 11a). The anomaly score for this flagged week marginally exceeded the threshold, presenting a sharp transient peak contrasting with a generally stable profile maintained throughout the rest of the monitoring period, where scores consistently ranged from −0.05 to −0.20. This isolated peak implies a brief, yet significant deviation from typical residue detection patterns.
For solanaceous vegetables, four weeks were flagged as anomalous (
Figure 11b). Three consecutive weeks in mid-2021 displayed elevated anomaly scores near 0.05, suggesting a sustained disruption in typical residue patterns during this period. Additionally, a singular anomaly was flagged in mid-2024 with an anomaly score just above the threshold. Apart from these flagged periods, anomaly scores predominantly varied within a range of −0.05 to −0.15, indicating overall consistency in pesticide residue profiles with only occasional and short-lived deviations.
For berry/soft fruits, distinct anomaly peaks were identified and flagged in the weeks of January 2021, November 2021, February 2025, and May 2025, as shown by red markers in the anomaly detection plot (
Figure 11c). These anomalies presented scores ranging from approximately 0.05 to 0.10, substantially surpassing the surrounding weeks, where scores predominantly fluctuated between −0.10 and −0.20, signifying baseline stability in contamination profiles outside these anomalous episodes.
4. Discussion
The results provide a multidimensional assessment of pesticide residue violations in Turkish fruit and vegetable exports to the EU between 2020 and 2025, revealing critical contamination patterns and offering insight into their agro-environmental and food safety implications.
The markedly high number of alerts for pepper, citrus fruits (notably lemon, mandarin, and grapefruit), and certain solanaceous vegetables suggests a convergence of vulnerability factors inherent to these crops and their production practices. Pepper’s dominance in alert frequency—surpassing 400 incidents—is attributable to its intensive pesticide usage, continuous harvest cycles, and susceptibility to diverse fungal and insect pests [
23]. Its delicate skin and high surface-to-volume ratio promote residue retention, while its long harvesting season demands multiple applications of contact and systemic pesticides [
24]. Monitoring studies show that sweet pepper frequently exceeds maximum residue limits (MRLs), particularly for organophosphates like chlorpyrifos and acephate, with notable long-term carcinogenic and neurotoxic risk implications [
25].
Citrus fruits face distinct challenges. Post-harvest fungicide treatments—especially with imazalil, prochloraz, and chlorothalonil—are commonly used to prevent decay during transport and storage. These fungicides are highly persistent and have been repeatedly detected at levels exceeding MRLs in lemon, grapefruit, and mandarin samples, particularly when originating from regions using pesticide-contaminated irrigation water or poor agricultural practices [
26]. The peel of citrus fruits acts as a reservoir for lipophilic pesticides, increasing the chance of residue detection, even when the edible pulp may have lower concentrations [
27].
The dominant detection of chlorpyrifos, chlorpyrifos-methyl, and acetamiprid reflects entrenched legacy usage and several systemic vulnerabilities in pesticide regulation and application. Although chlorpyrifos has been banned in the European Union, its frequent presence in export commodities points to several likely causes: delayed regulatory implementation in source countries, the persistent use of stockpiled or illicit products, and long environmental and commodity-specific degradation half-lives [
28,
29]. In citrus fruits such as lemon and grapefruit, chlorpyrifos-methyl exhibits prolonged persistence due in part to the protective barrier provided by waxy cuticles, which slows photodegradation and inhibits penetration into inner tissues [
30].
Further, field studies show that microencapsulated formulations of chlorpyrifos can lead to residue levels remaining stable for over 60 days post-application, well beyond standard pre-harvest intervals [
31]. This persistent residue presence, even in compliant supply chains, raises concerns over cumulative dietary exposure, especially in children. Similarly, acetamiprid—a neonicotinoid often used as a chlorpyrifos replacement—has been found in citrus fruits and associated soils weeks after application. It exhibits relatively moderate persistence in fruit tissues (half-life ~8.5 days in oranges) but may still exceed MRLs when used improperly or close to harvest time [
32].
The detection of these compounds in crops like lemon and grapefruit may also stem from inadequate regulatory enforcement, lack of farmer training, or unintended cross-contamination in shared processing and transport systems. In particular, smallholder producers engaged in cross-border trade may lack awareness of stricter EU regulations, inadvertently contributing to non-compliance [
33].
The residue diversity analysis further illuminated two contamination profiles. High entropy and low HHI in brine-cured olives and vine leaves point to diffuse contamination, potentially from widespread environmental exposure, mixed production systems, or the cumulative effects of repeated applications. These crops are often cultivated in fragmented, multi-crop systems, and their semi-processed or leafy nature might facilitate exposure to a broader array of residues. In contrast, low entropy and maximum HHI observed in apple, carrot, and fig suggest strict targeting with single actives, likely due to narrow pest spectra and well-established protection protocols [
34].
Commodity–pesticide enrichment analysis sharpened these insights, showing pepper enriched with formetanate and pyridaben (OR: 71× and 35×). These associations are likely shaped by pepper’s high aphid and mite pressures and the use of specific acaricides and systemic insecticides. For citrus fruits, enrichment of chlorpyrifos-methyl in grapefruit and prochloraz in lemon corresponds with historical pre-harvest and post-harvest treatment patterns, which are sometimes difficult to phase out due to cost and efficacy concerns [
35,
36].
Seasonal patterns were striking. Rejections peaked in January–March and again in June. Winter’s elevation may be explained by the export concentration of citrus fruits, which are harvested during late autumn and winter. Their vulnerability to fungal spoilage encourages intense fungicide use, explaining prochloraz and imazalil alerts. Additionally, colder months slow metabolic degradation of residues, potentially elevating detectable levels at EU borders [
37]. Spring and early summer peaks, especially in June, align with pepper and other solanaceous vegetable exports. The timing reflects both climatic favorability for pests and production cycles demanding higher pesticide input [
34].
The observed decline in pepper–pyridaben detections post-2021 likely reflects changes in producer behavior following regulatory rejections. Evidence supports that pyridaben residues in peppers are influenced by repeated applications and are often difficult to remove through conventional washing alone [
38,
39]. The drop may signal increased adoption of IPM practices, which are known to reduce pesticide load while maintaining pest control [
40,
41]. In the food science context, this responsiveness helps improve residue compliance and reduce dietary exposure risk.
The strong co-occurrence of fenvalerate → chlorpyrifos-methyl and fenbutatin oxide↔prochloraz suggests deliberate tank-mixing or formulation bundling. These mixtures are common in pest management to address mixed insect-fungal threats and reduce labor costs [
42]. In a food safety lens, such combinations complicate residue monitoring, as interactions may prolong degradation or increase systemic absorption. The moderate links involving acetamiprid and pyridaben could also arise from supplier-driven bundling or low-cost generic availability, patterns often seen in smallholder markets [
43].
Network clustering revealed crops like pepper, pomegranate, and vine leaf as highly connected nodes, co-occurring with a diversity of residues. These commodities are typically cultivated under variable agronomic practices and are susceptible to a broad pest spectrum. The pepper–grapefruit cluster (C2) with actives like chlorpyrifos-methyl and pyridaben likely reflects intensive treatment regimens aimed at meeting esthetic export standards, consistent with findings in residue-heavy exports from Turkey and Korea [
43,
44]. Such network-based analyses can inform targeted residue surveillance for commodities with diverse chemical fingerprints.
The clustering patterns reflect underlying agronomic practices, pest pressures, and post-harvest treatment strategies that shape commodity-specific residue profiles. Cluster 1, which includes vine leaf and grape, shows a residue signature dominated by multiple high-toxicity insecticides (e.g., chlorpyrifos-methyl, lambda-cyhalothrin), consistent with these crops’ high surface-area-to-mass ratios and susceptibility to foliar pests and fungal spoilage during open-field growth and fermentation processes [
45]. Cluster 2, featuring pepper and cucurbits, aligns with profiles typical of high-input vegetable systems, where repeated applications of miticides and insecticides like pyridaben and formetanate address a wide pest spectrum under warm conditions [
39]. The homogeneity in Cluster 3’s citrus group, dominated by fungicides like prochloraz, echoes the post-harvest treatment norms of citrus export chains, where decay control during cold storage takes priority over insect control [
46]. The more diffuse and sparse profiles in Cluster 4 suggest moderate-input fruit systems or tighter regulatory control in temperate fruit supply chains, possibly reflecting seasonal pest cycles and reduced pesticide persistence. Finally, Cluster 5’s low-residue crops, including aubergine and legumes, may result from shorter pre-harvest intervals, systemic IPM adoption, or lower chemical dependency in their cultivation [
41].
The anomaly detection findings reflect critical deviations from expected pesticide residue profiles, which can signal underlying failures in agricultural or post-harvest practices. The single anomaly in citrus fruits in early 2021 may reflect a transient but significant breach in pesticide control, possibly linked to improper post-harvest treatments or non-compliance by specific exporters. Studies have shown that citrus fruits often carry persistent fungicides such as imazalil and prochloraz, especially during colder months when spoilage risk increases and degradation is slower [
29,
47]. Notably, imazalil and thiabendazole residues frequently exceed MRLs in citrus during peak export seasons, underlining their role in sudden detection spikes [
46].
In contrast, the multi-week anomaly detected in solanaceous vegetables in mid-2021 suggests a broader disruption—likely due to intense pesticide use during periods of high pest pressure or inadequate withdrawal intervals. Consistent with this, studies report elevated detection frequencies in peppers for insecticides like chlorpyrifos and pyridaben, especially in export batches from regions with limited regulatory oversight [
48]. The 2024 anomaly may reflect renewed pressure from emerging pests or intensified monitoring following EU import alerts. These findings are consistent with a study showing that chlorothalonil and daminozide residues in vegetables like eggplant and tomato frequently exceed MRLs in regions lacking consistent regulation and education on proper pesticide use [
26].
The repeated anomalies in berry/soft fruits across 2021 and 2025 likely reflect this group’s biological sensitivity and vulnerability to contamination. Due to their delicate skins and perishability, berries are often subjected to intensive fungicidal regimes, which can lead to residue variability and occasional spikes. The literature confirms that even under standard applications, pesticide residues in berries tend to be inconsistent and frequently above safe thresholds [
49,
50]. The clustering of these anomalies outside peak export seasons could reflect poor post-harvest handling or outdated stock applications.
5. Conclusions
This study delivers the first comprehensive, multi-method analysis of pesticide residue violations in Turkish fruit and vegetable exports to the EU, revealing a series of persistent, structurally embedded contamination patterns with significant implications for food safety governance and trade integrity. Among all commodities, solanaceous vegetables—particularly pepper—emerged as the most frequently rejected group, with highly enriched pairings involving formetanate, pyridaben, and acetamiprid. These associations point to recurrent, commodity-specific pesticide application practices that systematically exceed EU regulatory thresholds.
The temporal dimension further underscored the problem’s predictability: rejection alerts peaked consistently in winter and early spring, particularly in citrus and greenhouse-grown produce, reflecting the seasonal alignment of pesticide residues with post-harvest treatments and intensive cultivation cycles. Notably, the presence of phased-out or restricted substances like chlorpyrifos-methyl in recent alerts highlights lingering gaps in enforcement or post-ban residue persistence.
By integrating enrichment analysis, trend detection, and unsupervised machine learning, the study uncovered modular contamination structures and temporally localized anomalies. These findings suggest that violations are not stochastic but instead reflect systemic agrochemical dependencies and production rhythms. The ability to predict seasonal risk windows and detect co-occurrence rules for pesticide combinations presents an opportunity to shift from broad-spectrum surveillance to targeted, crop- and calendar-specific interventions.
On a broader scale, these results reinforce the need to operationalize food safety data platforms like RASFF not merely as reporting systems, but as predictive tools for regulatory action. For Turkey, this means coupling export-oriented residue control programs with data-informed priority settings—focusing monitoring efforts on high-risk crop–pesticide combinations during critical time windows. Moreover, upstream interventions such as farmer education, pre-harvest residue testing, and phaseout verification for legacy pesticides could drastically reduce the burden of rejections.
It is important to note that the study had some limitations. The analysis relied exclusively on RASFF alerts, which, while robust for border-level monitoring, do not provide production-region details, farm-level practices, or quantitative residue concentrations. As a result, the findings cannot be spatially resolved or translated into dose–response risk estimates. Moreover, violations that occur but are not captured by RASFF remain outside the scope of this dataset. Future research could integrate national monitoring results and residue quantification to address these gaps and provide a more comprehensive risk assessment. However, ultimately, the study’s analytical framework—relying on reproducible, interpretable methods—offers a scalable model for other exporting nations facing similar regulatory pressures. Embedding this intelligence into the design of national residue surveillance policies would not only improve compliance but also enhance consumer protection and trade resilience in an increasingly stringent global food system.
