Article

Detection of Gene Doping Using Dried Blood Spots from a Mouse Model with rAAV9 Vector-Mediated Human Erythropoietin Expression as a Pilot Study

1
College of Medicine, School of Medicine and Health Sciences, University of Tsukuba, 1-1-1 Tennodai, Tsukuba 305-8577, Japan
2
Laboratory of Clinical Examination and Sports Medicine, Department of Clinical Medicine, Institute of Medicine, University of Tsukuba, 1-1-1 Tennodai, Tsukuba 305-8577, Japan
3
Human Biology Program, University of Tsukuba, 1-1-1 Tennodai, Tsukuba 305-8577, Japan
4
Department of Sports Medicine Analysis, Open Facility Network Office, Organization for Open Facility Initiatives, University of Tsukuba, 1-1-1 Tennodai, Tsukuba 305-8577, Japan
*
Author to whom correspondence should be addressed.
Analytica 2024, 5(2), 263-272; https://doi.org/10.3390/analytica5020017
Submission received: 24 April 2024 / Revised: 24 May 2024 / Accepted: 31 May 2024 / Published: 4 June 2024

Abstract

:
Rapid advancements in gene technology have raised concerns regarding the potential abuse of techniques, such as gene doping, for enhancing athletic performance. To identify this possibility, a reliable procedure for detecting doping genes is required. Although detection methods for doping genes have been created, there are still areas for further improvement. One significant challenge is the high storage and transport costs of the test samples. For this issue, the dried blood spot (DBS) method can be a cost-effective solution. This study aimed to assess the practicality of incorporating DBSs into the gene doping detection process as a pilot study. Whole-blood samples were initially collected from mice engineered to express human erythropoietin from the rAAV vector. Then, the blood was placed in filter papers and left to dry at room temperature for five hours to form DBSs. These DBSs were subsequently preserved in sealed plastic bags at room temperature. After the extraction of DNA, DBSs were formed, and TaqMan-qPCR was utilized to detect the presence of rAAV vector-derived DNA. The finding confirmed that doping gene-specific fragments were successfully detected in DBSs. This outcome suggests that the DBS method is an effective approach to be considered when developing a comprehensive protocol for gene doping detection.

Graphical Abstract

1. Introduction

Rapid advancements in gene technologies have enabled various genetic diseases to be treated. A notable example is spinal muscular atrophy, a condition that affects children and was incurable for many years. The disease can now be treated by Zolgensma, a gene therapy developed by Novartis Pharma, Basel, Switzerland, and approved by the U.S. Food and Drug Administration FDA in 2019 [1]. This gene therapy is based on a recombinant adeno-associated viral (rAAV) vector and is a revolutionary next-generation gene therapy that can be effective through a single intravenous shot [2]. In addition, various gene therapies using the same viral vector have been approved and are commercially available for many diseases, including Hemophilia B (Beqvez; Pfizer, New York, NY, USA), Hemophilia A (Roctavian; BioMarin, Shinjuku, Tokyo, Japan), Duchenne muscular dystrophy (Elevidys; Sarepta Therapeutics, Cambridge, MA, USA), and lipoprotein lipase deficiency (Glybera; UniQure, Amsterdam, NH, The Netherlands). Thus, it can be said that gene technology is currently widely accepted in society. This has resulted in several concerns regarding the misuse of gene technology, such as gene doping.
Gene doping refers to an unauthorized approach by which athletes enhance their performance by employing gene therapy techniques, which is not permitted in competitive sports. Although there have been no gene doping cases detected around the world, establishing robust testing protocols is critical for identifying gene doping to safeguard the integrity and fairness of athletic competitions and the well-being of athletes. The World Anti-Doping Agency (WADA) has explicitly banned gene doping within its “Prohibited List” [3], a document subject to annual revisions, and it is actively engaged in research to devise effective testing methodologies. We concur with this policy and are dedicated to the advancement of testing procedures for gene doping [4,5,6,7]. On the other hand, developing a reasonable method for storing specimens, rather than focusing only on the development of testing methods, is desirable.
In common practice, samples from athletes, such as urine or blood, are collected post-competition or unexpectedly. The samples are deep-frozen for extended periods during shipping to the testing facility. This type of sample storage and transport is an inefficient method for long-term preservation due to financial burdens. Thus, the development of cost-effective alternatives is essential. One promising method is using dried blood spots (DBSs) on filter paper to absorb and preserve blood on paper for doping tests. Compared to cryopreservation, this method does not require expensive storage equipment, space, and high transportation costs. Moreover, this approach not only promises considerable cost reductions but also the possibility for long-term sample preservation. As an example, experimental results have been reported for detecting steroids or genetic polymorphism using DBSs, and it has been shown that DBSs look promising for the future [8,9].
On the other hand, there are many practical examples of DBSs in medical testing other than doping testing. DBS technology has been successfully implemented in various medical tests, such as DNA analyses in prenatal diagnostics, and the detection of infections such as hepatitis C virus, HIV-1, and rabies virus, as evidenced by several references [10,11,12]. However, there are still no examples of its application to actual genetic doping testing. Taken together, the DBS method may be applicable for gene doping tests. Therefore, this study aimed to investigate whether DBSs can used for gene doping tests using a mouse model as a pilot study. Our results demonstrate that DBSs can be used to accurately detect direct evidence of gene doping. These findings are expected to contribute significantly to ongoing research and development on the test method.

2. Materials and Methods

2.1. Graphical Presentation of Experimental Methods

The scheme of the experimental procedures used in this study is presented in Figure 1. The experimental methods described below are similar in some respects to our previous study [4], in which case the reference numbers are assigned.

2.2. Creation of the rAAV9-hEPO Vector

To develop a model of gene doping in mice, we constructed a viral vector in collaboration with VectorBuilder Inc. (Science City, Guangzhou, China). The pAAV expression vector, equipped with 5′ and 3′ inverted terminal repeats (ITRs), was designed using the VectorBuilder online platform. This vector was also designed to include CMVp (human cytomegalovirus immediate early enhancer/promoter), the hEPO gene, and WPRE (woodchuck hepatitis virus post-transcriptional regulatory element). Subsequently, the constructed plasmid was provided to VectorBuilder for the synthesis of rAAV9. The resulting viral particles were then concentrated and purified using ultracentrifugation. The final viral preparations were quantified, revealing titers of 2.76 × 10¹³ genome copies/mL.

2.3. Generation of the Gene Doping Mouse Model

The animal experiments in this study were conducted with authorization from the Animal Care Committee at the University of Tsukuba, as documented via approval number: 22-125. Six-week-old male ICR mice were purchased from CREA Japan (Meguro, Tokyo, Japan) and then allowed to acclimatize to the new environment for a period of seven days. The mice were bred and maintained in a housing that is climate-controlled and pathogen-free, and a photoperiod of 12 h of light followed by 12 h of darkness took place. The mice were fed with a standard diet and ad libitum water. After 1 week of acclimatization, mice were randomly assigned to the control or rAAV9-hEPO-injection groups. The mice in the rAAV9-hEPO-injection group (n = 4; named AAV-hEPO) received injections of the rAAV9-hEPO vector (1011 GC/100 µL/mouse) into the orbital sinus under systemic isoflurane inhalation anesthesia. The mice of the control group (n = 4; named Con.) received injections of the 10% glycerol/PBS (100 µL/mouse) buffer. Ten days after the injection, whole blood was obtained with EDTA-2Na as an anticoagulant from the inferior vena cava under systemic isoflurane inhalation anesthesia, after which the mice were euthanized. The collected whole blood was subjected to pre-processing for further analysis [4].

2.4. Assessment of General Hematopoietic Parameters

To verify the successful establishment of the gene doping model, we evaluated red blood cell (RBC) parameters, including RBC count, hemoglobin (HGB) concentration, and hematocrit (HCT) percentage. For this purpose, a whole-blood volume of 50 µL collected from Con. and AAV-hEPO mice were subjected to an automated blood analyzer (Celltac α MEK6458; NIHON KODEN, Shinjuku, Tokyo, Japan) to measure these parameters.

2.5. Creation of DBSs

To prepare dried blood spots (DBSs), 50 µL of whole blood collected from the doping mice and the control group was applied onto NucleoCard filter paper (Takara Bio, Kusatsu, Shiga, Japan). The samples were air-dried at room temperature for five hours to obtain DBS samples. These DBSs were then sealed in a plastic bag and stored at room temperature for 24 h. Following storage, DBSs were excised into pieces using a 6 mm diameter biopsy punch (Figure 1) to prepare for DNA extraction from these DBS fragments.

2.6. DNA Isolation from the DBSs

The whole-blood cells from DBS fragments underwent cell lysis in 500 µL of the SNET Lysis buffer, which is composed of 20 mmol/L Tris-Cl (pH 8.0), 5 mmol/L EDTA (pH 8.0), 400 mmol/L NaCl, and 1% SDS, and it includes Proteinase K at a final concentration of 100 µg/mL. The lysis process comprised incubation at 56 °C for one hour. Following lysis, 500 µL of a Phenol Chloroform Isoamyl Alcohol solution (Cat# 25970-56; Nacalai Tesque, Nakagyo, Kyoto, Japan) was added into the lysate and thoroughly mixed via vortexing. The mixture was then centrifuged at a speed of 12,000× g at room temperature for 15 min, and then 300 µL of the supernatant was collected. Ribonuclease A was added to this supernatant to achieve a final concentration of 10 µg/mL, and the mixture was incubated at room temperature for 15 min to degrade any residual RNA. The DNA was purified from the mixture using the NucleoSpin Gel and PCR Clean-up kit (Cat#U0609B; Takara Bio) in accordance with the manufacturer’s manual. The DNA was finally eluted in 30 µL of Tris-HCl buffer (5 mM Tris, pH 8.5).

2.7. Analysis of DNA Integrity

The concentration of the purified DNA was determined using the NanoDrop Lite spectrophotometer (Thermo Fisher Scientific, Waltham, MA, USA). Furthermore, to assess the integrity of the DNA, especially to examine any degradation or fragmentation, the purified DNA was analyzed using an Agilent 2100 Bioanalyzer system (Agilent Technologies, Santa Clara, CA, USA) in conjunction with the Agilent DNA 12,000 Kit (Cat#5067-1508; Agilent Technologies). Moreover, intact mouse liver DNA was used as a positive control during this analysis.

2.8. Taqman Quantitative PCR Assay

To detect the fragments of doping genes, we employed the Taqman quantitative PCR assay. The design of the primers and probes targeted regions spanning exon–exon junctions (exon 2–3 and 3–4 of the hEPO gene) that are not represented in human genome DNA. The selection was based on our preceding research efforts [4]. To ensure specificity, we subjected the primers and probes to in silico verification using Primer-BLAST [13], which substantiated that these sequences did not facilitate amplification within the human or murine genomes. The primer and TaqMan probe sequences are presented in Table 1. The oligonucleotides, featuring a double quencher system, were synthesized by Integrated DNA Technologies (Coralville, IA, USA). Subsequently, to detect the direct evidence of gene doping within the DNA samples, the TaqMan qPCR assay was conducted in duplicate for absolute quantification. We employed the PrimeTime Gene Expression Master Mix (Cat# 1055771; Integrated DNA Technologies) with the specified primers and TaqMan probes on QuantStudio 5 Real-Time PCR Systems (Thermo Fisher Scientific, Waltham, MA, USA). Each reaction, with a total volume of 10 µL, comprised 2 µL of template DNA, 200 nM of each primer, and 100 nM of the probe. To control for contamination, wells containing pure water instead of template DNA were included as negative controls. For standard curve generation, pAAV-hEPO (plasmid vector; 4 pg/µL) was used, with a quantifiable range of 7.5 × 10⁵ to 1.9 copies/µL. The thermal cycling conditions consisted of initial denaturation at 95 °C for 5 min, followed by 40 cycles of denaturation at 95 °C for 2 s and annealing/extension at 60 °C for 20 s. The standard curves generated from these assays demonstrated a coefficient of determination (R2) exceeding 0.99, affirming the assay’s precision [4].

2.9. Sanger Sequencing Analysis

Following the Taqman qPCR assay, the DNA amplicons were purified using the NucleoSpin Gel and PCR Clean-up kit (Cat# 740609; Takara Bio, Kusatsu, Shiga, Japan). To verify the doping gene origin of these amplicons, 2 ng of the purified DNA was submitted to the Sanger sequencing service provided by GENEWIZ (Shinagawa, Tokyo, Japan), a specialized external provider. The obtained sequence data were examined using the BioEdit software version 7.2.5, developed by Tom Hall (Carlsbad, CA, USA). After verifying the accuracy and robustness of the waveform data, the sequence data were aligned with the reference of the hEPO gene [14], and whether accurate amplicons were obtained was evaluated [4].

2.10. Statistical Analysis

Each bar graph displays the values for an individual sample. Statistical comparisons between Con. and AAV-hEPO were conducted utilizing Welch’s t-test. A p-value below 0.05 was considered as statistical significance.

3. Results

3.1. Hematopoietic Parameters Increased after the rAAV Injection

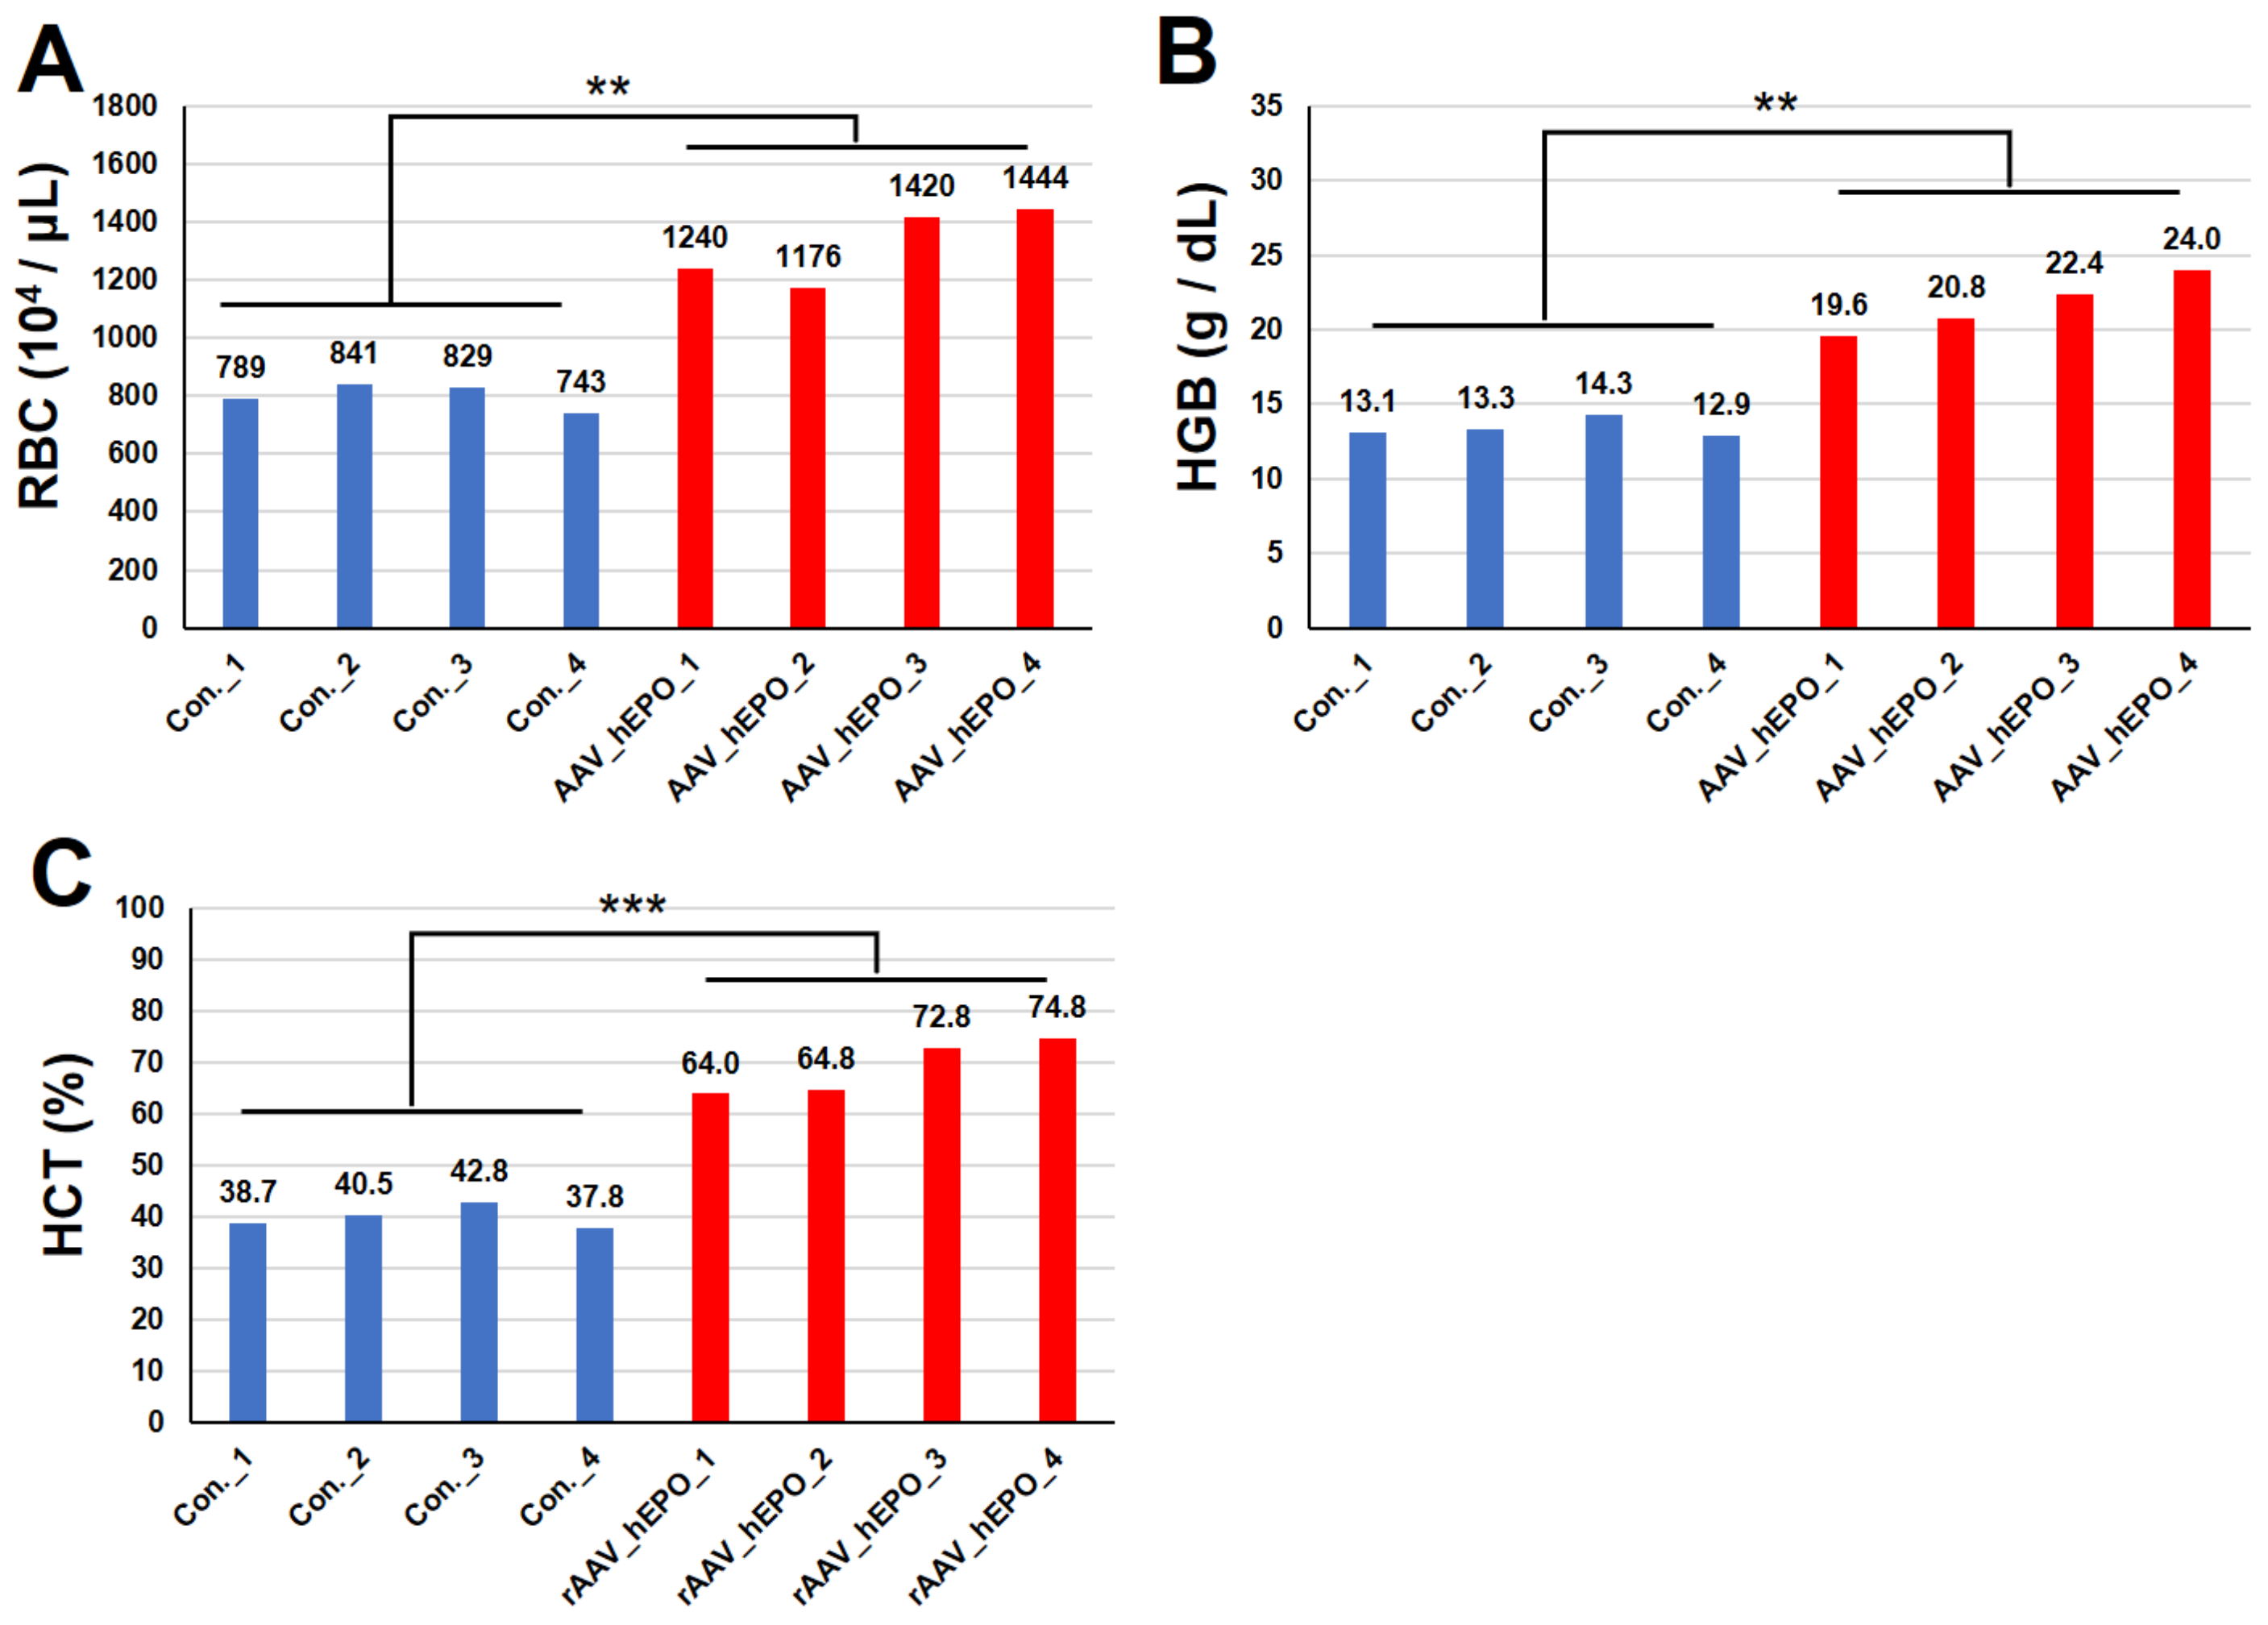
Hematopoietic parameters such as the RBC count (Figure 2A), HGB concentration (Figure 2B), and HCT percentage (Figure 2C) were significantly increased in the AAV-hEPO group (Figure 2A,B). These results indicate that the hEPO gene transfer via the rAAV9 vector was successful, and the gene doping model was established.

3.2. Confirmation of DNA Yield and Fragmentation after Purification

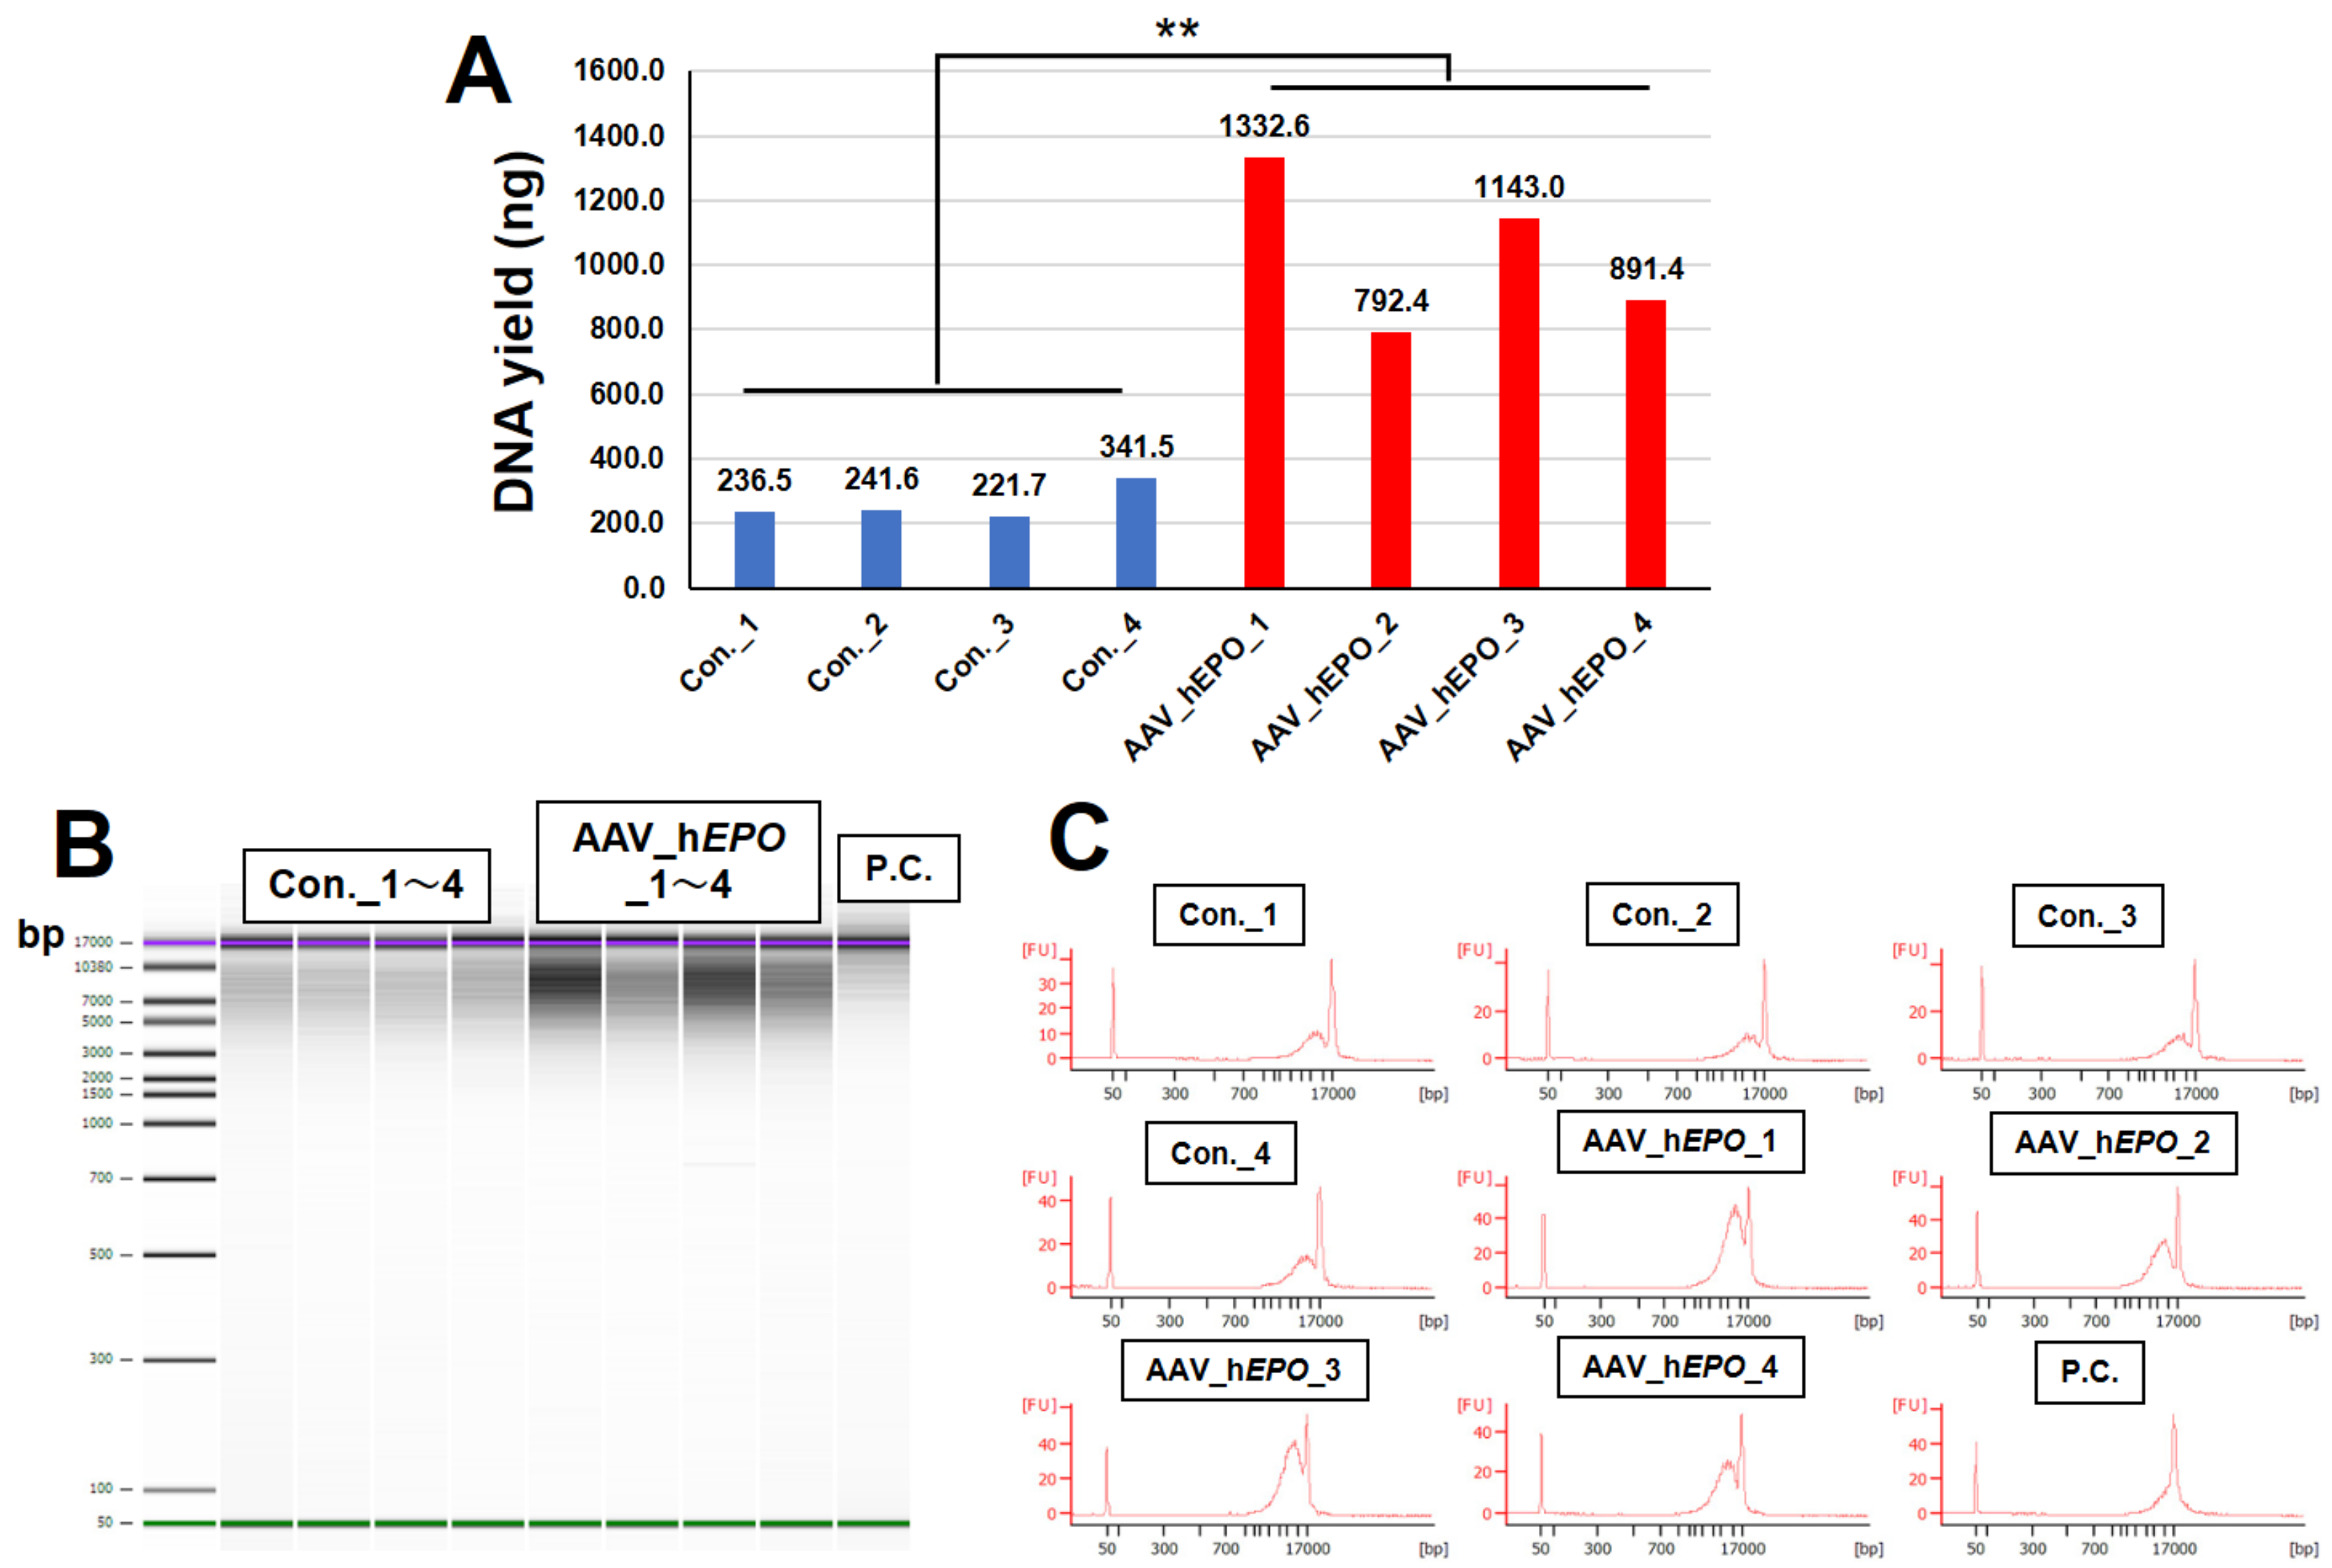
The DNA extracted and purified from DBSs exhibited high yields in the AAV-hEPO group (Figure 3A). All DBS-derived DNA samples exhibited a band and peak at approximately 10 kbp, while intact DNA (positive control; P.C.) exhibited them at approximately 17 kbp (Figure 3B,C). These results indicate that the DBS samples were partially fragmented during the storage period.

3.3. Direct Proof of Gene Doping was Detected in the DBS-Derived DNA

The TaqMan qPCR assay results detected positive gene doping in all mice in the AAV-hEPO group. Moreover, the positive copy numbers ranged from 88 to 135 copies/μL. In contrast, no positive reactions were detected in the Con. group and negative control (Figure 4A). Sanger sequencing accurately detected the hEPO gene sequence without exons (Figure 4B). These results mean that the hEPO gene (without introns) present only in the AAV vector used for gene doping could be accurately detected, i.e., gene doping could be detected in the DBS-derived DNA.

4. Discussion

This pilot study was a small, limited-scope experiment that tested the adaptability of DBSs to the gene doping test. Mice injected with the rAAV9-hEPO vector showed significant increases in parameters reflecting hematopoiesis (RBCs, HBG, and HCT) in the whole blood, suggesting that an animal model mimicking gene doping could be established.
Whole blood from the model mice was applied to filter paper to form DBSs. The DNA was extracted, and although the DNA was slightly fragmented, the quality of the DNA was confirmed to be sufficient for the TaqMan qPCR assay with respect to detecting gene doping. The TaqMan qPCR assay could then be used to accurately detect the vector-derived DNA sequence targeted hEPO gene with exon–exon junctions, which is a direct indicator of gene doping. These results suggest that DBSs have the potential to be incorporated into future gene doping test protocols, and using them comprises an economical and reliable approach for preserving blood samples. However, the present study only serves as a validation for the mouse model, and the number of mice used was relatively low. Additionally, no comparison was made with raw blood samples. In order to obtain a more robust result, it is essential to increase the number of samples and verify the detection efficiency with and without DBS. The data from this study show that the DNA extracted and purified from DBS is slightly fragmented. This suggests that the detection efficiency of genetic doping may be halved when DBS is used due to the possible fragmentation of vector-derived DNA. In our next study we will conduct detailed experiments to address these issues.
With the rapid development of gene therapy technology in recent years, gene transfer is becoming widely recognized by the general public. As a result, there is growing concern about genetic doping in athletes, and WADA has specified gene doping on its prohibited list [3]; moreover, they are developing testing methods. A primary challenge in refining gene doping testing protocols is the expense associated with the preservation of blood samples. Conventional blood testing is known to be expensive and unreasonable considering the financial outlay for collection equipment, on-site storage, transportation, storage in laboratories, and labor. DBSs, on the other hand, have the potential to solve these problems. Therefore, the establishment of a detection method for gene doping that is compatible with DBSs has the potential to substantially decrease the costs related to standard testing practices. The results of this research are the first example of the successful detection of genetic doping using DBSs in a genetic doping model animal. Therefore, the findings may aid future research aimed at establishing robust testing methods.
The application of the DBS testing method would contribute to a fairer competitive environment for athletes and the broader society. With DBSs, the process of collecting blood samples on testing days is streamlined, alleviating some of the psychological stress experienced by athletes. For example, when a DBS is indicated, a microdose blood collection from the fingertip or Non-Invasive Capillary Blood Collection (Product name: TAP blood collection device; Seventh Sense Biosystems, Medford, MA, USA) can be used. In particular, the TAP blood collection device can be attached to the outer upper arm and simply pushed to collect a minute amount of blood [15,16], making it a better option for athletes for whom fingertip sensation is important. This is significantly less invasive than the traditional method of collecting more than 3–5 mL of whole blood by inserting a needle directly into a vein. From a societal standpoint, the cost-effectiveness of the DBS method would enable more widespread testing, even at regional competition levels, fostering a culture of anti-doping and integrity in sports. Therefore, the use of the DBS method is very valuable not only in genetic doping testing but also in testing for various banned steroids, compounds, and hormones.
There is still room for improvement with respect to pre-processing and detection methods for DBSs. Human manipulation in the inspection process creates the risk of contamination and fraud. Therefore, developing pre-processing and detection methods that require as little human intervention as possible is necessary, and many tests are already automated in actual medical laboratories. Therefore, automating most processes in doping testing is desirable as well. There are previous studies on the application of DBSs in doping testing, such as the targeting of steroids and other compounds [17,18,19,20], genetic polymorphisms [9,21,22], plasmids via the spike-in test [23], hEPO proteins with mutations [24], and mRNAs [25]. Although these previous studies described the affinity and future promise of DBSs in doping testing, there was only one report of an automated testing process [18]. Hence, future research should not only focus on the target substance but also focus on research and development in order to automate the DBS pretreatment and detection processes. Recently, we have also recognized this challenge and have been conducting research and development aimed at full automation. We are aiming to automate gene doping testing using DBSs and the LabDroid “Maholo”, a laboratory robot created [26] by a Japanese venture company (Robotic Biology Institute Inc.; Koto, Tokyo, Japan). This LabDroid is capable of all basic experimental molecular biology operations. For example, the pipetting of reagents, agitation of reagents, centrifugation, and bead purification, are possible, and the space inside the robot is kept sterile to minimize the risk of contamination. Furthermore, the graphical interface has the advantage of allowing researchers to create their own original experimental protocols, permitting them to freely establish methods that are compatible with each specimen. Therefore, this LabDroid is expected to help establish genetic doping testing using DBSs in the future.
As shown in Figure 3A–C, the total DNA yield was significantly increased by an average of fourfold in the AAV-hEPO group compared to the control group. This increase could be a result of the increasing number of reticulocytes and erythroblast due to the overexpressed hEPO. The prior study showed increasing reticulocyte counts under the administration of erythropoietin [27]. Erythropoietin is known to stimulate reticulocytosis by enhancing the survival of erythroid progenitor cells (colony forming unit—erythroid), which then differentiate into erythroblasts. Erythroblasts enucleate to become reticulocytes in the bone marrow [28,29]. These cells will be released into the bloodstream before fully becoming mature in red blood cells. Although nuclear DNA is removed from reticulocytes, nascent reticulocytes still contain mitochondrial DNA [30]. This could be a reason why DNA extracted from whole-blood samples was increased in doping mice.
There are several limitations in this study. The storage conditions for DBSs used in this study were only “24 h at room temperature”. Therefore, it is unclear that any proof of gene doping would be detectable with longer storage periods at room temperature. DNA fragmentation may be more severe with longer storage periods. In addition, the temperature environment is an important factor in determining DNA degradation. A temperature environment of 4 °C in a refrigerator may be suitable for the DBS. To resolve these questions and issues, we need to review the storage period and temperature conditions and set up various experimental conditions. In the testing of top athletes, it would also be necessary to validate the DBSs over a storage period of several years, as they may be retested after several years. In addition, it is also still unclear whether it can be adapted to human blood because this study only used a mouse model. In the future, it may be essential to create and conduct experiments on DBSs from blood samples of patients who have undergone gene therapy or actual athletes. In summary, this study is only a pilot study that used mice; more validation is needed to adapt it to actual gene doping testing.

5. Conclusions

This study demonstrates the utility of DBSs in gene doping tests using a mouse model that induced the hEPO gene via the rAAV9 vector. This finding could contribute to the future development of gene doping tests.

Author Contributions

Conceptualization, T.S. and N.O.; methodology, T.S., Y.K. and N.O.; formal analysis, T.S.; investigation, N.O. and T.S.; writing—original draft preparation, N.O., K.D.M.N. and T.S.; writing—review and editing, N.O., Y.K., K.D.M.N. and T.S.; visualization, N.O. and T.S.; supervision, T.S. and Y.K.; project administration, T.S. and Y.K.; funding acquisition, T.S. All authors have read and agreed to the published version of the manuscript.

Funding

This research was conducted using the internal research budget of the University of Tsukuba, Japan (academic year 2023). Moreover, this work was partially supported by a grant provided by the JAPAN Anti-Doping Agency in 2021.

Institutional Review Board Statement

This study was conducted in accordance with the animal experiment guidelines (corporation regulation; no. 50, 21 July 2005) of the Animal Ethics Committee of the University of Tsukuba. The approval number is 23-097 (1 May 2023).

Informed Consent Statement

Not applicable.

Data Availability Statement

Data are contained within the article.

Conflicts of Interest

The authors declare no conflicts of interest.

References

  1. Center for Biologics Evaluation; Research ZOLGENSMA. Available online: https://www.fda.gov/vaccines-blood-biologics/zolgensma (accessed on 5 April 2024).
  2. Novartis Pharma; DR’s Net; ZOLGENSMA. Available online: https://www.drs-net.novartis.co.jp/dr/products/product/zolgensma/document (accessed on 5 April 2024).
  3. The World Anti-Doping Agency (WADA). The World Anti-Doping Code International Standard Prohibited List 2024; WADA: Montreal, QC, Canada, 2024. [Google Scholar]
  4. Sugasawa, T.; Nakano, T.; Fujita, S.-I.; Matsumoto, Y.; Ishihara, G.; Aoki, K.; Yanazawa, K.; Ono, S.; Tamai, S.; Manevich, L.; et al. Proof of Gene Doping in a Mouse Model with a Human Erythropoietin Gene Transferred Using an Adenoviral Vector. Genes 2021, 12, 1249. [Google Scholar] [CrossRef] [PubMed]
  5. Sugasawa, T.; Aoki, K.; Yanazawa, K.; Takekoshi, K. Detection of Multiple Transgene Fragments in a Mouse Model of Gene Doping Based on Plasmid Vector Using TaqMan-qPCR Assay. Genes 2020, 11, 750. [Google Scholar] [CrossRef] [PubMed]
  6. Aoki, K.; Sugasawa, T.; Yanazawa, K.; Watanabe, K.; Takemasa, T.; Takeuchi, Y.; Aita, Y.; Yahagi, N.; Yoshida, Y.; Kuji, T.; et al. The Detection of Trans Gene Fragments of hEPO in Gene Doping Model Mice by Taqman qPCR Assay. PeerJ 2020, 8, e8595. [Google Scholar] [CrossRef] [PubMed]
  7. Sugasawa, T.; Aoki, K.; Watanabe, K.; Yanazawa, K.; Natsume, T.; Takemasa, T.; Yamaguchi, K.; Takeuchi, Y.; Aita, Y.; Yahagi, N.; et al. Detection of Transgenes in Gene Delivery Model Mice by Adenoviral Vector Using ddPCR. Genes 2019, 10, 436. [Google Scholar] [CrossRef] [PubMed]
  8. Levernæs, M.C.S.; Solheim, S.A.; Broderstad, L.; Zandy, E.; Mørkeberg, J.; Dehnes, Y. Detection of Doping Substances in Paired Dried Blood Spots and Urine Samples Collected during Doping Controls in Danish Fitness Centers. Drug Test. Anal. 2024; online ahead of print. [Google Scholar] [CrossRef] [PubMed]
  9. Donati, F.; Concetti, L.; de la Torre, X.; Zhou, X.; Zhang, L.; Botrè, F. Detection of Exon 5 c.577del Variant of Human Erythropoietin Gene in Whole Blood, Dried Blood Spots and Urine Samples for Doping Control. Front. Anal. Sci. 2023, 3, 1202074. [Google Scholar] [CrossRef]
  10. Carrasco, T.; Barquín, D.; Ndarabu, A.; Fernández-Alonso, M.; Rubio-Garrido, M.; Carlos, S.; Makonda, B.; Holguín, Á.; Reina, G. HCV Diagnosis and Sequencing Using Dried Blood Spots from Patients in Kinshasa (DRC): A Tool to Achieve WHO 2030 Targets. Diagnostics 2021, 11, 522. [Google Scholar] [CrossRef] [PubMed]
  11. Chandane Tak, M.; Vaidyanathan, A.; Mukherjee, A. Revolutionizing HIV-1 Viral Load Monitoring in India: The Potential of Dried Blood Spot Analysis for Expanding Access and Improving Care. Healthcare 2024, 12, 413. [Google Scholar] [CrossRef] [PubMed]
  12. Doornekamp, L.; Embregts, C.W.E.; Aron, G.I.; Goeijenbier, S.; van de Vijver, D.A.M.C.; van Gorp, E.C.M.; GeurtsvanKessel, C.H. Dried Blood Spot Cards: A Reliable Sampling Method to Detect Human Antibodies against Rabies Virus. PLoS Negl. Trop. Dis. 2020, 14, e0008784. [Google Scholar] [CrossRef] [PubMed]
  13. Primer Designing Tool. Available online: https://www.ncbi.nlm.nih.gov/tools/primer-blast/ (accessed on 10 April 2024).
  14. Homo Sapiens Erythropoietin (EPO), mRNA—Nucleotide—NCBI. Available online: https://www.ncbi.nlm.nih.gov/nuccore/NM_000799.4 (accessed on 8 April 2024).
  15. Dried Blood Spot (DBS) Testing & the Potential for the ABP, Matthew Fedoruk, 16th Annual USADA Symposium on Anti-Doping Science. Available online: https://www.wada-ama.org/sites/default/files/54_fedoruk_day_3_distribution.pdf (accessed on 10 April 2024).
  16. Blicharz, T.M.; Gong, P.; Bunner, B.M.; Chu, L.L.; Leonard, K.M.; Wakefield, J.A.; Williams, R.E.; Dadgar, M.; Tagliabue, C.A.; El Khaja, R.; et al. Microneedle-Based Device for the One-Step Painless Collection of Capillary Blood Samples. Nat. Biomed. Eng. 2018, 2, 151–157. [Google Scholar] [CrossRef] [PubMed]
  17. Dried Blood Spots (DBS) in Sports Drug Testing: Complementary Matrix Providing Unique Features and Utilities to Modern Anti-Doping Fights. Available online: https://www.wada-ama.org/en/resources/scientific-research/dried-blood-spots-dbs-sports-drug-testing-complementary-matrix (accessed on 10 April 2024).
  18. Garzinsky, A.-M.; Thomas, A.; Guddat, S.; Görgens, C.; Dib, J.; Thevis, M. Dried blood spots for doping controls—Development of a comprehensive initial testing procedure with fully automated sample preparation. Chromatography 2023, 37, e5633. [Google Scholar] [CrossRef] [PubMed]
  19. Okano, M.; Miyamoto, A.; Ota, M.; Kageyama, S.; Sato, M. Doping Control Analysis of Trimetazidine in Dried Blood Spot. Drug Test. Anal. 2022; online ahead of print. [Google Scholar] [CrossRef] [PubMed]
  20. Thomas, A.; Geyer, H.; Schänzer, W.; Crone, C.; Kellmann, M.; Moehring, T.; Thevis, M. Sensitive Determination of Prohibited Drugs in Dried Blood Spots (DBS) for Doping Controls by Means of a Benchtop Quadrupole/Orbitrap Mass Spectrometer. Anal. Bioanal. Chem. 2012, 403, 1279–1289. [Google Scholar] [CrossRef] [PubMed]
  21. Naumann, N.; Walpurgis, K.; Rubio, A.; Thomas, A.; Paßreiter, A.; Thevis, M. Detection of Doping Control Sample Substitutions via Single Nucleotide Polymorphism-based ID Typing. Drug Test. Anal. 2023, 15, 1521–1533. [Google Scholar] [CrossRef] [PubMed]
  22. Leuenberger, N.; Jan, N.; Kuuranne, T.; Castella, V. Characterization of DNA Concentration in Urine and Dried Blood Samples to Detect the c.577 Deletion within the EPO Gene. Drug Test. Anal. 2024; online ahead of print. [Google Scholar] [CrossRef] [PubMed]
  23. Marchand, A.; Roulland, I.; Semence, F.; Ericsson, M. EPO Transgene Detection in Dried Blood Spots for Antidoping Application. Drug Test. Anal. 2021, 13, 1888–1896. [Google Scholar] [CrossRef]
  24. Heiland, C.E.; Martin, L.; Zhou, X.; Zhang, L.; Ericsson, M.; Marchand, A. Dried Blood Spots for Erythropoietin Analysis: Detection of Micro-doses, EPO c.577del Variant and Comparison with In-competition Matching Urine Samples. Drug Test. Anal. 2023; online ahead of print. [Google Scholar] [CrossRef] [PubMed]
  25. Loria, F.; Stutz, A.P.; Rocca, A.; Grabherr, S.; Kuuranne, T.; Pruijm, M.; Leuenberger, N. Monitoring of Hemoglobin and Erythropoiesis-Related mRNA with Dried Blood Spots in Athletes and Patients. Bioanalysis 2022, 14, 241–251. [Google Scholar] [CrossRef] [PubMed]
  26. Yachie, N.; Robotic Biology Consortium; Natsume, T. Robotic Crowd Biology with Maholo LabDroids. Nat. Biotechnol. 2017, 35, 310–312. [Google Scholar] [CrossRef] [PubMed]
  27. Bierer, R.; Roohi, M.; Peceny, C.; Ohls, R.K. Erythropoietin Increases Reticulocyte Counts and Maintains Hematocrit in Neonates Requiring Surgery. J. Pediatr. Surg. 2009, 44, 1540–1545. [Google Scholar] [CrossRef] [PubMed]
  28. Elliott, S.; Pham, E.; Macdougall, I.C. Erythropoietins: A Common Mechanism of Action. Exp. Hematol. 2008, 36, 1573–1584. [Google Scholar] [CrossRef] [PubMed]
  29. Lundby, C.; Thomsen, J.J.; Boushel, R.; Koskolou, M.; Warberg, J.; Calbet, J.A.L.; Robach, P. Erythropoietin Treatment Elevates Haemoglobin Concentration by Increasing Red Cell Volume and Depressing Plasma Volume. J. Physiol. 2007, 578, 309–314. [Google Scholar] [CrossRef] [PubMed]
  30. Stevens-Hernandez, C.J.; Flatt, J.F.; Kupzig, S.; Bruce, L.J. Reticulocyte Maturation and Variant Red Blood Cells. Front. Physiol. 2022, 13, 834463. [Google Scholar] [CrossRef] [PubMed]
Figure 1. Scheme of the experimental procedures used in this study.
Analytica 05 00017 g001
Figure 2. Measurements of the hematopoietic parameters. The bar graphs (AC) illustrate the values observed for each mouse. The blue bars represent the values observed in the control group (n = 4), while the red bars represent the values observed in the AAV-hEPO group (n = 4). The numbers displayed above each bar indicate the raw values. (A): RBC counts; (B): HGB concentration; (C): HCT percentage. ** p < 0.01; *** p < 0.001.
Analytica 05 00017 g002
Figure 3. Confirmation of DNA yield and fragmentation in DBS-derived DNA. The bar graphs (A) illustrate the values observed for each mouse. The blue bars represent the values observed in the control group (n = 4), while the red bars represent the values observed in the AAV-hEPO group (n = 4). The numbers displayed above each bar indicate the raw values. (A): DNA yield; (B): electrophoresis photographs; (C): histogram of signals acquired via electrophoresis. P.C.: positive control as intact DNA. ** p < 0.01.
Analytica 05 00017 g003
Figure 4. Detection of gene doping and Sanger sequencing. The bar graphs (A) illustrate the values observed for each mouse. The red bars represent the values observed in the AAV-hEPO group (n = 4). The numbers displayed above each bar indicate the raw values. (A): Detection of gene doping via the TaqMan qPCR assay and the quantitative copy number values; (B): Sanger sequencing waveforms and alignment to the reference sequence of the hEPO gene. N.D.: not detected. ** p < 0.01.
Analytica 05 00017 g004
Table 1. Sequences of the primer probe.
Target SequencesPredicted Amplicon Size (bp)
hEPOForwardCATCTGTGACAGCCGAGTCC290
Probe56-FAM/TG AGA ATA T/ZEN/C ACT GTC CCA GAC ACC/3IABkFQ
ReverseAGGCCACTGACGGCTTTATC
Disclaimer/Publisher’s Note: The statements, opinions and data contained in all publications are solely those of the individual author(s) and contributor(s) and not of MDPI and/or the editor(s). MDPI and/or the editor(s) disclaim responsibility for any injury to people or property resulting from any ideas, methods, instructions or products referred to in the content.