Abstract
This study focuses on evaluating the characteristics of olive oil produced in the Taroudant province (southern Morocco), making this the first comprehensive study focusing on olive oil from the ‘Moroccan Picholine’ cultivar. Our objective was to elucidate the distinctive qualities of olive oil from this region, providing valuable insights into its potential contributions to the country’s olive oil sector. For this purpose, several quality criteria (free fatty acids, moisture content, saponification value, and iodine value), oxidation indices (peroxide value, specific UV extinction coefficients, and oxidizability value), and purity indices (fatty acids and sterol composition) were evaluated. Our results reveal minor-to-significant variations (p < 0.05) in the quality and oxidation parameters. Specifically, our results indicate diverse ranges for free fatty acids (0.33–3.62 g/100 g), peroxide values (0.85–4.01 mEq O2/kg oil), K232 (1.68 to 2.73), and K270 (0.09–0.34). Furthermore, consistently high levels of oleic acid (55.8 to 73.1%) and β-sitosterol (94.2 to 97%) were observed in the studied samples. These outcomes were confirmed through the use principal component analysis and hierarchical cluster analysis. Likewise, important correlations were outlined among the studied parameters. Multidimensional analyses not only highlight inherent variations, but also facilitate the classification of the analyzed olive oils into distinct categories. The results suggest that the Taroudant province exhibits favorable conditions for producing high-quality olive oil.
1. Introduction
The olive tree (Olea europaea L.) is unquestionably the quintessential fruit tree of the Mediterranean region, with origins deeply rooted in a vast historical and paleo-geographical heritage extending back hundreds of years [1,2]. The historical narrative of olive tree domestication is deeply buried in the records of ancient history, yet the prevalent thinking suggests that olive cultivation and domestication started between 6000–5500 B.C. in the Levant region, during the chalcolithic period [3].
Olive oil is the primary lipid source within the Mediterranean diet, renowned for its reputation as one of the healthiest dietary preferences. Olive oil is the lipid fraction extracted from olive juice using mechanical and physical [4]. This deliberate lack of refining preserves the integrity of minor lipophilic compounds and hydrophilic phenols, which play an essential role in maintaining olive oil’s distinctive sensory, principal characteristics, as well as other beneficial compounds [5]. The quality of olive oil is determined by chemical, physical, and sensory properties, leading to its categorization based on standards set by the International Olive Oil Council. The highest quality variety is known as extra virgin olive oil (EVOO), with a maximum FFAs value of 0.8 g of oleic acid per 100 g of oil. Regular extra virgin olive (VOO) oil may have a maximum FFAs value of 2.0 g of oleic acid per 100 g of oil. Lower-grade olive oil (LOO) does not meet the marketing criteria in its current state, exhibiting an FFAs value exceeding 3.3 g of oleic acid per 100 g of oil [6,7,8].
The relevance of olive oil stems primarily from its expanding worldwide use, stimulated by its unique nutritional features when compared to other vegetable oils. Olive oil is renowned for its exceptional stability and extended shelf-life [9]. Olive oil’s shelf-life is commonly evaluated to be between 12 and 18 months. However, it is suggested that when appropriately stored in well-sealed packages, olive oil can maintain its quality beyond these timeframes [9]. Olive oil is recognized for its health benefits, attributed to a higher proportion of monounsaturated fatty acids (MUFAs), reaching up to 85 g/100 g, predominantly due to elevated oleic acid (C18:1) levels within the range of 70–85%. Scientific studies have consistently highlighted the positive impact of oleic acid, belonging to the omega-9 family, on inducing anti-inflammatory effects, improving immune system functions, and reducing cholesterol levels and blood pressure. Furthermore, olive oil is appreciated by consumers both for its well-documented health benefits and for its distinct, pleasing aroma profile, which results from a delicate combination of volatile compounds [10]. Olive oil is a highly prolific source of bioactive compounds, encompassing phenols, tocopherols, sterols, phospholipids, waxes, squalene, and various other hydrocarbons that collectively constitute the unsaponifiable fraction [11]. However, various factors influence the quality of the final composition of virgin olive oils, from the very early stages of oil ripening in the olive tree to its consumption. It is essential to consider every aspect that could impact the product’s commercial viability, including agronomic practices, raw materials, harvesting techniques, fruit storage, and extraction technology [12].
In recent decades, olive oil production has tripled. In 2021/22, the world consumption of olive oil reached about 3.2 million metric tons, and it is expected to decline by 2022/23 to around 2.9 million metric tons. The European market is the world’s largest consumer of olive oil, accounting for over two-thirds of global consumption, whilst Greece stands out as the country with the highest consumption levels per capita. The remaining third is consumed mainly in the United States, Canada, Australia, Asia, and Africa. Furthermore, the global market for olive oil is expanding due to the growing awareness of its health benefits and its many uses in cuisine [4]. Thus, Morocco has the largest expanse of olive groves in North Africa, covering over 1.2 million ha and experiencing a remarkable upward trajectory [13]. Morocco’s olive grove area has increased by over 60% in the last 25 years, representing one of the highest growth rates in the world. It accounts for around 65% of the country’s tree-growing landscape, and contributes 5% to Morocco’s agricultural gross domestic product [14]. Moroccan production is spread over 10 regions across various agro-climatic areas. The Fez-Meknes and Marrakech-Safi regions account for nearly 54% of the total surface area devoted to olive growing [15,16]. They are endowed for a variety of bioclimatic zones, from humid to arid and semi-arid environments, extending their presence throughout the country [16]. The government continues to promote and encourage this sector as a part of its efforts to develop the national agricultural sector. Collectively, these efforts also aim to strengthen the competitiveness of Moroccan olive cultivation, its contribution to the economy. and the livelihoods of olive growers and workers [13].
However, Morocco has significant untapped olive-growing resources in the southern areas, starting from the Taroudant province, where vast olive groves remain under exploited. Furthermore, there is a lack of in-depth research on the olive fruit and its oil, reflected in the limited knowledge of their chemical composition and potential benefits. In light of these considerations, the main focus of our present study is the characterization of olive oil produced locally to establish a commercial classification in accordance with the International Olive Oil Council standard of 45 samples belonging to the main Moroccan cultivar ‘Moroccan Picholine’.
2. Materials and Methods
2.1. Olive Oil Sampling
During the olive harvest season from October to December 2021, a comprehensive sampling campaign was conducted. The olives were harvested at a consistent ripening stage, with a maturity index of around 3–4. A total of 45 olive oil samples (‘Moroccan Picholine’ cultivar) were collected from various sites in the Taroudant province, located in the Souss plain (southwest of Morocco), as depicted in Figure 1. Upon sampling, each olive sample collected was immediately processed using an industrial mill unit (super-pressure system) to extract the olive oil. As reported in other works, the olives are first washed and crushed using large millstones, a process that typically lasts between 45 and 60 min. After crushing, the resulting olive paste is spread evenly over stacked fiber disks, which are then inserted into the press. In the press, hydraulic pressure is applied to the discs, compacting the solid phase of the pulp, while allowing the liquid phases, including oil and water, to flow through the discs. During this process, a small amount of water can be added to facilitate the removal of any residual material from the discs, and to facilitate the transfer of the oily must for clarification. The olive oil is then separated by a simple decantation process [17]. The extracted olive oils were promptly transferred to amber glass containers and transported to the laboratory under controlled conditions in a deep freeze at 4 °C; this is to prevent any degradation or alteration of the oil composition. This stringent storage protocol was implemented to maintain the highest standards of preservation until further analysis could be implemented.

Figure 1.
A map of the olive growing area in the study zone.
The Taroudant province is characterized by a semi-arid, sub-desert climate, as well as by consistent warmth and aridity throughout the year. Rainfalls are relatively scarce and irregular, with an average of 200 mm per year in the plain, primarily occurring during the autumn and winter seasons. The region maintains a temperate climate, with an annual average temperature of approximately 19 °C. The study area falls under the administrative jurisdiction of the Taroudant province and spans an extensive area encompassing 755,175 hectares [18].
2.2. Analytical Methods
2.2.1. Basic Quality Parameters
We assessed the regulated physicochemical quality parameters. These encompass free fatty acids (FFAs, expressed as oleic measured in mass percentage of oil, g/100 g), peroxide value (PV, presented in milliequivalents of active oxygen per kilogram of oil, mEq O2/kg oil), UV extinction coefficients at 232 and 270 nm (K232, K270, and ΔK), and moisture content (% of oil). Such parameters were determined following the norms of the analytical procedures outlined in the established standards [19,20,21,22].
Briefly, the FFAs value was determined via the titration of a solution of oil in ethanol with ethanolic NaOH (0.1 N), and is expressed as the percentage of oleic acid. The PV was determined using iodine titration with a sodium thiosulfate solution of oil in isooctane/acetic acid at a ratio of 2:3 that had been left in the darkness in the presence of potassium iodide. The moisture content of the oils is determined through oven drying at 103 ± 2 °C for 1 h. The drying process is repeated until a constant weight is obtained.
K232 and K270 were expressed as the specific extinctions of a 1% (w/v) solution of cyclohexane-olive oil, measured in a 1 cm cuvette, using a SCILOGEX SP-UV1100 spectrometer (Rocky Hill, CT 06067, USA). These coefficients are derived from measuring the absorbance of the oil sample measured using the specified wavelengths (232 nm for K232 and 270 nm for K270). The ΔK was calculated from 266, 268, and 274 nm absorptions using Equation (1) as follows:
2.2.2. Fatty acid Composition
The fatty acids were transformed into their corresponding fatty acid methyl esters using a transmethylation process, in accordance with the established standard [23]. About 0.1 g of each oil sample was carefully placed in a 10-milliliter screw-top test tube. Following this, 2 mL of isooctane was introduced, and the contents were gently mixed. Next, 0.1 mL of a 2 N methanolic potassium hydroxide solution was swiftly added. The test tube was immediately capped and stirred for 1 min. Subsequently, the solution was left to stand for 2 min. After that, 2 mL of sodium chloride solution was added and agitated. The isooctane layer was extracted and transferred to a sample vial. Then, about 1 g of sodium hydrogen sulfate was added and agitated. The composition of fatty acids was investigated using gas chromatography (Agilent-6890, Santa Clara, CA, USA), coupled with a flame ionization detector (GC-FID). The flame was generated by the combustion of a hydrogen/air mixture. Capillary column CP-Wax 52CB (30 m × 250 μm i.d., 0.25 μm film thickness) was used. Helium (with a flow rate of 1 mL/min) was used as a carrier gas. The temperatures of the oven, injector, and detector were 185, 200, and 230 °C, respectively. The injection volume of the sample was 1 µL in split mode (split ratio 1:50). The results were expressed as the relative percentage of area of each fatty acid peak [24].
2.2.3. Oxidizability Value (COX)
The calculated value of the oxidizability (COX) of the oils was determined using Equation (2) as proposed by Abril et al. [25].
2.2.4. Iodine Value (IV)
The iodine value (IV) serves as an indicator to assess the level of unsaturation in oils, defined as the weight of iodine absorbed per 100 g of oil or fat. The IV is calculated based on the percentage of unsaturated fatty acids, determined using Equation (3) [24] as follows:
where C16:1 is palmitoleic acid, C18:1 stands for oleic acid, C18:2 denotes linoleic acid, and C18:3 is linolenic acid. CO1, CO2, CO3, and CO4 are the corresponding iodine value coefficients for each fatty acid, with values of 1.001, 0.899, 1.814, and 2.737, respectively.
IV = (%C16:1 × CO1) + (%C18:1 × CO2) + (%C18:2 × CO3) + (%C18:3 × CO4)
2.2.5. Saponification Value (SV)
The obtained saponification value (SV) is calculated based on the fatty acid composition using Equations (4) and (5) below. Initially, the fractional molecular weight of each fatty acid in the sample is determined by multiplying the percentage of the fatty acid (divided by 100) by its respective molecular weight. Subsequently, the mean molecular weight is calculated as the sum of the fractional weights of all fatty acids present in each sample [26].
where
2.2.6. Sterols Composition
The composition of the sterol fraction was measured [27]. The derivatives of the sterols were analyzed using Agilent-6890, Santa Clara, CA, USA, as gas chromatograph instrument. The temperature of the column was isothermal at 270 °C, and the temperature of the injector and detector were set at 300 °C. The carrier gas was helium and had a flow rate of 1.6 mL/min. The identification of individual peaks was carried out using available reference standards and comparing the known retention times of the sterols in olive oil samples. Three injections, each consisting of 1 μL, were applied to each sample. Results were expressed as mg of sterol per 100 g of oil [28].
2.3. Statistical Analysis
The results are reported as mean values ± SD (standard deviation, n = 3). The significance of the differences among the mean values was performed using Tukey’s test with a 0.05 significance level. Principal component analysis (PCA) and correlation matrix were carried out on data mean values. Computations were carried out using the OriginPro software (version 9.1, OriginLab Inc., Northampton, MA, USA). Hierarchical cluster analysis (HCA) was performed on the mean values and correlations as a distance measure using R software (version 4.0.5).
3. Results
3.1. Basic Quality Parameters
Olive oil is regarded as an important economic product, and its quality control relies mainly on a set of parameters such as free fatty acids, moisture content, specific absorption coefficients (K232 and K270), ΔK, and peroxide value (PV).
3.1.1. Free Fatty Acids (FFAs)
The parameters of FFAs have long served as a pivotal criterion in the assessment of olive oil quality and its alignment with international trade standards. This parameter facilitates the categorization of olive oil products into distinct classes. FFAs analysis was performed on the collected 45 samples. The results are shown in Figure 2 and Table 1.
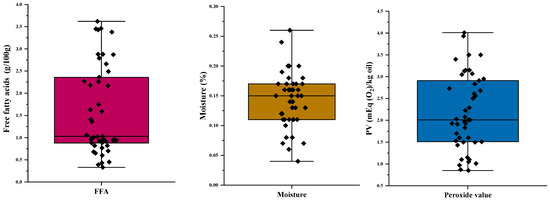

Figure 2.
Quality and oxidation parameters of the evaluated VOOs.
Based on the distribution of FFAs within a dataset comprising 45 samples, it is evident that 11 of these samples (24.5%) exhibit values below 0.8% of oleic acid content, thus classifying them as extra virgin olive oils (EVOO) in accordance with the guidelines established by the International Olive Council [29], as illustrated in Figure 2. The majority of the oils analyzed (23 samples, about 51%) fall into the virgin olive oil (VOO) category. However, the remaining samples surpass this threshold, with 11 samples exhibiting a FFAs range of 2 to 3.3%, and 4 samples displaying a FFAs content higher than 3.3%.
Triglycerides undergo cleavage, resulting in the production of glycerol, mono- and diglycerides, as well as individual fatty acids. This process starts within the fruit, especially when the fruit’s skin has been compromised by insects, in cases where damage is caused by hailstorms. or during the harvesting of drupes [30,31]. The increase and acidification of olive oils is advanced by any defective ripeness of the fruit or prolonged and inadequate storage before crushing, often resulting from non-compliance with harvesting practices and procedures and olive oil production, thus failing to avoid mechanical damage or exposure to the weather [32,33]. Notably, certain instances involve the manual harvesting of fruits, followed by their commingling with fruits gathered from the ground. Both the harvesting time and general condition of the fruit likewise play a crucial factor in determining this feature. These are particularly evident in certain samples, where a large number of exit holes amplify the penetration of air and micro-organisms, leading to an increase in FFAs [34,35]. Furthermore, factors such as extraction technology heavily influence the range of values in these parameters, as reported by the authors Sakar et al. [36], who studied the variations in the physicochemical characteristics of Moroccan olive oil (cv ‘Moroccan Picholine’) using three extractions systems, namely two-phase, three-phase (3P), and super-pressure (SP) systems, as well as the traditional extraction method.
3.1.2. Moisture Content (MC)
Olive oil quality depends on its composition, and moisture content represents one of the main parameters specified by the International Olive Oil Council to determine quality, with a prescribed threshold of ≤0.2% by weight for virgin olive oils [29]. The presence of moisture can accelerate the development of rancidity in oils, resulting in undesirable tastes and aromas; this also plays a role in influencing the hydrolysis process of the triglycerides within the olive oil [6]. The moisture contents of 45 olive oil samples are presented in Figure 2. As shown in Figure 2 and Table 1, the moisture content (MC) ranged from 0.04 to 0.26% of oil, whereby all the samples analyzed are below the limit established by the International Olive Oil Council, with the exception of two samples, which have moisture contents above 0.20% (0.26 and 0.24%, respectively).
Water is uniformly concentrated in the oil matrix in the form of a stabilized micro-dispersion. While the presence of water in olive oil is known to be linked to its bitterness and pungency, the water amount in commercial olive oils is influenced by various factors related to the production process.
3.1.3. Peroxide Value (PV)
The PV is a crucial measure and a representative parameter for assessing the early stages of oxidation, frequently used to quantify bulk peroxide content, as well as monitoring lipid oxidation during oil processing and storage [13]. When the peroxide value exceeds a critical threshold, edible oils are likely to develop an undesirable rancid taste and even present potential risks of food-borne illnesses. It is therefore imperative to assess the peroxide value of edible oils, for reasons of food quality and human health [6]. As shown in Figure 2 and Table 1, the PV ranged from 0.85 mEq O2/kg to 4.01 mEq O2/kg of oil, whereby all the samples analyzed are below the limit established by the International Olive Oil Council (20 mEq O2/kg) [29].
These findings validate the absence of significant oxidation, aligning with prior studies on Greek and Italian olive cultivars [37,38]. This parameter depends on several external factors, such as light and temperature, high oxygen availability, the presence of prooxidants such as chlorophylls, metal ions (Fe3+ and Cu2+), and heavy metals, as well as other factors related to cultivation and harvesting conditions [39].
3.1.4. UV–Light Absorption (K232 and K270)
Extinction coefficients at 232 nm (K232) and 270 nm (K270) serve as alternative indicators of the oxidation state and quality of olive oil, offering both qualitative and quantitative information [40]. UV absorption changes at the 232 nm point to the formation of conjugated dienes, while those at 270 nm indicate the formation of conjugated trienes and carbonyl compounds in the polyunsaturated fatty acids of olive oil [41]. The extinction coefficients K232 and K270 of 45 olive oil samples are presented in Figure 2. The recorded data indicate that the majority of specific absorbance measurements ranged from 1.68 to 2.73 for K232 and from 0.09 to 0.34 for K270 (Figure 2, Table 1). These values align with the range established by the International Olive Oil Council [29] for virgin olive oils, which is defined as falling between 0.22 and 2.50. However, it is noteworthy that two samples deviate from this range, registering values above the prescribed limits for K232. Similarly, the ΔK values ranged from 0.0001 to 0.0039, signifying the exceptional purity of the obtained olive oil, with all values falling below the limit of ≤0.01.
The findings presented in this study exhibit lower values in comparison to the results published by Willenberg et al. [40], who documented a considerably broader range (1.35 to 5.13 for K232 and 0.1 to 0.44 for K270) when employing near infrared spectroscopy (NIR) as a tool for evaluating the specific absorbance of a wide selection of olive oil samples. In their study, Ayyad et al. [42] reported a narrow range for the K232 (1.799 to 2.843) and K270 values (0.141 to 0.242) of VOO obtained from the olives of the ‘Nabali Balasi’ cultivar in the Ramallah region of Palestine. Their findings indicated almost equal levels to our results. The existing body of literature suggests the minor or even negligible impact that the geographical region has on quality parameters, as these parameters are predominantly influenced by various factors over time, such as storage conditions, processing conditions, susceptibility to insect infestation, and more [37].
3.1.5. Oxidizability Value (COX)
The COX value serves as an indicator of oil oxidation, particularly in relation to unsaturated fatty acids. A lower COX value means a greater oil stability. In the case of olive oils, our analysis revealed COX values ranging from 2.12 to 3.29 (Table 1). Figure 3 demonstrates significant variability in this parameter among the samples, with nearly half of them falling outside the boxplot. This places olive oil on a more stable rank when compared to other oils such as Opuntia ficus-indica seed oil (6.45), as reported by Harkaoui et al. [43], or crude soybean oil (7.690), sunflower oil (6.600), and canola oil (4.140), as reported by Zielińska et al. [44]. The substantial presence of monounsaturated fatty acids, specifically oleic acid, contributes to the inherent oxidation resistance of olive oil.

Figure 3.
Oxidizability value (COX), iodine value (IV), and saponification value (SV) of the evaluated VOOs.
3.1.6. Iodine Value (IV)
The iodine value (IV) is a parameter used to express the degree of unsaturation or the average number of double bonds of fatty acids in fats and oils. The IV is a method used in the oil industry to roughly evaluate the oxidative stability of edible oils and fats [24,25]. The IV of the analyzed samples are depicted in Figure 3.
The iodine values for the olive oils from various samples ranged from 85.74 to 103.67 g (I2)/100 g of oil (Figure 3, Table 1). Most of the samples, located near the center, did not significantly differ from the mean, except for six samples which were counted as outliers. These variations in iodine values among the samples can be attributed to the wide range of fatty acid compositions. El Moudden et al. [45] reported iodine values ranging from 86.51 to 106.17 g (I2)/100 g of oil for nine olive oils produced in different regions of Morocco, aligning with our findings. Nevertheless, these values demonstrate a lower range than those reported by other authors [46,47], who investigated studies on olive oil cultivars originating from Iran and Turkey, respectively. As highlighted in the existing literature, saturated fat is recognized as particularly deleterious to human health, as it elevates LDL cholesterol levels, thus contributing to the risk of heart disease. Hence, we evaluated the IV, a parameter associated with the COX value, in order to further assess the nutritional characteristics of the oil.
3.1.7. Saponification Value (SV)
The saponification value (SV) of fats and oils is one of the most common quality indices, reflecting the mean molecular weight of the constituting triacylglycerols and also measuring the total free and combined acids, especially in a fat. A very high saponification value implies high FFAs content in the form of triglycerides, hence a very low FFAs content in olive oils. The values of the saponification index are presented in Figure 3.
The studied olive oils exhibited saponification values ranging from 194 to 196 mg (KOH)/g oil (Figure 3, Table 1), aligning with its fatty acid composition, which is dominated by C18 fatty acids, including linoleic acid (C18:2) and oleic acid (C18:1) as primary constituents. These values are consistent with similar saponification values reported in the literature [46]. The saponification values of various vegetable oils fluctuate based on the length of their fatty acid chains.
Admittedly, some of the samples in our study deviate from the limits set by the International Olive Council and EU legislations for various parameters. This deviation can be attributed to a number of factors, as already explained in our study. Sub-optimal storage conditions and fruit deterioration prior to extraction are identified as the main factors contributing to these deviations. These factors underline the importance of strict adherence to good handling, storage, and processing practices which ensure olive oil samples comply with the set standards. While discussing these discrepancies in a transparent manner, a proactive approach is needed in the formulation of policies and interventions that address the identified causes, thus contributing to the overall improvement of olive oil quality in the Taroudant province. This recognition is in line with our commitment to scientific rigor, and lays the foundations for ongoing efforts to align with and improve the established standards.

Table 1.
Descriptive statistics of the dataset under study (n = 45).
Table 1.
Descriptive statistics of the dataset under study (n = 45).
| Mean | SD | Sum | Min | Max | IOC Standards | |
|---|---|---|---|---|---|---|
| Fatty acids (%) | ||||||
| C 16:0 | 10.128 | 2.036 | 455.78 | 7.59 | 18.59 | 7.50–20.00 |
| C 16:1 | 0.662 | 0.255 | 29.79 | 0.23 | 1.68 | 0.30–3.50 |
| C 18:0 | 2.714 | 0.369 | 122.17 | 1.40 | 3.22 | 0.50–5.00 |
| C 18:1 | 65.411 | 3.060 | 2943.50 | 55.80 | 73.10 | 55.00–83.00 |
| C 18:2 | 18.253 | 2.598 | 821.39 | 12.35 | 23.41 | 2.50–21.00 |
| C 18:3 | 0.946 | 0.239 | 42.57 | 0.36 | 1.53 | ≤1.00 |
| C 20:0 | 0.324 | 0.074 | 14.60 | 0.10 | 0.60 | ≤0.60 |
| C 20:1 | 0.242 | 0.042 | 10.92 | 0.13 | 0.35 | ≤0.50 |
| Sterols (%) | ||||||
| Cholesterol | 0.108 | 0.055 | 4.90 | 0 | 0.30 | ≤0.5 |
| Brassicastérol | 0.1 | 0 | 4.59 | 0.10 | 0.10 | ≤0.1 |
| Campesterol | 3.803 | 0.455 | 171.17 | 2.57 | 4.77 | ≤4.0 |
| Stigmasterol | 1.260 | 0.289 | 56.79 | 0.70 | 1.90 | <Campesterol |
| β-Sitosterol app | 94.984 | 0.686 | 4274.30 | 94.20 | 97.00 | |
| Δ-7-Stigmastenol | 0.411 | 0.079 | 18.59 | 0.22 | 0.55 | 0.5 |
| Δ-5-Avenasterol | 0.711 | 0.215 | 32.03 | 0.12 | 1.10 | |
| Quality index | ||||||
| K232 | 2.154 | 0.212 | 96.94 | 1.68 | 2.73 | ≤2.50 |
| K270 | 0.198 | 0.054 | 8.92 | 0.09 | 0.34 | ≤0.22 |
| DK | 0.0001 | 0.001 | 0.01 | 0.0001 | 0.003 | ≤0.01 |
| PV (mEq O2/kg oil) | 2.185 | 0.865 | 98.35 | 0.85 | 4.01 | ≤20.0 |
| FFAs (g/100 g) | 1.600 | 1.005 | 72.03 | 0.33 | 3.62 | ≤0.80 |
| Moisture % | 0.144 | 0.045 | 6.48 | 0.04 | 0.26 | ≤0.2 |
| COX | 2.747 | 0.256 | 123.64 | 3.29 | 2.12 | ND |
| IV g (I2)/100 g oil | 95.167 | 3.368 | 4282.54 | 85.74 | 103.67 | 75–94 |
| SV mg (KOH)/g oil | 194.717 | 2.836 | 8762.30 | 187.36 | 199.47 | 184–196 |
IOC: International Olive Council. ND: not determined.
3.2. Olive Oil Purity Indices
Vegetable oils, in particular virgin olive oil (VOO), are complex mixtures with diverse chemical compositions that significantly influence their physicochemical properties. Olive oil is considered a functional food with high-quality nutrient features and a balanced composition between major (a high content of unsaturated fatty acids) and minor components such as polyphenols, tocopherols, and carotenoids. The minor components appear almost exclusively in virgin olive oil (VOO), as the majority of these compounds are eliminated during the refining process. Both major and minor components contribute to its high antioxidant activity, which can help prevent or delay certain degenerative diseases [48,49].
3.2.1. Fatty Acids Compositions
Fatty acids (FA), the main constituents of vegetable oil, play a major contribution to its physical and chemical properties. Virgin olive oil (VOO) is characterized by a high presence of monounsaturated fatty acids (MUFA), principally oleic acid (C18:1), representing 70 to 85% of its composition. Furthermore, it contains lower levels of polyunsaturated fatty acids (PUFAs), principally linoleic (18:2) and linolenic acids (C18:3), as well as saturated fatty acids, mainly palmitic (C16:0) and stearic acids (C18:0). Due to this distinctive fatty acid profile and a high ω6/ω3 ratio, which is nutritionally and technologically preferable, olive oil offers protective properties against various disorders and cancers [50]. The distribution of the fatty acids of VOOs from 45 samples is shown in Table 2. The distribution of mean fatty acid values were in accordance with the limits of the International Olive Oil Council [29].
Table 2.
Fatty acid composition (%) of evaluated VOOs. Different letters indicate significant differences at p < 0.05. Within the same column, values followed by the same letter are not significantly different at 5% as a probability level.
The data obtained reveal significant levels of monounsaturated fatty acids (MUFA) in the samples analyzed, with particular emphasis on oleic acid (C18:1), the most abundant fatty acid, accounting for 55.8% to 73.1% of total fatty acids (Table 2). Elevated levels of oleic acid account for the high stability of olive oil under controlled storage conditions. This is evidenced by the fact that the autoxidative stability of oleic acid is 10 times greater than that of linoleic acid, as reported in [50]. These findings align with previous research on olive oils from different countries, including Morocco [51], China [52], and Turkey [53]. Conversely, in another study conducted by Manai-Djebali et al. [54], five Tunisian olive oil cultivars exhibited a range of oleic acid content, spanning from 67.2 (‘Aloui’) to 78.9% (‘Hor Kesra’), indicating higher oleic acid levels when compared to our results. Linoleic acid (C18:2) represents the second most common fatty acid in the oils analyzed, with concentrations varying from 12.35 to 20.22% (Table 2). Compared to other vegetable oils, olive oil exhibited low amounts of (C18:2) compared to Moroccan cactus (61.8%) and argan oils (32.5%) [55]. Palmitic acid (C16:0) was the third most common (7.59 to 18.59%). Similar ranges of fatty acids in Brazilian olive oils have also been documented by Zago et al. [56]. García-Garví et al. [57] observed that the palmitic acid content in three Spanish olive oil cultivars ranged from 7 to 20%, which closely resemble our results. Linolenic acid (C18:3) is a minor component in olive oil, typically present in amounts below 1.1%. The composition of these fatty is an important attribute which can be used to verify the authenticity of olive oil [13]. The remaining fatty acids, including palmitoleic acid (C16:1), arachidic acid (C20:0), and gadolic acid (C21:0), occur only in relatively trace concentrations.
3.2.2. Sterols Composition
Sterols, otherwise referred to as phytosterols, are the second class of compounds found in olive oil following fatty acids. In fact, the saponifiable fraction primarily consists of fatty acids, constituting more than 98% of the oil’s total weight. In contrast, the unsaponifiable fraction, which includes over 200 chemical compounds from diverse groups, makes up approximately 2% [58]. Sterols are the primary constituents of the unsaponifiable portion in olive oils, and their analysis is crucial for improving nutritional quality and for ensuring the authenticity of VOO. Sterols hold a significant role among the valuable minor components that influence the overall quality of virgin olive oil, as they contribute to its resistance against oxidative aging [58,59,60]. The sterol composition of 45 olive oil samples is presented in Table 3.
Table 3.
Sterols composition (%) of evaluated VOOs. Different letters indicate significant differences at p < 0.05. Within the same column, values followed by the same letter are not significantly different at 5% as a probability level.
Sterol levels in the samples analyzed showed remarkably similar results, as shown in Table 3. Notably, apparent β-sitosterol, as the dominant sterol found in all VOO samples, were distinguished by an overwhelming presence, accounting for over 90% (ranging from 94.2 to 95.7%). The high concentration of apparent β-sitosterol is particularly noteworthy, due to their role in the absorption of dietary cholesterol in the intestines [61], potentially allowing them to suppress obesity-related chronic inflammation. In this regard, olive oil continues to be an abundant source of this beneficial sterol. Campesterol ranked as the second most significant, with levels varying from 3.1 to 4.43%. Stigmasterol, cholesterol, and brassicasterol present extremely low ranges, but are in line with the VOO limits specified in the applicable regulations [29]. The apparent β-sitosterol content in the 11 olive oil samples examined by Demirag et al. [62] varied from 96.07 to 97.18%, surpassing the levels identified in our study. It is important to acknowledge that various studies have highlighted the inherent variations in sterol composition influenced by factors such as fruit ripening stages.
3.3. Correlation Analysis
Via the examination of correlation coefficients, we aimed to identify patterns, dependencies, or trends among the different studied parameters. This analysis contributes to a deeper understanding of the interplay between variables, and may provide valuable insights into the factors influencing olive oil quality, characteristics, and other relevant traits. As detailed in the supplementary results (Figure 4), the correlation matrix reveals moderate positive associations between FFAs and both moisture content (r = 0.48) and K270 (r = 0.84). Furthermore, virgin olive oils show moderate to strong correlations between the quality parameters (FFAs with moisture) and oxidation indexes (PV, DK, K232, and K270). This is emphasized by the positive square appearing in the map matrix. Notably, the fatty acid analysis unveiled significant positive correlations in the three following cases: between oleic acid (C18:1) and monounsaturated fatty acid content (MUFA) (r = 0.99), between linoleic acid (C18:2) and polyunsaturated fatty acids (PUFA) (r = 0.99), as well as between palmitic acid C16:0 and saturated fatty acids (SFA) (r = 0.99). These correlations are reasonable given that each fatty acid mentioned is the most presentative in their corresponding categories, hence they all share similar trends. The individual fatty acid analysis is accompanied by strong positive correlations between (C16:0) and (C16:1) (r = 0.83). The interaction between these two fatty acids has been previously reported by Revelou et al. [63]. On the other hand, negative correlations, mainly between C18:1 and both C18:2 (r = −0.71) and PUFA (r = −0.70), are inversely negatively related. According to [63], the negative association between C18:1 and C18:2 can be explained by the differences in GA biosynthesis kinetics processes and the activity of FA desaturases during olive ripening. In an inverse coupling, oleic acid is converted to linoleic acid, with increasing levels of one FA causing decreases in the others.
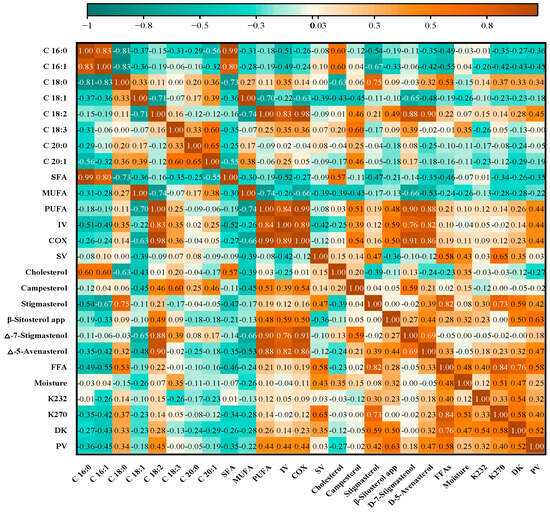
Figure 4.
Heatmap of the matrix between the evaluated olive oil parameters.
Our research outcomes indicate the existence of strong positive correlations between (C18:2) and both Δ-7-Stigmastenol (r = 0.88) and Δ-5-Avenasterol (r = 0.90), as well as between stigmasterol and both (C18:0) (r = 0.75) and “FFAs” (r = 0.82). These results substantiate the notion that these variables tend to move in tandem. Additionally, C18:0 displayed a positive correlation with cholesterol (r = 0.795) and a negative correlation with stigmasterol (r = −0.76).
3.4. Principal Component Analysis
Principal component analysis (PCA) was employed to minimize further dimensionality and improve data visualization (Figure 5 and Figure 6) [64]. This is a common tool used in the olive oil industry to assess the quality of both the raw material and the final product. PCA is extensively employed in olive oil generation for the detection of adulteration and the discrimination between geographical origins, genotypes, ripening stages, etc. [65].

Figure 5.
Principal component Analysis (PCA) for all the parameters; (A): oxidation, and quality indices (FFAs, Moisture, PV, K232, K270) of the evaluated VOOs. (B): Fatty acid composition and sterol composition of the evaluated VOOs.
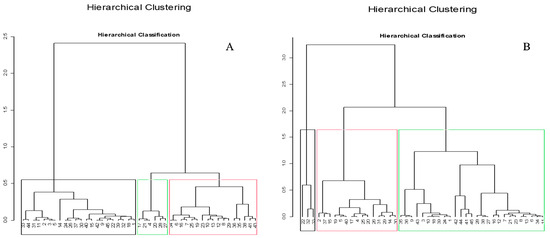
Figure 6.
Hierarchical classification of the evaluated VOOs based on all the parameters; (A): oxidation, and quality indices (FFAs, Moisture, PV, K232, K270) of the evaluated VOOs. (B): Fatty acid composition and sterol composition of the evaluated VOOs. Colored borders distinguish between different classes of evaluated VOOs.
A PCA model was built using the analyzed Oos; to do this, the parameter peak areas of the targeted quality control in the samples were used to construct a data matrix with a dimension of 45 samples × 6 variables with a PCA score plot for the first two PCs of the samples (73.18% of variance explained, Figure 5A). All variables were positively correlated with the PCs, and “FFA” and “ΔK” were the most important factors in PC1, followed by “K232” and “PV”, according to their horizontal vectors. The application of the PCA algorithm and hierarchical classification (Figure 5A and Figure 6A) showed three distinct classes, according to sample areas. Samples colored in blue were distributed in the left area of the graph, containing weaker target parameters than samples on the right (green dot clouds), while variables (red) whose scatterplots were close to the center did not differ significantly from the mean.
Another PCA model was built from the olive oil samples analyzed. In this process, targeted data on fatty acids and sterols were used to create a data matrix with a dimension of 45 samples for 15 variables. This matrix was then subjected to a PCA for the first two principal components (as shown in Figure 5B). PC1 and PC2 effectively distinguished samples according to their composition of the analyzed compounds. In particular, the data indicated that the presence of C18:1 and β-sitosterol appeared to be primarily responsible for the differentiation of almost all samples. The graphical representation reveals that the samples cluster closely in the center, unequivocally demonstrating their moderate similarity and proximity in terms of their fatty acid and sterol profiles. This observation can be attributed to their common geographical origin in the Taroudant region and could also indicate genetic similarities.
In the context of this preliminary exploratory hierarchical classification model (Figure 6B), it was observed that the model effectively differentiated between the three distinct classes. The first class comprises 27 olive oil samples, and the differentiation within this group, based on Figure 5B, can be attributed to specific compounds, namely C16:0, C16:1, C18:3, β-sitosterol, campesterol, and Δ avenasterol. The second class encompasses 15 samples, distinguished by elevated values of the variables C18:0, C18:1, C20:1, and stigmasterol. Conversely, the third class exhibits the lowest values for these parameters [66].
4. Conclusions
As part of the promotion of olive oil from the Taroudant province from southern Morocco, we carried out a comparative study of the various physicochemical parameters of olive oil samples collected in the study area. Defining olive quality is a complex process, involving the consideration of a wide range of characteristics. Interpretations of quality are often determined by the perspective and ultimate objectives of growers, nutritionists, traders, and consumers. The composition of olive oil is a result of a sophisticated interplay between several environmental, agronomic, and technological factors that determine the growth and maturation of the fruit, along with the extraction and storage of the oil. Given the encouraging results of this study, there is a need to intensify efforts to enhance the value of this oil. The scientific implications of such endeavors can play a decisive role in the development of the olive sector.
Author Contributions
J.G.: Conceptualization, Investigation, Data curation, Writing—original draft, Writing—review and editing. A.A.: Data curation, Writing—original draft, Writing—review & editing. O.H.: Writing—original draft, Writing—review and editing. A.L.: Methodology, Writing—original draft, Writing—review and editing. E.H.S.: Supervision, Validation, Writing—review & editing. K.M.: Data curation, Validation, Writing—review and editing. S.G.: Methodology, Resources, Validation, Writing—review and editing, Supervision. All authors have read and agreed to the published version of the manuscript.
Funding
This research received no external funding.
Data Availability Statement
Data are contained within the article.
Acknowledgments
We gratefully acknowledge the invaluable assistance and support provided by all the authors for their valued contributions and support throughout this study. Also, we thank Polydisciplinary Faculty of Taroudant, Ibn Zohr University for their support and assistance in this work.
Conflicts of Interest
The authors declare no conflicts of interest.
References
- Fraga, H.; Moriondo, M.; Leolini, L.; Santos, J.A. Mediterranean Olive Orchards under Climate Change: A Review of Future Impacts and Adaptation Strategies. Agronomy 2021, 11, 56. [Google Scholar] [CrossRef]
- Terral, J.-F.; Bonhomme, V.; Pagnoux, C.; Ivorra, S.; Newton, C.; Paradis, L.; Ater, M.; Kassout, J.; Limier, B.; Bouby, L.; et al. The Shape Diversity of Olive Stones Resulting from Domestication and Diversification Unveils Traits of the Oldest Known 6500-Years-Old Table Olives from Hishuley Carmel Site (Israel). Agronomy 2021, 11, 2187. [Google Scholar] [CrossRef]
- Barazani, O.; Dag, A.; Dunseth, Z. The History of Olive Cultivation in the Southern Levant. Front. Plant Sci. 2023, 14, 1131557. [Google Scholar] [CrossRef]
- IOC World Production of Olive Oil. International Olive Council, Madrid. Available online: https://www.internationaloliveoil.org/the-world-of-olive-oil/ (accessed on 28 February 2022).
- Caracciolo, M. Shelf Life of Bakery Products Made with Monocultival Extra Virgin Olive Oil from Calabria (South Italy): Lipid Matrix Oxidation. Ph.D. Thesis, Università degli studi della Tuscia-Viterbo, Viterbo, Italy, 2020. [Google Scholar]
- García Martín, J.F. Potential of Near-Infrared Spectroscopy for the Determination of Olive Oil Quality. Sensors 2022, 22, 2831. [Google Scholar] [CrossRef] [PubMed]
- Plasquy, E.; García Martos, J.M.; Florido, M.C.; Sola-Guirado, R.R.; García Martín, J.F. Cold Storage and Temperature Management of Olive Fruit: The Impact on Fruit Physiology and Olive Oil Quality—A Review. Processes 2021, 9, 1543. [Google Scholar] [CrossRef]
- Grossi, M.; Palagano, R.; Bendini, A.; Riccò, B.; Servili, M.; García-González, D.L.; Gallina Toschi, T. Design and In-House Validation of a Portable System for the Determination of Free Acidity in Virgin Olive Oil. Food Control. 2019, 104, 208–216. [Google Scholar] [CrossRef]
- Sanmartin, C.; Venturi, F.; Sgherri, C.; Nari, A.; Macaluso, M.; Flamini, G.; Quartacci, M.F.; Taglieri, I.; Andrich, G.; Zinnai, A. The Effects of Packaging and Storage Temperature on the Shelf-Life of Extra Virgin Olive Oil. Heliyon 2018, 4, e00888. [Google Scholar] [CrossRef] [PubMed]
- Genovese, A.; Caporaso, N.; Sacchi, R. Flavor Chemistry of Virgin Olive Oil: An Overview. Appl. Sci. 2021, 11, 1639. [Google Scholar] [CrossRef]
- Mousavi, S.; Stanzione, V.; Mariotti, R.; Mastio, V.; Azariadis, A.; Passeri, V.; Valeri, M.C.; Baldoni, L.; Bufacchi, M. Bioactive Compound Profiling of Olive Fruit: The Contribution of Genotype. Antioxidants 2022, 11, 672. [Google Scholar] [CrossRef]
- Di Giovacchino, L.; Sestili, S.; Di Vincenzo, D. Influence of Olive Processing on Virgin Olive Oil Quality. Eur. J. Lipid Sci. Technol. 2002, 104, 587–601. [Google Scholar] [CrossRef]
- Gagour, J.; Oubannin, S.; Bouzid, H.A.; Bijla, L.; Moudden, H.E.; Sakar, E.H.; Koubachi, J.; Laknifli, A.; Gharby, S. Physicochemical Characterization, Kinetic Parameters, Shelf Life and Its Prediction Models of Virgin Olive Oil from Two Cultivars (“Arbequina” and “Moroccan Picholine”) Grown in Morocco. OCL 2022, 29, 39. [Google Scholar] [CrossRef]
- Sánchez-Lozano, D.; Escámez, A.; Aguado, R.; Oulbi, S.; Hadria, R.; Vera, D. Techno-Economic Assessment of an Off-Grid Biomass Gasification CHP Plant for an Olive Oil Mill in the Region of Marrakech-Safi, Morocco. Appl. Sci. 2023, 13, 5965. [Google Scholar] [CrossRef]
- Bouknana, D.; Serghini Caid, H.; Hammouti, B.; Rmili, R.; Hamdani, I. Diagnostic Study of the Olive Oil Industry in the Eastern Region of Morocco. Mater. Today Proc. 2021, 45, 7782–7788. [Google Scholar] [CrossRef]
- Intelligenia, S. OLIVAE 125: Morocco. Available online: https://www.internationaloliveoil.org/1430-olivae-125-morocco/ (accessed on 27 October 2023).
- El Yamani, M.; Sakar, E.H.; Boussakouran, A.; Ghabbour, N.; Rharrabti, Y. Physicochemical and Microbiological Characterization of Olive Mill Wastewater (OMW) from Different Regions of Northern Morocco. Environ. Technol. 2020, 41, 3081–3093. [Google Scholar] [CrossRef]
- Rahimi, A.; Khalil, Z.; Bouasria, A.; Mjiri, I.E.; Bounif, M. Land Surface Temperature Responses to Land Use Land Cover Dynamics (District of Taroudant, Morocco). Biol. Life Sci. Forum 2021, 3, 28. [Google Scholar] [CrossRef]
- ISO 660:2020; Animal and Vegetable Fats and Oils—Determination of Acid Value and Acidity. ISO: Geneva, Switzerland, 2020. Available online: https://www.iso.org/cms/render/live/en/sites/isoorg/contents/data/standard/07/55/75594.html (accessed on 7 October 2022).
- ISO 3960:2017; Animal and Vegetable Fats and Oils—Determination of Peroxide Value—Iodometric (Visual) Endpoint Determination. ISO: Geneva, Switzerland, 2017. Available online: https://www.iso.org/cms/render/live/en/sites/isoorg/contents/data/standard/07/12/71268.html (accessed on 7 October 2022).
- ISO 3656:2011; Animal and Vegetable Fats and Oils—Determination of Ultraviolet Absorbance Expressed as Specific UV Extinction. ISO: Geneva, Switzerland, 2011. Available online: https://www.iso.org/standard/51008.html (accessed on 16 February 2023).
- ISO 662:2016; Animal and Vegetable Fats and Oils—Determination of Moisture and Volatile Matter Content. ISO: Geneva, Switzerland, 2016. Available online: https://www.iso.org/standard/69592.html (accessed on 9 November 2023).
- ISO 12966-2:2017; Animal and Vegetable Fats and Oils—Gas Chromatography of Fatty Acid Methyl Esters—Part 2: Preparation of Methyl Esters of Fatty Acids. ISO: Geneva, Switzerland, 2017. Available online: https://www.iso.org/cms/render/live/en/sites/isoorg/contents/data/standard/07/21/72142.html (accessed on 7 October 2022).
- Oubannin, S.; Asbbane, A.; Bijla, L.; Ait Bouzid, H.; Gagour, G.; Hallouch, O.; Sakar, E.H.; Gharby, S. Co-Processed [Argania Spinosa L. (Skeels)] Oil with Thyme (Thymus Vulgaris L.) Leaves—New Product Optimization. Food Chem. Adv. 2023, 3, 100474. [Google Scholar] [CrossRef]
- Abril, D.; Mirabal-Gallardo, Y.; González, A.; Marican, A.; Durán-Lara, E.F.; Silva Santos, L.; Valdés, O. Comparison of the Oxidative Stability and Antioxidant Activity of Extra-Virgin Olive Oil and Oils Extracted from Seeds of Colliguaya Integerrima and Cynara Cardunculus under Normal Conditions and After Thermal Treatment. Antioxidants 2019, 8, 470. [Google Scholar] [CrossRef]
- Aissa, R.; Asbbane, A.; Oubannin, S.; Bijla, L.; Bousaid, Z.; Hallouch, O.; El Harkaoui, S.; Matthäus, B.; Sakar, E.H.; Gharby, S. Oxidative Stability of Virgin and Refined Argan [Argania spinosa L. (Skeels)] Oil under Accelerated Aging Conditions and Shelf-Life Prediction at Room Temperature: A Comparative Study. Analytica 2023, 4, 500–512. [Google Scholar] [CrossRef]
- ISO 12228-1:2014; Determination of Individual and Total Sterols Contents—Gas Chromatographic Method—Part 1: Animal and Vegetable Fats and Oils. ISO: Geneva, Switzerland, 2014. Available online: https://www.iso.org/obp/ui/#iso:std:iso:12228:-1:ed-1:v2:en (accessed on 4 March 2022).
- Oubannin, S.; Asbbane, A.; Elhaidag, F.; Bijla, L.; Gagour, J.; Ait bouzid, H.; El Harkaoui, S.; Sakar, E.H.; Matthäus, B.; Gharby, S. Enrichment of Argan [Argania spinosa (L.) Skeels] Oil with Saffron (Crocus sativus L.) Stigma Powder and Induced Changes in Oil Quality Attributes. J. Food Process. Preserv. 2023, 2023, 8895851. [Google Scholar] [CrossRef]
- IOC Trade Standard Applying to Olive Oils and Olive-Pomace Oils. Available online: https://www.internationaloliveoil.org/what-we-do/chemistry-standardisation-unit/standards-and-methods/ (accessed on 9 November 2023).
- Martins, S.; Silva, E.; Brito, C.; Pinto, L.; Martins-Gomes, C.; Gonçalves, A.; Arrobas, M.; Rodrigues, M.Â.; Correia, C.M.; Nunes, F.M. Combining Zeolites with Early-Maturing Annual Legume Cover Crops in Rainfed Orchards: Effects on Yield, Fatty Acid Composition and Polyphenolic Profile of Olives and Olive Oil. Molecules 2023, 28, 2545. [Google Scholar] [CrossRef]
- Giuffre, A.M. The Evolution of Free Acidity and Oxidation Related Parameters in Olive Oil during Olive Ripening from Cultivars Grown in the Region of Calabria, South Italy. Emir. J. Food Agric. 2018, 30, 539–548. [Google Scholar] [CrossRef]
- Mafrica, R.; Piscopo, A.; De Bruno, A.; Poiana, M. Effects of Climate on Fruit Growth and Development on Olive Oil Quality in Cultivar Carolea. Agriculture 2021, 11, 147. [Google Scholar] [CrossRef]
- Mourhat, Z.; Hirri, A.; Maaouni, M.; Benlamaalam, S.; Chigr, M.; Echajia, M.; Rabi, S.; Mbarki, M. Characterization and Discrimination of Three Moroccan Cultivars of Virgin Olive Oil (“Picholine”,”Menara” and “Hawziya”). J. Mater. Environ. Sci. 2018, 9, 466–473. [Google Scholar] [CrossRef]
- Bustan, A.; Kerem, Z.; Yermiyahu, U.; Ben-Gal, A.; Lichter, A.; Droby, S.; Zchori-Fein, E.; Orbach, D.; Zipori, I.; Dag, A. Preharvest Circumstances Leading to Elevated Oil Acidity in ‘Barnea’ Olives. Sci. Hortic. 2014, 176, 11–21. [Google Scholar] [CrossRef]
- Mele, M.A.; Islam, M.Z.; Kang, H.-M.; Giuffrè, A.M. Pre-and Post-Harvest Factors and Their Impact on Oil Composition and Quality of Olive Fruit. Emir. J. Food Agric. 2018, 30, 592–603. [Google Scholar] [CrossRef]
- Sakar, E.H.; Khtira, A.; Aalam, Z.; Zeroual, A.; Gagour, J.; Gharby, S. Variations in Physicochemical Characteristics of Olive Oil (Cv ‘Moroccan Picholine’) According to Extraction Technology as Revealed by Multivariate Analysis. AgriEngineering 2022, 4, 922–938. [Google Scholar] [CrossRef]
- Theodosi, S.; Kosma, I.S.; Badeka, A.V. Quality Characteristics of Koroneiki Olive Oil from Zakynthos Island (Greece) and Differentiation Depending on the Altitude Level. Eur. Food Res. Technol. 2021, 247, 1235–1248. [Google Scholar] [CrossRef]
- Piscopo, A.; Mafrica, R.; De Bruno, A.; Romeo, R.; Santacaterina, S.; Poiana, M. Characterization of Olive Oils Obtained from Minor Accessions in Calabria (Southern Italy). Foods 2021, 10, 305. [Google Scholar] [CrossRef] [PubMed]
- Fadda, A.; Sanna, D.; Sakar, E.H.; Gharby, S.; Mulas, M.; Medda, S.; Yesilcubuk, N.S.; Karaca, A.C.; Gozukirmizi, C.K.; Lucarini, M.; et al. Innovative and Sustainable Technologies to Enhance the Oxidative Stability of Vegetable Oils. Sustainability 2022, 14, 849. [Google Scholar] [CrossRef]
- Willenberg, I.; Matthäus, B.; Gertz, C. A New Statistical Approach to Describe the Quality of Extra Virgin Olive Oils Using Near Infrared Spectroscopy (NIR) and Traditional Analytical Parameters. Eur. J. Lipid Sci. Technol. 2019, 121, 1800361. [Google Scholar] [CrossRef]
- Ioannou, E.T.; Gliatis, K.S.; Zoidis, E.; Georgiou, C.A. Olive Oil Benefits from Sesame Oil Blending While Extra Virgin Olive Oil Resists Oxidation during Deep Frying. Molecules 2023, 28, 4290. [Google Scholar] [CrossRef] [PubMed]
- Ayyad, Z.; Alsioury, W.; Barghouthi, Z.; Qadah, D.; Qurie, M. Effects of Different Filtration and Clarification Techniques on Palestinian Virgin Olive Oil Chemical and Microbial Quality. J. Med. Chem. Sci. 2023, 6, 2699–2706. [Google Scholar] [CrossRef]
- Harkaoui, S.E.; Gharby, S.; Kartah, B.; Monfalouti, H.E.; El-sayed, M.E.; Abdin, M.; Salama, M.A.; Charrouf, Z.; Matthäus, B. Lipid Profile, Volatile Compounds and Oxidative Stability during the Storage of Moroccan Opuntia Ficus-Indica Seed Oil. Grasas Aceites 2023, 74, e486. [Google Scholar] [CrossRef]
- Zielińska, A.; Wójcicki, K.; Klensporf-Pawlik, D.; Dias-Ferreira, J.; Lucarini, M.; Durazzo, A.; Lucariello, G.; Capasso, R.; Santini, A.; Souto, E.B.; et al. Chemical and Physical Properties of Meadowfoam Seed Oil and Extra Virgin Olive Oil: Focus on Vibrational Spectroscopy. J. Spectrosc. 2020, 2020, e8870170. [Google Scholar] [CrossRef]
- El Moudden, H.; El Idrissi, Y.; El Guezzane, C.; Belmaghraoui, W.; El Yadini, A.; Harhar, H.; Tabyaoui, M. Tradition Mills’ Picholine Olive Oil Physicochemical Characterization and Chemical Profiling across Different Cities in Morocco. Sci. World J. 2020, 2020, e1804723. [Google Scholar] [CrossRef] [PubMed]
- Ghreishi Rad, S.A.; Jalili, M.; Ansari, F.; Rashidi Nodeh, H.; Rashidi, L. Maturity Impact on Physicochemical Composition and Polyphenol Properties of Extra Virgin Olive Oils Obtained from Manzanilla, Arbequina, and Koroneiki Varieties in Iran. Food Sci. Nutr. 2023, 11, 5396–5408. [Google Scholar] [CrossRef]
- Konuskan, D.B.; Arslan, M.; Oksuz, A. Physicochemical Properties of Cold Pressed Sunflower, Peanut, Rapeseed, Mustard and Olive Oils Grown in the Eastern Mediterranean Region. Saudi J. Biol. Sci. 2019, 26, 340–344. [Google Scholar] [CrossRef]
- Lu, Y.; Zhao, J.; Xin, Q.; Yuan, R.; Miao, Y.; Yang, M.; Mo, H.; Chen, K.; Cong, W. Protective Effects of Oleic Acid and Polyphenols in Extra Virgin Olive Oil on Cardiovascular Diseases. Food Sci. Hum. Wellness 2024, 13, 529–540. [Google Scholar] [CrossRef]
- Mnasri, S.R.; Debbabi, O.S.; Amar, F.B.; Dellino, M.; Montemurro, C.; Miazzi, M.M. Exploring the Quality and Nutritional Profiles of Monovarietal Oils from Millennial Olive Trees in Tunisia. Eur. Food Res. Technol. 2023, 249, 2807–2820. [Google Scholar] [CrossRef]
- El Riachy, M.; Moubarak, P.; Al Hawi, G.; Geha, M.; Mushantaf, W.; Estephan, N.; Skaff, W. Fatty Acid and Phenolic Profiles of Virgin Olive Oils from Local and European Varieties Planted in Lebanon. Plants 2023, 12, 2681. [Google Scholar] [CrossRef]
- El Qarnifa, S.; El Antari, A.; Hafidi, A. Effect of Maturity and Environmental Conditions on Chemical Composition of Olive Oils of Introduced Cultivars in Morocco. J. Food Qual. 2019, 2019, e1854539. [Google Scholar] [CrossRef]
- Xiang, C.; Xu, Z.; Liu, J.; Li, T.; Yang, Z.; Ding, C. Quality, Composition, and Antioxidant Activity of Virgin Olive Oil from Introduced Varieties at Liangshan. LWT 2017, 78, 226–234. [Google Scholar] [CrossRef]
- Korkmaz, A. Characterization and Comparison of Extra Virgin Olive Oils of Turkish Olive Cultivars. Molecules 2023, 28, 1483. [Google Scholar] [CrossRef]
- Manai-Djebali, H.; Krichène, D.; Ouni, Y.; Gallardo, L.; Sánchez, J.; Osorio, E.; Daoud, D.; Guido, F.; Zarrouk, M. Chemical Profiles of Five Minor Olive Oil Varieties Grown in Central Tunisia. J. Food Compos. Anal. 2012, 27, 109–119. [Google Scholar] [CrossRef]
- Gharby, S.; Guillaume, D.; Nounah, I.; Harhar, H.; Hajib, A.; Matthäus, B.; Charrouf, Z. Shelf-Life of Moroccan Prickly Pear (Opuntia ficus-Indica) and Argan (Argania spinosa) Oils: A Comparative Study. Grasas Aceites 2021, 72, e397. [Google Scholar] [CrossRef]
- Zago, L.; Squeo, G.; Bertoncini, E.I.; Difonzo, G.; Caponio, F. Chemical and Sensory Characterization of Brazilian Virgin Olive Oils. Food Res. Int. 2019, 126, 108588. [Google Scholar] [CrossRef] [PubMed]
- García-Garví, J.M.; Noguera-Artiaga, L.; Hernández, F.; Pérez-López, A.J.; Burgos-Hernández, A.; Carbonell-Barrachina, Á.A. Quality of Olive Oil Obtained by Regulated Deficit Irrigation. Horticulturae 2023, 9, 557. [Google Scholar] [CrossRef]
- Lukić, M.; Lukić, I.; Moslavac, T. Sterols and Triterpene Diols in Virgin Olive Oil: A Comprehensive Review on Their Properties and Significance, with a Special Emphasis on the Influence of Variety and Ripening Degree. Horticulturae 2021, 7, 493. [Google Scholar] [CrossRef]
- Gunduz, G.; Konuskan, D.B. Fatty Acid and Sterol Compositions of Turkish Monovarietal Olive Oils with Regard to Olive Ripening. J. Oleo Sci. 2023, 72, 79–85. [Google Scholar] [CrossRef] [PubMed]
- Kyçyk, O.; Aguilera, M.P.; Gaforio, J.J.; Jiménez, A.; Beltrán, G. Sterol Composition of Virgin Olive Oil of Forty-Three Olive Cultivars from the World Collection Olive Germplasm Bank of Cordoba. J. Sci. Food Agric. 2016, 96, 4143–4150. [Google Scholar] [CrossRef]
- Li, X.; Xin, Y.; Mo, Y.; Marozik, P.; He, T.; Guo, H. The Bioavailability and Biological Activities of Phytosterols as Modulators of Cholesterol Metabolism. Molecules 2022, 27, 523. [Google Scholar] [CrossRef] [PubMed]
- Demirag, O.; Konuskan, D.B. Quality Properties, Fatty Acid and Sterol Compositions of East Mediterranean Region Olive Oils. J. Oleo Sci. 2021, 70, 51–58. [Google Scholar] [CrossRef] [PubMed]
- Revelou, P.-K.; Xagoraris, M.; Alexandropoulou, A.; Kanakis, C.D.; Papadopoulos, G.K.; Pappas, C.S.; Tarantilis, P.A. Chemometric Study of Fatty Acid Composition of Virgin Olive Oil from Four Widespread Greek Cultivars. Molecules 2021, 26, 4151. [Google Scholar] [CrossRef] [PubMed]
- Hasan, B.M.S.; Abdulazeez, A.M. A Review of Principal Component Analysis Algorithm for Dimensionality Reduction. J. Soft Comput. Data Min. 2021, 2, 20–30. [Google Scholar]
- Crizel, R.L.; Hoffmann, J.F.; Zandoná, G.P.; Lobo, P.M.S.; Jorge, R.O.; Chaves, F.C. Characterization of Extra Virgin Olive Oil from Southern Brazil. Eur. J. Lipid Sci. Technol. 2020, 122, 1900347. [Google Scholar] [CrossRef]
- Farrés-Cebrián, M.; Seró, R.; Saurina, J.; Núñez, O. HPLC-UV Polyphenolic Profiles in the Classification of Olive Oils and Other Vegetable Oils via Principal Component Analysis. Separations 2016, 3, 33. [Google Scholar] [CrossRef]
Disclaimer/Publisher’s Note: The statements, opinions and data contained in all publications are solely those of the individual author(s) and contributor(s) and not of MDPI and/or the editor(s). MDPI and/or the editor(s) disclaim responsibility for any injury to people or property resulting from any ideas, methods, instructions or products referred to in the content. |
© 2024 by the authors. Licensee MDPI, Basel, Switzerland. This article is an open access article distributed under the terms and conditions of the Creative Commons Attribution (CC BY) license (https://creativecommons.org/licenses/by/4.0/).