Abstract
In recent years, indiscriminate consumption and dumping of antibiotics have become destructive to human health and causes ecotoxicological pollution. Here, the irregular particle nanosized dendrite structure of lanthanum-doped cerium oxide (LCO) decorated with sheet-like reduced graphene oxide (RGO) composite was utilized to detect the sulfonamide-based drug sulfadiazine (SZ). LCO@RGO nanocomposite was prepared using the hydrothermal method, the synergistic effect between LCO and RGO facilitates electron transferability and conductivity which enhances the electrochemical properties toward the detection of SZ. The detection of SZ expressed a lower detection limit (0.005 µM) and linear range (0.01–265 µM) of the fabricated LCO@RGO/GCE electrode toward SZ, analyzed using the highly sensitive DPV technique. Also, DPV was utilized to determined shows good repeatability, reproducibility, and storage stability of fabricated LCO@RGO/GCE. Moreover, effective practicability was proven in human blood serum and river water samples with great recovery results. All the above probes the synthesized LCO@RGO’s thriving and outstanding electrocatalytic performance of this nanocomposite’s highly sensitive detection of SZ in real biological and environmental samples.
1. Introduction
Antibiotics are commonly used as antibacterial agents and also in the treatment of infectious diseases. Inappropriate usage of antibiotics develops serious health disorders in humans, including organ toxicity and hearing loss, as well as ecotoxicological pollution [1]. In recent years, sulfonamide-based drugs have been widely consumed in the pharmaceutical fields. Sulfadiazine (SZ), a 4-amino-N-pyrimidine-2yl-benzenesulfonamide antibiotic drug, is a sulfonamide used for the treatment of infectious diseases in animals and humans, such as chancroid infection, leg ulcers, skin wounds, and infections, and also for the prevention of bacterial infections, including toxoplasmosis, urinary tract infections, and malaria [2,3]. The United States Food and Drug Administration approved an efficient amount of SZ antibiotic to treat infectious diseases because of the interfering mechanism of folic acid metabolism for its growth; it can be used in animals and aquaculture. European Union regulation has set a limit of 100 μg kg−1 for sulfonamides in animal-origin foodstuffs to ensure the safety of animal products and to protect people from health risks [4]. Indiscriminate consumption of SZ may cause liver damage, gene damage, and immunity disorders [5]. Furthermore, SZ also spoils the water and soil through animal excrement in the form of the parent drug, resulting in hazards to the ecosystem [6]. To solve this environmental problem, it is necessary to (i) detect the concentration of SZ and (ii) remove it from the environmental ecosystem using advanced technology [5]. SZ can be detected through various analytical methods, such as capillary electrophoresis [4,7], diode array [8], UV–Vis spectroscopy [9], liquid/gas chromatography [10], immunochromatographic assay (ICT) [11], surface-enhanced Raman scattering (SERS) [12], fluorescence spectroscopy detection [2], and biometric enzyme-linked immunosorbent assay (ELISA) [2]. These analytical methods are highly selective, but they are limited because of their high cost, sample preparation, and the requirements of the analytic instrument [6,9]. Photoelectrochemical and electrochemical sensor methods have advantages over the others because of their low cost-effectiveness, simple preparation, rapid detection, broad signal range, great selectivity, and outstanding sensitivity [5] for detecting SZ, which is most important for ecotoxicological pollution. Fabricated electrodes were examined toward SZ; the redox characteristic peak current generates highly sensitive ions and can be determined by cyclic voltammetry (CV) and differential pulse voltammetry (DPV) [5,13,14,15].
Rare earth metal oxides (REMO) have created novelty over the last few years because of their optical and electronic properties, high densities, extreme melting points, great electrochemical conductivities, solid state features, and individual physical/chemical possessions due to their 4f orbital electrons and wide range of different behavior [16,17]; thus, they are applicable in the electronics and biomedical sectors [18,19]. The rare earth metal lanthanum (La) enlarges the active sites, thus expressively enriching catalyst activity to prevent rapid deactivation. CeO is an important material used for many applications, such as catalytic applications, three-way catalysts (TWC) used for gas treatment in vehicles, water gas shift reactions [20], and soot oxidation [21,22]. CeO as a catalyst is very effective and is also associated with high oxygen storage capacity. This means that it has the ability to absorb or eliminate oxygen toward oxidation or reduction conditions, and it is also associated with the formation of O vacancies in CeO [21]. The oxygen anion conductivity of CeO is very poor, so doping various elements results in an improvement in conductivity. The addition of REMO can increase stability and reduce the stresses in the crystal structure [23]. Vacancy of oxygen present in CeO, and the Ce4+ to Ce3+ reduction process occurs because doping of La can destroy the crystal structure and optical and vibrational properties and may develop electrical chemical properties [24]. Doping with the rare earth metal (REM) La in metal oxides increases electrochemical catalysis activity and storage stability performance [25]. This is because of their lattice disorder phase, great oxygen ion mobility, and higher amount of surface oxygen defect, so they facilitate the generation of surface active sites [26].
Graphene-based materials are used as electrical devices, for energy storage and conversion, as sensors, and as composites because of their outstanding electrical conductivity, high specific surface area, and high chemical/thermal properties. Mostly, graphene-based materials have great conductivity, so they increase the sensitivity of electrochemical systems [27]. LCO@RGO fabricated electrodes thrive with excellent electrocatalytic performance due to their large surface area, high conductivity, and biocompatibility [28,29,30,31].
In this present work, a hydrothermally synthesized La-doped CeO@RGO (LCO@RGO) composite was prepared successfully. Later, to determine the physical characteristics of the composite, its crystalline nature, surface morphology, and vibrational spectroscopy were investigated. Hence, LCO@RGO was used as an electrode material for the ultrasensitive detection of SZ. LCO@RGO exhibits a wide linear range, low detection limit, selectivity, and reproducibility.
2. Experimental Methodology
2.1. Chemicals and Reagents
A list of chemicals and instruments is detailed in the Supplementary Information (SI).
2.2. Synthesis of LCO@RGO
Reduced graphene oxide (RGO) was prepared from graphite using Hummer’s method, as reported previously [32]. Initially, the typical procedure of LCO@RGO follows a 1:1 ratio of (NH4)2 [Ce(NO3)6] and LaCl3.6 H2O were dissolved in 30 ml of DI water separately. Both were mixed under vigorous stirring for 30 min. The surfactant polyethylene glycol was added dropwise to the above solution. The entire homogeneous solution mixture was transferred into a Teflon-lined autoclave and heated at 180 °C for 10 h. The obtained precipitate was washed several times with DI water and ethanol, and the precipitate was allowed to dry in an oven at 50 °C for 24 h. The overall synthesis process is explained in Scheme 1.
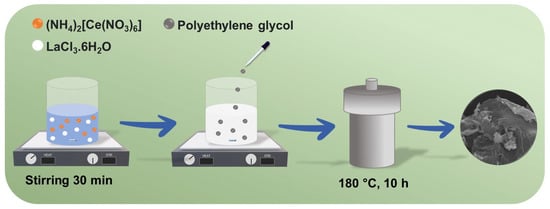
Scheme 1.
Illustration of synthesis procedure of LCO@RGO.
3. Results and Discussion
3.1. Crystalline Nature and Vibrational Spectroscopy Investigation
XRD was used to determine the crystalline nature of synthesized LCO and LCO@RGO. Figure 1A shows the 2θ value at 27.7°, which corresponds to the (100) plane matched with the reference code (03-065-1871) of La. The planes at (21-2), (12-4), (21-5), (006), (42-4), (217), (14-6), and (21-8) correspond to the 2θ value of 32.1°, 46.0°, 54.5°, 57.2°, 67.0°, 73.9°, 76.2°, and 85.0°, respectively; this revealed that CeO exactly matches with the JCPDS card (01-071-0567). A hump at approximately 24.3° angle ascribed to the (002) planes denotes the sheet-like RGO. Then, the obtained data proving that there were no impurity peaks were observed, and finally, all characteristic peaks of LCO@RGO peaks arrived. Thus, it delivers an effective combination of the composite.
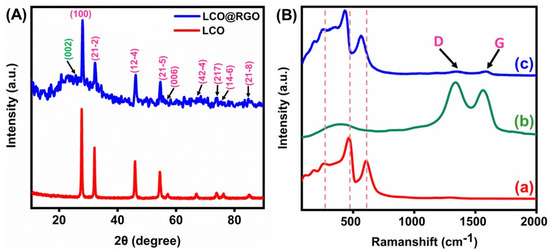
Figure 1.
(A) XRD pattern of LCO and LCO@RGO; (B) Raman vibration of (a) LCO, (b) RGO, (c) LCO@RGO.
The exploration of Raman spectroscopy is very sensitive for determining metal–oxide molecular interactions and chemical structures. Figure 1B(a) reveals the La vibration peaks aimed at 116 cm−1 and 179 cm−1; this was found due to the hexagonal crystalline nature of La. The vibration band of Ce was at 435 cm−1 because of the F2g mode of rhombohedral crystallinity [26]. Figure 1B(b) shows the RGO peak; two obvious D and G vibration bands are observed, respectively: 1338 cm−1 is the phonon of A1g symmetry, and 1579 cm−1 is the phonon mode of E2g symmetry of first-order scattering. The intensity ratio of the D and G bands is equal to 1.03; this value is close to 1, which represents the sp2 orbitals retaining the graphitic domains in the RGO sample [33]. Figure 1B(c) displays the different Raman vibration modes of La and Ce, and it is observed that the vibration mode of La is a weaker vibration, so this conforms to the simple mixture of pure oxides. On the other hand, in detail, the 430 cm−1 vibration peak is due to the F2g mode of the disordered defective fluorite structure (rhombohedral) in Ce, and the surface oxygen band vibration peak is at 563 cm−1. The vibration peak at 256 cm−1 indicates the sublattice oxygen ion in the disordered fluorite structure. Thus, the obtained data for the RGO peak along with the synthesized LCO confirmed the successful formation of the composite [24,26].
3.2. Morphological Identification
Figure 2A,B depict the hydrothermally synthesized LCO, which shows irregular particles. Figure 2C describes an RGO sheet-like structure. In Figure 2D,E LCO gets deposited in the RGO sheets, which provides conductivity and also enhances the electrochemical properties. Moreover, elemental mapping distribution confirms the elements in LCO@RGO. Figure 2F–K mapping clearly show that the synthesized composite contains elements such as La, Ce, O, and C distributed equally at LCO@RGO.
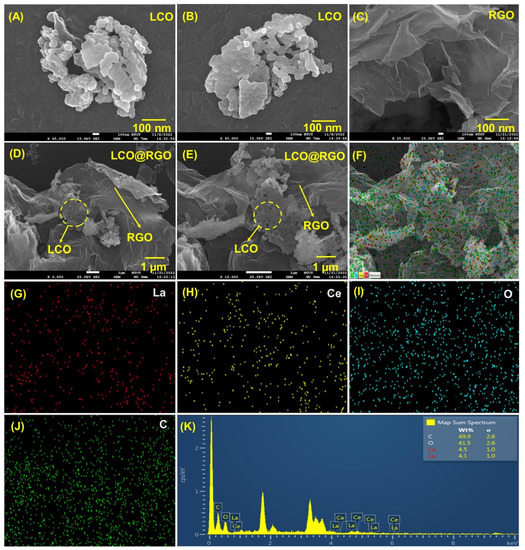
Figure 2.
(A,B) SEM image of LCO; (C) RGO sheet; (D,E) LCO@RGO; (F–J) elemental mapping; and (K) EDX spectra of LCO@RGO.
The synthesized LCO@RGO structure was further confirmed using the HR-TEM technique. The different magnification structure of LCO is displayed in Figure 3A–C. This HR-TEM image of irregular particles was well matched with the SEM image. Figure 3D–G displays the different magnification images of the LCO@RGO. This image clearly shows that the LCO particles are deposited on the RGO sheets, so it provides conductivity and also enhances the electrochemical properties confirmed by the TEM image. In Figure 3H, the TEM image of LCO@RGO with 0.331 nm interplanar spacing is shown. Figure 3I shows the SAED pattern image of a composite dark spot were well matched with the XRD lattice planes of (102), (021), (110), and (101) planes.
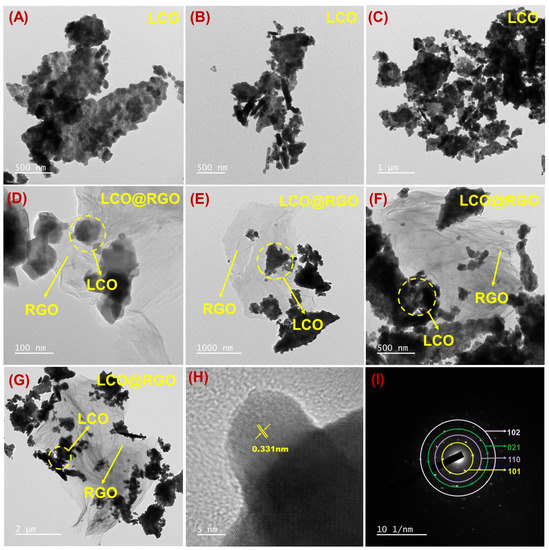
Figure 3.
(A–C) TEM image of LCO; (D–G) LCO@RGO; (H) interplanar spacing of LCO@RGO; (I) SAED dark spot image of LCO@RGO.
3.3. Electrochemical Characterization of LCO@RGO
Electrochemical impedance spectroscopy (EIS) was used to determine the interface resistance of various fabricated electrodes and their electron transfer properties. Therefore, bare GCE and other fabricated electrodes, RGO/GCE, LCO/GCE, and LCO@RGO/GCE, were investigated using the EIS technique. In this study, 0.1 M of KCl in combination with 5 mM [Fe (CN)6]3−/4− (FC) was used as an electrolyte. In Figure 4A, the plot specifies that LCO@RGO/GCE has greater electron transferability compared to the other modified and unmodified electrodes. The Rct value of LCO@RGO/GCE (257.2 Ώ) is lower than the values for LCO/GCE, RGO/GCE, and bare GCE (298, 438.6, and 817.4 Ώ, respectively) because of the amalgamation of LCO and RGO, which increases electron transferability; furthermore, the synergetic effects of LCO and RGO increases the electrochemical performance of LCO@RGO. As a result, LCO@RGO/GCE has a lower Rct and higher electron transferability, so this material is suitable for electrochemical analysis toward SZ detection.
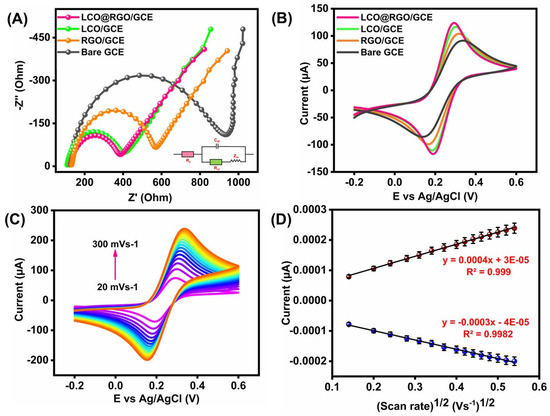
Figure 4.
(A) Nyquist plot of bare GCE, RGO/GCE, LCO/GCE, LCO@RGO/GCE; (B) CV redox current response of bare GCE, RGO/GCE, LCO/GCE, LCO@RGO/GCE; (C) scan rate current response of LCO@RGO/GCE at 20–300 mVs−1; (D) linear plot of current response vs scan rate.
The cyclic voltammetry (CV) electrochemical performance of modified LCO/GCE, RGO/GCE, LCO@RGO/GCE, and unmodified bare GCE was analyzed in 0.1 M KCl combination of (FC) redox system. Figure 4B, showing the CV response of different modified and unmodified electrodes. The determined LCO@RGO/GCE value shows a higher current than the unfabricated bare GCE and the other fabricated electrodes LCO/GCE and RGO/GCE. Upon them, LCO@RGO/GCE has a superior redox peak current (Ip) evaluated compared to the other modified electrodes because the synthesized composite has a suitable electrode–electrolyte interface accumulation of ions or charge, so it facilitates fast electron transferability.
The FC redox system also investigates the effect of scan rate and is used to evaluate the surface area of the unmodified electrode and also the modified electrodes. Upon this, the electrochemical kinetic reaction scan rate starts from 20 to 300 mVs−1, as shown in Figure 4C. On increasing the scan rate, the anodic and cathodic peak currents increase gradually with good linearity. Figure 4D proves that the square root of the scan rate is proportional to the redox peak current (Ip). The Randles–Sevcik equation was used to determine the surface area of the all-modified electrodes.
Ip = 2.69 × 10⁵ n3/2 AD1/2 Cv1/2
The electrochemically active surface areas (EASA) of bare GCE, LCO/GCE, RGO/GCE, and LCO@RGO/GCE are 0.73, 085, 0.117, and 0.156 cm2, respectively. When comparing the EASA values of all-modified and unmodified electrodes, LCO@RGO/GCE dominates the higher peak current because of its electrochemical activity.
Figure S1A depicts the CV analysis of different loading concentrations (2–8 µL) of LCO/RGO coated on GCE in 0.1 M PBS (pH = 7.0) with a constant scan rate of 50 mVs−1. From the results, the 6 µL loading concentration shows a higher current than the bare GCE and the other modified electrodes. As from the above result, 6 µL was chosen as the loading quantity for the detection of SZ. Figure S1B shows a bar diagram of different loading concentrations vs current response.
The electrochemical activities of bare GCE and the other modified electrodes were examined in 0.1 M PBS contains 100 µM of SZ. Figure 5A displays the CV current response for bare GCE and fabricated LCO/GCE, RGO/GCE, and LCO@RGO/GCE. The fabricated RGO/GCE electrode shows a lower oxidation peak current toward SZ because the transferability of an electron is low. LCO/GCE displays an increase in the anodic oxidation peak current and also a slight potential shift toward the positive side. LCO@RGO-modified GCE delivers a higher oxidation peak current, which is due to the higher surface area, low resistance, high sensitivity, and high catalytic activity on SZ. Figure 5B shows the corresponding bar diagram for the anodic current response of SZ vs the various modified electrodes.
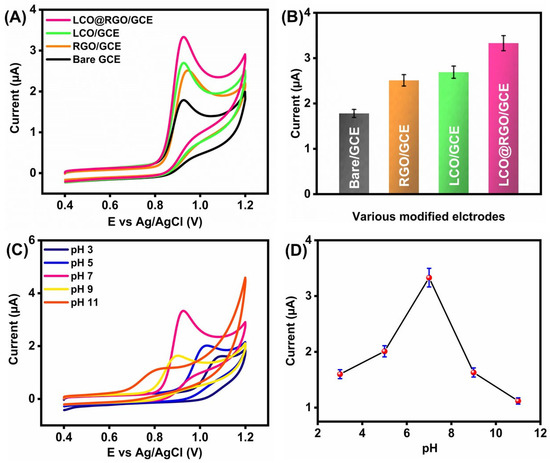
Figure 5.
(A) CV response of different modified electrodes in 100 µM of SZ; (B) anodic current response of various modified electrodes; (C) CV response of LCO@RGO/GCE in 0.1 M PBS at different pH values (3, 5, 7, 9, 11) containing 100 μM of SZ; (D) linear plot of current response vs different pH values.
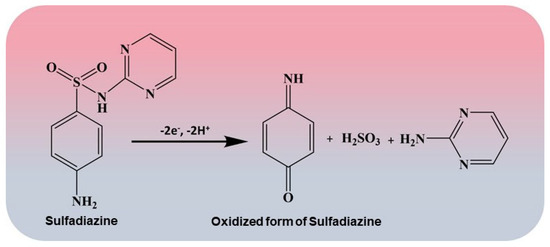
To determine the suitable pH for PBS, it was examined in acidic (pH = 3, 5), neutral (pH = 7), and alkaline (pH = 9, 11) conditions toward 100 µL of SZ. From Figure 5C, the acidic media pH values (3 and 5) show a low oxidation current compared to the pH 7, with a thriving irreversible peak with a superior anodic peak current, and the potential was slightly shifted to the negative side due to the protonation of SZ [34]. The protonation/deprotonation process of SZ is the reason for the fluctuation in the oxidation response. Figure 5D depicts the plot between the pH value and the anodic peak current response, so it was determined that a pH value of 7 is chosen as the suitable electrolyte to determine the detection of SZ. Scheme 2 displays the electro-oxidation mechanism of SZ, which involves two protons and two-electron irreversible electron transfers, thus facilitating the oxidation reaction.
Scheme 2.
Oxidation reaction mechanism of SZ.
3.4. Influence of SZ on Electrochemical Detection Using LCO@RGO/GCE
Figure 6A displays the CV oxidation current response of the LCO@RGO/GCE probe under different concentrations of SZ, from 10 to 100 µM, in 0.1 M PBS (pH = 70) and at 50 mVs−1 scan rates. Figure 6B depicts that as the concentration of SZ increases, the anodic peak current increases with good linearity, with the correlation coefficient value R2 = 0.9956. Figure 6C depicts the different scan rate current response of LCO@RGO/GCE in 0.1 M PBS toward 100 µM of SZ; the scan rate started from 20 to 230 mVs−1. As the scan rate increases, the anodic peak current increases gradually, and both are proportional to each other. Furthermore, the anodic peak current potential shifted slightly toward the positive side. Figure 6D expresses the relationship between the square root of the scan rate and the anodic oxidation peak current, with the correlation coefficient R2 = 0.997, with great linearity.
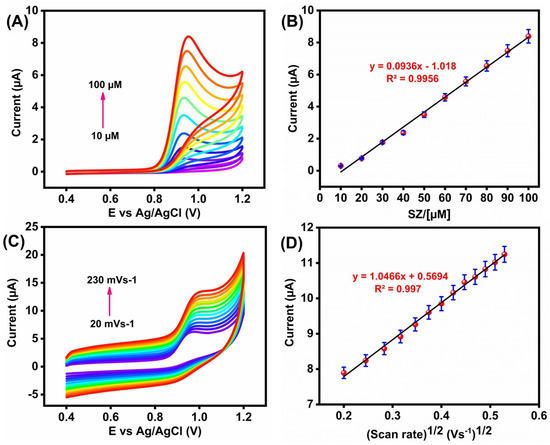
Figure 6.
(A) CV current response of LCO@RGO/GCE in different concentrations of SZ, from 10 to 100 µM, in 0.1 M PBS (pH = 7); (B) linear current response of different concentrations of SZ (µM) in LCO@RGO/GCE vs oxidation peak current; (C) the current response of LCO@RGO/GCE at different scan rates from 20–230 mVs-1 in 0.1 M PBS containing 100 µM SZ; (D) linear graph of scan rate vs oxidation peak current.
3.5. Detection of SZ Using DPV Analysis
Differential pulse voltammetry (DPV) was used to evaluate the lower detection limit, selectivity, and sensitivity of LCO@RGO in 0.1 M PBS at pH = 7 electrolyte with different concentrations of SZ. Figure 7A shows the DPV response of the fabricated LCO@RGO/GCE electrode toward different concentrations of SZ, and Figure 7B depicts the linear relationship between the anodic peak current response and different concentrations of SZ. LCO@RGO/GCE shows a wide linear range of 0.01–265 µM. The fabricated LCO@RGO/GCE, showing a lower detection limit (0.005 µM), was calculated using the formula LOD = 3 S/q [35,36]; it also evaluated a sensitivity of 0.8084 µA µM−1 cm−2. Table 1 expresses the performance of SZ in front of the LCO@RGO fabricated electrode compared to previously reported SZ in terms of linear range, LOD, and detection method.
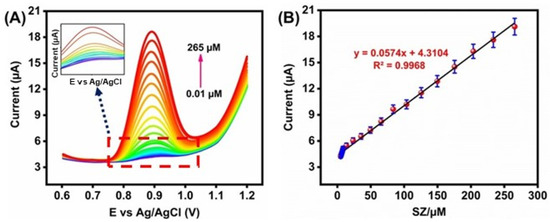
Figure 7.
(A) DPV anodic current response of SZ in various concentrations in 0.1 M PBS; (B) linear plot of anodic peak current vs. various concentrations of SZ.

Table 1.
Comparison table of fabricated LCO@RGO/GCE electrode detection with previously reported electrode material toward SZ.
3.6. Interference, Stability, and Reproducibility of LCO@RGO in SZ
The selectivity of LCO@RGO was inspected using various interfering species analyzed under DPV. Figure 8A depicts the anodic peak current response of the fabricated LCO@RGO/GCE electrode containing 100 µM of SZ in 0.1 M PBS (pH = 7) electrolyte. The bioactive compounds and inorganic ions included uric acid (UCA), glucose (GLS), sucrose (SUC), Cu2+, Cd2+, K+, Mg2+, Ca2+, and KBr. As the results indicate, there is no remarkable change in the anodic peak current, which confirms the selectivity of SZ in modified LCO@RGO/GCE.
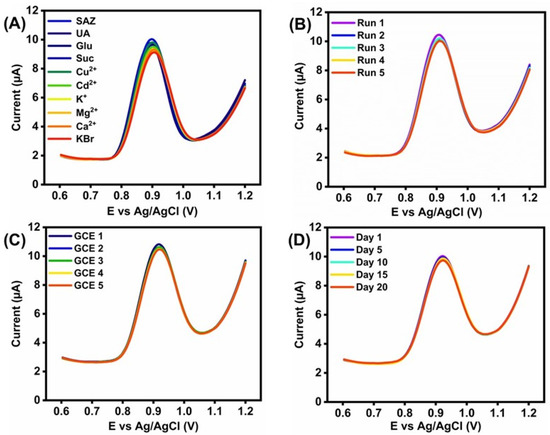
Figure 8.
(A) LCO@RGO/GCE at DPV response of various interfering compounds detection of SZ in 0.1 M PBS electrolyte; (B) repeatable measurements of fabricated LCO@RGO/GCE electrode in 100 µM of SZ; (C) reproducibility of five fabricated electrodes of LCO@RGO in 100 µM of SZ; (D) stability storage of LCO@RGO/GCE for 25 days.
Repeatability, reproducibility, and stability were examined using the DPV technique. Figure 8B shows the repeatability of the LCO@RGO/GCE electrode’s electrochemical detection in 0.1 M PBS. Repeatability deals with five repeatable measurements, with the modified LCO@RGO/GCE electrode contains 100 µM of SZ. Figure 8C shows the reproducibility DPV response of five fabricated LCO@RGO/GCE electrodes in 100 µM of SZ. Figure 8D shows the DPV response of the stability of LCO@RGO/GCE for 20 days. In addition, the test was carried out for 20 days with 5-day intervals in 0.1 M PBS contains 100 µM of SZ. During this interval period, the LCO@RGO/GCE was stored in a freezer. These probes expressed extraordinary repeatability, reproducibility, and stability in the modified LCO@RGO/GCE stability storage study.
3.7. Human Blood Serum and River Water Detection in Front of SZ
Fabricated LCO@RGO/GCE was used to detect SZ in the real sample analysis of human blood serum and river water. The river water was collected from the Xindian River in Taiwan. The human blood serum was bought from Chang-Gung Memorial Hospital, Taiwan. The CV analysis technique was utilized to probe the human blood serum and river water. This is because the CV technique has the prominent advantages of simplicity, sensitivity, and speed. The collected samples were directly utilized for the investigation, without any other purification. The samples were diluted in 0.1 M PBS in a pH = 7 solution, and the standard addition method was followed. A known concentration of SZ (10–30 µM) was added, and the current response is shown in Figure 9A,B. The added, found, and recovery values of SZ in the human blood serum and river water samples are shown in Table S1. Therefore, the results confirmed that our fabricated LCO@RGO/GCE electrode is applicable for the detection of SZ in various biological and environmental pollutants.
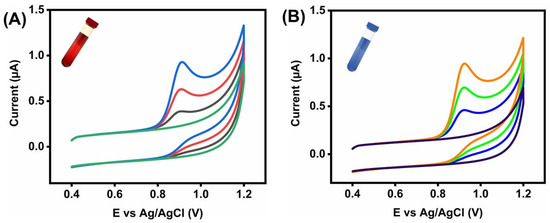
Figure 9.
CV oxidation current response of SZ at fabricated LCO@RGO/GCE: (A) human blood serum; (B) river water.
4. Conclusions
In this work, LCO@RGO was synthesized using a hydrothermal process and employed for the electrochemical detection of the antibiotic drug SZ. All the physical characterizations were utilized to inspect the synthesized composite. LCO@RGO has a higher surface area, and RGO also enhances the electrochemical properties, so these facilitate electrochemical activity. The fabricated sensor LCO@RGO/GCE for SZ detection through the DPV technique exposes a good linear range of 0.01–265 μM, a lower detection limit (LOD) of 0.005 μM, and a sensitivity of 0.8084 µAµM−1cm−2 of LCO@RGO/GCE toward SZ. Moreover, modified LCO@RGO/GCE’s selectivity, stability, and reproducibility show outstanding responses, as recorded in the DPV analysis. Moreover, appreciable results from the real sample analysis in the fabricated LCO@RGO/GCE were probed toward SZ in human blood serum and also in river water samples. Therefore, this all proves the effectiveness of LCO@RGO for the electrochemical detection of SZ.
Supplementary Materials
The following supporting information can be downloaded at: https://www.mdpi.com/article/10.3390/analytica4030023/s1. Figure S1. (A) depicts the CV redox current response of different loading concentrations of LCO@RGO/GCE in 0.1 M PBS of pH 7 with 100 µM of SZ. (B) the corresponding bar diagram for anodic current response vs different loading concentrations of LCO@RGO/GCE. Table S1. Determination of SZ in human blood serum and river water in front of fabricated LCO@RGO/GCE.
Author Contributions
F.P.D.D.—Investigation, Writing—original draft. R.S.—Conceptualization, Supervision, Methodology, Investigation, Writing—original draft, review & editing, Visualization. S.-M.C.—Conceptualization, Validation, Supervision, Project administration, Funding acquisition, B.R.—Conceptualization, Writing—original draft, Visualization, and N.C.—Writing—original draft. All authors have read and agreed to the published version of the manuscript.
Funding
The authors are grateful for the financial support from the Ministry of Science and Technology (MOST), Taiwan, Project No. MOST 111-2113-M-027-002.
Data Availability Statement
Not applicable.
Conflicts of Interest
The authors declare no conflict of interest.
References
- Alsaiari, N.S.; Katubi, K.M.M.; Alzahrani, F.M.; Siddeeg, S.M.; Tahoon, M.A. The application of nanomaterials for the electrochemical detection of antibiotics: A review. Micromachines 2021, 12, 308. [Google Scholar] [CrossRef] [PubMed]
- Vilian, A.E.; Hwang, S.-K.; Lee, M.J.; Park, B.; Huh, Y.S.; Han, Y.-K. Gold nanoparticle decorated patronite on rGO for the quantification of sulfadiazine at nanomolar levels in contaminated water. Chem. Eng. J. 2022, 439, 135782. [Google Scholar] [CrossRef]
- Yao, J.; Dong, Z.; Ye, X.; Yang, J.; Jia, Y.; Zhang, Y.; Liu, H. Electrochemically activated peroxymonosulfate with mixed metal oxide electrodes for sulfadiazine degradation: Mechanism, DFT study and toxicity evaluation. Chemosphere 2022, 309, 136695. [Google Scholar] [CrossRef] [PubMed]
- Sun, Y.; He, J.; Waterhouse, G.I.; Xu, L.; Zhang, H.; Qiao, X.; Xu, Z. A selective molecularly imprinted electrochemical sensor with GO@ COF signal amplification for the simultaneous determination of sulfadiazine and acetaminophen. Sens. Actuators B Chem. 2019, 300, 126993. [Google Scholar] [CrossRef]
- Zhu, X.; Li, Z.; Yifeng, E.; Jiang, Y.; Wei, P.; Chen, P.; Li, L.; Qian, K. Selective and Quantitative Recovery of Sulfadiazine from Seawater by Sb Doped LTA Zeolite Electrochemical Sensor. Surf. Interfaces 2023, 37, 102666. [Google Scholar] [CrossRef]
- Yang, L.; Chen, X.; Wen, X.; Tang, J.; Zheng, X.; Li, J.; Chen, L.; Jiang, S.; Le, T. A label-free dual-modal aptasensor for colorimetric and fluorescent detection of sulfadiazine. J. Mater. Chem. B 2022, 10, 6187–6193. [Google Scholar] [CrossRef]
- Sharma, T.S.K.; Jana, J.; Bhamu, K.; Song, J.; Sivaselvam, S.; Van Tam, T.; Kang, S.G.; Chung, J.S.; Hur, S.H.; Choi, W.M. Rational synthesis of alkaline earth metal vanadates: Structural origin of MgVO3 honeycomb lattice system and its electrochemical analysis for the detection of sulfadiazine. Chem. Eng. J. 2023, 464, 142673. [Google Scholar] [CrossRef]
- Gamba, V.; Terzano, C.; Fioroni, L.; Moretti, S.; Dusi, G.; Galarini, R. Development and validation of a confirmatory method for the determination of sulphonamides in milk by liquid chromatography with diode array detection. Anal. Chim. Acta 2009, 637, 18–23. [Google Scholar] [CrossRef]
- Velmurugan, S.; Yang, T.C.-K.; Chen, S.-W.; Chen, J.-N. Metal-organic frameworks derived ZnO-Co3O4 pn heterojunction photocatalyst for the photoelectrochemical detection of sulfadiazine. J. Environ. Chem. Eng. 2021, 9, 106169. [Google Scholar] [CrossRef]
- Liu, Y.; Chen, J.; Hu, H.; Qu, K.; Cui, Z. A Low-Cost Electrochemical Method for the Determination of Sulfadiazine in Aquaculture Wastewater. Int. J. Environ. Res. Public Health 2022, 19, 16945. [Google Scholar] [CrossRef]
- Wang, X.; Li, K.; Shi, D.; Jin, X.; Xiong, N.; Peng, F.; Peng, D.; Bi, D. Development and validation of an immunochromatographic assay for rapid detection of sulfadiazine in eggs and chickens. J. Chromatogr. B 2007, 847, 289–295. [Google Scholar] [CrossRef]
- Teng, Y.; Wang, Z.; Zuo, S.; Li, X.; Chen, Y. Identification of antibiotic residues in aquatic products with surface-enhanced Raman scattering powered by 1-D convolutional neural networks. Spectrochim. Acta Part A Mol. Biomol. Spectrosc. 2023, 289, 122195. [Google Scholar] [CrossRef]
- Fotouhi, L.; Hashkavayi, A.B.; Heravi, M.M. Electrochemical behaviour and voltammetric determination of sulphadiazine using a multi-walled carbon nanotube composite film-glassy carbon electrode. J. Exp. Nanosci. 2013, 8, 947–956. [Google Scholar] [CrossRef]
- Mallikarjunaiah Vinay, M.; Virupakshappa Basavarajappa, K.; Manjunatha, P.; Thimmappa Purushothama, H.; Onkarappa Yathisha, R.; Arthoba Nayaka, Y. Development of single walled carbon nanotube-molybdenum disulfide nanocomposite/poly-ethylene glycol modified carbon paste electrode as an electrochemical sensor for the investigation of sulfadiazine in biological samples. Anal. Bioanal. Electrochem. 2020, 12, 155–167. [Google Scholar]
- Sun, Y.; Xu, L.; Waterhouse, G.I.; Wang, M.; Qiao, X.; Xu, Z. Novel three-dimensional electrochemical sensor with dual signal amplification based on MoS2 nanosheets and high-conductive NH2-MWCNT@ COF for sulfamerazine determination. Sens. Actuators B Chem. 2019, 281, 107–114. [Google Scholar] [CrossRef]
- Zhu, W.; Ma, J.; Xu, L.; Zhang, W.; Chen, Y. Controlled synthesis of Nd (OH)3 and Nd2O3 nanoparticles by microemulsion method. Mater. Chem. Phys. 2010, 122, 362–367. [Google Scholar] [CrossRef]
- Xiao, Z.; Zhou, B.; Xu, F.; Zhu, F.; Yan, L.; Zhang, F.; Huang, A. Energy transfer among rare earth ions induced by annealing process of TmEr codoped aluminum oxide thin films. Phys. Lett. A 2009, 373, 890–893. [Google Scholar] [CrossRef]
- Sundaresan, R.; Mariyappan, V.; Chen, S.-M.; Ramachandran, B.; Paulsamy, R.; Rasu, R. Construction of an electrochemical sensor towards environmental hazardous 4-nitrophenol based on Nd (OH)3-embedded VSe2 nanocomposite. Environ. Sci. Pollut. Res. 2023, 1–14. [Google Scholar] [CrossRef]
- Rashmi, B.; Harlapur, S.F.; Gurushantha, K.; Ravikumar, C.; Kumar, M.A.; Santosh, M.; Kumar, V.D.; Kumar, A.N.; Azad, A.K.; Murthy, H.A. Facile green synthesis of lanthanum oxide nanoparticles using Centella asiatica and Tridax plants: Photocatalytic, electrochemical sensor and antimicrobial studies. Appl. Surf. Sci. Adv. 2022, 7, 100210. [Google Scholar] [CrossRef]
- Deng, W.; Carpenter, C.; Yi, N.; Flytzani-Stephanopoulos, M. Comparison of the activity of Au/CeO2 and Au/Fe2O3 catalysts for the CO oxidation and the water-gas shift reactions. Top. Catal. 2007, 44, 199–208. [Google Scholar] [CrossRef]
- Keating, P.R.; Scanlon, D.O.; Watson, G.W. The nature of oxygen states on the surfaces of CeO2 and La-doped CeO2. Chem. Phys. Lett. 2014, 608, 239–243. [Google Scholar] [CrossRef]
- Aneggi, E.; De Leitenburg, C.; Dolcetti, G.; Trovarelli, A. Promotional effect of rare earths and transition metals in the combustion of diesel soot over CeO2 and CeO2–ZrO2. Catal. Today 2006, 114, 40–47. [Google Scholar] [CrossRef]
- Kırkgeçit, R.; Torun, H.Ö.; Dokan, F.K.; Öztürk, E. Optical and electrical conductivity properties of rare earth elements (Sm, Y, La, Er) co-doped CeO2. J. Rare Earths 2022, 40, 1619–1627. [Google Scholar] [CrossRef]
- Gupta, M.; Kumar, A.; Sagdeo, A.; Sagdeo, P.R. Doping-induced combined fano and phonon confinement effect in La-doped CeO2: Raman spectroscopy analysis. J. Phys. Chem. C 2021, 125, 2648–2658. [Google Scholar] [CrossRef]
- Goel, S.; Sinha, N.; Yadav, H.; Joseph, A.J.; Kumar, B. Experimental investigation on the structural, dielectric, ferroelectric and piezoelectric properties of La doped ZnO nanoparticles and their application in dye-sensitized solar cells. Phys. E Low-Dimens. Syst. Nanostructures 2017, 91, 72–81. [Google Scholar] [CrossRef]
- Zhang, Z.; Gong, Y.; Xu, J.; Zhang, Y.; Xiao, Q.; Xi, R.; Xu, X.; Fang, X.; Wang, X. Dissecting La2Ce2O7 catalyst to unravel the origin of the surface active sites devoting to its performance for oxidative coupling of methane (OCM). Catal. Today 2022, 400, 73–81. [Google Scholar] [CrossRef]
- Atacan, K. CuFe2O4/reduced graphene oxide nanocomposite decorated with gold nanoparticles as a new electrochemical sensor material for l-cysteine detection. J. Alloys Compd. 2019, 791, 391–401. [Google Scholar] [CrossRef]
- Wang, C.; Du, J.; Wang, H.; Zou, C.E.; Jiang, F.; Yang, P.; Du, Y. A facile electrochemical sensor based on reduced graphene oxide and Au nanoplates modified glassy carbon electrode for simultaneous detection of ascorbic acid, dopamine and uric acid. Sens. Actuators B Chem. 2014, 204, 302–309. [Google Scholar] [CrossRef]
- Su, D.S.; Perathoner, S.; Centi, G. Nanocarbons for the development of advanced catalysts. Chem. Rev. 2013, 113, 5782–5816. [Google Scholar] [CrossRef]
- Kang, X.; Wang, J.; Wu, H.; Aksay, I.A.; Liu, J.; Lin, Y. Glucose oxidase–graphene–chitosan modified electrode for direct electrochemistry and glucose sensing. Biosens. Bioelectron. 2009, 25, 901–905. [Google Scholar] [CrossRef]
- Santhan, A.; Hwa, K.-Y.; Ganguly, A. Self-assembled nanorods with reduced graphene oxide as efficient nano-catalyst for dual modality sensing of hazardous phenolic compound. Chemosphere 2022, 307, 135715. [Google Scholar] [CrossRef]
- Sundaresan, R.; Mariyappan, V.; Chen, S.-M.; Keerthi, M.; Ramachandran, R. Electrochemical sensor for detection of tryptophan in the milk sample based on MnWO4 nanoplates encapsulated RGO nanocomposite. Colloids Surf. A Physicochem. Eng. Asp. 2021, 625, 126889. [Google Scholar] [CrossRef]
- Akilarasan, M.; Kogularasu, S.; Chen, S.-M.; Chen, T.-W.; Lin, S.-H. One-step synthesis of reduced graphene oxide sheathed zinc oxide nanoclusters for the trace level detection of bisphenol A in tissue papers. Ecotoxicol. Environ. Saf. 2018, 161, 699–705. [Google Scholar] [CrossRef]
- Vivekanandan, A.K.; Muthukutty, B.; Chen, S.-M.; Sivakumar, M.; Chen, S.-H. Intermetallic compound Cu2Sb nanoparticles for effective electrocatalytic oxidation of an antibiotic drug: Sulphadiazine. ACS Sustain. Chem. Eng. 2020, 8, 17718–17726. [Google Scholar] [CrossRef]
- Balaji, R.; Renganathan, V.; Chu, C.-P.; Liao, Y.-C.; Kao, C.; Chen, S.-M. Periodic copper microbead array on silver layer for dual mode detection of glyphosate. OpenNano 2022, 8, 100105. [Google Scholar] [CrossRef]
- Sundaresan, R.; Mariyappan, V.; Chen, T.-W.; Chen, S.-M.; Akilarasan, M.; Liu, X.; Yu, J. One-dimensional rare-earth tungstate nanostructure encapsulated reduced graphene oxide electrocatalyst-based electrochemical sensor for the detection of organophosphorus pesticide. J. Nanostructure Chem. 2023, 1–14. [Google Scholar] [CrossRef]
- Liu, B.; Ma, Y.; Zhou, F.; Wang, Q.; Liu, G. Voltammetric determination of sulfadiazine based on molecular imprinted electrochemical sensor. Int. J. Electrochem. Sci. 2020, 15, 9590–9596. [Google Scholar] [CrossRef]
- Elamin, M.B.; Ali, S.M.A.; Essousi, H.; Chrouda, A.; Alhaidari, L.M.; Jaffrezic-Renault, N.; Barhoumi, H. An Electrochemical Sensor for Sulfadiazine Determination Based on a Copper Nanoparticles/Molecularly Imprinted Overoxidized Polypyrrole Composite. Sensors 2023, 23, 1270. [Google Scholar] [CrossRef]
- Devi, R.K.; Ganesan, M.; Chen, T.-W.; Chen, S.-M.; Al-onazi, W.A.; Al-Mohaimeed, A.M.; Elshikh, M.S.; Yu, Y.-Y. 3D-nanocubes of N-doped carbon quantum dots adorned manganese oxide: A functional electrocatalyst for the sensitive detection of sulfadiazine. Colloids Surf. A Physicochem. Eng. Asp. 2022, 648, 129141. [Google Scholar] [CrossRef]
- Campestrini, I.; de Braga, O.C.; Vieira, I.C.; Spinelli, A. Application of bismuth-film electrode for cathodic electroanalytical determination of sulfadiazine. Electrochim. Acta 2010, 55, 4970–4975. [Google Scholar] [CrossRef]
Disclaimer/Publisher’s Note: The statements, opinions and data contained in all publications are solely those of the individual author(s) and contributor(s) and not of MDPI and/or the editor(s). MDPI and/or the editor(s) disclaim responsibility for any injury to people or property resulting from any ideas, methods, instructions or products referred to in the content. |
© 2023 by the authors. Licensee MDPI, Basel, Switzerland. This article is an open access article distributed under the terms and conditions of the Creative Commons Attribution (CC BY) license (https://creativecommons.org/licenses/by/4.0/).