
Simple Analytical Strategy for Screening Three Synthetic Cathinones (α-PVT, α-PVP, and MDPV) in Oral Fluids


 ,
,  ,
,  and
and
Abstract
:
1. Introduction
2. Materials and Methods
2.1. Standards and Materials
2.2. BAµE-µLD Assays
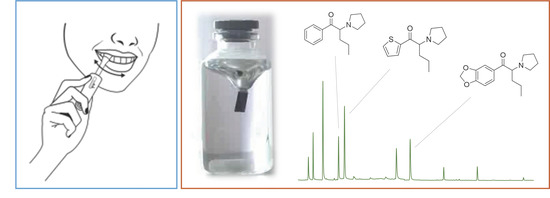
2.3. Oral Fluid Samples
2.4. Instrumental Set-Up
3. Results
3.1. Intrumental Operating Conditions
3.2. BAµE-µLD Optimization Assays
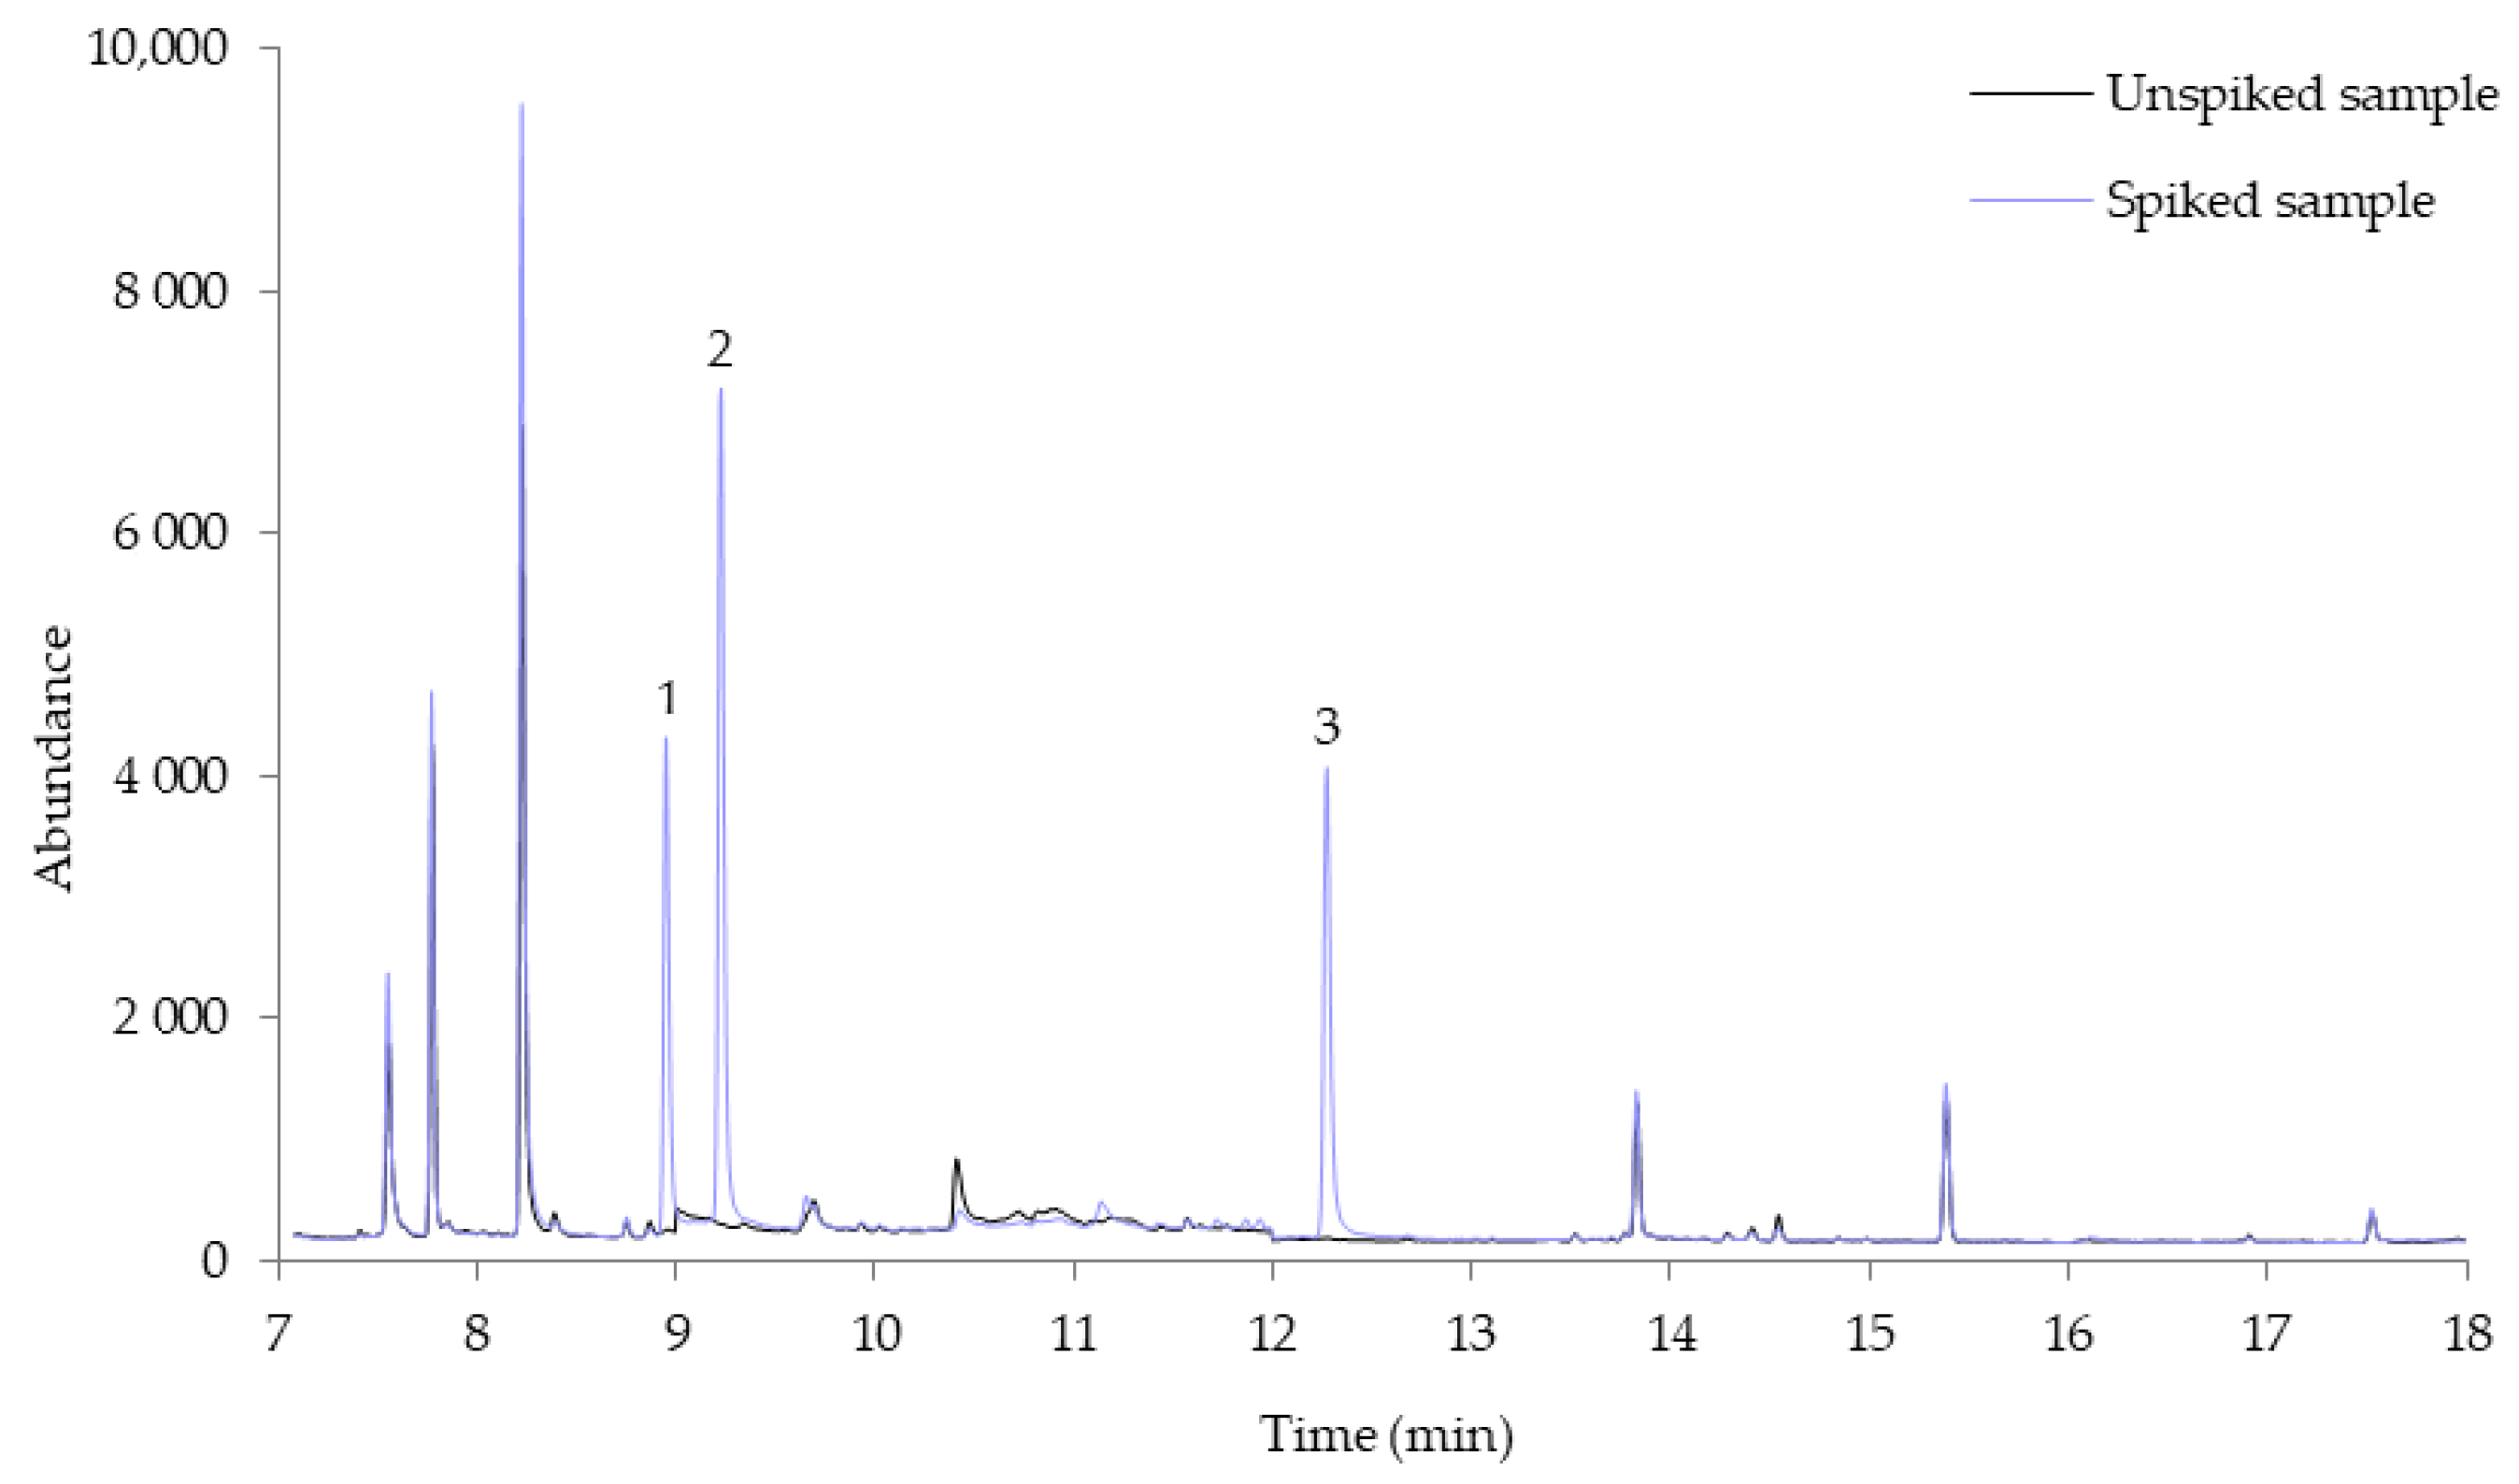
3.3. Application to Oral Fluid Samples
4. Discussion
Supplementary Materials
Author Contributions
Funding
Data Availability Statement
Acknowledgments
Conflicts of Interest
References
- World Drug Report 2021 (United Nations publication, Sales No. E.21.XI.8). Available online: https://www.unodc.org/unodc/en/data-and-analysis/wdr2021.html (accessed on 23 July 2021).
- European Monitoring Centre for Drugs and Drug Addiction. European Drug Report 2021: Trends and Developments; Publications Office of the European Union: Luxembourg, 2021. [Google Scholar]
- El-Menyar, A.; Mekkodathil, A.; Al-Thani, H.; Al-Motarreb, A. Khat use: History and heart failure. Oman Med. J. 2015, 30, 77–82. [Google Scholar] [CrossRef]
- Capriola, M. Synthetic cathinone abuse. Clin. Pharmacol. Adv. Appl. 2013, 5, 109–115. [Google Scholar] [CrossRef] [Green Version]
- Imam, S.F.; Patel, H.; Mahmoud, M.; Prakash, N.A.; King, M.S.; Fremont, R.D. Bath salts intoxication: A case series. J. Emerg. Med. 2013, 45, 361–365. [Google Scholar] [CrossRef] [PubMed]
- Zaami, S.; Giorgetti, R.; Pichini, S.; Pantano, F.; Marinelli, E.; Busardò, F.P. Synthetic cathinones related fatalities: An update. Eur. Rev. Med. Pharmacol. Sci. 2018, 22, 268–274. [Google Scholar] [CrossRef]
- La Maida, N.; Di Trana, A.; Giorgetti, R.; Tagliabracci, A.; Busardò, F.P.; Huestis, M.A. A Review of Synthetic Cathinone–Related Fatalities From 2017 to 2020. Ther. Drug Monit. 2021, 43, 52–68. [Google Scholar] [CrossRef]
- Elmongy, H.; Abdel-Rehim, M. Saliva as an alternative specimen to plasma for drug bioanalysis. A review. TrAC—Trends Anal. Chem. 2016, 83, 70–79. [Google Scholar] [CrossRef]
- Graziano, S.; Anzillotti, L.; Mannocchi, G.; Pichini, S.; Busardò, F.P. Screening methods for rapid determination of new psychoactive substances (NPS) in conventional and non-conventional biological matrices. J. Pharm. Biomed. Anal. 2019, 163, 170–179. [Google Scholar] [CrossRef] [PubMed]
- Amaratunga, P.; Lemberg, B.L.; Lemberg, D. Quantitative measurement of synthetic cathinones in oral fluid. J. Anal. Toxicol. 2013, 37, 622–628. [Google Scholar] [CrossRef] [Green Version]
- Ares, A.M.; Fernández, P.; Regenjo, M.; Fernández, A.M.; Carro, A.M.; Lorenzo, R.A. A fast bioanalytical method based on microextraction by packed sorbent and UPLC–MS/MS for determining new psychoactive substances in oral fluid. Talanta 2017, 174, 454–461. [Google Scholar] [CrossRef]
- de Castro, A.; Lendoiro, E.; Fernández-Vega, H.; Steinmeyer, S.; López-Rivadulla, M.; Cruz, A. Liquid chromatography tandem mass spectrometry determination of selected synthetic cathinones and two piperazines in oral fluid. Cross reactivity study with an on-site immunoassay device. J. Chromatogr. A 2014, 1374, 93–101. [Google Scholar] [CrossRef]
- Fernández, P.; Regenjo, M.; Ares, A.; Fernández, A.M.; Lorenzo, R.A.; Carro, A.M. Simultaneous determination of 20 drugs of abuse in oral fluid using ultrasound-assisted dispersive liquid–liquid microextraction. Anal. Bioanal. Chem. 2019, 411, 193–203. [Google Scholar] [CrossRef]
- Mohamed, K.M.; Al-Hazmi, A.H.; Alasiri, A.M.; Ali, M.E.-S. A GC–MS Method for Detection and Quantification of Cathine, Cathinone, Methcathinone and Ephedrine in Oral Fluid. J. Chromatogr. Sci. 2016, 54, 1271–1276. [Google Scholar] [CrossRef]
- Strano-Rossi, S.; Cadwallader, A.B.; de la Torre, X.; Botrè, F. Toxicological determination and in vitro metabolism of the designer drug methylenedioxypyrovalerone (MPDV) by gas chromatography/mass spectrometry and liquid chromatography/quadrupole time-of-flight mass spectrometry. Rapid Commun. Mass Spectrom. 2010, 24, 2706–2714. [Google Scholar] [CrossRef]
- Strano-Rossi, S.; Anzillotti, L.; Castrignanò, E.; Romolo, F.S.; Chiarotti, M. Ultra high performance liquid chromatography-electrospray ionization-tandem mass spectrometry screening method for direct analysis of designer drugs, “spice” and stimulants in oral fluid. J. Chromatogr. A 2012, 1258, 37–42. [Google Scholar] [CrossRef] [PubMed]
- Sorribes-Soriano, A.; Esteve-Turrillas, F.A.; Armenta, S.; Amorós, P.; Herrero-Martínez, J.M. Amphetamine-type stimulants analysis in oral fluid based on molecularly imprinting extraction. Anal. Chim. Acta 2019, 1052, 73–83. [Google Scholar] [CrossRef]
- Di Trana, A.; Mannocchi, G.; Pirani, F.; La Maida, N.; Gottardi, M.; Pichini, S.; Busardò, F.P. A comprehensive HPLC–MS-MS screening method for 77 new psychoactive substances, 24 classic drugs and 18 related metabolites in blood, urine and oral fluid. J. Anal. Toxicol. 2020, 44, 769–783. [Google Scholar] [CrossRef] [PubMed]
- Nogueira, J.M.F. Stir-bar sorptive extraction—15 years making sample preparation more environment friendly. TrAC Trends Anal. Chem. 2015, 71, 214–223. [Google Scholar] [CrossRef]
- Neng, N.R.; Ahmad, S.M.; Gaspar, H.; Nogueira, J.M.F. Determination of mitragynine in urine matrices by bar adsorptive microextraction and HPLC analysis. Talanta 2015, 144, 105–109. [Google Scholar] [CrossRef]
- Ahmad, S.M.; Nogueira, J.M.F. High throughput bar adsorptive microextraction: A simple and effective analytical approach for the determination of nicotine and cotinine in urine samples. J. Chromatogr. A 2019, 460750. [Google Scholar] [CrossRef] [PubMed]
- Ahmad, S.M.; Nogueira, J.M.F. High throughput bar adsorptive microextraction: A novel cost-effective tool for monitoring benzodiazepines in large number of biological samples. Talanta 2019, 199, 195–202. [Google Scholar] [CrossRef]
- Ahmad, S.M.; Oliveira, M.N.; Neng, N.R.; Nogueira, J.M.F. A fast and validated high throughput bar adsorptive microextraction (HT-BAµE) method for the determination of ketamine and norketamine in urine samples. Molecules 2020, 25, 1438. [Google Scholar] [CrossRef] [PubMed] [Green Version]
- Oliveira, M.N.; Gonçalves, O.C.; Ahmad, S.M.; Schneider, J.K.; Krause, L.C.; Neng, N.R.; Caramão, E.B.; Nogueira, J.M.F. Application of Bar Adsorptive Microextraction for the Determination of Levels of Tricyclic Antidepressants in Urine Samples. Molecules 2021, 26, 3101. [Google Scholar] [CrossRef] [PubMed]
- Kerrigan, S.; Savage, M.; Cavazos, C.; Bella, P. Thermal degradation of synthetic cathinones: Implications for forensic toxicology. J. Anal. Toxicol. 2016, 40, 1–11. [Google Scholar] [CrossRef] [Green Version]
- DeRuiter, J.; Hayes, L.; Valaer, A.; Clark, C.R.; Noggle, F.T. Methcathinone and Designer Analogues: Synthesis, Stereochemical Analysis, and Analytical Properties. J. Chromatogr. Sci. 1994, 32, 552–564. [Google Scholar] [CrossRef]
- Gaspar, H.; Bronze, S.; Oliveira, C.; Victor, B.L.; Machuqueiro, M.; Pacheco, R.; Caldeira, M.J.; Santos, S. Proactive response to tackle the threat of emerging drugs: Synthesis and toxicity evaluation of new cathinones. Forensic Sci. Int. 2018, 290, 146–156. [Google Scholar] [CrossRef] [PubMed]
- Gaspar, H.; Bronze, S.; Ciríaco, S.; Queirós, C.R.; Matias, A.; Rodrigues, J.; Oliveira, C.; Cordeiro, C.; Santos, S. 4F-PBP (4′-fluoro-α-pyrrolidinobutyrophenone), a new substance of abuse: Structural characterization and purity NMR profiling. Forensic Sci. Int. 2015, 252, 168–176. [Google Scholar] [CrossRef]
- Westphal, F.; Junge, T.; Rösner, P.; Sönnichsen, F.; Schuster, F. Mass and NMR spectroscopic characterization of 3,4-methylenedioxypyrovalerone: A designer drug with α-pyrrolidinophenone structure. Forensic Sci. Int. 2009, 190, 1–8. [Google Scholar] [CrossRef]
- Maheux, C.R.; Copeland, C.R.; Pollard, M.M. Characterization of Three Methcathinone Analogs: 4-Methylmethcathinone, Methylone, and bk-MBDB. Microgram J. 2010, 7, 42–49. [Google Scholar]
- Scientific Working Group for the Analysis of Seized Drugs (SWGDRUG), Drugs Monographs, MDPPP, 2013. Available online: http://www.swgdrug.org/Monographs/MDPPP.pdf (accessed on 30 May 2021).
- Uchiyama, N.; Matsuda, S.; Kawamura, M.; Kikura-Hanajiri, R.; Goda, Y. Two new-type cannabimimetic quinolinyl carboxylates, QUPIC and QUCHIC, two new cannabimimetic carboxamide derivatives, ADB-FUBINACA and ADBICA, and five synthetic cannabinoids detected with a thiophene derivative α-PVT and an opioid receptor agonist AH-79. Forensic Toxicol. 2013, 31, 223–240. [Google Scholar] [CrossRef]
- Doi, T.; Asada, A.; Takeda, A.; Tagami, T.; Katagi, M.; Matsuta, S.; Kamata, H.; Kawaguchi, M.; Satsuki, Y.; Sawabe, Y.; et al. Identification and characterization of α-PVT, α-PBT, and their bromothienyl analogs found in illicit drug products. Forensic Toxicol. 2016, 34, 76–93. [Google Scholar] [CrossRef]
- Marvin 6 2.2, ChemAxon. Available online: http://www.chemaxon.com (accessed on 23 July 2021).


| SCs | Chemical Structrure | SIM ions (m/z) | log KO/W a | pKa a | RT (min) | Recovery ± RSD (%, n = 5) |
|---|---|---|---|---|---|---|
| α-PVP | 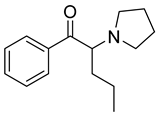 | 77, 105, 126 * | 3.36 | 7.49 | 8.9 | 43.1 ± 13.2 |
| α-PVT |  | 84, 111, 126 * | 3.28 | 7.59 | 9.2 | 63.7 ± 10.8 |
| MDPV | 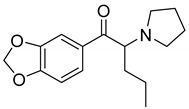 | 121, 126 *, 149 | 2.99 | 7.31 | 12.2 | 52.3 ± 13.2 |
Publisher’s Note: MDPI stays neutral with regard to jurisdictional claims in published maps and institutional affiliations. |
© 2022 by the authors. Licensee MDPI, Basel, Switzerland. This article is an open access article distributed under the terms and conditions of the Creative Commons Attribution (CC BY) license (https://creativecommons.org/licenses/by/4.0/).
Share and Cite
Segurado, A.M.; Ahmad, S.M.; Neng, N.R.; Maniés-Sequeira, M.M.; Gaspar, H.; Nogueira, J.M.F. Simple Analytical Strategy for Screening Three Synthetic Cathinones (α-PVT, α-PVP, and MDPV) in Oral Fluids. Analytica 2022, 3, 14-23. https://doi.org/10.3390/analytica3010002
Segurado AM, Ahmad SM, Neng NR, Maniés-Sequeira MM, Gaspar H, Nogueira JMF. Simple Analytical Strategy for Screening Three Synthetic Cathinones (α-PVT, α-PVP, and MDPV) in Oral Fluids. Analytica. 2022; 3(1):14-23. https://doi.org/10.3390/analytica3010002
Chicago/Turabian StyleSegurado, André M., Samir M. Ahmad, Nuno R. Neng, Margarida M. Maniés-Sequeira, Helena Gaspar, and José Manuel F. Nogueira. 2022. "Simple Analytical Strategy for Screening Three Synthetic Cathinones (α-PVT, α-PVP, and MDPV) in Oral Fluids" Analytica 3, no. 1: 14-23. https://doi.org/10.3390/analytica3010002
APA StyleSegurado, A. M., Ahmad, S. M., Neng, N. R., Maniés-Sequeira, M. M., Gaspar, H., & Nogueira, J. M. F. (2022). Simple Analytical Strategy for Screening Three Synthetic Cathinones (α-PVT, α-PVP, and MDPV) in Oral Fluids. Analytica, 3(1), 14-23. https://doi.org/10.3390/analytica3010002