Article

Achievements of Mesoporous Carbon Solution and Single-Walled Carbon Nanotube Composite on the Sensitive Electrochemical Assay of Ivabradine

1
Department of Analytical Chemistry, Faculty of Pharmacy, Ankara University, Ankara 06560, Turkey
2
Department of Analytical Chemistry, Faculty of Pharmacy, Adiyaman University, Adiyaman 02040, Turkey
3
Department of Analytical Chemistry, Gulhane Faculty of Pharmacy, University of Health Sciences, Ankara 06010, Turkey
*
Author to whom correspondence should be addressed.
Analytica 2021, 2(4), 195-205; https://doi.org/10.3390/analytica2040017
Submission received: 15 November 2021 / Revised: 7 December 2021 / Accepted: 8 December 2021 / Published: 13 December 2021
(This article belongs to the Section Electroanalysis)

Abstract

:
In this study, the electrochemical determination of Ivabradine hydrochloride (IH) was studied in detail using a glassy carbon electrode (GCE) modified with mesoporous carbon solution (MCS) and carboxylated group linked single-walled carbon nanotube (SWCNT-COOH). The developed nanosensor showed a significant effect by remarkably increasing the IH signal compared with the bare GCE. Cyclic (CV) and differential pulse voltammetric (DPV) methods were applied to perform electrochemical analysis of IH in pH 3.0 BRB solutions. The calibration plot for IH with a detection limit of 1.47 × 10⁻⁷ M was obtained using the DPV technique in the range of 1–10 µM under optimum experimental conditions. The proposed method has been validated and applied for the detection of the IH tablet. The produced nanosensor was also performed for the determination of IH in serum and urine. Excellent recoveries of 98.4%, 98.0%, and 100.2% were achieved for tablet, serum, and urine analysis, respectively.

1. Introduction

Ivabradine hydrochloride (IH) is beneficial for lowering heart rate through inhibition of the pacemaker current in angina pectoris, symptomatic chronic heart failure, and sinus rhythm [1]. IH belongs to a hyperpolarization-activated cyclic nucleotide (HCN) gated channel blockers medication group. Corlanor® (ivabradine) tablets are taken 5 mg twice daily with foods. After two weeks, the heart rhythm is arranged between 50 and 60 beats per minute (bpm). The pharmacokinetics of IH has a linear range of 0.5 mg to 24 mg for an oral dose. The CYP3A4-mediated oxidation widely contributes to the metabolization of IH in the liver and intestines [2]. The chemical structure of IH is given in Scheme 1. The formula and weight of the IH component are C27H36N2O5·HCl and 505.1 (468.6 + 36.5), respectively [3].
Nanomaterials are composed of many materials that are sized between 1 and 100 nm [4]. Carbon and metal nanomaterials have important physicochemical properties in the development of nanosensors. These nanomaterials enhance the electrode surface area (the high surface-to-volume ratio) and accelerate the electron transfer between electrode and analyte [5]. In addition, the mesoporous carbon solution (MCS), a homogeneous black solution, helps the electrode surface to be very porous [6]. Therefore, MCS is used increasingly to boost chemical reactions.
Moreover, the carbon nanotubes (CNTs) structure is similar to a hollow cylinder consisting of carbon atoms [7]. CNTs can be varied according to the amount of graphite. The carboxylated group linked single-walled carbon nanotube (SWCNT-COOH), one-dimensional materials, is formed by a single layer of graphite. SWCNT-COOH is widely utilized to modify electrode surfaces due to its mechanical, electrical, and thermal properties [8].
The introduced SWCNT-COOH and MCS exhibited the combined synergistic effects of the nanomaterials towards electrochemical sensors [9]. The synergistic effect of MCS/SWCNT-COOH is constructed by combining good electrical properties and facile chemical functionality [10]. Therefore, the analytes are easily detected in lower concentrations using electrochemical nanosensors in biological samples and pharmaceutical dosage forms.
The combination of nanomaterials and transducers has constructed electrochemical nanosensors [11]. A glassy carbon electrode (GCE) is widely preferred as a transducer because of its very homogeneous and reusable surface. Electrochemical techniques process the electrochemical signal. As an electrochemical technique, differential pulse voltammetry is widely used to determine medications in biological fluid samples and their pharmaceutical dosage forms.
Some articles have been published on the determination of IH using chromatographic, spectrophotometric, and spectrofluorimetric methods, but these techniques were insufficient to achieve low IH concentrations [12,13,14,15,16,17]. The overdose taken of IH can create vital problems. Ivabradine is absorbed from the gastrointestinal tract, and it shows linear pharmacokinetics over an oral dosing scale of 0.5–24 mg. After oral administration, max plasma concentrations (Cmax) are reached after approximately one hour [1]. For this reason, selectivity and sensitivity are very critical parameters for analytical methods [18]. Electrochemical nanosensors are separated from traditional analytical techniques because of their many advantages, such as minimal cost, portability, ease of handling, sensibility, and accessibility of lower concentration [19].
Based on the literature, IH was determined with several electrochemical sensors. Molecular imprinted polymer (MIP)-based electrochemical nanosensors were developed by Abdel-Haleem et al. [20]. The linear range and limit of detection (LOD) were obtained as 9.8 × 10⁻⁸ M −1.0 × 10⁻³ M and 98 nM, respectively. Moreover, the same group fabricated an at-Butyl calixarene/Fe2O3@MWCNTs modified carbon paste electrode (CPE) [21]. A linear dynamic range between 10−3 M and 10−7 M and LOD of 36 nM was found using a fabricated nanosensor. Attia et al. obtained a linear range between 3.98 × 10⁻⁶ M and 3.48 × 10⁻⁵ M with an LOD of 5.16 × 10⁻⁶ M using MWCNT modified CPE in the presence of surfactants for analysis of IH in 2017 [22]. All previously published studies were performed with carbon paste electrodes. However, the carbon paste electrode repeatability is pretty low due to its repetition of surface preparation [23].
The MCS/SWCNT-COOH modified GCE is fabricated for the determination of IH. The MCS/SWCNT-COOH modified GCE surface is characterized by a scanning electron microscope (SEM). The developed electrochemical nanosensor is successfully applied for pharmaceutical and biological samples. Furthermore, the proposed nanosensor is fully validated according to ICH guidelines [24].

2. Experimental

2.1. Apparatus

CV and DPV measurements were performed with a Palmsens 4 potentiostat controlled by PSTrace 5.8 software. The electrochemical transducers were a triple electrode system consisting of a glassy carbon working electrode, a platinum wire counter electrode, and a silver/silver chloride (kept in 3 M saturated KCl solution) reference electrode. All experiments were performed at room temperature. The pH value of solutions was arranged with a pH meter, Model 538 (WTW, Sydney, Austria). The DPV parameters were determined as a step potential of 0.005 V; modulation amplitude of 0.020 V; and modulation time of 0.07 s.

2.2. Reagents and Chemicals

Sandoz® Pharmaceuticals Company kindly supplied IH. Acetic acid, NaOH, sodium acetate, phosphoric acid (>85%), and potassium phosphate were supplied from Sigma-Aldrich (St. Louis, MO, USA). MCS and SWCNT-COOH were supplied from DropSens (Oviedo, Spain). The 1 × 10⁻³ M stock solution of IH and all aqueous solutions were prepared with ultrapure water. In this study, supporting electrolytes were prepared as follows: acetate buffer (AB) solution at pH 3.5–5.5, Britton–Robinson buffer (BRB) solution at pH 2.0–10.0, and phosphate buffer (PB) solution at pH 2.0–8.0. The drug-free synthetic human serum was provided from Sigma Aldrich. The urine sample for this study was taken from a healthy volunteer.

2.3. Preparation of MCS/SWCNT-COOH/GCE

Before modification, bare GCE was polished with alumina slurry, then rinsed with distilled water, and kept at room temperature until drying. In addition, 0.5 mg stock SWCNT-COOH suspension was prepared in 1 mL dimethylformamide (DMF) stirred with ultrasonic bath for 3 h. Furthermore, 100 µL of mesoporous carbon solution and 100 µL of SWCNT-COOH solution were mixed and formed an MCS/SWCNT-COOH solution ultrasonicated for 2 h. Then, 5 µL of MCS/SWCNT-COOH solution were dropped onto the pre-cleaned GCE. The MCS/SWCNT-COOH/GCE dried at 45 °C in a vacuum oven for 15 min. The fabricated MCS/SWCNT-COOH/GCE was used to determine IH from the buffer, tablet, and biological samples.

2.4. Preparation of Pharmaceutical and Biological Samples

A human urine sample was collected to prepare the standard solution of urine. To analyze the IH in the synthetic serum sample, the IH was spiked in the synthetic human serum sample. For preparing a stock solution of 1.0 × 10⁻³ M IH in human urine and a serum sample, 5.4 mL of acetonitrile, 3.6 mL of urine/serum, and 1.0 mL of 1.0 × 10⁻² M IH were added in centrifuge tubes and mixed thoroughly. Then, the prepared mixture solutions were centrifuged for 30 min at 3500 rpm, and the supernatants were then taken carefully [25].
Ten Coralan® tablets were weighed and ground into a fine powder in a mortar. In addition, a 1.0 × 10⁻³ M stock solution was prepared with 103.49 mg powder dissolved in water and sonicated. Some aliquots of the clear supernatant of tablet solution were prepared and diluted with the selected buffer solution.

3. Results and Discussion

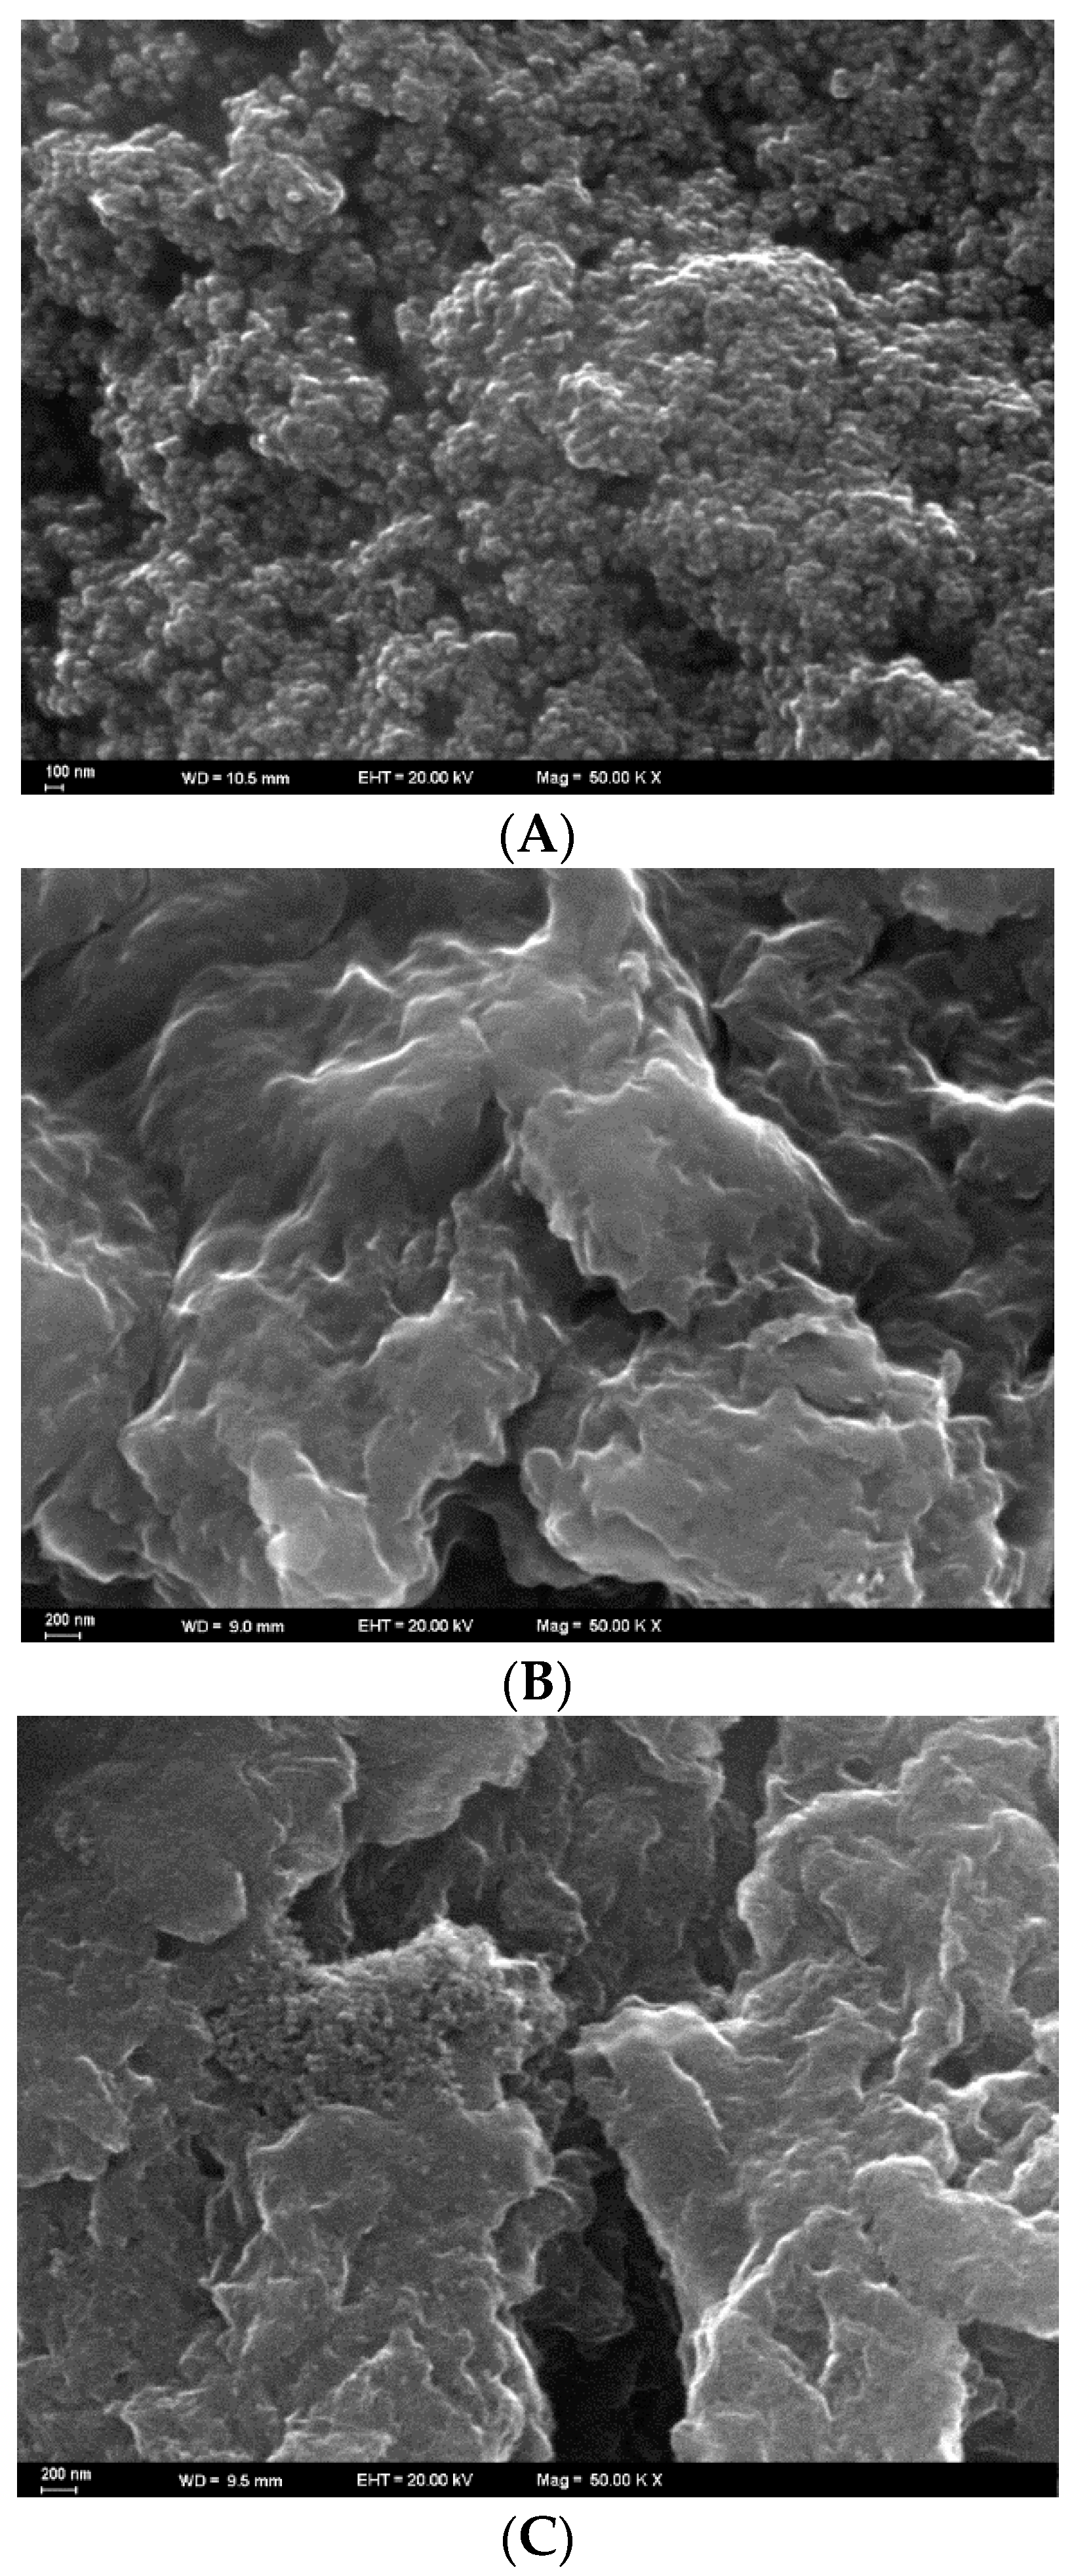
3.1. Characterization of the Modification Materials

The surface of the modification agents used was investigated by SEM. SEM is the most common type of analysis utilized to define the surface morphology of materials [26]. SEM images of used materials are shown in Figure 1. In Figure 1A, similar porous structures from MCS material, Figure 1B compact film from SWCNT-COOH, and Figure 1C the mixture of these materials is clearly shown. In Figure 1C, the surface is indented and porous, so electrode activity is better, and higher responses are obtained.

3.2. Effect of MCS/SWCNT-COOH

For obtaining the best modification agent, different nanomaterials such as Ag, Pt, Au, multi-walled carbon nanotubes (MWCNTs), carboxylated group linked multi-walled carbon nanotube (MWCNT-COOH), amine group linked multi-walled carbon nanotubes (MWCNT-NH2), MCS, SWCNT-COOH, and some mixtures of these materials were investigated (Figure 2B). DPV voltammograms of 2 × 10⁻⁵ M IH in pH 3.0 BRB for the bare GCE, SWCNT-COOH/GCE, MCS/GCE, and MCS/SWCNT-COOH/GCE were compared to examine the electrochemical behavior of IH (Figure 2A). When only SWCNT-COOH and MCS are used, there is an improvement in the peak current of IH compared to bare GCE. However, if MCS/SWCNT-COOH is used as a modification agent, there is a distinct enhancement in the peak signal of IH. Therefore, the mixture of SWCNT-COOH and MCS was chosen as a modification agent.

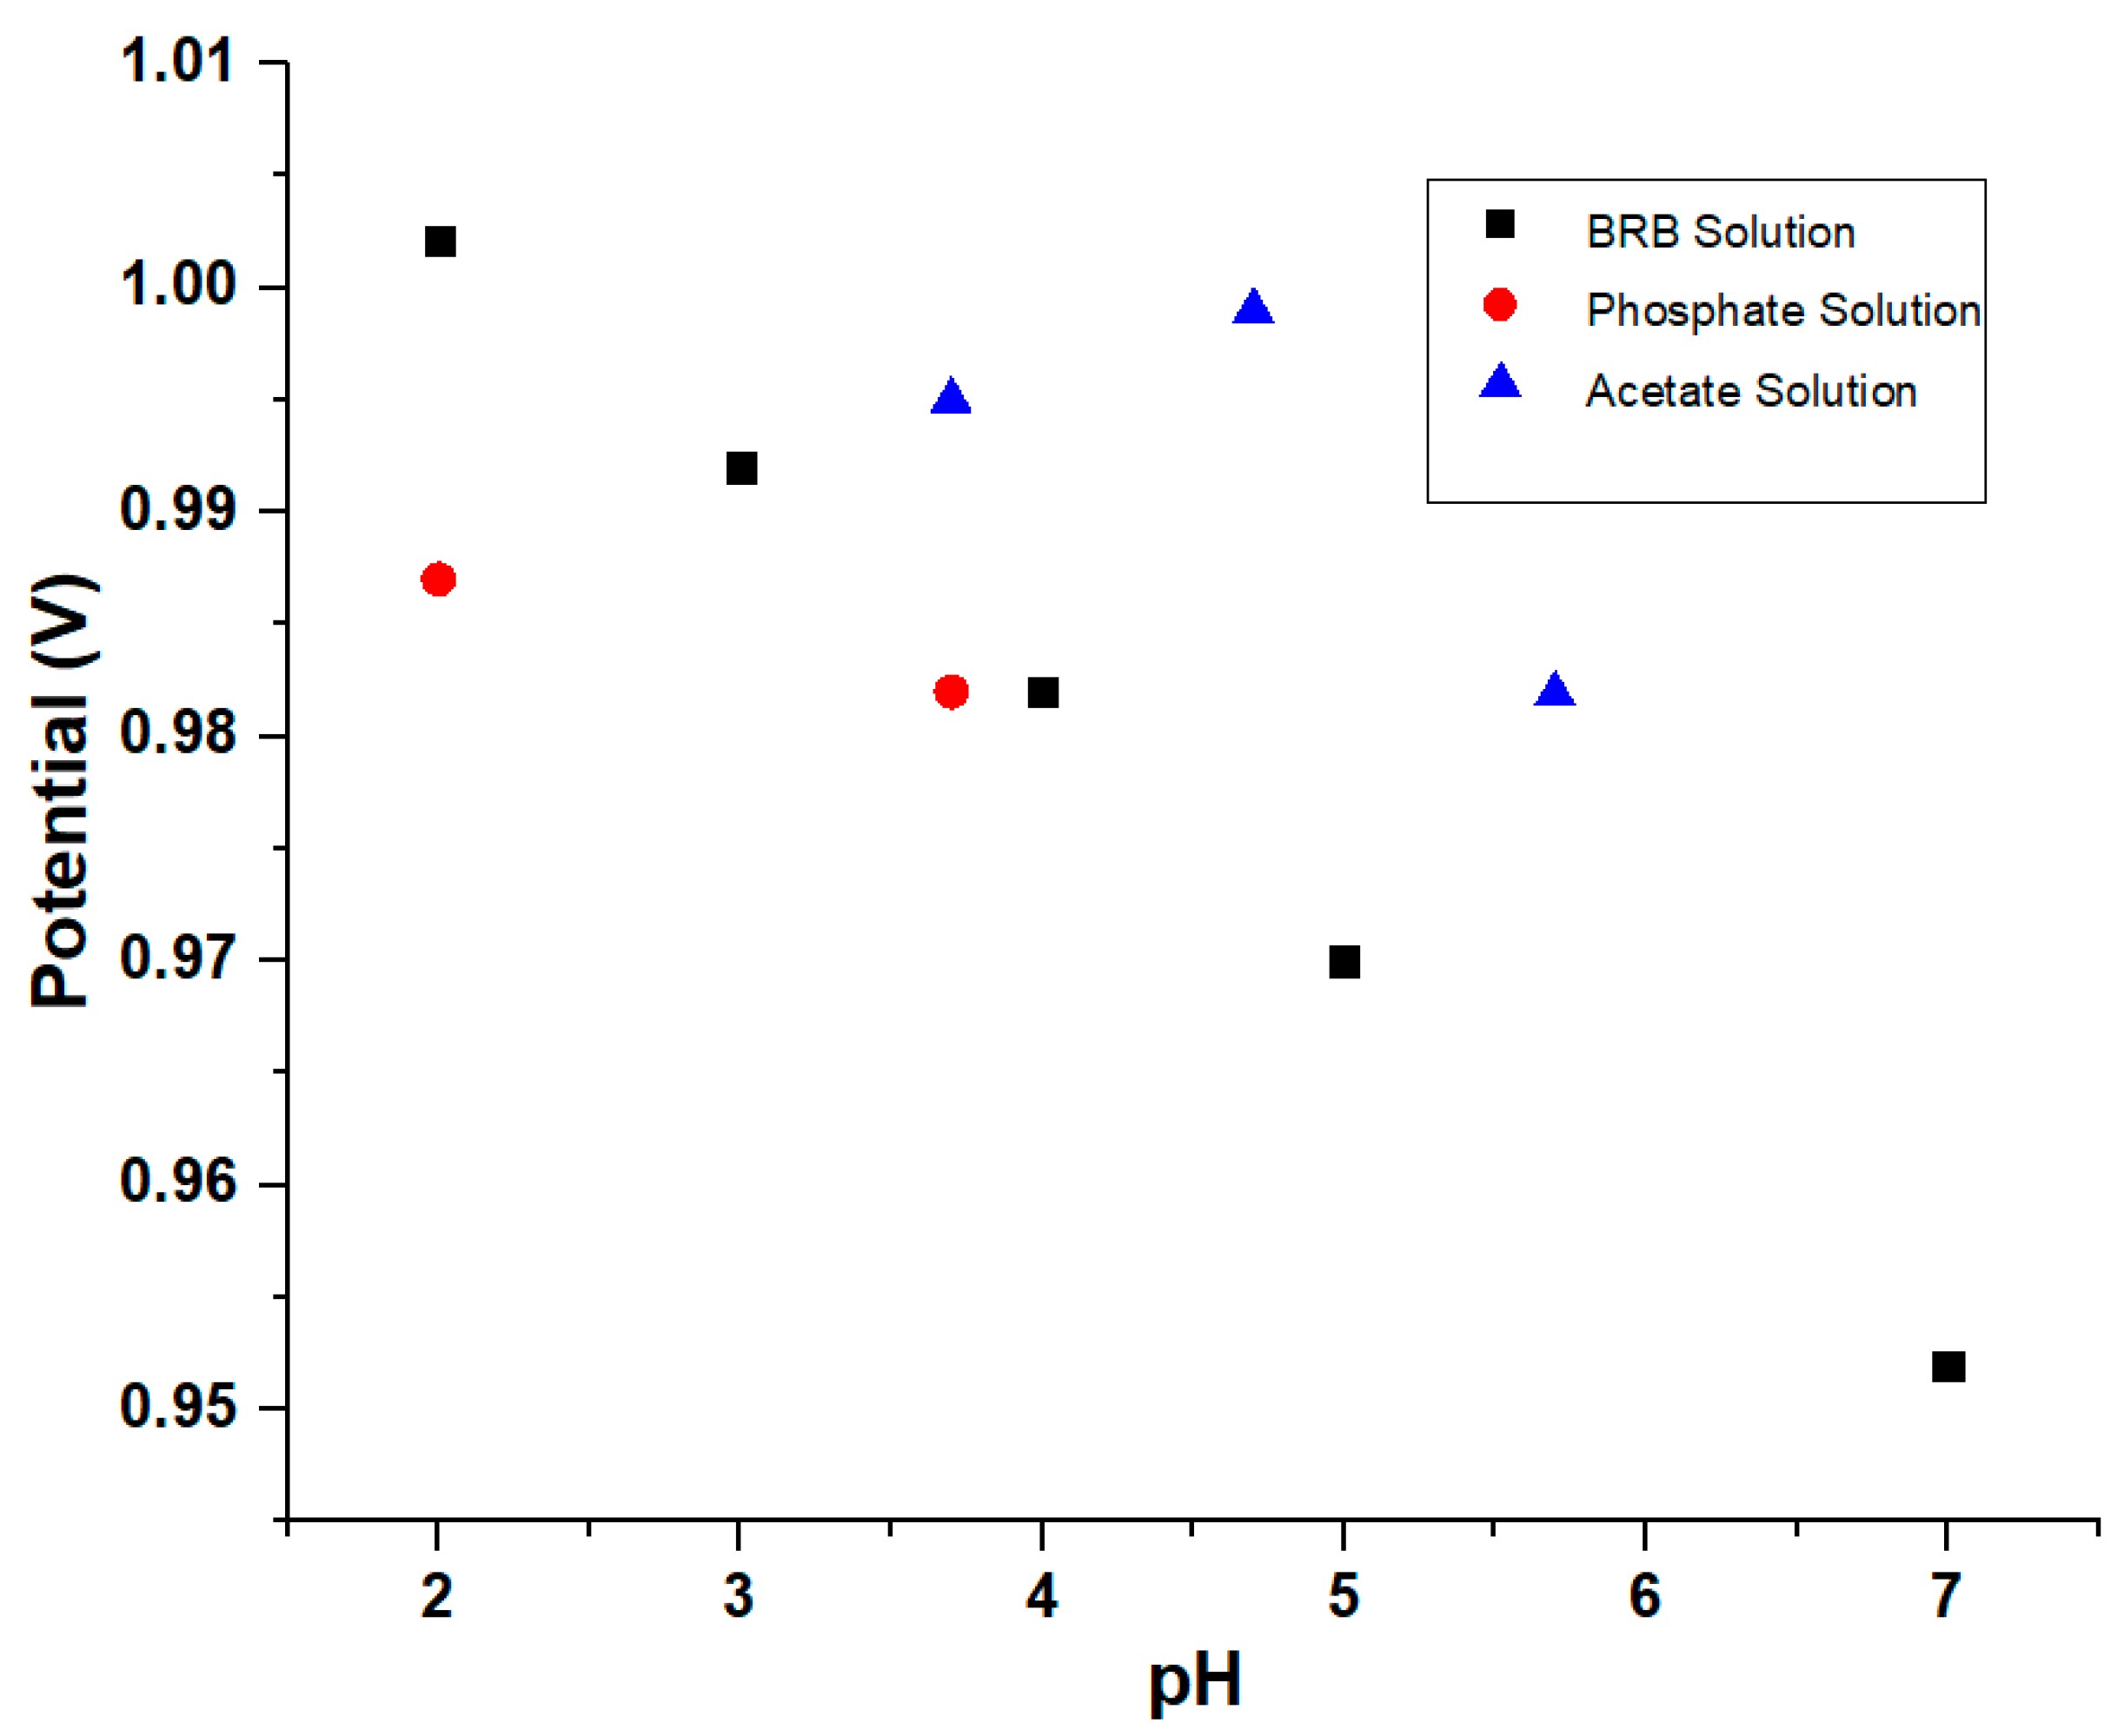
3.3. Effect of the pH

The electrochemical behavior of IH was examined over a pH range between 2.0 and 7.0 for DPV in various buffer media, including BRB, acetate, and phosphate buffers. Peak current (ip) vs. pH and peak potential (Ep) vs. pH graphs were achieved from pH studies (Figure 3). For BRB buffer solutions (pH 2.0–7.0), when the pH increases, voltammetric peak potential decreases. This is because protons get involved in the electrochemical reaction [27]. The plot of the Ep vs. pH gives the straight lines with the equation given below:
Ep (mV) = 1020–10 pH; r = 0.998 (pH 2.0–7.0) at MCS/SWCNT-COOH/GCE using DPV.
The best peak shape and highest current value were observed in the pH 3.0 BRB solution being utilized. Therefore, for the following measurements, pH 3.0 BRB solution was selected as a supporting electrolyte.

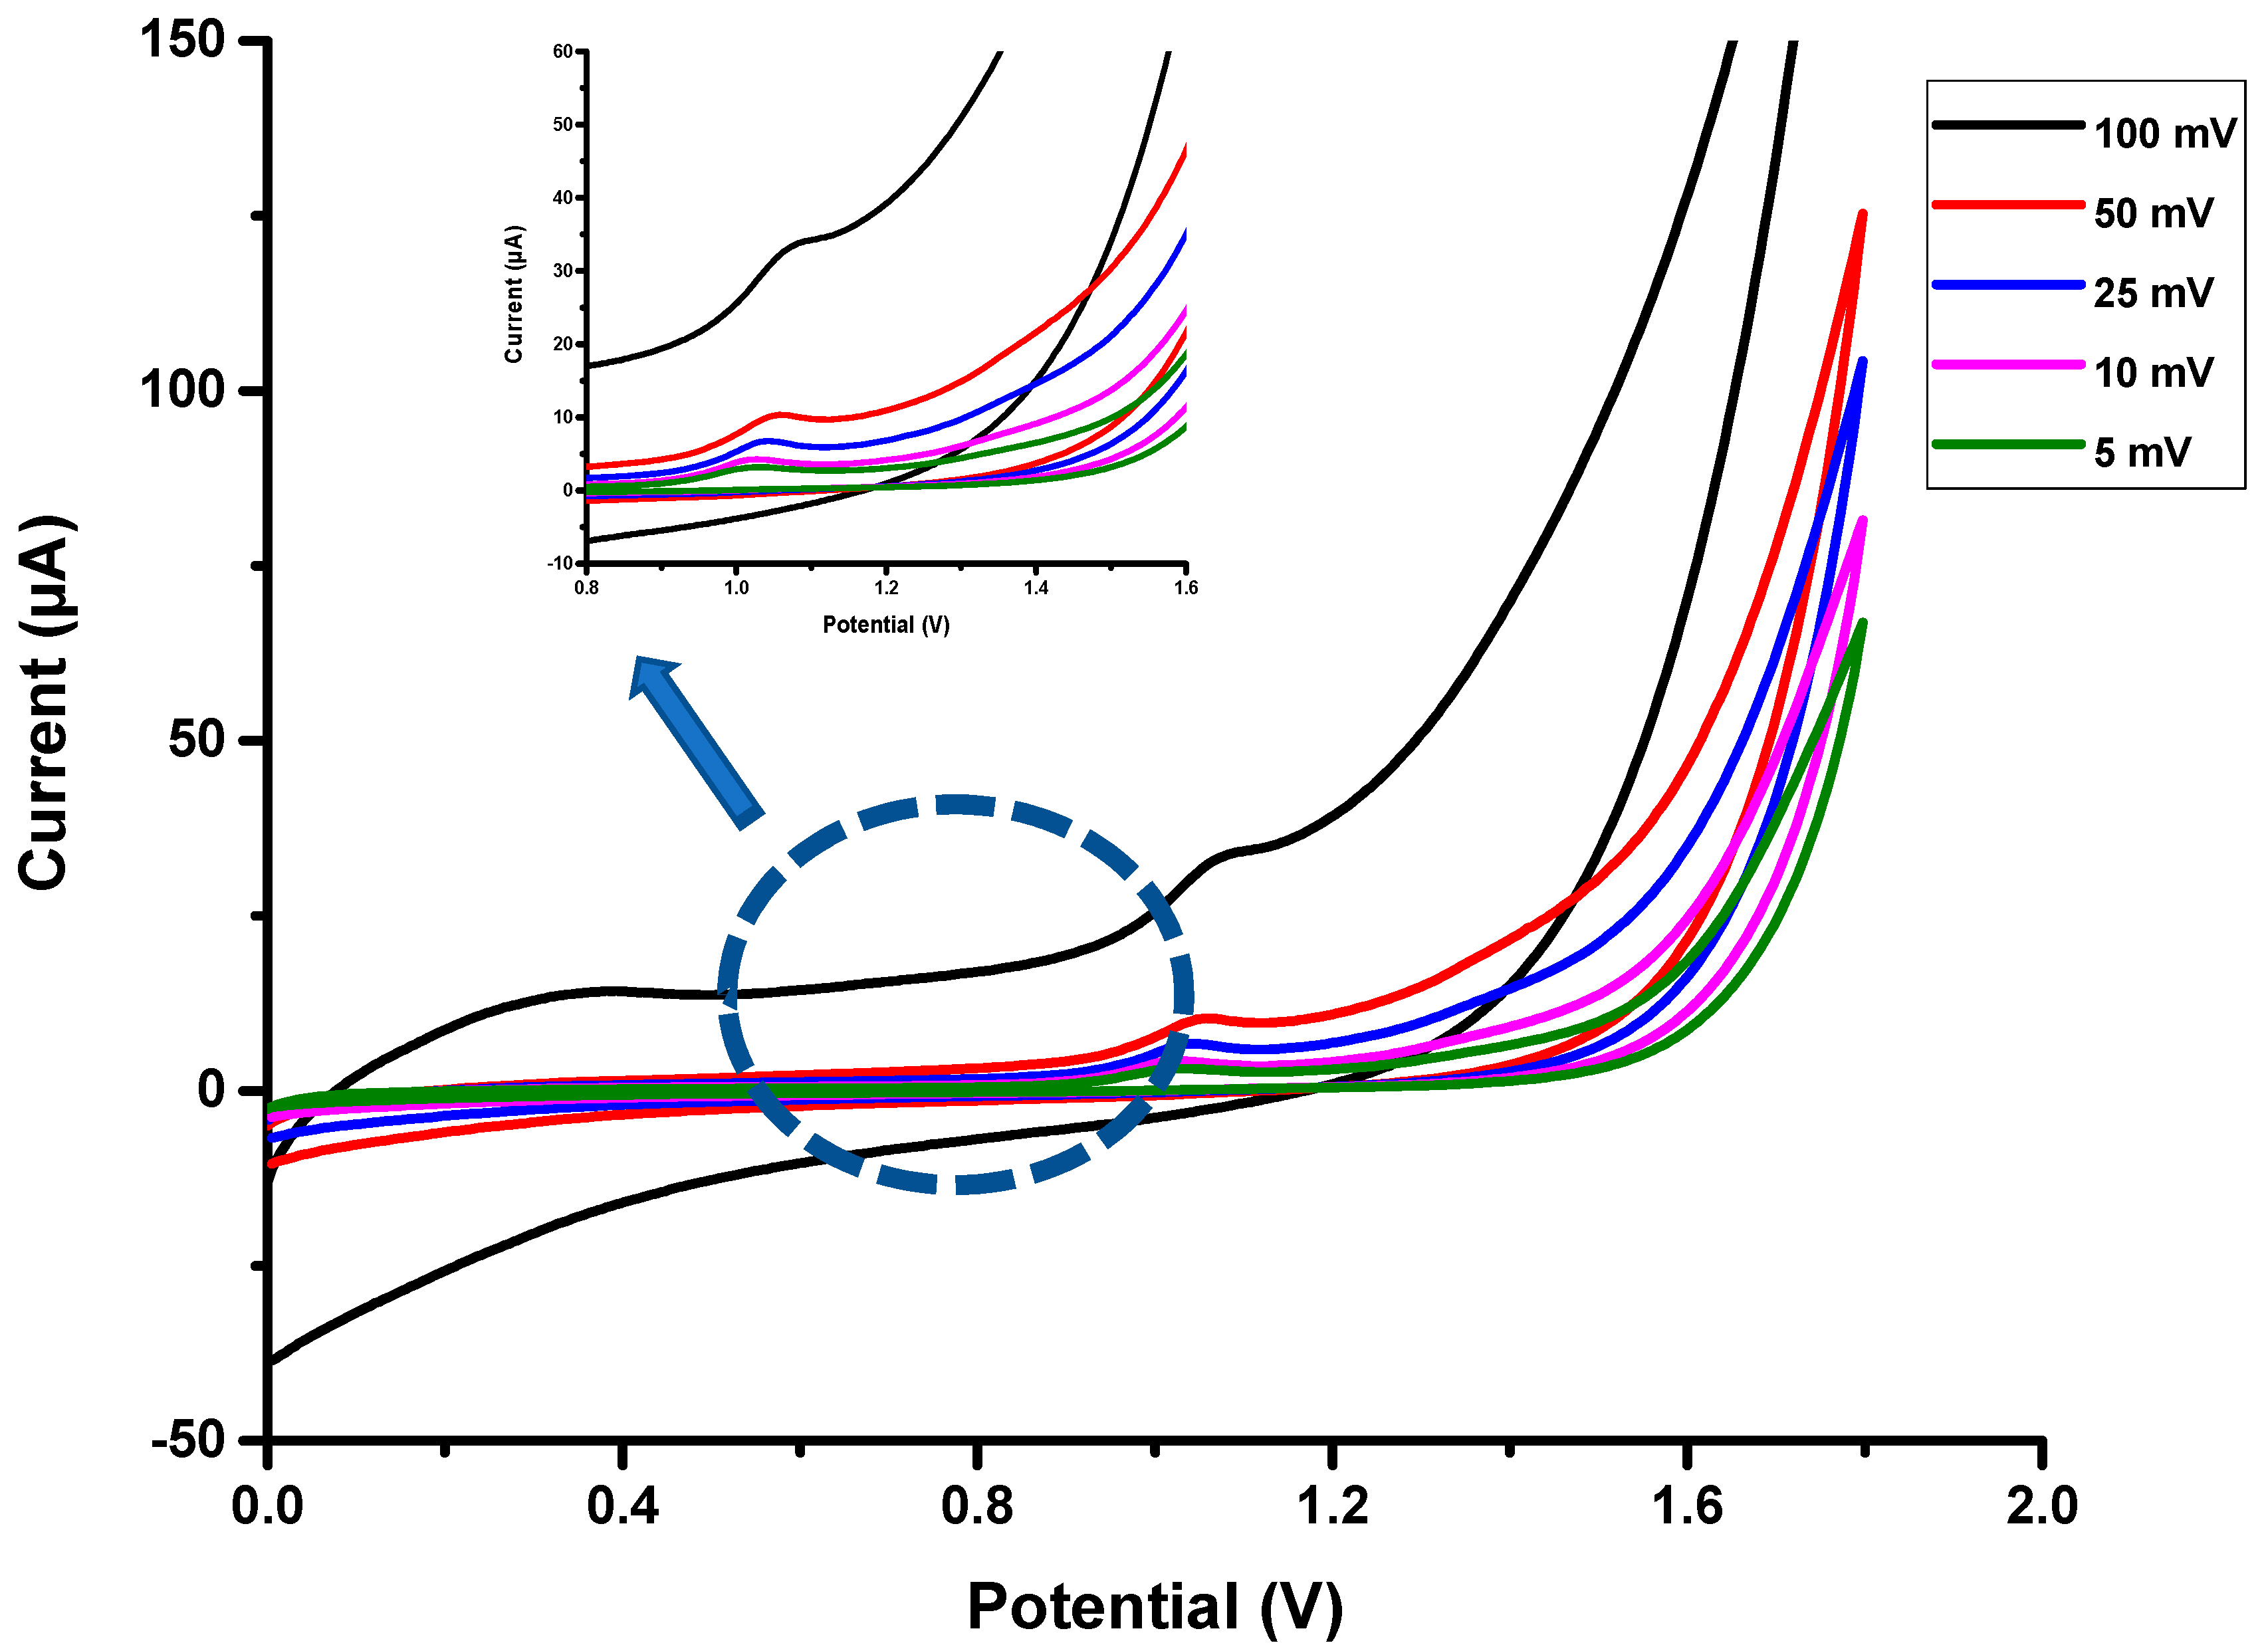
3.4. Effect of Scan Rate on MCS/SWCNT-COOH/GCE

With cyclic voltammetry, an electrochemical mechanism based on the relationship between scan rate and the peak current was highlighted. The peak values were measured within the ranges of 5 to 100 mV s−1 on MCS/SWCNT-COOH/GCE in pH 3.0 BRB with 1 × 10⁻⁵ M IH (Figure 4).
Peak current is linearly correlated with square root of the scan rate as shown in this equation:
  • Ip (µA) = 0.1971 ν1/2 (mV s−1) + 0.9414; r = 0.988 (n = 5) at MCS/SWCNT-COOH/GCE
  • log ip (µA) = 0.262 log ν (mV s−1) − 6.0674; r = 0.996 (n = 5) at MCS/SWCNT-COOH/GCE
According to the above equation, the logarithm of oxidation peak values versus the logarithm of scan rates demonstrated a linear relationship with a slope of 0.262 that results in a diffusion-controlled process [27].
According to Laviron, Ep can be defined by the following equation [28]:
Ep (mV/s) = E0′ + (2.303RT/αnF) log (RTk0/αnF) + (2.303RT/ αnF) log υ (mV/s)
  • α: the transfer coefficient,
  • k0: standard the heterogeneous rate constant v: scan rate,
  • E0: formal potential,
  • R: gas constant,
  • T: temperature,
  • F: Faraday constant,
  • n: the number of electrons that are involved in electro-oxidation of IH.
Ep vs. log v graph was found as Ep = 0.08 logv + 0.93 and n was calculated as 1.18 from this equation [28]. Therefore, 1.18 electron is transferred during the electrochemical reaction.
In addition, the n value can be calculated from this equation [29].
∆Ep = Ep − Ep/2 = (47.7/αn) mV, where ∆Ep is calculated from the difference between the Ep and half-wave potential (Ep/2), and α is used as 0.5. n value was found as 1.48; these two n value calculations verified each other.

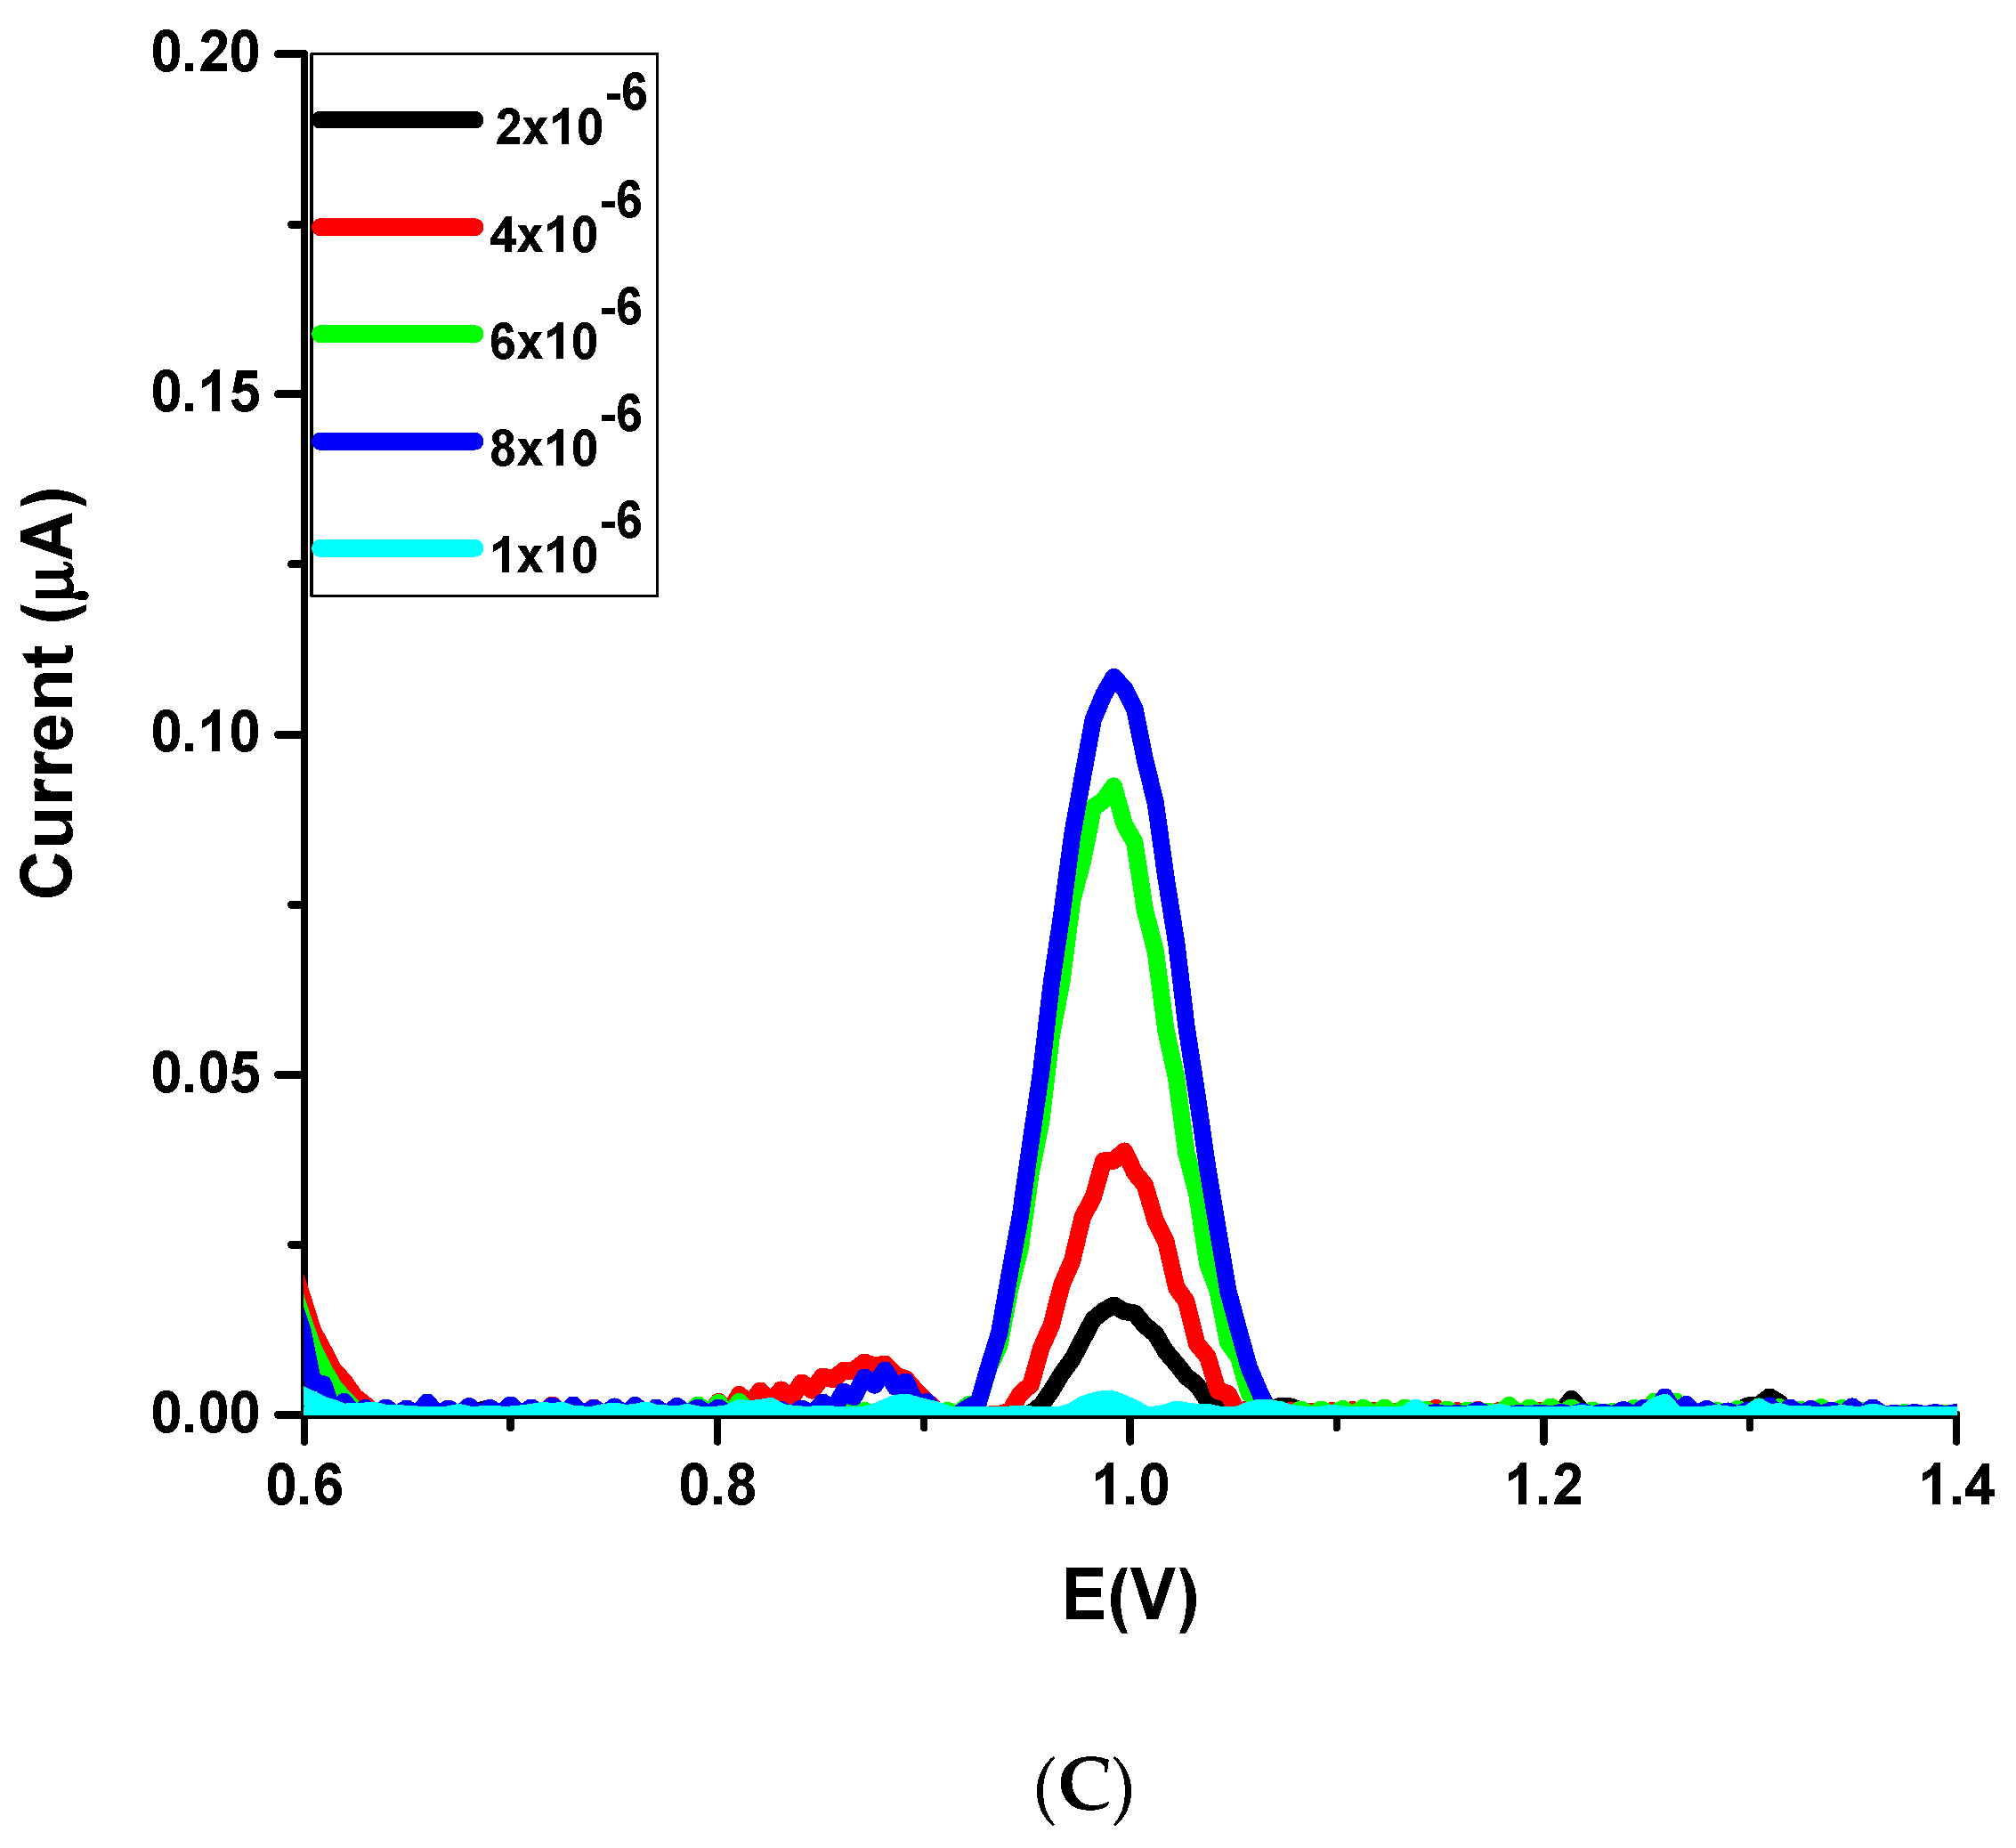
3.5. Analytical Characterization and Validation of the Method

After determining optimal conditions, quantitative analysis of IH was investigated with a linear correlation between the peak current and concentration. The voltammograms of IH from 1.0 × 10⁻⁶ to 1.0 × 10⁻⁵ M in buffer solution are shown in Figure 5A, and the linearity was achieved with the following equation:
ip (A) = 0.0738 C (M) − 4 × 10⁻⁸; r = 0.998 (n = 6)
Validation parameters are given in Table 1 by assessing the accuracy, LOD, the limit of quantification (LOQ), precision, and recovery. LOD and LOQ were determined from the equations of LOD = 3 s/m and LOQ = 10 s/m using the standard deviation of the response and the slope of the calibration curve for 1.0 × 10⁻⁶ M [24].

3.6. Determination of IH in Tablet Dosage Form, Spiked Serum, and Urine Samples Using the MCS/SWCNT-COOH/GCE

The proposed DPV method was performed to analyze IH quantitatively in tablet dosage form “Coralan® tablet”, spiked serum, and urine samples. A calibration graph was formed for human serum and urine analysis with a stock solution of 1 × 10⁻⁴ M IH. For serum analysis, the voltammograms of IH are linear from 1.0 × 10⁻⁶ to 1.0 × 10⁻⁵ M in pH 3.0 BRB solution shown in Figure 5B. The linearity was given with the following equation:
ip (A) = 0.0367 C (M) + 4 × 10⁻⁸; r = 0.998 (n = 5)
For urine analysis, the voltammograms of IH are linear from 1.0 × 10⁻⁶ to 8.0 × 10⁻⁶ M in pH 3.0 BRB solution shown in Figure 5C. The linearity was given with the following equation:
ip (A) = 0.0152 C (M) − 1 × 10⁻⁸; r = 0.999 (n = 5)
In Table 2, recovery studies were performed to determine the IH in spiked serum, urine, and tablet dosage form. The results of recovery % and bias % are acceptable limits. ICH Guideline was followed for calculation of bias and RSD. Bias % values are calculated and have been shown for recovery tests [24,30,31]. The developed method and sensor could be applied with high precision according to obtained RSD% results.

4. Conclusions

The MCS/SWCNT-COOH/GCE nanosensor was fabricated for the IH assay by an electrochemical pulse technique. The proposed method has demonstrated superiority over other methods that used CPE. The advantages of this method are easy, fast electrode surface preparation, and long-term stability. DPV showed a sensitive and rapid IH response from buffer solution, pharmaceutical dosage form, and biological samples. SEM investigated the homogenous form of MCS and composite structure of MCS/SWCNT-COOH. When choosing the right material for the electrode surface design, SWCNT-COOH/MCS composite, MCS, and SWCNT-COOH were tested separately. The composite of MCS and SWCNT-COOH could increase the response of IH when compared to the bare GCE response. To obtain the best media for the assay of IH, different buffers have been tested. pH 3.0 BRB was showed to be the most sensitive response for the IH anodic scanning investigations. According to the pH scanning study of IH, linearity was obtained between pH 2.0 and 7.0. The developed sensor was applied successfully to determine IH from the tablet dosage form and biological samples. The analytical performances of the sensor showed that it could determine IH concentration from standard solution, serum, and urine samples with LOD value 0.147 µM, 0.231 µM, and 0.166 µM, respectively. The precision test was applied, and high recoveries were observed. The advanced sensor and method could be applied in further industrial, clinical applications.

Author Contributions

Conceptualization, M.Y., L.K., G.O.; methodology, M.Y., L.K., G.O., N.K.B.; software, M.Y., L.K., G.O.; validation, M.Y., L.K., G.O.; formal analysis, M.Y., L.K., G.O.; ınvestigation, M.Y., L.K., G.O.; resources, M.Y., L.K., G.O., N.K.B.; data curation, L.K., G.O., N.K.B.; writing—original draft preparation, M.Y., L.K., G.O., N.K.B.; writing—review and editing, S.A.O., N.K.B.; supervision, S.A.O.; project administration, S.A.O., N.K.B.; funding acquisition S.A.O. All authors have read and agreed to the published version of the manuscript.

Funding

This research received no external funding.

Institutional Review Board Statement

Not applicable.

Informed Consent Statement

Not applicable.

Data Availability Statement

Not applicable.

Conflicts of Interest

The authors declare no conflict of interest.

References

  1. Tse, S.; Mazzola, N. Ivabradine (Corlanor) for heart failure: The first selective and specific if inhibitor. Pharm. Ther. 2015, 40, 810–814. [Google Scholar]
  2. Badu-Boateng, C.; Jennings, R.; Hammersley, D. The therapeutic role of ivabradine in heart failure. Ther. Adv. Chronic Dis. 2018, 9, 199–207. [Google Scholar] [CrossRef]
  3. Zhou, X.-B.; Zhu, J.-R.; Liu, J.-L.; Jin, Z.-P.; Tanga, F.-Y.; Hu, X.-R. Crystal structures and properties of two hydrated conglomerate forms of the heart-rate-lowering agent ivabradine hydro chloride. Acta Crystallogr. Sect. C Struct. Chem. 2019, 75, 545–553. [Google Scholar] [CrossRef]
  4. Wang, F.; Hu, S. Electrochemical sensors based on metal and semiconductor nanoparticles. Microchim. Acta 2009, 165, 1–22. [Google Scholar] [CrossRef]
  5. Nayl, A.A.; Abd-Elhamid, A.I.; El-Moghazy, A.Y.; Hussin, M.; Abu-Saied, M.A.; El-Shanshory, A.A.; Soliman, H.M.A. The nanomaterials and recent progress in biosensing systems: A review. Trends Environ. Anal. Chem. 2020, 26, e00087. [Google Scholar] [CrossRef]
  6. Rahman, M.M.; Ara, M.G.; Alim, M.A.; Uddin, M.S.; Najda, A.; Albadrani, G.M.; Sayed, A.A.; Mousa, S.A.; Abdel-Daim, M.M. Mesoporous carbon: A versatile material for scientific applications. Int. J. Mol. Sci. 2021, 22, 4498. [Google Scholar] [CrossRef]
  7. Wang, Z.; Dai, Z. Carbon nanomaterial-based electrochemical biosensors: An overview. Nanoscale 2015, 7, 6420–6431. [Google Scholar] [CrossRef] [PubMed]
  8. Siqueira, J.R.; Oliveira, O.N. Carbon-Based Nanomaterials in: Nanostructures; John Wiley & Sons, Inc.: Hoboken, NJ, USA, 2016; pp. 233–249. [Google Scholar] [CrossRef]
  9. Ahmed, J.; Rashed, M.A.; Faisal, M.; Harraz, F.A.; Jalalah, M.; Alsareii, S.A. Novel SWCNTs-mesoporous silicon nanocomposite as efficient non-enzymatic glucose biosensor. Appl. Surf. Sci. 2021, 552, 149477. [Google Scholar] [CrossRef]
  10. Mashhadizadeh, M.H.; Talemi, R.P. Synergistic effect of magnetite and gold nanoparticles onto the response of a label-free impedimetric hepatitis B virus DNA biosensor. Mater. Sci. Eng. C 2016, 59, 773–781. [Google Scholar] [CrossRef]
  11. Aftab, S.; Kurbanoglu, S.; Ozcelikay, G.; Shah, A.; Ozkan, S.A. NH2-Functionalized Multi Walled Carbon Nanotubes Decorated with ZnO Nanoparticles and Graphene Quantum Dots for Sensitive Assay of Pimozide. Electroanalysis 2019, 31, 1083–1094. [Google Scholar] [CrossRef]
  12. Gandi, S.; Manikandan, A.; Rao, S.V. Novel stability indicating rp-uplc method for simultaneous determination of ivabradine and metoprolol drug materials in bulk and their pharmaceutical dosage forms. Res. J. Pharm. Technol. 2020, 13, 250–254. [Google Scholar] [CrossRef]
  13. Tomić, J.; Ivković, B.; Oljačić, S.; Nikolić, K.; Maljuric, N.; Dani, A.P.; Agbaba, C. Chemometrically Assisted RP-HPLC Method Development for Efficient Separation of Ivabradine and its Eleven Impurities. Acta Chromatogr. 2020, 32, 53–63. [Google Scholar] [CrossRef]
  14. Zhang, Y.; Zhu, M.; Xie, S.; Ye, X.; Xu, X. Simultaneous determination of amiodarone, dronedarone, and their principal metabolites in SD rat plasma by UPLC-MS/MS and its application in pharmacokinetics. Arab. J. Chem. 2021, 14, 103300. [Google Scholar] [CrossRef]
  15. Smirnova, L.A.; Tolkachev, B.E.; Ryabukha, A.F.; Suchkov, E.A.; Kuznetsov, K.A.; Magnitskaya, O.V.; Petrov, V.I. Quantitative Determination of Ivabradine and Its N-Demethylated Metabolite in Volunteer Blood and Urine. Pharm. Chem. J. 2019, 53, 275–278. [Google Scholar] [CrossRef]
  16. Ranjha, N.M.; Majeed, A.; Hussain, I.; Rasool, M.F. Quantitative Determination and Validation of Ivabradine-HCl in Pharmaceutical Formulation and Rabbit Plasma by High Performance Liquid Chromatography Method. Curr. Pharm. Anal. 2016, 13, 446–451. [Google Scholar] [CrossRef]
  17. Nowakowska, J.; Pikul, P.; Marszałł, M.; Ciura, K. Application and Validation of Simple Isocratic HPLC-UV-DAD Method with Dual Wavelength Detection for Ivabradine Determination and Its Application in the Study of Stress Degradation. J. Chem. 2017, 2017, 2069571. [Google Scholar] [CrossRef] [Green Version]
  18. Ozkan, S.A. Analytical method validation: The importance for pharmaceutical analysis. Pharm. Sci. 2018, 24, 1–2. [Google Scholar] [CrossRef] [Green Version]
  19. Ozkan, S.A.; Uslu, B. From mercury to nanosensors: Past, present and the future perspective of electrochemistry in pharmaceutical and biomedical analysis. J. Pharm. Biomed. Anal. 2016, 130, 126–140. [Google Scholar] [CrossRef] [PubMed]
  20. Abdel-Haleem, F.M.; Gamal, E.; Rizk, M.S.; Madbouly, A.; el Nashar, R.M.; Anis, B.; Elnabawy, H.M.; Khalil, A.S.G.; Barhoum, A. Molecularly Imprinted Electrochemical Sensor-Based Fe2O3@MWCNTs for Ivabradine Drug Determination in Pharmaceutical Formulation, Serum, and Urine Samples. Front. Bioeng. Biotechnol. 2021, 9, 648704. [Google Scholar] [CrossRef]
  21. Abdel-Haleem, F.M.; Gamal, E.; Rizk, M.S.; el Nashar, R.M.; Anis, B.; Elnabawy, H.M.; Khalil, A.S.G.; Barhoum, A. t-Butyl calixarene/Fe2O3@MWCNTs composite-based potentiometric sensor for determination of ivabradine hydrochloride in pharmaceutical formulations. Mater. Sci. Eng. C 2020, 116, 111110. [Google Scholar] [CrossRef]
  22. Attia, A.K.; Abo-Talib, N.F.; Tammam, M.H. Voltammetric determination of ivabradine hydrochloride using multiwalled carbon nanotubes modified electrode in presence of sodium dodecyl sulfate. Adv. Pharm. Bull. 2017, 7, 151–157. [Google Scholar] [CrossRef] [PubMed]
  23. Ozkan, S.A.; Kauffmann, J.-M.; Zuman, P. Solid Electrodes in Drug Analysis; Springer: Berlin/Heidelberg, Germany, 2015. [Google Scholar] [CrossRef]
  24. ICH Harmonised Tripartite Guideline. Guidance for Industry Q2B Validation of Analytical Procedures: Methodology. 1996. Available online: https://scholar.google.com/scholar?cluster=10623296102212878913&hl=tr&as_sdt=0,5 (accessed on 14 November 2021).
  25. Bilge, S.; Bakirhan, N.K.; Donar, Y.O.; Sinag, A.; Ozkan, S.A.; Okudan, E.Ş. Green synthesis of carbon based biosensor materials from algal biomass for the sensitive detection of vardenafil. J. Electroanal. Chem. 2020, 871, 114286. [Google Scholar] [CrossRef]
  26. Bilge, S.; Dogan-Topal, B.; Atici, E.B.; Sınağ, A.; Ozkan, S.A. Rod-like CuO nanoparticles/waste masks carbon modified glassy carbon electrode as a voltammetric nanosensor for the sensitive determination of anti-cancer drug pazopanib in biological and pharmaceutical samples. Sens. Actuators B Chem. 2021, 343, 130109. [Google Scholar] [CrossRef]
  27. Gosser, D.K., Jr. Simulation and Analysis of Reaction Mechanisms; Wiley-VCH Publishers: Hoboken, NJ, USA, 1993. [Google Scholar]
  28. Laviron, E.J. General expression of the linear potential sweep voltammogram in the case of diffusionless electrochemical systems. J. Electroanal. Chem. Interfacial Electrochem. 1979, 101, 19–28. [Google Scholar] [CrossRef]
  29. Greef, R.; Peat, R.; Peter, L.M.; Pletcher, D.; Robinson, J. Instrumental Methods in Electrochemistry; Ellis Horwood: Chichester, UK, 1990. [Google Scholar]
  30. Ermer, J.; Nethercote, P.W. Method Validation in Pharmaceutical Analysis: A Guide to Best Practice, 2nd ed.; Wiley-VCH: Weinheim, Germany, 2015. [Google Scholar]
  31. Riley, C.M.; Rosanske, T.W. Development and Validation of Analytical Methods; Elsevier: Hoboken, NJ, USA, 1996. [Google Scholar]
Scheme 1. Chemical structure of IH.
Analytica 02 00017 sch001
Figure 1. SEM images of (A) MCS; (B) SWCNT-COOH; (C) MCS/SWCNT-COOH.
Analytica 02 00017 g001
Figure 2. (A) DPV of 2 × 10⁻⁵ M IH at (a) bare GCE, (b) SWCNT-COOH/GCE, (c) MCS/GCE, and (d) MCS/SWCNT-COOH/GCE in pH 3.0 BRB solution; (B) DPV of 2 × 10⁻⁵ M IH at (a) MCS/SWCNT-COOH/GCE, (b) Au/GCE, (c) Ag/GCE, (d) MWCNT-COOH/GCE, (e) Pt/GCE, (f) MWCNT-NH2/GCE, (g) MWCNT/GCE in pH 3.0 BRB solution.
Analytica 02 00017 g002
Figure 3. Graph of Ep vs. pH in BRB solution pH (2.0–7.0), phosphate solution pH (2.0–3.0) and acetate solution pH (3.7, 4.7, 5.7) DPV of 2 × 10⁻⁵ M IH.
Analytica 02 00017 g003
Figure 4. Cyclic voltammograms of scan rate between 5 and 100 mV s−1.
Analytica 02 00017 g004
Figure 5. The obtained DPV at the MCS/SWCNT-COOH/GCE for different concentrations of IH (A) in pH 3.0 BRB, (B) in serum samples, (C) in the urine sample.
Analytica 02 00017 g005aAnalytica 02 00017 g005b
Table 1. Regression data of the calibration curves for determination of IH by DPV.
Standard SolutionSerumUrine
Measured Potential (V)0.970.980.99
Calibration range (M)1 × 10⁻⁶–1 × 10−51 × 10−6–1 × 10−51 × 10−6–8 × 10⁻⁶
Slope (A M−1)0.07380.03670.0152
Intercept (A)−4 × 10−84 × 10−8−10−8
Correlation coefficient0.990.990.99
LOD (M)1.47 × 10−72.31 × 10−71.66 × 10⁻⁷
LOQ (M)4.92 × 10−77.70 × 10−75.58 × 10⁻⁷
Precision (RSD %)1.181.341.44
Table 2. Results achieved for IH determination and recovery from Coralan® tablet, spiked serum, and urine samples by DPV.
Coralan® TabletSerumUrine
Labeled claim (mg)5.00-
Amount found (mg) a4.98-
RSD% 0.95-
Bias%0.39-
Added (mg)5.005.005.00
Found (mg) a4.924.905.01
Average recovery %98.498100.2
RSD% of recovery0.760.871.35
Bias%1.40.420.17
a Obtained from five measurements.
Publisher’s Note: MDPI stays neutral with regard to jurisdictional claims in published maps and institutional affiliations.

