Article

A Validated RP-HPLC Method for the Simultaneous Detection and Quantification of Pyridoxine and Terizidone in Pharmaceutical Formulations

by
Ngabo Yves Musafili
,
Halima Samsodien
and
Marique Elizabeth Aucamp
*
School of Pharmacy, Faculty of Natural Sciences, University of the Western Cape, Robert Sobukwe Drive, Bellville, Cape Town 7530, South Africa
*
Author to whom correspondence should be addressed.
Analytica 2021, 2(4), 206-216; https://doi.org/10.3390/analytica2040018
Submission received: 14 November 2021 / Revised: 8 December 2021 / Accepted: 10 December 2021 / Published: 20 December 2021
(This article belongs to the Section Chromatography)

Abstract

:
Tuberculosis (TB) remains a life-threatening infection, and it is well-known that effective TB treatment is associated with multiple drugs administered to infected patients on a daily basis. Terizidone (TZD) is an anti-TB drug used in the treatment of multi-drug resistant and extensively drug-resistant TB but presents with polyneuropathic adverse effects in some patients. To counteract these adverse effects, TZD is typically prescribed with pyridoxine (PDX), well known as Vitamin B6. As part of a pre-formulation study investigating the potential to co-formulate these two compounds, it became necessary to have a simple and reliable reversed-phase high-performance liquid chromatography (RP-HPLC) method. Optimal, simultaneous separation and detection of TZD and PDX were obtained using an isocratic mobile phase setup, consisting of ultrapure water and acetonitrile (30:70% v/v), with 1 mL glacial acetic acid added to the mobile phase mixture. A Discovery® C18, 150 × 4.6 mm, 5 μm column maintained at ambient temperature was utilized, with a detection wavelength of 260 nm. The method was validated in terms of linearity, accuracy, precision, limit of detection (LOD), limit of quantification (LOQ), specificity, robustness, and solution stability. Validation proved this method to be acceptable and reliable for the simultaneous accurate detection and quantification of TZD and PDX.

1. Introduction

Tuberculosis (TB) is a communicable infectious disease that is caused by Mycobacterium tuberculosis, and it produces silent, latent infection and active disease. It is an infection that mainly affects the lungs (pulmonary TB), but other sites in the human body may also be affected, termed extrapulmonary TB [1]. Currently, on a global level, TB is ranked among the top ten causes of death, and it is the leading cause of death from a single infection [2]. A substantial amount of research is being dedicated to the effective treatment and possible eradication of TB, and the World Health Organization (WHO) has set out an end-TB strategy, which is to reduce TB deaths by 95% and incidence rates by 90% from 2014 to 2035 [2].
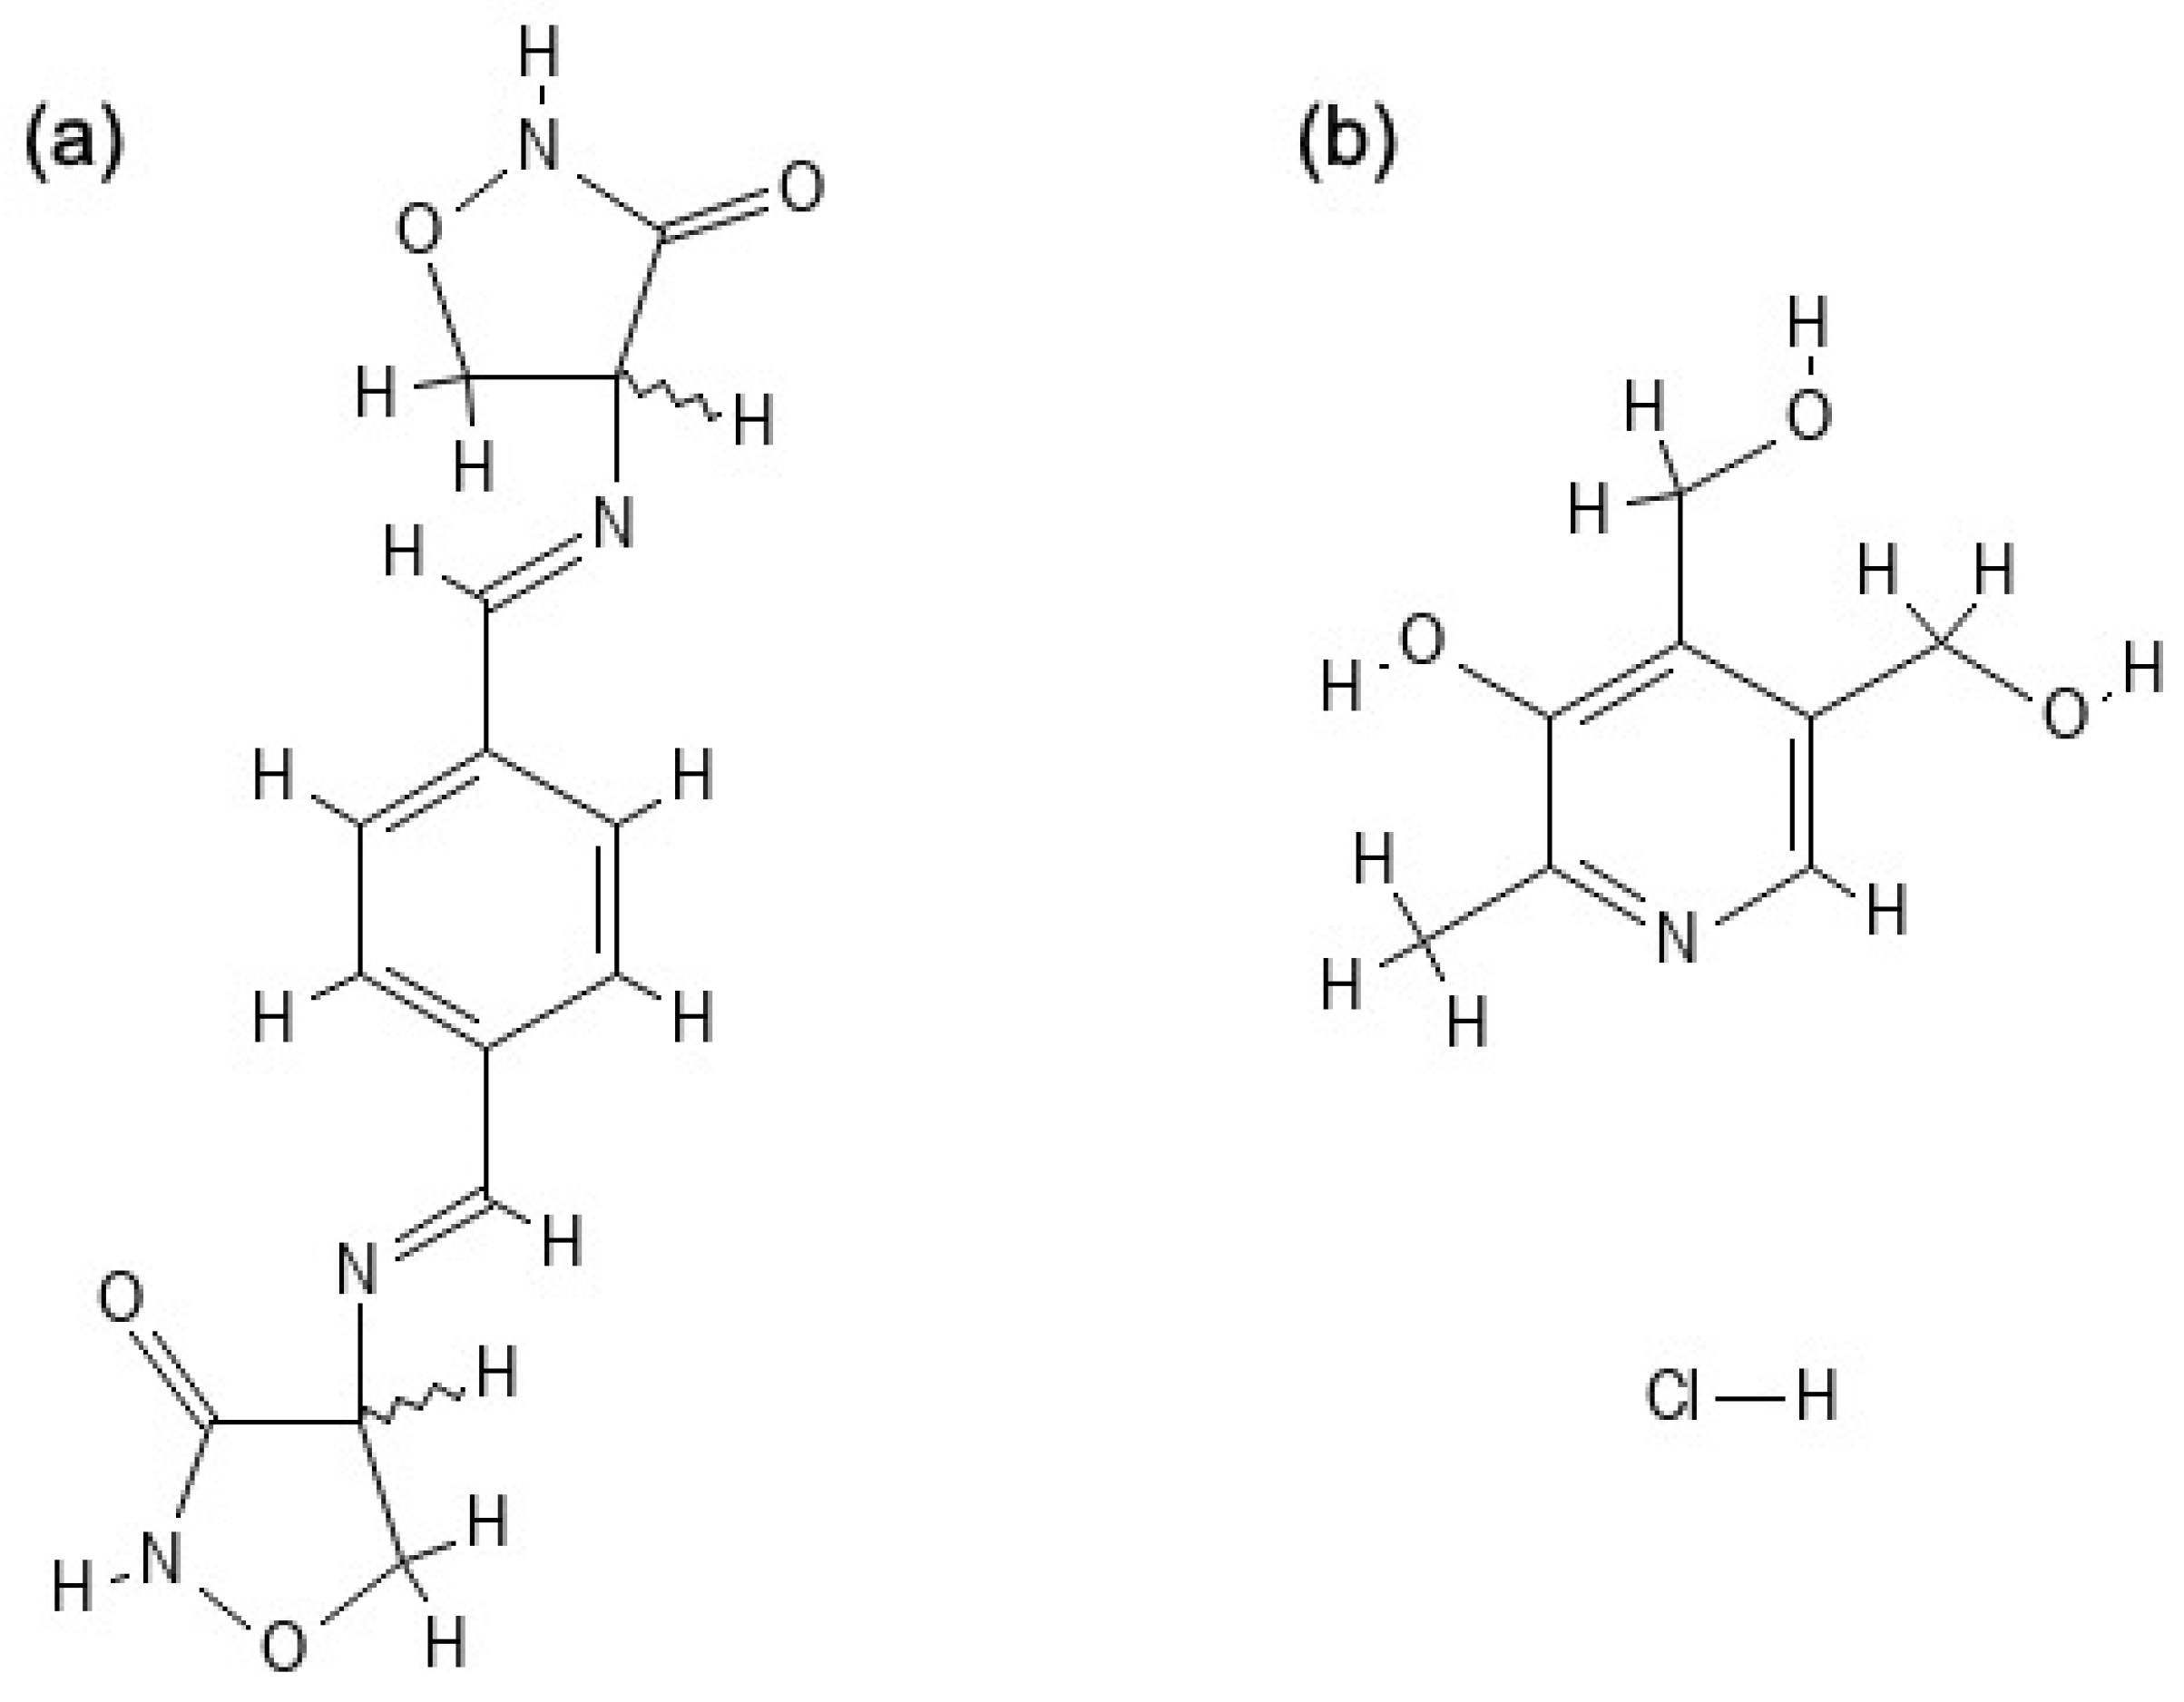
Terizidone (TZD) is a WHO-categorized group IV anti-TB drug (Figure 1a). It is effective against both Mycobacterium tuberculosis and Mycobacterium avium. TZD is used as a second-line treatment option in multi-drug resistant TB (MDR-TB) and extensively drug-resistant TB (XDR-TB) for non-psychotic adult or pediatric patients. However, it is principally known to cause polyneuropathic side effects [3,4]. Pyridoxine hydrochloride (PDX), also known as Vitamin B6, is a water-soluble compound involved in several enzymatic reactions in the human body. The molecular structure thereof is depicted in Figure 1b. It is prevalent in brewer’s yeast, eggs, chicken, carrots, fish, meat, peas, wheat germ, and walnuts. A vitamin B6 deficiency may cause anemia, nerve damage, seizures, skin problems, and sores in the mouth [5,6]. It is recommended that patients considered to be at risk for developing polyneuropathy, such as those with alcohol dependency, malnutrition, diabetes, and human immunodeficiency virus infection, receive daily PDX supplementation. It is often prescribed to TB patients taking isoniazid and TZD to reduce the occurrence of polyneuropathic side effects [7,8]. TZD is a poorly studied drug, and very little is known of its solubility and physico-chemical properties. In order to investigate the physico-chemical properties of a drug, it is necessary to quantify and qualify the drug under investigation. During a physico-chemical and compatibility study involving the combination of TZD and PDX, it became necessary to have a sensitive analytical method that would allow the simultaneous detection of the two compounds. Currently, there are only three literature sources discussing the HPLC analysis of TZD. One of these studies reports the detection and quantification of TZD in human plasma, utilizing a gradient elution setup [9], another reports a stability-indicating RP-HPLC method for the determination of TZD from bulk material [10], and the third study reports the impurity profiling of TZD using HPLC in combination with mass spectrometry [11]. Presently, no study reporting the simultaneous detection and quantification of TZD and PDX exists. Because these two drugs are typically prescribed together, the possibility of the development of a suitable fixed-dose combination dosage form might bring relief to the significant pill-burden that TB patients experience. The need for a sensitive, simple, cost-effective as well as stability-indicating RP-HPLC method was thus identified, which led to the development and validation of this method.
The validation of a simple and cost-effective HPLC method, which allows the simultaneous detection of TZD and PDX when present in the proposed diluent and in aqueous buffered media (pH 1.2, 4.5, and 6.8), typically used in pharmaceutical quality control testing, is described here.

2. Materials and Methods

2.1. Reagents

TZD bulk material was an in-kind donation from Chemical Process Technologies (Pretoria, South Africa), and a TZD-certified reference standard (lot number: 2-MJK-168-2) with a purity of 99.5% (Toronto Research Chemicals, Ontario, Canada) was purchased from Industrial Analytical (Johannesburg, South Africa). PDX, dimethyl sulfoxide (DMSO), sodium hydroxide (NaOH), hydrochloric acid (HCl), anhydrous sodium acetate, disodium hydrogen orthophosphate, potassium dihydrogen orthophosphate, and glacial acetic acid were purchased from Sigma-Aldrich (Johannesburg, South Africa). For mobile phase, standard, and sample solution preparation, ultrapure water with a resistivity of 18.2 MΩ was obtained from a Purite water purification system (Lasec, Johannesburg, South Africa). Chromatography-grade acetonitrile was purchased from Merck (Johannesburg, South Africa).

2.2. HPLC Instrumentation and Chromatographic Conditions

The method development and validation were performed using a Knauer Azura DAD (Berlin, Germany) HPLC system equipped with an autosampler, quaternary pump, photodiode array detector, and column thermostat. The ClarityChrom® software package was used for data processing purposes. A Supelco™ (Bellefonte, PA, USA) Discovery® C18, 150 × 4.6 mm, 5 μm, was used as the column and was purchased from Sigma-Aldrich (Johannesburg, South Africa). Throughout the method validation process, the column temperature was maintained at ambient temperature. An isocratic flow of the mobile phase was utilized, with the mobile phase consisting of 30:70 v/v acetonitrile:HPLC grade water and with 1 mL of glacial acetic acid added to the mixture of acetonitrile:water. The following mobile phase flow rate program was utilized: 0.5 mL/min from 0 to 4 min, followed by an increase of the flow rate to 1.5 mL/min from 4.1 min to 8 min. An injection volume of 10 μL and a detection wavelength of 260 nm were used. A run time of 8 min was employed.

2.3. Preparation of Standard Stock and Working Solutions

Stock solutions containing 200 μg/mL of TZD and of PDX were prepared using a 50:50 v/v acetonitrile:ultrapure water solution as solvent. Due to the poor solubility of TZD in almost all organic solvents, it was necessary to dissolve TZD first in DMSO. For every 10 mg of TZD used, 150 μL of DMSO was used as a solubilizing solvent. Subsequently, serial dilutions of the stock solutions were made to achieve solutions in the concentration range of 50.0–800.0 μg/mL. Solutions were filtered using a 0.22 μm syringe filter.

2.4. Method Validation

Method validation was performed by evaluating the linearity, accuracy, and precision, which included repeatability and reproducibility, limit of detection (LOD), limit of quantification (LOQ), specificity, robustness, and solution stability. The method was validated based on the International Conference on Harmonisation (ICH) guideline on the validation of analytical procedures Q2(R1) [14].

2.4.1. Linearity

The linearity of this analytical method was determined by analyzing five standard solutions of varying concentrations in the range of 50.0–800.0 μg/mL for both compounds. Calibration curves for TZD and PDX were achieved by plotting the obtained peak areas versus the concentrations. The obtained correlation plot was used to determine the correlation coefficient (r2), slope, and intercept associated with each compound.

2.4.2. Accuracy

The accuracy of this analytical method was investigated through recovery studies, which were performed by the spiking of a standard solution, resulting in five solutions at the following concentration levels: 50, 100, 200, 300, and 400 μg/mL for both TZD and PDX. These solutions were analyzed against a reference solution of known concentration at 100% concentration level. The percentage recovery for TZD and PDX at each concentration level was subsequently quantified.

2.4.3. Precision

The precision associated with this analytical method was determined on two levels: repeatability, also termed intra-assay precision, and reproducibility, also termed intermediate precision. Method precision was determined over a series of measurements of a single sample and was thus conducted by analyzing six replicates of solutions containing 200 μg/mL of TDZ and PDX in combination. Reproducibility (inter-day precision) is based on variation, which may include the variation obtained on different days, associated with different analysts or equipment [14]. The reproducibility of both TZD and PDX analyzed using this method was determined through a consecutive analysis across three days with solutions containing 200 μg/mL TDZ and PDX in combination.

2.4.4. Limit of Detection (LOD) and Limit of Quantification (LOQ)

During LOD and LOQ determinations, TZD and PDX were analyzed across a concentration range of 50.00–800.00 μg/mL. Subsequently, the LOD and LOQ for TZD and PDX were calculated based on the standard deviation of the response and the slope as recommended by the ICH guidelines on analytical method development and validation [14], using ANOVA statistical analysis and applying the following equations:
LOD = 3.3σ/b
LOQ = 10σ/b
where σ is the standard deviation of the response values across the concentration range used to determine linearity and range of the analytical method and b is the slope of the calibration curve.

2.4.5. Specificity

First, the respective peak of each compound was identified through the analysis of samples, containing only one compound at a time. Subsequently, TZD and PDX were combined, and these solutions were analyzed to ascertain whether a shift in retention time could be identified or whether there was any other peak interference due to the combination. Further to this, the specificity of both compounds was studied when combined with typical pharmaceutical dissolution media. Different solvents, namely hydrochloric acid (pH 1.2), buffered distilled water (pH 4.5 and pH 6.8), and pure distilled water, were injected separately to ascertain whether any peak interference would occur once TZD and PDX were diluted in these solvents.

2.4.6. Robustness

During the validation process, the robustness of the method was analyzed by deliberate adjustment of the following parameters: column temperature ranging from ambient (25 °C ± 0.3 °C) to 40 °C ± 0.3 °C, and a wavelength variation of 230, 250, and 280 nm. The influence of these deliberate changes on peak area, peak symmetry, and retention time for both PDX and TZD was subsequently documented.

2.4.7. Solution Stability

These stability studies were conducted over a period of 48 h, under four storage conditions: photosensitivity, where the sample was exposed to direct sunlight, refrigeration (5 °C ± 0.5 °C), ambient temperature (25 °C ± 2.0 °C), and heat (60 °C ± 2.0 °C). Furthermore, the stability of TZD and PDX in the sample solution was investigated through exposing the solution to stress conditions, which included the addition of 200 μL of acid (0.1N HCl), alkaline (1N NaOH), or oxidation (3% H2O2) to three sample vials. Six HPLC vials containing a solution with a concentration of 200 μg/mL of both TZD and PDX were prepared and analyzed over a period of 48 h.

3. Results

3.1. Linearity

The linearity of this analytical method was established by creating a correlation plot of the obtained peak areas versus the TZD and PDX concentrations (50.0–800.0 μg/mL). The correlation coefficients (R2) for TZD and PDX were calculated to be 0.9998 and 0.9996, respectively. Figure 2 depicts the regression plots obtained for both compounds. From these plots and the resulting correlation coefficients, it was deduced that an acceptable correlation exists between the analytical response and the analyte concentration.

3.2. Accuracy

The accuracy of this analytical method was investigated through recovery studies, which were performed by the spiking of a standard solution, resulting in five solutions at five concentration levels: 50, 100, 200, 300, and 400 μg/mL. The obtained results are shown in Table 1. Based on the fact that this method was developed to allow the quantification of TZD and PDX as part of a typical pharmaceutical assay and dissolution testing, recovery ranges of 98.0–102.0% (for assay) and 95.0–105.0% (for dissolution) should be applied and adhered to [15]. It was therefore found that the proposed method is sufficiently accurate for the quantification of TZD in the concentration range of 100.0–400.0 μg/mL, and for the quantification of PDX, a concentration range of 50.0–300.0 μg/mL would produce accurate results.

3.3. Precision

Precision was assessed on two levels through the determination of repeatability (intra-day) and intermediate precision (inter-day or reproducibility). Repeatability was assessed across the concentration range of 100.00–300.00 μg/mL for both TZD and PDX and was found to be within the validation limits of ≤2.0% (Table 2). Table 3 and Table 4 outline the inter-day precision testing of TZD and PDX. The percentage recovery and percentage relative standard deviation (%RSD) associated with the recovery of both compounds across a period of three days was found to be acceptable, proving that the method will provide precise analytical outputs when attempted on different days and by different analysts.

3.4. Limit of Detection (LOD) and Limit of Quantification (LOQ)

Equations (1) and (2) were applied for LOD and LOQ determination. For TZD, LOD and LOQ were quantified as 13.49 μg/mL and 44.95 μg/mL, respectively, and for PDX, the LOD and LOQ were quantified as 21.49 μg/mL and 71.64 μg/mL, respectively. This means that an amount lower than 13.49 μg/mL for TZD and 21.49 μg/mL for PDX would not be accurately detected by the developed method.

3.5. Specificity

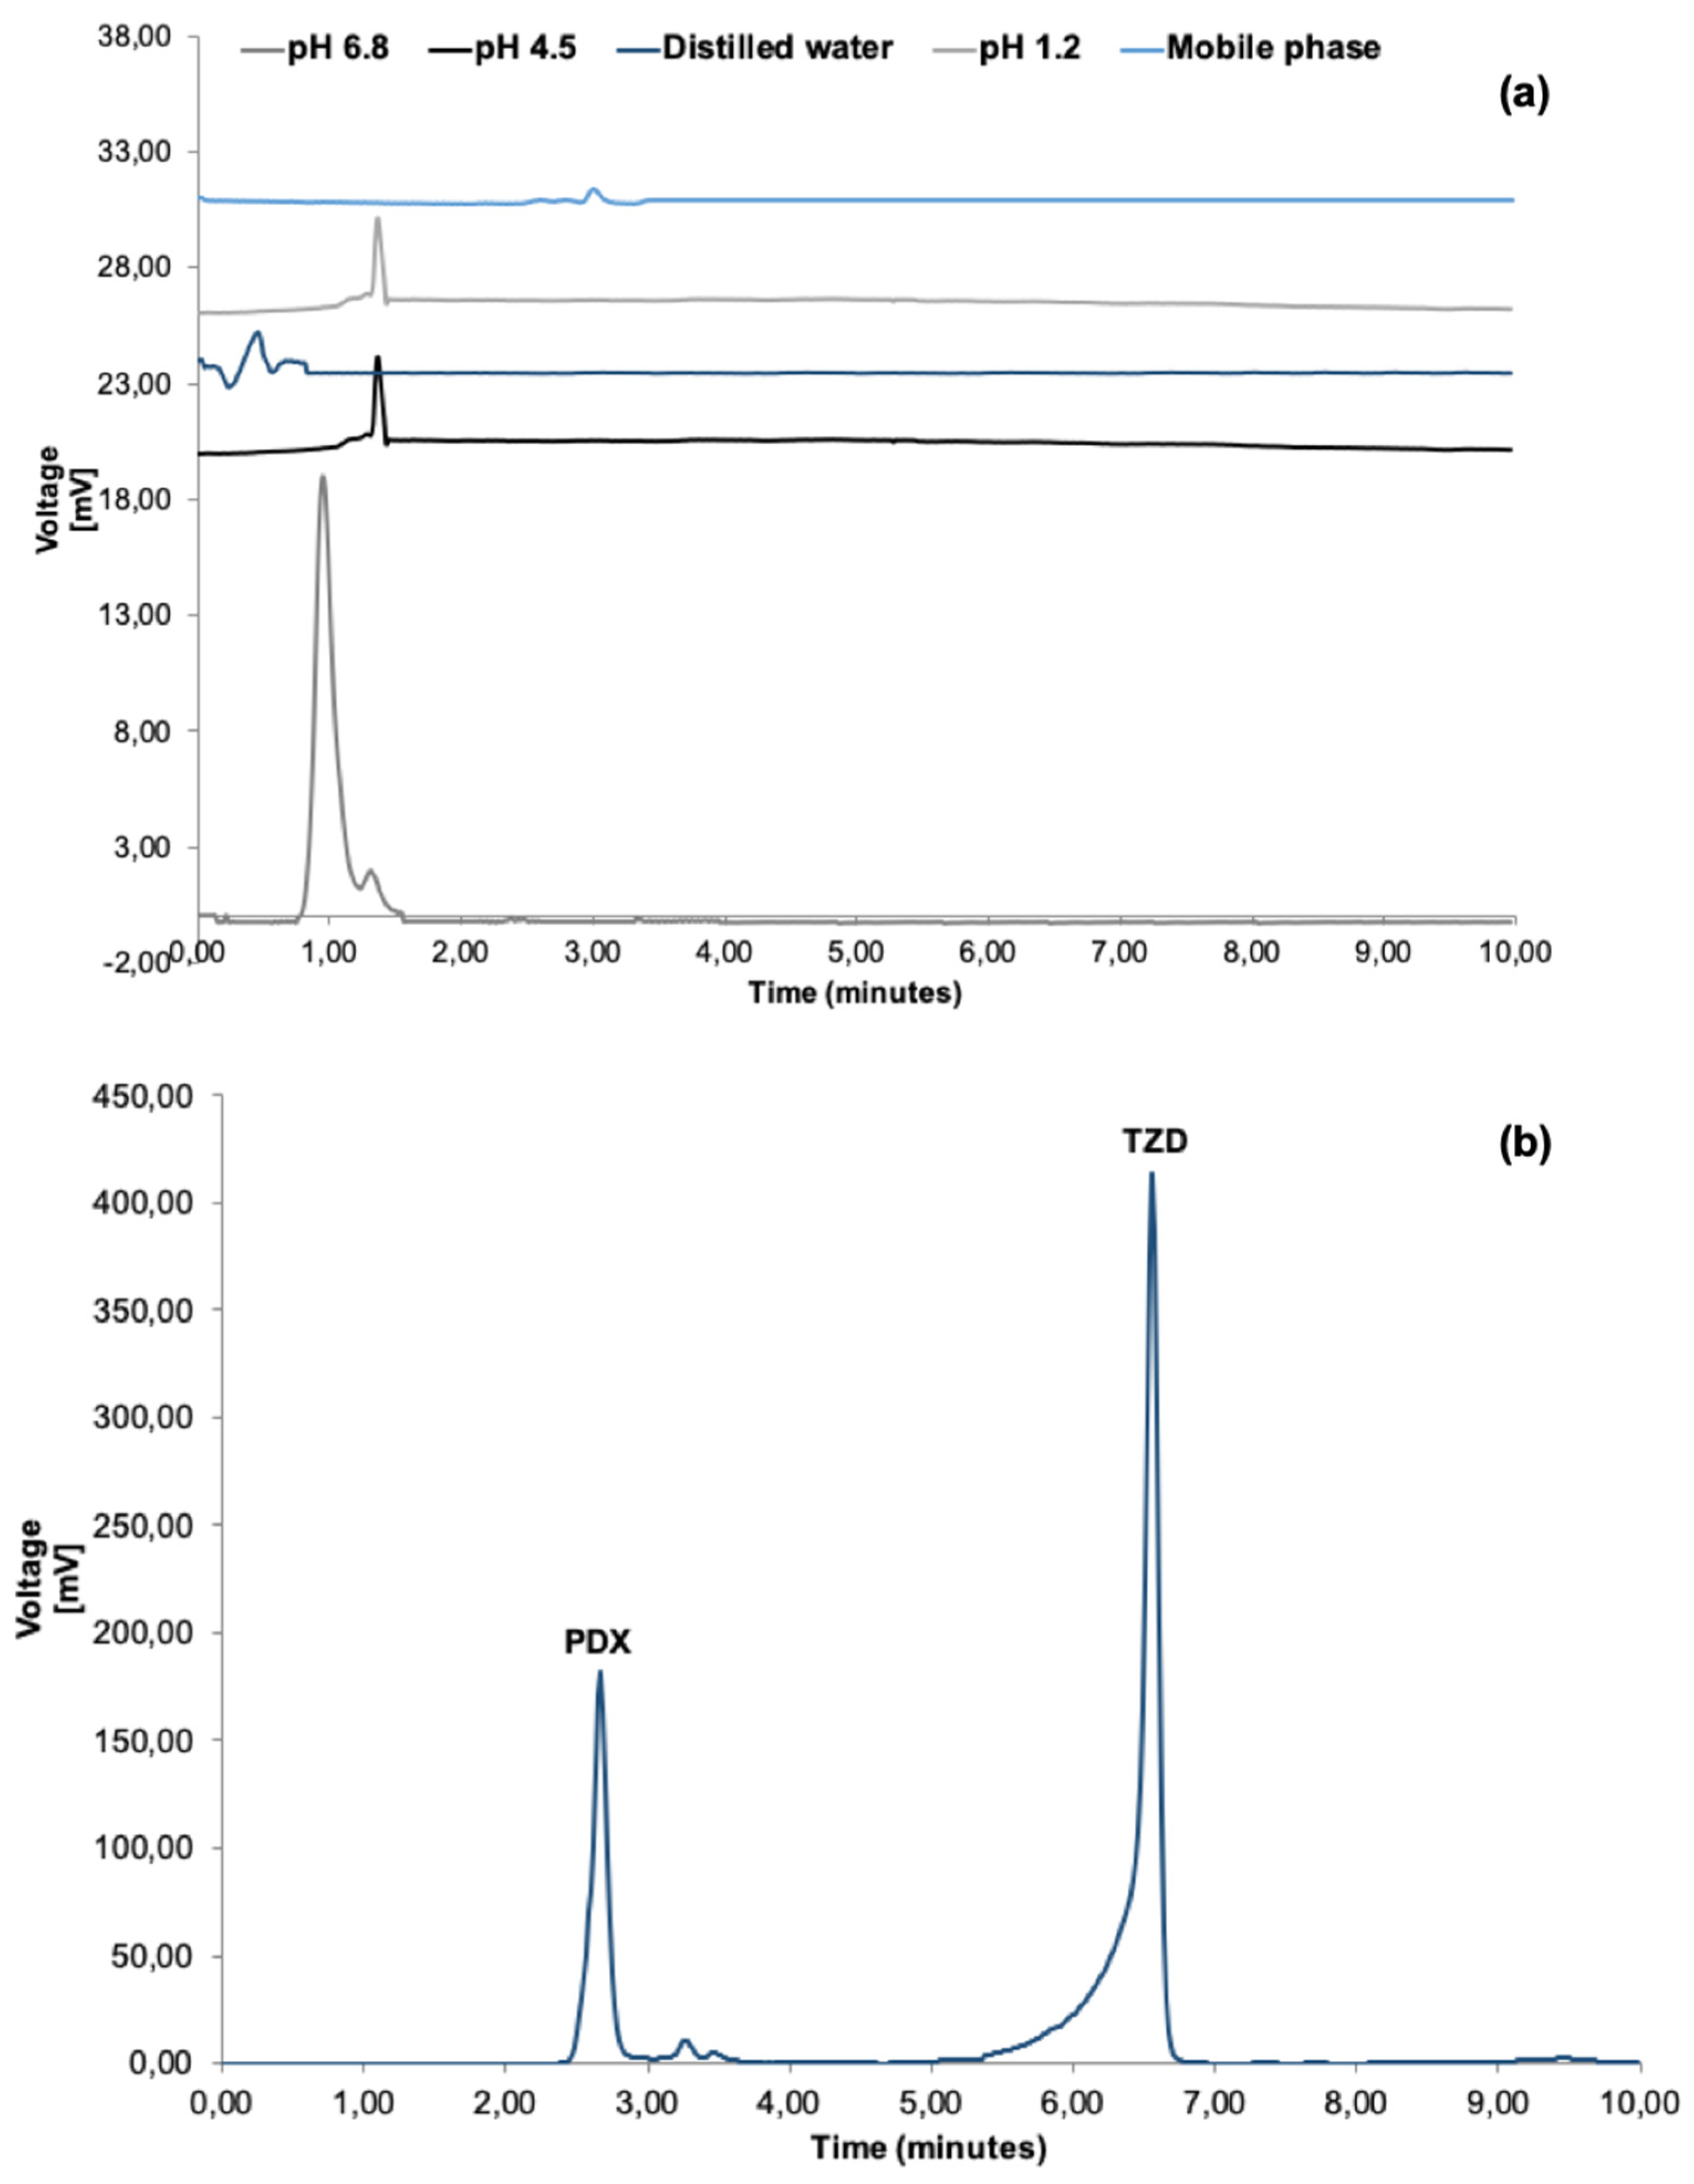
The specificity of this method was investigated by injecting the mobile phase and several buffered aqueous media (pH 1.2, 4.5, and 6.8) as well as distilled water using an injection volume of 10 μL. From these injections, it was apparent that neither the solvents nor the mobile phase was interfering with either the PDX or the TZD peak, and accurate identification and quantification of the two compounds would be possible, irrespective of the solvent used (Figure 3).

3.6. Robustness

The robustness testing for this method applied deliberate adjustments to the chromatographic parameters. Adjustments were made to the detection wavelength, resulting in the testing of chromatographic response at 230, 250, and 280 nm. Table 5 provides an outline of the obtained area under the curve (AUC) values for both PDX and TZD. From these deliberate changes, it was observed that PDX exhibits a higher AUC at wavelength 250 nm, while TZD shows the highest AUC response at 280 nm. Based on these results, it was concluded that using a detection wavelength of 260 nm provides the best detection for both compounds. Deliberate changes to the column temperature were also tested during robustness testing. The column temperatures varied from ambient temperature to 40 °C. It was noted that changes in the column temperature did not affect the retention time of each of the compounds significantly, and therefore it was not identified as a critical chromatographic parameter for this method.

3.7. Solution Stability

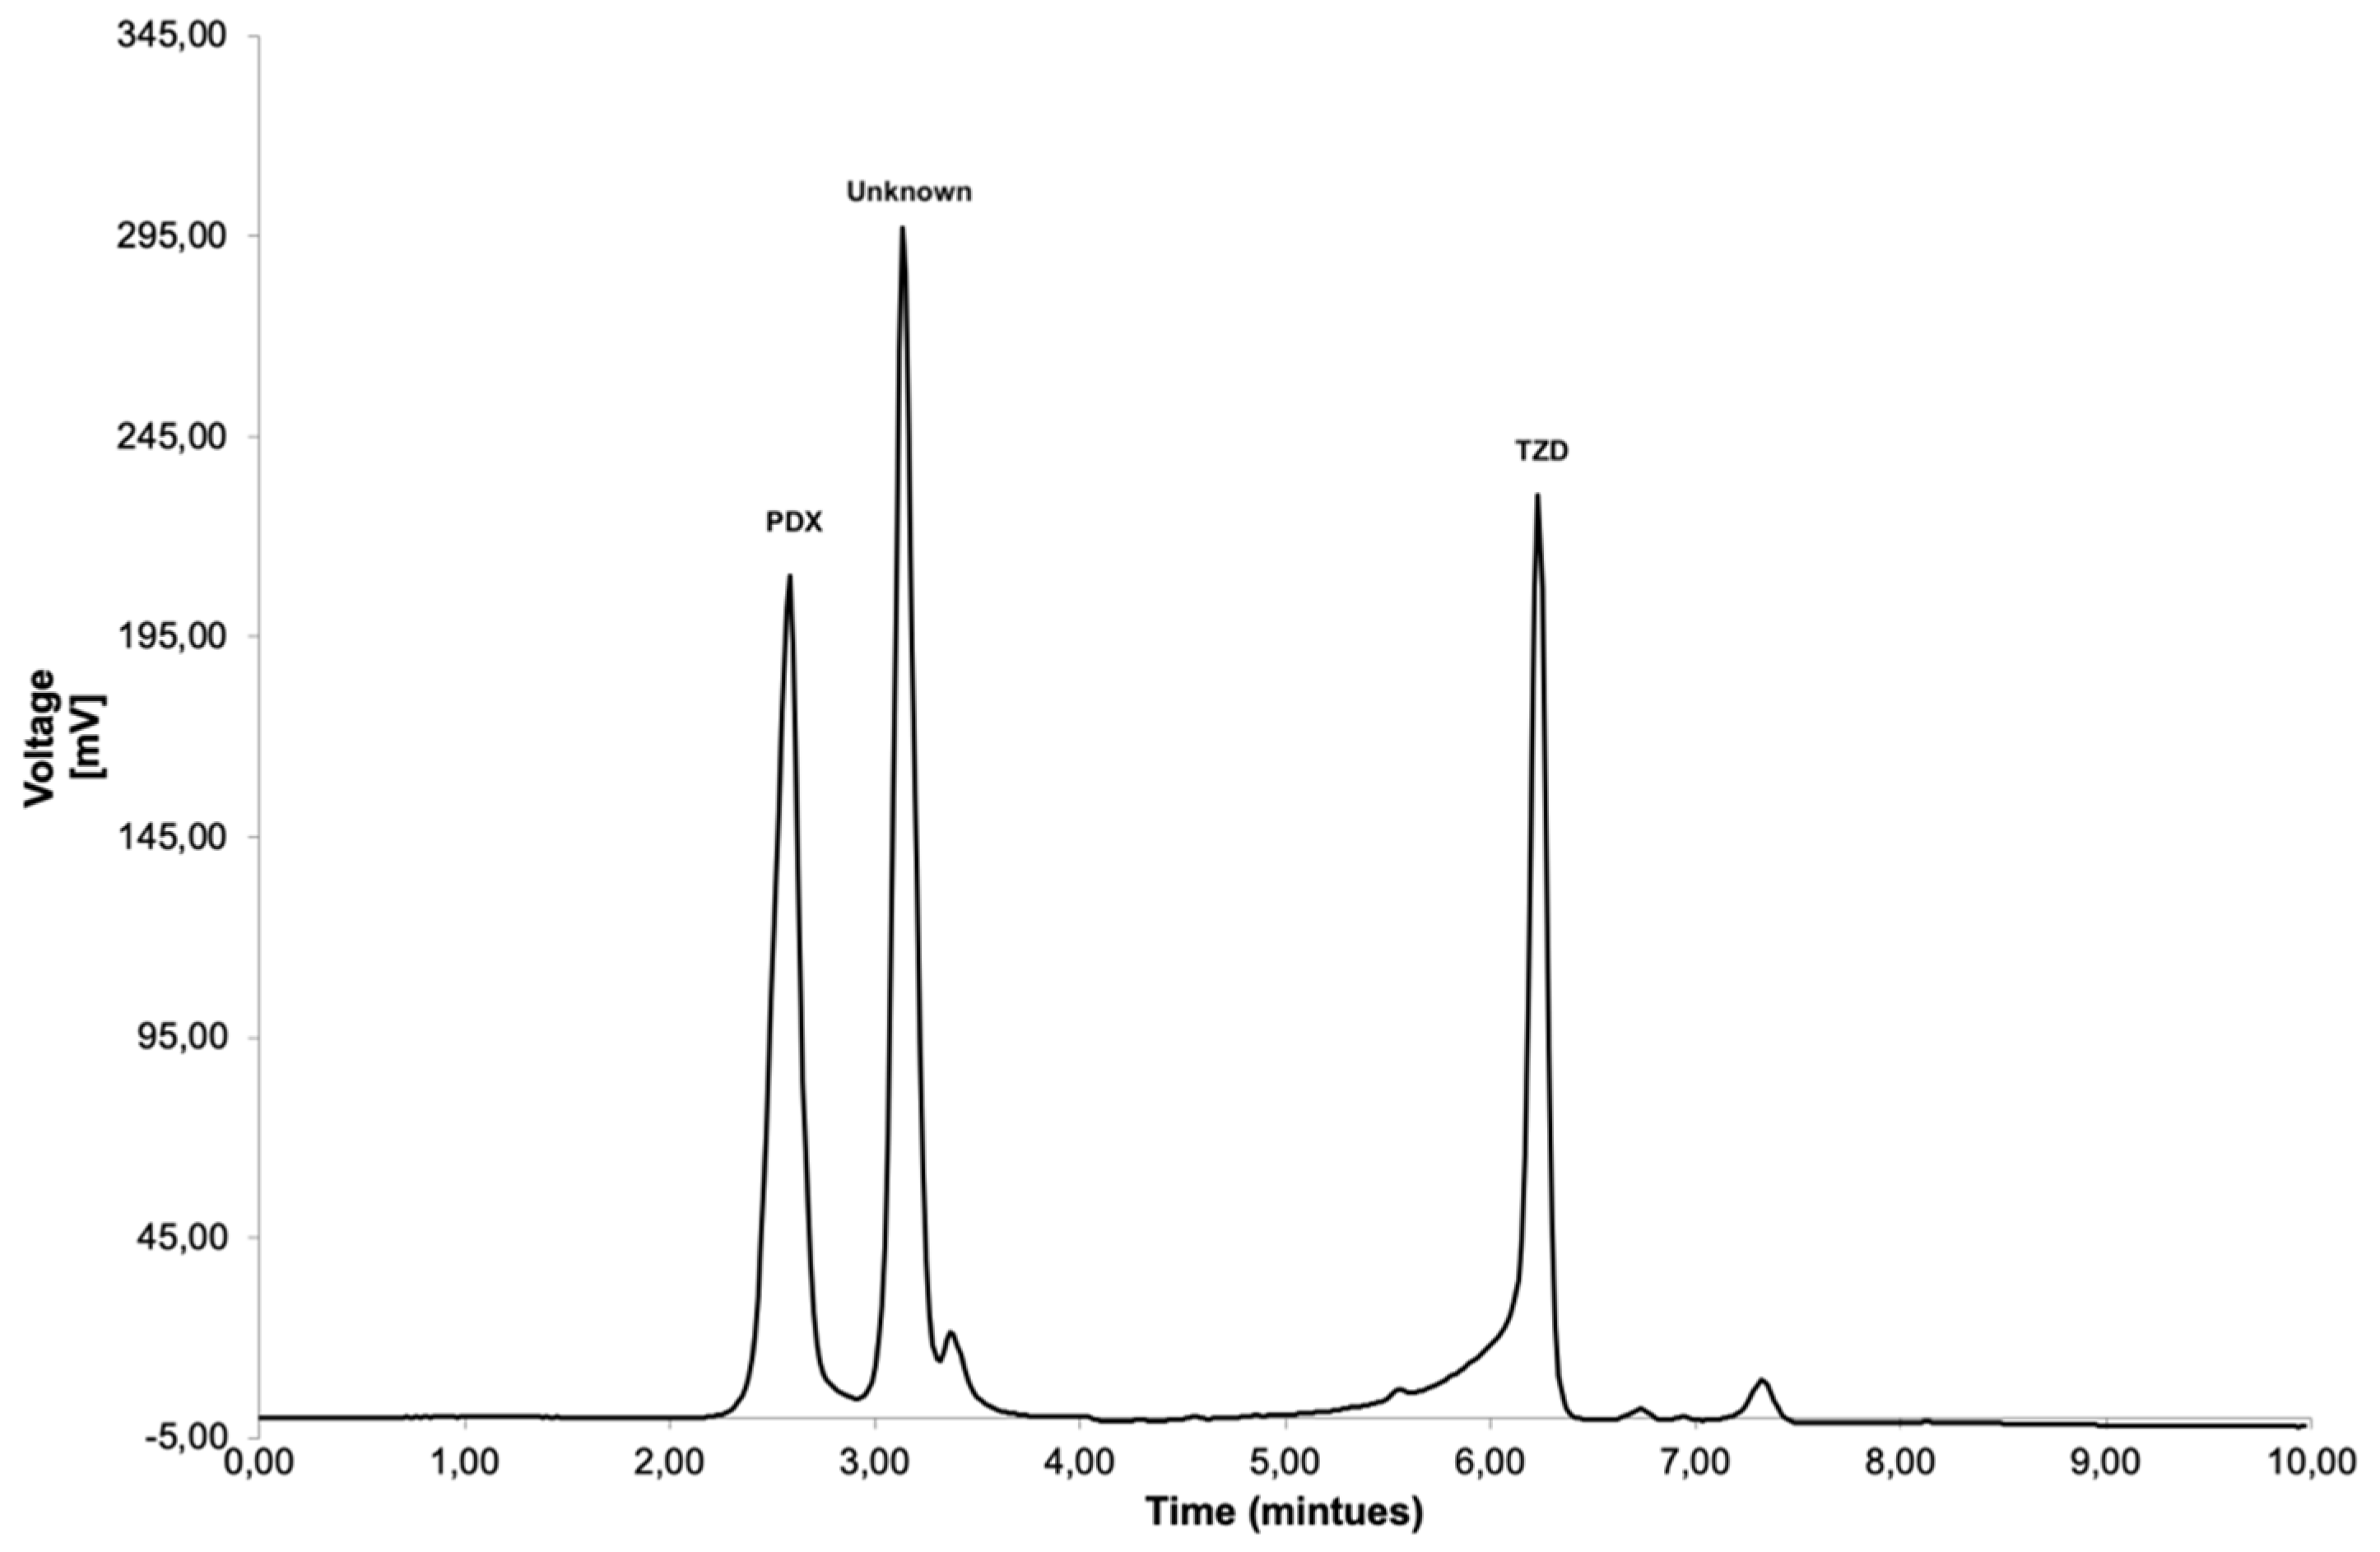
During solution stability testing, it became apparent that this method was sensitive to the detection of degradation products associated with the two drug compounds. Table 6 provides a summary of the quantified concentrations of both compounds during exposure to various storage conditions as well as to conditions that would accelerate the degradation of both drugs. It was observed that both PDX and TZD showed stability when stored in the fridge (5 °C). In terms of stability at ambient storage conditions, it was found that PDX degraded ≈10% during the 48 h testing period, while TZD remained stable at room temperature. The sample stored at 60 °C showed a 65% decrease in PDX purity after the first 24 h of storage and complete degradation thereafter. The appearance of an unknown peak was also observed at 3.13 min (Figure 4). This observation is contradictory to the stability data reported in literature, which states that PDX remains stable during exposure to heat [16,17]. However, it should be noted that this stability was not tested in solution, neither in this specific solvent system nor in combination with TZD. Quantification of TZD in the sample stored at 60 °C showed an increase in the drug concentration, and this could be ascribed to possible solvent evaporation. TZD completely degraded upon exposure to 60 °C in combination with PDX during the 48 h testing period. PDX is reported to be sensitive to light when it is in neutral or alkaline solutions [16,17]. This behavior was confirmed during this validation process, since PDX was extensively degraded during exposure to sunlight when combined with TZD (Figure 5), with no possibility of identifying the peaks associated with PDX or TZD. The same behavior was observed for TZD, and this was noted to be different to that reported by Gandhi, Shevale, and Choudhari [10]. The stability of both compounds was observed when exposed to acidic conditions. Following these findings, which are different from those dictated by the literature that were observed in terms of the stability of PDX in strong alkali. PDX showed marked degradation (% purity loss of 35%) across the solution stability testing period in an alkaline environment (Table 6). It was also noticed that PDX is sensitive towards oxidative species, based on a purity loss of 20% across a period of 48 h. On the other hand, TZD remained stable during exposure to an alkaline environment as well as to oxidative species.

4. Discussion

Due to the high pill-burden experienced by many patients suffering from TB infection, many strategies are being investigated and employed to reduce the number of drugs these patients need to consume daily. PDX is usually prescribed together with TZD to reduce the polyneuropathic side effects that TZD treatment is associated with. It is therefore justifiable to co-formulate these two active pharmaceutical ingredients into a single dosage form. However, the formulations of new dosage forms also requires the establishment of a suitable analytical method, which would allow accurate, reliable detection and quantification of the compounds included into the new pharmaceutical product. Currently, there is no analytical method that allows for the simultaneous detection and quantification of PDX and TZD. A reliable robust RP-HPLC method that allows for the simultaneous detection and quantification of PDX and TZD was developed and validated. The validation process and obtained parameters proved the method to be suitable for the quantification of PDX and TZD across a relatively wide concentration range. Recovery studies, as part of the accuracy testing of this analytical method, proved that this method would be appropriate for typical assay and dissolution testing of both compounds when combined into a single preparation. During the method development process, the fronting of the TZD peak proved to be a challenging aspect. The fronting of the TZD peak was ascribed to the use of DMSO as a solubilization solvent of TZD during sample preparation. As a result of this, it was identified that the use of DMSO should be minimized as best as possible during sample preparation. Despite the observed fronting of the TZD peak, it was still found to be acceptable due to a symmetry value of 0.83, which falls withing the acceptable symmetry range of 0.8–1.5 [14]. Selectivity testing proved that no interference on the PDX or TZD peak occurs when different solvent types are used, making this method suitable for typical drug release testing. Moreover, a thorough solution stability study proved that once combined with one another, these two compounds exhibit a stability behavior different to that reported by other studies, which investigated these two compounds alone. It was, however, deduced from the solution stability study that this method is stability-indicating, since it is sensitive to the detection of degradation compound peaks. In conclusion, this method meets the requirements provided by pharmaceutical regulating bodies [14] and can be categorized as a suitable validated analytical method that will allow the accurate simultaneous detection and quantification of PDX and TZD when combined into pharmaceutical preformulation preparations or finished pharmaceutical products.

Author Contributions

Conceptualization, M.E.A. and N.Y.M.; methodology, N.Y.M. and M.E.A.; validation, M.E.A. and N.Y.M.; resources, M.E.A. and H.S.; writing—original draft preparation, N.Y.M.; writing—review and editing, M.E.A., N.Y.M. and H.S.; supervision, M.E.A. and H.S.; project administration, M.E.A. All authors have read and agreed to the published version of the manuscript.

Funding

This research received no external funding.

Institutional Review Board Statement

Not applicable.

Informed Consent Statement

Not applicable.

Data Availability Statement

All relevant data are provided within this manuscript.

Conflicts of Interest

The authors declare no conflict of interest.

References

  1. Wells, B.G.; Dipiro, J.T.; Schwinghammer, T.L.; Dipiro, C. Pharmacotheraphy Handbook, 9th ed.; McGraw-Hill Education: New York, NY, USA, 2015; pp. 476–489. [Google Scholar]
  2. World Health Organization. Global Tuberculosis Report 2021. Available online: https://www.who.int/teams/global-tuberculosis-programme/tb-reports/global-tuberculosis-report-2021 (accessed on 21 October 2021).
  3. Riccardi, N.; Canetti, D.; Rodari, P.; Besozzi, G.; Saderi, L.; Dettori, M.; Codesca, L.R.; Sotgiu, G. Tuberculosis and pharmacological interactions: A narrative review. CRPHAR 2021, 2, 100007. [Google Scholar] [CrossRef]
  4. Huynh, J.; Thwaites, G.; Marais, B.J.; Schaaf, H.S. Tuberculosis treatment in children: The changing landscape. Paediatr. Respir. Rev 2020, 36, 33–43. [Google Scholar] [CrossRef] [PubMed]
  5. Bernstein, A.L.; Dinesen, J.S. Effect of pharmacologic doses of vitamin B6 on carpal tunnel syndrome, electroencephalographic results, and pain. J. Am. Coll. Nutr 1989, 12, 73–76. [Google Scholar] [CrossRef] [PubMed]
  6. Leklem, J.E. Vitamin B6. In Modern Nutrition in Health and Disease, 9th ed.; Shils, M.E., Olson, J.A., Shike, M., Ross, A.C., Eds.; Williams and Wilkins: Philadelphia, PA, USA, 1999; pp. 413–421. [Google Scholar]
  7. Van der Watt, J.; Harrison, T.; Benatar, M.; Heckmann, J. Polyneuropathy, anti-tuberculosis treatment and the role of pyridoxine in the HIV/AIDS era: A systematic review. Int. J. Tuberc. Lung Dis. 2011, 15, 722–728. [Google Scholar] [CrossRef] [PubMed]
  8. Court, R.; Centner, C.M.; Chirehwa, M.; Wiesner, L.; Denti, P.; de Vries, N.; Harding, J.; Gumbo, T.; Maartens, G.; McIlleron, H. Neuropsychiatric toxicity and cycloserine concentrations during treatment for multidrug-resistant tuberculosis. IJID 2021, 105, 688–694. [Google Scholar] [CrossRef] [PubMed]
  9. Mulubwa, M.; Mugabo, P. Analysis of terizidone in plasma using HPLC-UV method and its application in a pharmacokinetic study of patients with drug-resistant tuberculosis. Biomed. Chromatogr. 2018, 32, e4325. [Google Scholar] [CrossRef] [PubMed]
  10. Gandhi, S.V.; Shevale, V.P.; Choudhari, G.B. Development and validation of a stability indicating RP-HPLC method for the determination of terizidone. IAJPS 2018, 05, 1353–1361. [Google Scholar]
  11. Vanavi, P.J.; Rajput, S.J. Impurity profiling of first line anti-TB drug—Terizidone using chromatographic and related techniques. Int. J. Pharm 2021, 13, 83–95. [Google Scholar]
  12. National Center for Biotechnology Information. Available online: https://pubchem.ncbi.nlm.nih.gov/compound/Terizidone (accessed on 21 October 2021).
  13. National Center for Biotechnology Information. Available online: https://pubchem.ncbi.nlm.nih.gov/compound/Pyridoxine-hydrochloride (accessed on 21 October 2021).
  14. International Conference of Harmonisation. Available online: https://www.gmp-compliance.org/guidemgr/files/Q2(R1).pdf (accessed on 21 September 2021).
  15. LoBrutto, R.; Patel, T. Method validation. In HPLC for Pharmaceutical Scientists, 1st ed.; Kazakevich, Y., LoBrutto, R., Eds.; John Wiley and Sons: Hoboken, NJ, USA, 2007; pp. 455–502. [Google Scholar]
  16. Harris, R.S. General discussion on the stability of nutrients. In Nutritional Evaluation of Food Processing; Karmas, E., Harris, R., Eds.; Springer: Dordrecht, The Netherlands, 1988; pp. 3–5. [Google Scholar]
  17. Aboul-Enein, H.Y.; Loutfy, M.A. Pyridoxine hydrochloride. In Analytical Profiles of Drug Substances; Florey, K., Ed.; Academic Press: New York, NY, USA, 1984; pp. 447–486. [Google Scholar]
Figure 1. Molecular structures of (a) TZD and (b) PDX [12,13].
Analytica 02 00018 g001
Figure 2. Regression plot obtained for TZD and PDX for a concentration range of 50.00–800 μg/mL.
Analytica 02 00018 g002
Figure 3. Overlay of chromatograms obtained with (a) mobile phase, pH 1.2, pH 4.5, and pH 6.8 buffered media and distilled water; (b) PDX and TZD dissolved in the described diluent.
Analytica 02 00018 g003
Figure 4. Chromatogram obtained with a solution containing 200 μg/mL of both PDX and TZD after exposure to a storage temperature of 60.0 °C for a period of 24 h.
Analytica 02 00018 g004
Figure 5. Chromatogram obtained with a solution containing 200 μg/mL of both PDX and TZD after exposure to direct sunlight for a period of 24 h.
Analytica 02 00018 g005
Table 1. Accuracy results obtained for TZD and PDX determined at 50, 100, 200, 300, and 400 μg/mL.
Expected Concentration (μg/mL)TZDPDX
% RecoveryConcentration (μg/mL)% RecoveryConcentration (μg/mL)
50.0092.0446.48 ± 0.05102.0451.53 ± 0.05
104.00101.74105.81 ± 0.7798.04101.96 ± 0.54
202.10100.25202.61 ± 0.87100.37202.85 ± 2.56
312.0099.55310.60 ± 0.2598.62307.69 ± 0.60
404.0099.77403.07 ± 0.5497.23392.81 ± 0.16
Table 2. Results obtained during repeatability testing of the analytical method.
Concentration (μg/mL) (n = 12)TZD Peak AreaPeak Area (Average ± %RSD)PDX Peak AreaPeak Area (Average ± %RSD)
101.002420.342408.78 ± 0.09793.77795.86 ± 0.22
2378.18795.69
2427.83798.12
208.004824.744823.49 ± 0.041615.321619.26 ± 0.26
4820.501616.09
4822.941622.28
4826.311616.42
4823.831626.20
4822.631620.67
303.007023.607032.03 ± 0.112449.712454.94 ± 0.16
7039.472459.21
7033.032455.89
Table 3. Results obtained during inter-day precision testing of TZD.
Concentration (μg/mL) (n = 9)Day 1
dongyuan% Recovery
Day 2
dongyuan% Recovery
Day 3
dongyuan% Recovery
104.00102.4098.53102.64
100.6297.19101.23
100.62100.85101.33
Mean101.2198.86101.73
%RSD0.831.530.63
208.0098.5398.0599.34
97.4898.1199.37
98.0598.0899.26
Mean98.0298.0899.32
%RSD0.440.020.05
303.0099.51101.89100.44
100.06102.33100.98
98.98101.67100.51
Mean99.52101.96100.64
%RSD0.440.270.24
Table 4. Results obtained during inter-day precision testing of PDX.
Concentration (μg/mL) (n = 9)Day 1
dongyuan% Recovery
Day 2
dongyuan% Recovery
Day 3
dongyuan% Recovery
102.0097.09103.63100.31
98.72102.6498.95
98.98102.14100.55
Mean98.26102.8099.94
%RSD0.850.600.70
209.00102.1298.09100.23
102.3598.06100.78
102.1498.56101.02
Mean102.2898.24100.71
%RSD0.110.230.29
301.00100.06101.5199.77
100.17100.6799.04
100.99100.8699.81
Mean100.41101.0199.54
%RSD0.410.350.36
Table 5. Outline of the detected AUC values for PDX and TZD after deliberate adjustments in the detection wavelength obtained during the injection of a solution containing 100 μg/mL PDX and TZD, respectively.
Wavelength (nm)PDX (mAU)TZD (mAU)
230383.574808.23
2501606.212157.37
260 (chosen wavelength)738.154627.39
280237.314834.05
Table 6. Percentage purity (%) calculated for PDX and TZD during exposure to various storage conditions as well as harsh environments for a period of three days.
Conditions5 °C25 °C60 °CPhotolysisAcid HydrolysisAlkaline HydrolysisOxidation
PDX (% Purity ± %RSD)
0 h100.00 ± 0.26100.00 ± 0.26100.00 ± 0.26100.00 ± 0.26100.00 ± 0.26100.00 ± 0.26100.00 ± 0.26
24 h98.08 ± 0.0394.87 ± 0.6134.94 ± 0.331.81 ± 0.00100.02 ± 0.7770.84 ± 0.1794.15 ± 0.18
48 h95.13 ± 0.7690.41 ± 0.060.00 ± 0.000.00 ± 0.0093.75 ± 0.9664.91 ± 1.2980.95 ± 1.03
TZD (% Purity)
0 h100.00 ± 0.66100.00 ± 0.66100.00 ± 0.66100.00 ± 0.66100.00 ± 0.66100.00 ± 0.66100.00 ± 0.66
24 h97.50 ± 0.5397.43 ± 0.34127.67 ± 2.340.00 ± 0.0099.86 ± 0.45101.97 ± 0.17100.39 ± 0.46
48 h97.59 ± 1.0997.58 ± 0.6372.76 0.00 ± 0.0099.56 ± 0.43100.63 ± 0.0999.94 ± 0.31
Publisher’s Note: MDPI stays neutral with regard to jurisdictional claims in published maps and institutional affiliations.