Abstract
The present paper reports a new application: the voltammetric determination in herbal medicines of ultra-trace thallium(I), in the presence of lead(II), tin(II) and antimony(III) as interfering metals, by square wave anodic stripping voltammetry (SWASV). A conventional three-electrodes voltammetric cell was employed with a stationary hanging mercury drop electrode (HMDE) as working electrode and a platinum electrode and an Ag|AgCl|KClsatd. electrode as auxiliary and reference electrodes, respectively. The supporting electrolyte was 0.5 mol L−1 ammonium citrate buffer pH 6.5 + 7.3·10−3 mol L−1 EDTA-Na2. The analytical procedure was verified by the analysis of the standard reference materials: spinach Leaves NIST-SRM 1570a and tomato leaves NIST-SRM 1573a from National Institute of Standards and Technology. Precision and trueness, expressed as relative standard deviation and relative error, respectively, were generally lower than 7% in all cases. Once set up on the standard reference materials, the analytical procedure was transferred and applied to herbal medicines samples—Taraxacun officinale weber, Eucalyptus globulus and Harpagophytum procumbens DC—sold on the market. A critical comparison with spectroscopic measurements is also discussed.
1. Introduction
Anthropic activities produce unsustainable accumulation of persistent toxic substances in the environment, resulting in danger for food safety. Toxic metals are one of the most deleterious pollutants because they tend to concentrate in all environmental matrices. Matrices involved in the food chain, where the consequences on human health and wildlife may be irreversible [1,2,3,4,5,6], are particularly affected. Indeed, some of these metals are hazardous at any concentration level, while some others become toxic only beyond a specific safety threshold. In this sense, it is very important to determine these species at trace and ultratrace concentration levels, especially considering the fact that several metals may present high risks of toxicity to humans even at very low levels of concentration [1].
In the last decade, much scientific attention has been addressed to thallium, as a new generation polluting metal [7]. This metal, almost ignored or not considered for a long time, has only recently attracted attention because of its ever-increasing use in agriculture, its activity closely linked to most types of food. This implies its strong presence in the environment, with serious health problems arising when it enters food matrices.
Metals are not only integral parts of the food chain, but also of nutritional supplements, which encompass a wide spectrum of products including vitamins and mineral salts, botanical and herbal agents (herbal remedies/medicines), as well as enzymes and a great variety of extracts. Several million people worldwide use these products daily for a number of reasons including nutritional and medicinal, but also to obtain performance-enhancing effects. In this context, the herbal medicines are dominant among food supplements being used as non-conventional medicines, sometimes in place of conventional medicines. For this reason, checking them for toxic metals is important.
Herbal medicines have been used throughout the Orient for millennia. However, in recent decades, the use of herbal medicines in the western world has been widespread and decidedly increasing. These are plant-derived products used for medicinal and/or nutritional purposes. They include a wide spectrum of substances ranging from homemade tisanes to the nutritional and body-care products. Although people generally consider herbal medicines as natural and safe products, i.e., health-risk free, there seems to be very little scientific evidence to support this conviction. Conventional medications are purified and stable compounds, whose dose range is optimized during clinical and post clinical trials, especially to minimize side effects due to eventual toxicity. On the contrary, herbal medicines are crude plant-derived extracts that may potentially show a greater number of serious adverse effects [1,8,9,10,11,12]. However, considering the unregulated nature of their manufacture, the main problem concerns the fact that, unfortunately, the access to such products is largely unrestricted because it is possible to purchase them without the need of medical prescription.
The World Health Organization (WHO) and US Food and Drug Administration (FDA) recommend that medicinal plants forming the raw materials for the finished products be checked for the presence of heavy toxic metals, setting maximum permissible limits only for mercury (1.0 ppm), lead (10.0 ppm), cadmium (0.3 ppm) and arsenic (10.0 ppm) [13,14,15]. A decision about the permissible limits for other metals has not been taken yet, maybe because many of them are considered as micronutrients, and potential harmfulness in large quantities is consequently not adequately taken into account.
Among the already assessed instrumental techniques, spectroscopy is the most widely used to determine toxic metals in medicinal plants [16,17,18,19,20]. Spectroscopic techniques have also been employed to generate fingerprints of herbal medicines [21,22] which, in combination with chemometric methods, are used for origin recognition [23] and fraud identification [24].
As previously reported, for some years our laboratories have undertaken an important line of research on the development of analytical methods for the determination of polluting metals of new generation, thallium and platinum group metals (PGMs), in environmental matrices.
Regarding herbal medicine matrices, only recently interest has been addressed to the development of analytical procedures for the voltammetric determination of toxic metals in such complex matrices [16,25,26,27] (and references therein). Considering the absence, at least to our knowledge, of studies concerning the determination of thallium in herbal medicines, it seemed interesting to develop the voltammetric method for the determination of thallium in such matrices, and to compare the results with spectroscopic measurements.
2. Materials and Methods
2.1. Reagents and Reference Solutions
All chemicals were suprapure grade (Merck, Darmstadt, Germany). Water was demineralized through a Milli-Q system (Millipore, Darmstadt, Germany). Acidic stock Tl(I) solution (TlNO3 in HNO3 0.5 mol L−1, 1000 mg L−1 Tl from Merck, Darmstadt, Germany) was employed to prepare reference solutions and to perform spiking of standard reference materials. Spinach leaves NIST-SRM 1570a and tomato leaves NIST-SRM 1573a (Gaithersburg, MD, USA) were employed as standard reference materials to optimize and set up the analytical procedure.
2.2. Sample Preparation
To solubilise standard reference materials and herbal medicines—Taraxacum officinale Weber, Eucalyptus globulus and Harpagophytum procumbens DC—, a mixture of concentrated acids HNO3-HCl-H2SO4 (30.8% v/v, 30.8% v/v, 38.4% v/v, respectively) was employed, using a mineralization method applied for similar matrices [26].
Approximately 1.0 g of vegetable matrices was accurately weighed into a Pyrex digestion tube calibrated at 25 mL, then 4 mL of 69% w/w HNO3 + 4 mL 37% w/w HCl + 5 mL of 96% w/w H2SO4 were added. The tube was connected to a Vigreux column condenser, and subsequently inserted into a cold home-made block digester. The temperature was gradually raised to 150 °C and this final temperature was maintained for the whole mineralization time (2 h). The mixture was evaporated to dryness and, after cooling, the soluble salts were dissolved in 25 mL of water demineralized through a Milli-Q system, or of the supporting electrolyte employed for the voltammetric measurements. Aliquots of the acidic standard solution of Tl(I) were eventually added for spiking.
2.3. Voltammetry
Square wave anodic stripping voltammetric (SWASV) scans were performed using a Multipolarograph AMEL (Milan, Italy) Mod. 433. Three-electrode measuring cells were employed using a stationary hanging mercury drop electrode (HMDE) as the working electrode, an Ag|AgCl|KClsatd. electrode and a platinum-wire as reference and auxiliary electrodes, respectively. The blank was directly subtracted during the acquisition of polarograms.
Sample aliquots (10-mL) of supporting electrolyte or of solutions obtained in the mineralization step of the standard reference material (spinach leaves BCR-CRM 1570a, tomato leaves NIST-SRM 1573a) and of real samples, were pipetted into the voltammetric cell. In the case of standard reference materials, spiking was performed by adding aliquots of the standard solution of the analyte [26]. Before performing measurements, the Teflon voltammetric cell was rinsed with supra-pure concentrated 1:1 HNO3 and then several times with demineralised water obtained by a Milli-Q apparatus to prevent accidental contamination. Standard additions were performed by disposable plastic tips. Prior to analysis, solutions were thermostated at 20.0 ± 0.5 °C and de-aerated with MilliQ-water-saturated pure nitrogen for 5 min. During the experiments, solutions were kept under a nitrogen blanket. During the purge step, solutions were stirred with a Teflon-coated magnetic stirring bar.
Ammonium citrate buffer (0.5 mol L−1) pH 6.5 + 7.3·10−3 mol L−1 EDTA-Na2 was employed as the supporting electrolyte using the following experimental conditions: deposition potential Ed (V/Ag, AgCl, KClsatd.): −1.150; initial potential Ei (V/Ag, AgCl, KClsatd.): −1.200; final potential Ef (V/Ag, AgCl, KClsatd.): −0300; electrodeposition time td (s): 420; delay time before the potential sweep tr (s): 10; potential scan rate dE/dt (mV/s): 100; superposed potential amplitude ΔE (mV): 50; sampling time τ (s): 0.010; wave period υ (s): 0.100; wave increment η (mV): 10; stirring rate u (r.p.m.): 600.
2.4. Spectroscopy
Electro-Thermal Atomic Absorption Spectroscopy (ET-AAS) measurements were performed using a Perkin-Elmer Mod. A-Analyst 100 Atomic Absorption Spectrometer equipped with a deuterium background corrector, Autosampler AS-72 and with HGA 800 graphite furnace. Single-element Lumina (Perkin-Elmer, Waltham, MA, USA) hollow-cathode lamps were used. All measurements were carried out once the relative ashing and atomization curves had been set up for each element considered [28].
The instrumental settings used were the following: wavelength (nm): 276.8; slit (nm): 0.7; drying temperature (°C): 110; charring temperature (°C): 1050; atomization temperature (°C): 1650; matrix modifier: 0.015 mg Pd + 0.01 mg Mg(NO3)2; sample volume injected: 20 μL; argon flow: 300 mL min−1 at all steps except during atomization (60 mL min−1).
3. Results and Discussion
3.1. Aqueous Reference Solutions
For the thallium voltammetric determinations, a preliminary study was performed employing the relevant aqueous reference solutions. The blank concentrations for all the investigated elements (see Figure 1) were lower than the respective limits of detection (LOD) expressed according to International Union of Pure and Applied Chemistry [29] (3.3 times the standard deviation of the blank or the standard deviation of regression for a linear calibration model). In this case, LOD was calculated on n = 10 blank signals.
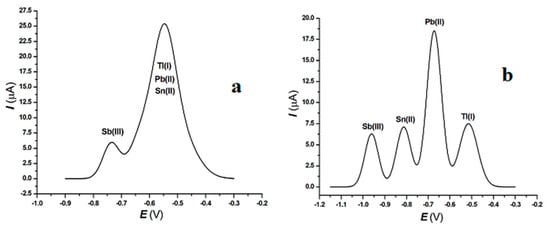
Figure 1.
Square wave anodic stripping voltammograms of Tl(I), Pb(II), Sn(II) and Sb(III) in the absence of EDTA-Na2 (a), and in the presence of EDTA-Na2 (b). Concentrations (µg kg−1): 69.3 [Tl(I)], 203.1 [Pb(II)]; 76.6 [Sn(II)]; 49.6 [Sb(III)]. Experimental conditions: see Section 2.3. Supporting electrolyte: 0.5 mol L−1 ammonium citrate buffer pH 6.5 + 7.3·10−3 mol L−1 EDTA-Na2.
Using the instrumental conditions reported in Section 2.3 and Section 2.4, the analytical calibration function was constructed in the aqueous reference solutions, and its equation is the following:
where cadded is the added-concentration. In the concentration range investigated (up to 10.0 µg L−1), a linear ip vs. metal concentration relationship was found for each individual element. In all cases, the determination coefficients were good (R2 > 0.9989).
area (μA·V) = (1.13 ± 0.04) (μA·V) + (0.0178 ± 0.0002) (μA·V·μg−1·kg)·cadded (mg kg−1)
3.2. Interferences from Pb(II), Sn(II), and Sb(III) in the Tl(I) Determination and Choice of the Supporting Electrolyte
Regarding the composition of the supporting electrolyte, it should be emphasized that the presence of EDTA-Na2 was necessary to obtain better resolution for the Tl(I) in the presence of Pb(II), Sn(II), and Sb(III) [30,31], thus solving the lack of selectivity. In fact, the use of EDTA in order to separate interfering peaks has been known for over half a century [32]. Indeed, in the environmental ecosystems Pb(II), Sn(II), and Sb(III) are always present. Unfortunately, in all the matrices they show a peak potential very close to Tl(I). In the supporting electrolyte employed without the presence of EDTA-Na2 the peak potentials Ep (V/Ag|AgCl|Cl−satd.) were: Ep Tl(I) = −0.495 ± 0.010; Ep Pb(II) = −0.549 ± 0.015; Ep Sn(II) = −0.629 ± 0.015 and Ep Sb(III) = −0.737 ± 0.010.
The problem was decidedly important, considering that the same problem was also present in the standard reference material and in the real samples collected in the sampling sites. In this case, our methodological procedure proposed the possibility of shifting the interfering peaks towards more cathodic potential values by adding EDTA-Na2. Indeed, the presence of EDTA-Na2 shifted towards more cathodic potential the values of all the four elements: Tl(I): −0.515 ± 0.010; Pb(II): −0.673 ± 0.010; Sn(II): −0.813 ± 0.015 and Sb(III): −0.961 ± 0.015 V vs. Ag|AgCl|Cl−satd.. Evidently, the new peak position of the elements allowed their resolution and also their quantitative determination, and the proposed analytical procedure, with the addition of EDTA-Na2, allowed us to determine, beyond Tl(I), also Pb(II), Sn(II), and Sb(III). Figure 1 shows the square wave anodic stripping voltammograms of the four elements in the absence (Figure 1a) and the presence (Figure 1b) of EDTA-Na2.
3.3. Limits of Detection
In the aqueous reference solution and in the solutions obtained by digestion of standard reference materials, the limits of detection for both techniques (voltammetry and spectroscopy) were obtained by applying the equation LOD = (K sy/x)/b [33], where sy/x and b are the estimated regression standard deviation and the slope of the relevant analytical calibration function, respectively. K = 3 was chosen in order to obtain the limits of detection [29]. The results are reported in Table 1.

Table 1.
Voltammetric and spectroscopic LODs of Tl(I) determined in the aqueous reference solution (µg L−1), in the solutions obtained by digestion of spinach leaves NIST-SRM 1570a and tomato leaves NIST-SRM 1573a, and in the solutions obtained by digestion of real samples (calculated in µg L−1 and expressed in µg kg−1). The determined values are the mean of five independent determinations; confidence level: 95%.
3.4. Quality Control and Quality Assessment
Standard reference materials—spinach leaves NIST-SRM 1570a, tomato leaves NIST-SRM 1573a were used to validate the analytical procedure, determining its accuracy. The results are reported in Table 2. Under the experimental conditions employed, precision in terms of repeatability [29,33], expressed as relative standard deviation (sr%) of five independent determinations, was generally lower than 6% in all cases, while trueness, expressed as relative error (e%), was on the order of 6–8%. Hence accuracy was satisfactory.
Table 2.
Accuracy of the analytical procedure for the determination of Tl(I). The determined values are the mean of five independent determinations. Confidence level: 95%. Concentrations in µg kg−1. Spiked sample concentration for all the elements: 49.6 µg kg−1. The ratio of Tl to other analytes was the same as in Figure 2.
3.5. Practical Applications
Once the procedures for determination of Tl(I) in standard reference materials were set up, the methods were transferred to herbal medicines samples—Taraxacun officinale weber, Eucalyptus globulus and Harpagophytum procumbens DC—sold on the market.
All samples were lyophilised, powdered, homogenised, dried at 80 °C for 24 h and solubilised for the analyses as described above (see Section 2.2).
The standard addition method was applied.
Experimental results relevant to three kinds of commercial herbal medicines are reported in Table 3.
Table 3.
Mean values of Tl(I) (µg kg−1) for Taraxacum officinale weber, Eucalyptus globulus and Harpagophytum procumbens DC sold on the market (Portomaggiore, Italy). The determined values are the mean of five independent determinations. Confidence level: 95%.
Figure 2 reports the square wave anodic stripping voltammogram relevant to the thallium(I) determination in Taraxacun officinale weber.
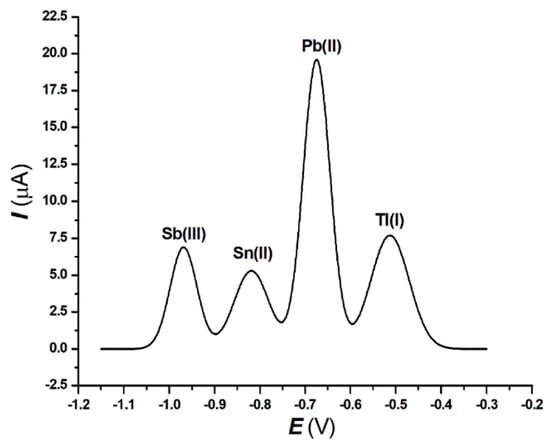
Figure 2.
Square wave anodic stripping voltammograms of Tl(I), Pb(II), Sn(II) and Sb(III) in Taraxacum officinale weber. Experimental conditions: see Section 2.3. Supporting electrolyte: 0.5 mol L−1 ammonium citrate buffer pH 6.5 + 7.3·10−3 mol L−1 EDTA-Na2.
3.6. Comparison between Spectroscopic and Voltammetric Measurements
As part of a validation procedure of the analytical method here proposed, spectroscopy was chosen as a comparison technique because it is well-established and with tested robustness [6,34]. The experimental confirmation of such a comparison/validation can be deduced from the results reported in Table 2 and Table 3: the agreement between the spectroscopic and voltammetric data is certainly good (differences lower than 7% for all the elements).
The two techniques can also be compared with respect to analytical and instrumental parameters. As for precision, trueness and detection limits, results obtained with the two techniques were in all cases good and comparable. The two techniques are then equivalent, although voltammetry offers some advantages over atomic absorption spectroscopy atomic in that, in most cases, it allows the simultaneous metals determination. However, it is correct to underline the fact that both Inductively Coupled Plasma (ICP) and Inductively Coupled Plasma-Mass Spectrometry (ICP-MS) also permit multielement determination.
Indeed, voltammetry based on the standard addition method, is a valid analytical technique (good selectivity and good sensitivity) for simultaneous determination of several elements in complex matrices. Moreover, it does not require enrichment steps, such as solvent extraction, or any particular sample pretreatments.
One of the most significant advantages of voltammetry lies in equipment-related costs. Such costs are very low in voltammetry while they are high for AAS, and extremely high (up to 25–30 times) for ICP and ICP-MS, the latter being required when multielement spectroscopic determinations are performed.
4. Conclusions
A new method for the voltammetric ultra-trace determination of thallium was validated by comparing it with a method based on atomic absorption spectroscopy. The advantages of the new method are rapidity, low-cost and overcoming the matrix-effect. The multi-analyte method here presented bypasses the problem of the copresence of many other metals, and it is applicable to every kind of natural matrix, even the more complex matrices. The herbal medicines here considered are complex matrices, and their accurate analysis is fundamental in human health protection.
Author Contributions
Conceptualization, D.M. and C.L.; methodology, S.C.; software, D.M.; validation, D.M., M.L. and S.C.; formal analysis, D.M. and M.L.; investigation, C.L., D.M., M.L. and S.C.; resources, C.L. and D.M.; data curation, D.M.; writing—original draft preparation, C.L.; writing—review and editing, D.M. and M.L.; visualization, C.L., D.M. and M.L.; supervision, C.L.; project administration, C.L.; funding acquisition, C.L. All authors have read and agreed to the published version of the manuscript.
Funding
This research was funded by University of Bologna (Funds for Selected Research Topics).
Institutional Review Board Statement
Not applicable.
Informed Consent Statement
Not applicable.
Acknowledgments
The paper is published with the contribution of the Department of Excellence program financed by the Ministry of Education, University and Research (MIUR, L. 232 del 1 December 2016).
Conflicts of Interest
The authors declare no conflict of interest.
References
- Locatelli, C. Metals. In Comprehensive Analytical Chemistry; Picò, Y., Ed.; Elsevier: Amsterdam, The Netherland, 2008; Volume 51, pp. 571–598. [Google Scholar]
- Ferré-Huguet, N.; Martì-Cid, R.; Schuhmacher, M.; Domingo, J.L. Risk assessment of metals from consuming vegetables, fruits and rice grown on soils irrigated with waters of the Ebro river in Catalonia, Spain. Biol. Trace Elem. Res. 2008, 123, 66–79. [Google Scholar] [CrossRef]
- Merian, E.; Anke, M.; Ihnat, M.; Stoeppler, M. Elements and Their Compounds in the Environment—Occurrence, Analysis and Biological Relevance; Wiley-VCH: Weinheim, Germany, 2004. [Google Scholar]
- Reilly, C. Metal. Contamination of Food—Its Significance for Food Quality and Human Health; Blackwell Science Ltd: Oxford, UK, 2002. [Google Scholar]
- Ebdon, L.; Pitts, L.; Cornelis, R. (Eds.) Trace Element Speciation for Environment, Food and Health; Royal Society of Chemistry: Cambridge, UK, 2002. [Google Scholar]
- Melucci, D.; Locatelli, M.; Locatelli, C.; Zappi, A.; De Laurentiis, F.; Carradori, S.; Campestre, C.; Leporini, L.; Zengin, G.; Picot, C.M.N.; et al. A comparative assessment of biological effects and chemical profile of Italian Asphodeline lutea extracts. Molecules 2018, 23, 461. [Google Scholar] [CrossRef] [PubMed]
- Michalski, R.; Szopa, S.; Jabłońska, M.; Łyko, A. Application of hyphenated techniques in speciation analysis of arsenic, antimony, and thallium. Sci. World J. 2012, 2012, 902464. [Google Scholar] [CrossRef] [PubMed]
- Woo, C.S.J.; Lau, J.S.H.; El-Nezami, H. Herbal medicines. Toxicity and recent trends in assessing their potential toxic effects. Adv. Bot. Res. 2012, 62, 365–384. [Google Scholar]
- Zhang, J.; Wider, B.; Shang, H.; Li, X.; Ernst, E. Quality of herbal medicines: Challenges and solutions. Complement. Ther. Med. 2012, 20, 100–106. [Google Scholar] [CrossRef]
- Yuan, X.; Chapman, R.L.; Wu, Z. Analytical methods for heavy metals in herbal medicines. Phytochem. Anal. 2011, 22, 189–198. [Google Scholar] [CrossRef]
- Sahoo, N.; Manchikanti, P.; Dey, S. Herbal drugs: Standards and regulation. Fitoterapia 2010, 81, 462–471. [Google Scholar] [CrossRef]
- Mosihuzzaman, M.; Choudhary, M.I. Protocols on safety, efficacy, standardization and documentation of herbal medicine (IUPAC technical report). Pure Appl. Chem. 2008, 80, 2195–2230. [Google Scholar] [CrossRef]
- World Health Organization (WHO). Supplementary Guidelines on Good Manufacturing Practices for the Manufacture of Herbal Medicine; WHO: Geneva, Switzerland, 2006. [Google Scholar]
- European Medicines Agency (EMEA). Guideline on Specifications: Test Procedures and Acceptance Criteria for Herbal Substances, Herbal Preparations and Herbal Medicinal Products/Traditional Herbal Products; EMEA: London, UK, 2006.
- World Health Organization (WHO). Guidelines on Safety Monitoring of Herbal Medicines in Pharmacovigilance Systems; WHO: Geneva, Switzerland, 2004. [Google Scholar]
- Locatelli, C.; Melucci, D.; Locatelli, M. Toxic metals in herbal medicines. A review. Curr. Bioact. Compd. 2014, 10, 181–188. [Google Scholar] [CrossRef]
- Rao, M.M.; Galib, A.K.M. Detection of toxic heavy metals and pesticide residue in herbal plants which are commonly used in the herbal formulations. Environ. Monit. Assess. 2011, 181, 267–271. [Google Scholar] [CrossRef]
- Kalny, P.; Fijalek, Z.; Daszczuk, A.; Ostapczuk, P. Determination of selected microelements in Polish herbs and their infusions. Sci. Total Environ. 2007, 381, 99–104. [Google Scholar] [CrossRef]
- Basgel, S.; Erdemoglu, S.B. Determination of mineral and trace elements in some medicinal herbs and their infusions consumed in Turkey. Sci. Total Environ. 2006, 359, 82–89. [Google Scholar] [CrossRef]
- Chizzola, R.; Michitsch, H.; Franz, C. Monitoring of metallic micronutriente and heavy metals in herbs, species and medicinal plants from Austria. Eur. Food Res. Technol. 2003, 216, 407–411. [Google Scholar] [CrossRef]
- Zhao, Y.S.; Ma, X.F.; Fan, L.L.; Mao, F.Y.; Tian, H.L.; Xu, R.; Cao, Z.; Zhang, X.H.; Fu, X.Y.; Sui, H. Discrimination of geographical origin of cultivated Polygala tenuifolia based on multi-element fingerprinting by inductively coupled plasma mass spectrometry. Sci. Rep. 2017, 7, 12577. [Google Scholar] [CrossRef] [PubMed]
- Wang, H.W.; Liu, Y.Q. Evaluation of trace and toxic element concentrations in Paris polyphylla from China with empirical and chemometric approaches. Food Chem. 2010, 121, 887–892. [Google Scholar] [CrossRef]
- Ma, X.F.; Fan, L.L.; Mao, F.Y.; Zhao, Y.S.; Yan, Y.G.; Tian, H.L.; Xu, R.; Peng, Y.Q.; Sui, H. Discrimination of three Ephedra species and their geographical origins based on multi-element fingerprinting by inductively coupled plasma mass spectrometry. Sci. Rep. 2018, 8, 10271. [Google Scholar] [CrossRef] [PubMed]
- Esteki, M.; Vander Heyden, Y.; Farajmand, B.; Kolahderazi, Y. Qualitativeand quantitative analysis of peanut adulteration in almond powder samples using multi-elemental fingerprinting combined with multivariate data analysis methods. Food Control 2017, 82, 31–41. [Google Scholar] [CrossRef]
- Melucci, D.; Locatelli, M.; De Laurentiis, F.; Zengin, G.; Locatelli, C. Herbal medicines: Application of a sequential voltammetric procedure to the determination of mercury, copper, lead, cadmium and zinc at trace level. Lett. Drug Des. Discov. 2018, 15, 270–280. [Google Scholar] [CrossRef]
- Melucci, D.; Casolari, S.; De Laurentiis, F.; Zappi, A.; Locatelli, M.; Locatelli, C. Toxic metals in Camellia sinensis: Analytical methods, human health risk and regulations. In Agricultural Research Updates; Gorawala, P., Mandhatri, S., Eds.; Nova Science Publ. Inc.: New York, NY, USA, 2019; Volume 26, pp. 99–146. [Google Scholar]
- Melucci, D.; Locatelli, M.; Locatelli, C. Trace level voltammetric determination of heavy metals and total mercury in tea matrices (Camellia sinensis). Food Chem. Toxicol. 2013, 62, 901–907. [Google Scholar] [CrossRef]
- Welz, B.; Sperling, M. Atomic Absorption Spectrometr, 3rd ed.; Wiley VCH: Weinheim, Germany, 1999. [Google Scholar]
- Currie, L.A. Detection: International update, and some emerging dilemmas involving calibration, the blank, and multiple detection decisions. Chemometr. Intell. Lab. Syst. 1997, 37, 151–181. [Google Scholar] [CrossRef]
- Locatelli, C. Simultaneous determination of osmium, ruthenium, copper and lead by electrocatalytic voltammetry. Application to superficial waters. Microchem. J. 2012, 102, 54–60. [Google Scholar] [CrossRef]
- Locatelli, C. Ultratrace osmium, ruthenium and lead in airbornr particulate matter: Peak area as instrumental datum to improve their simultaneous voltammetric determination. Electroanalysis 2012, 24, 2273–2282. [Google Scholar] [CrossRef]
- Fujinaga, T.; Isutsu, K. The Use of Electrochemical Masking for the Polarographic Analysis. Rev. Polarogr. 1961, 9, 36–40. [Google Scholar] [CrossRef][Green Version]
- Miller, J.C.; Miller, J.N. Statistics and Chemometrics for Analytical Chemistry, 6th ed.; Pearson Education Ltd.: London, UK, 2010. [Google Scholar]
- Ferreira, S.L.C.; Korn, M.G.A.; Ferreira, H.S.; da Silva, E.G.P.; Araujo, R.G.O.; Souza, A.S.; Macedo, S.M.; Lima, D.C.; de Jesus, R.M.; Amorim, F.A.C.; et al. Application of multivariate techniques in optimization of spectroanalytical methods. Appl. Spectrosc. Rev. 2007, 42, 475–491. [Google Scholar] [CrossRef]


Publisher’s Note: MDPI stays neutral with regard to jurisdictional claims in published maps and institutional affiliations. |
© 2021 by the authors. Licensee MDPI, Basel, Switzerland. This article is an open access article distributed under the terms and conditions of the Creative Commons Attribution (CC BY) license (https://creativecommons.org/licenses/by/4.0/).