1. Introduction
Fingerprints are used to identify an individual because fingerprints are unique to each person and remain unchanged throughout one’s life. In forensic investigation, fingerprint powder containing magnetic or metallic particles is generally used to visualize fingerprints [
1]. Electric dust is attached to fingerprints in the first place. Fine particles such as silica contained in fingerprint powder electrostatically adhere to the electric dust, facilitating the visualization of fingerprints. Such fingerprint powder basically produces white and black patterns, but problems arise when fingerprints are on a substrate with multiple colors (such as banknotes) or with different smoothness. To prevent this, fluorescent fingerprint powders have also been developed [
1,
2].
Fingerprints can also help identify chemicals and metabolites excreted by sweat glands on fingertips. Gold or magnetic nanoparticles having antibody recognition properties are used to identify specific drugs or drug metabolites in fingerprints [
3,
4]. Mass spectrometry is a powerful tool for the identification of chemicals and metabolites in fingerprints. For example, gas chromatography mass spectrometry (GC-MS) was used to detect chemical changes in lipid component [
5]. Liquid chromatography mass spectrometry (LC-MS) was used to identify oxidation products of squalene [
6], and methadone and its metabolites [
7]. Matrix-assisted laser desorption/ionization (MALDI) [
8,
9,
10], surface-assisted laser desorption/ionization (SALDI) [
11], and desorption electrospray ionization (DESI) [
12] were also used for imaging of fingerprints. Unfortunately, mass spectrometry has one drawback: as sample ionization is carried out, the sample is inevitably destroyed during measurement, leading to the loss of important fingerprint evidence. However, it was reported that the original fingerprint image could be restored even after MALDI mass measurements using α-cyano-4-hydroxycinnamic acid (CHCA) used as matrix [
13].
We report herein a method for detecting drugs in fingerprints by SALDI mass spectrometry. We would like to mention in particular that the drug in the fingerprint could be detected with high efficiency by using zeolite. Using CHCA adsorbed on the zeolite surface, fingerprints collected from multiple volunteers were measured. All volunteers took the same antipyretic, the main ingredients of which are acetaminophen (AAP), ethenzamide (Eth), and caffeine (Caf). Not only AAP but also its glucuronic acid conjugate (GAAP), Caf, Eth, and urea were detected. This method using CHCA adsorbed on zeolite was adopted in our previous study to detect drugs and metabolites in urine [
14]. We collected the fingerprints over time to see how the drug and its metabolite in the fingerprints changed with time. As expected, the peak of metabolite GAAP appeared at a later time relative to that of AAP. By curve-fitting analysis, we estimated the time constants until the drug and its metabolite were excreted into sweat in the fingerprints. Finally, through optical microscopy, we confirmed whether fingerprint recovery is possible after the application of CHCA/zeolite.
2. Materials and Methods
A CHCA (α-cyano-4-hydroxycinnamic acid) solution (4 mg/mL) was used as the matrix solution for MALDI mass measurements. A mixture of acetonitrile and water (volume ratio 7:3) was used as the solvent. CHCA and zeolite (JRC-Z-HM20) were mixed in a mortar at the mass ratio of 1:2 and suspended in the mixed solvent of acetonitrile and water.
In this study, fingerprints collected from multiple volunteers who ingested a commercially available antipyretic due to such symptoms as headache were measured. Fingerprint samples were provided by the following procedure so that they would not be affected by anything other than the excretions from the fingertips. (1) The hands were washed with commercially available soap for 30 s. (2) The soap was rinsed off with tap water for 30 s. (3) The hands were wiped with dry paper towel for 30 s. (4) The fingertips were pressed against a stainless-steel sample plate for 30 s. (5) One microliter of CHCA matrix solution or CHCA/HM20 suspension was dropped onto the fingerprints. (6) After evaporating the solvent, the ions in the fingerprints were measured. Measurements were carried out by a commercial time-of-flight (TOF) mass system (MALDI micro MXTM, Waters, Milford, MA, USA) in the positive ion mode using a reflectron with a nitrogen laser operated at 337 nm and the excitation laser power of 5.9 µJ. Mass spectra were obtained by averaging 200 laser shots at random sample spots.
Microscopic images were taken using a commercially available inverted microscope (LEICA DMi8, Wetzlar, Germany). For the fingerprint preservation experiments, fingerprints were collected by pressing fingertip against a cover glass with a thickness of 0.12 mm to 0.17 mm (MATSUNAMI, 20 × 30 mm) for 30 s. The CHCA/HM20 suspension was dropped onto the fingerprint, and the solvent was evaporated. An Nd:YAG laser (New Wave Research, Tempest, 266 nm, 10 Hz, 18 μJ) was used, and the output was focused by an f = 200 quartz lens on the cover glass at random spots. After laser light irradiation, CHCA/HM20 was washed off by using a mixed solvent of acetonitrile and water (volume ratio 7:3) of 10 mL volume. After the solvent was dried, activated carbon powder (Wako) was sprinkled on the cover glass to visualize the fingerprint.
3. Results
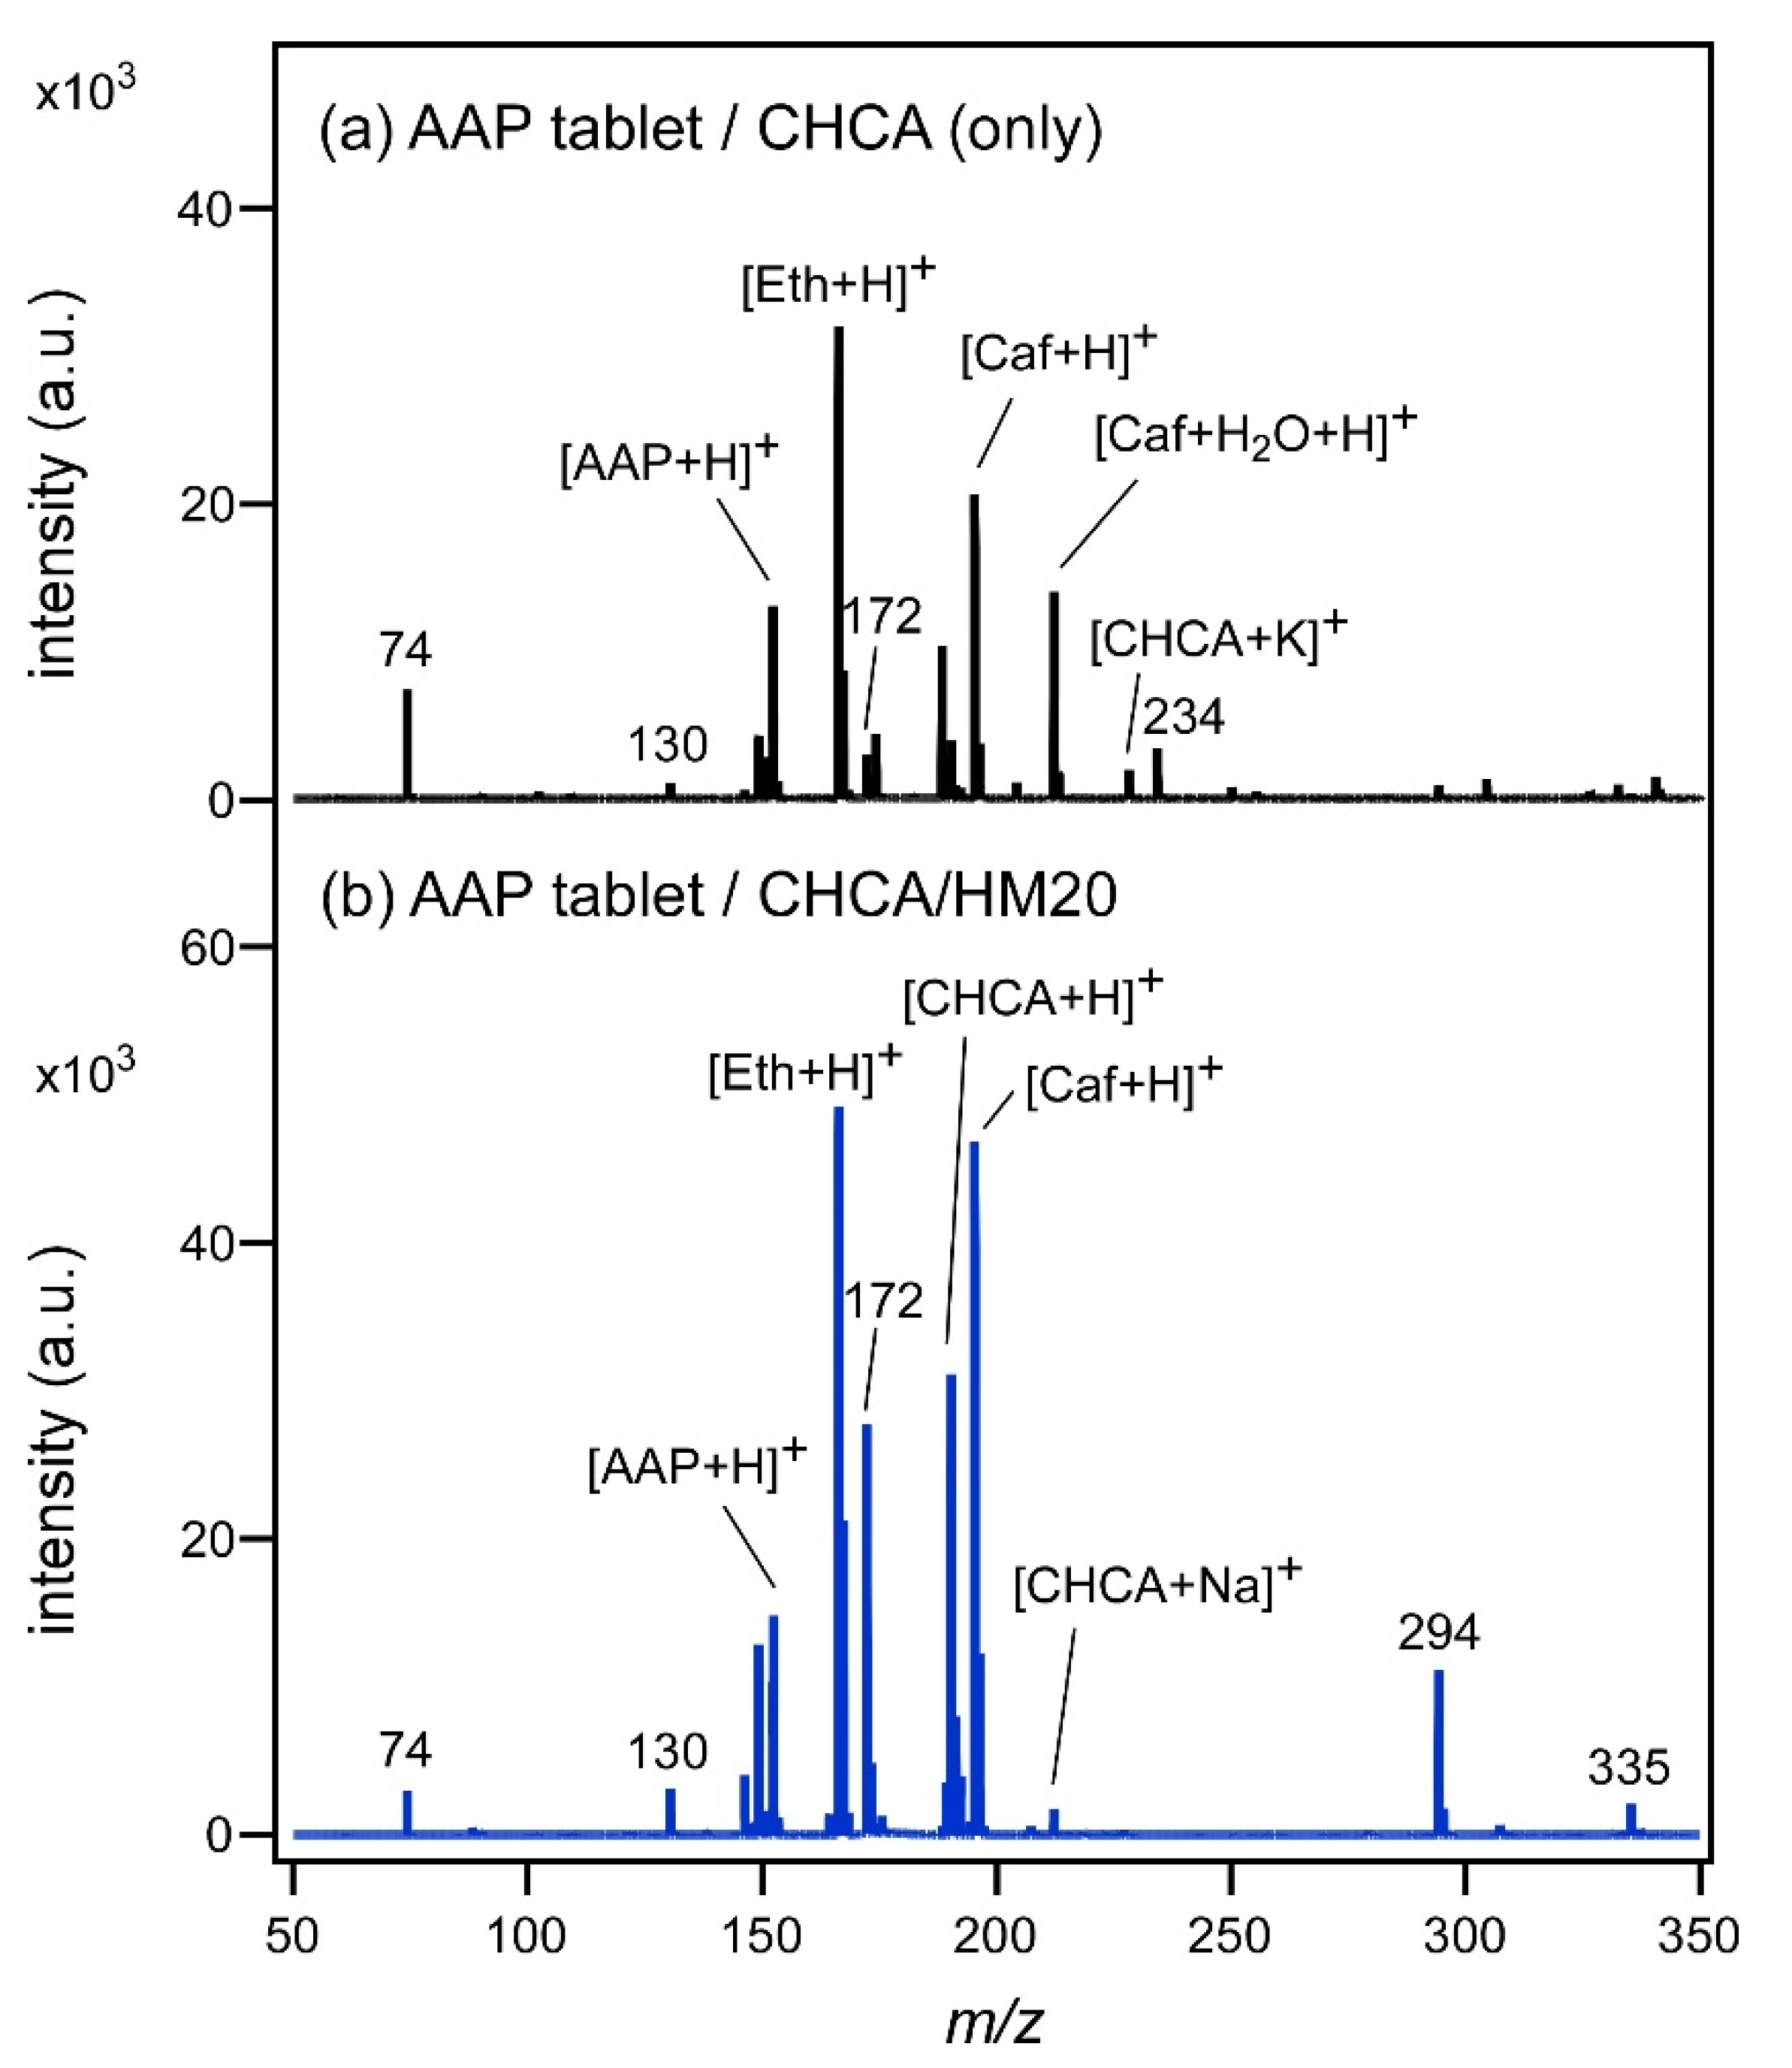
Figure 1a shows the MALDI mass spectrum of 1 mg of AAP tablet measured by using CHCA as the matrix. AAP, Eth, and Caf, which are the main ingredients in the tablet, were observed as proton adducted ions. One tablet contains 150 mg of AAP, 80 mg of Eth, and 35 mg of caffeine hydrate (C
8H
10N
4O
2⋅H
2O), and weighs of 0.3 g. Therefore, the amounts of AAP, Eth, and Caf used for the measurement in
Figure 1a were calculated as 29.8, 14.5, and 4.53 nmol, respectively.
Figure 1b shows the SALDI mass spectrum of AAP tablet measured by using CHCA/HM20, which was used for the subsequent fingerprint measurement. Even when CHCA/HM20 was used, the peaks of protonated AAP, Eth, and Caf were observed, as in the case of
Figure 1a. Furthermore, the intensities of the peaks increased; AAP was increased by 1.14 times, Eth by 1.55 times, and Caf by 2.28 times. Therefore, it was clarified that such chemical substances as AAP, Eth, and Caf could be ionized effectively by SALDI using CHCA/HM20. The AAP tablet contains hydroxypropyl cellulose, calcium silicate, α-starch, and magnesium stearate in addition to the above three ingredients. Therefore, some of the unknown peaks may have been derived from these substances. The
m/
z value, assignment, and intensity for each peak observed in
Figure 1 were summarized in
Table 1.
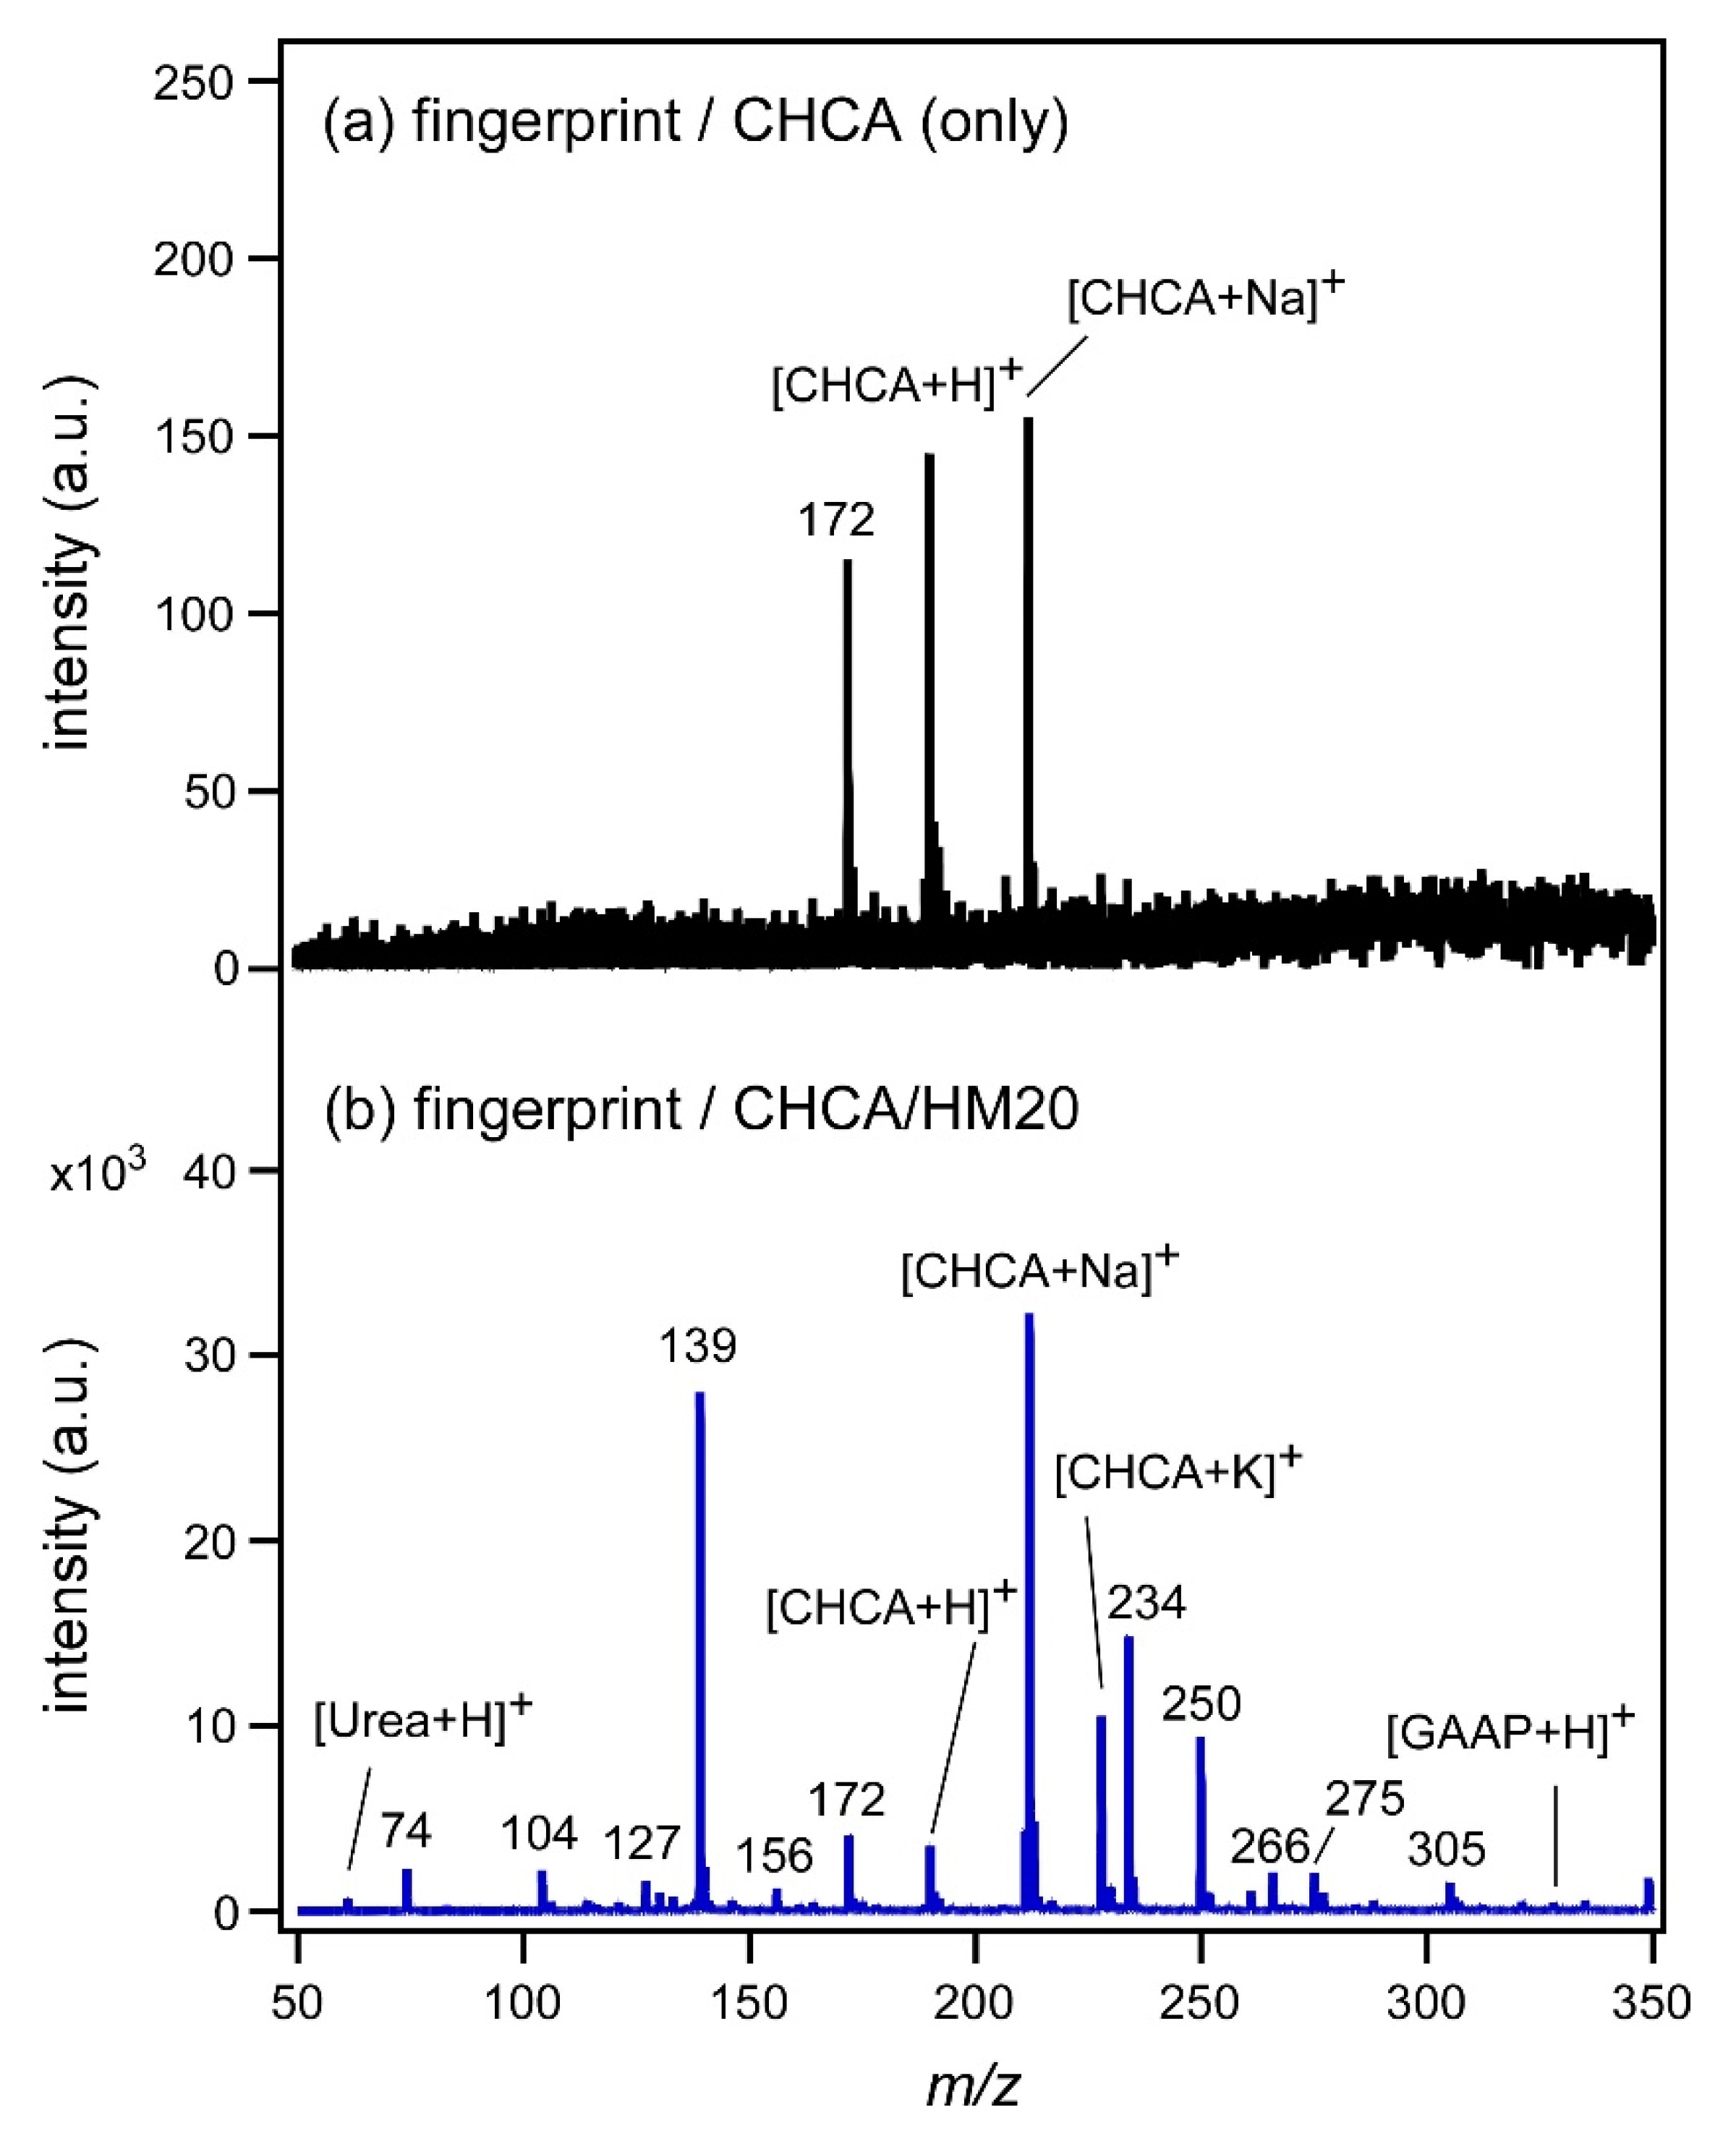
Figure 2a shows the MALDI mass spectrum of a fingerprint taken 4 h after ingesting the AAP tablet. As CHCA was used as the matrix, the peaks of H
+ and Na
+ adducted CHCA were observed. However, their intensities were weak, and peaks assignable to the ingredients in the tablet were not observed at all. This is probably because many impurities in the fingerprint suppressed the ionization of CHCA and the ingredients in the AAP tablet. A peak with an almost equal intensity to the CHCA peak was observed at
m/
z = 172, but its origin is unknown. This peak at
m/
z = 172 was also observed in
Figure 1b, and was probably attributed to CHCA.
The situation where chemical species in fingerprint could not be observed well by MALDI mass measurement using CHCA was dramatically improved by using the zeolite surface.
Figure 2b shows the SALDI mass spectrum measured using CHCA/HM20. The use of zeolite significantly enhanced the peaks related to CHCA. Furthermore, some peaks assignable to chemical species in the fingerprint could be observed. For example, the peak of protonated urea, [urea+H]
+, was observed at
m/
z = 61, and is evidence of excretion from the fingertip [
15]. As a peak related to the drug contained in the tablet, the GAAP peak was observed at
m/
z = 328 as a proton adducted ion, albeit weakly at this magnification. Unknown peaks were observed at
m/
z = 234 and 250. As the intensities of these peaks were as strong as that of CHCA peak, it seems unlikely that these peaks are due to the drug in the fingerprint or its metabolite.
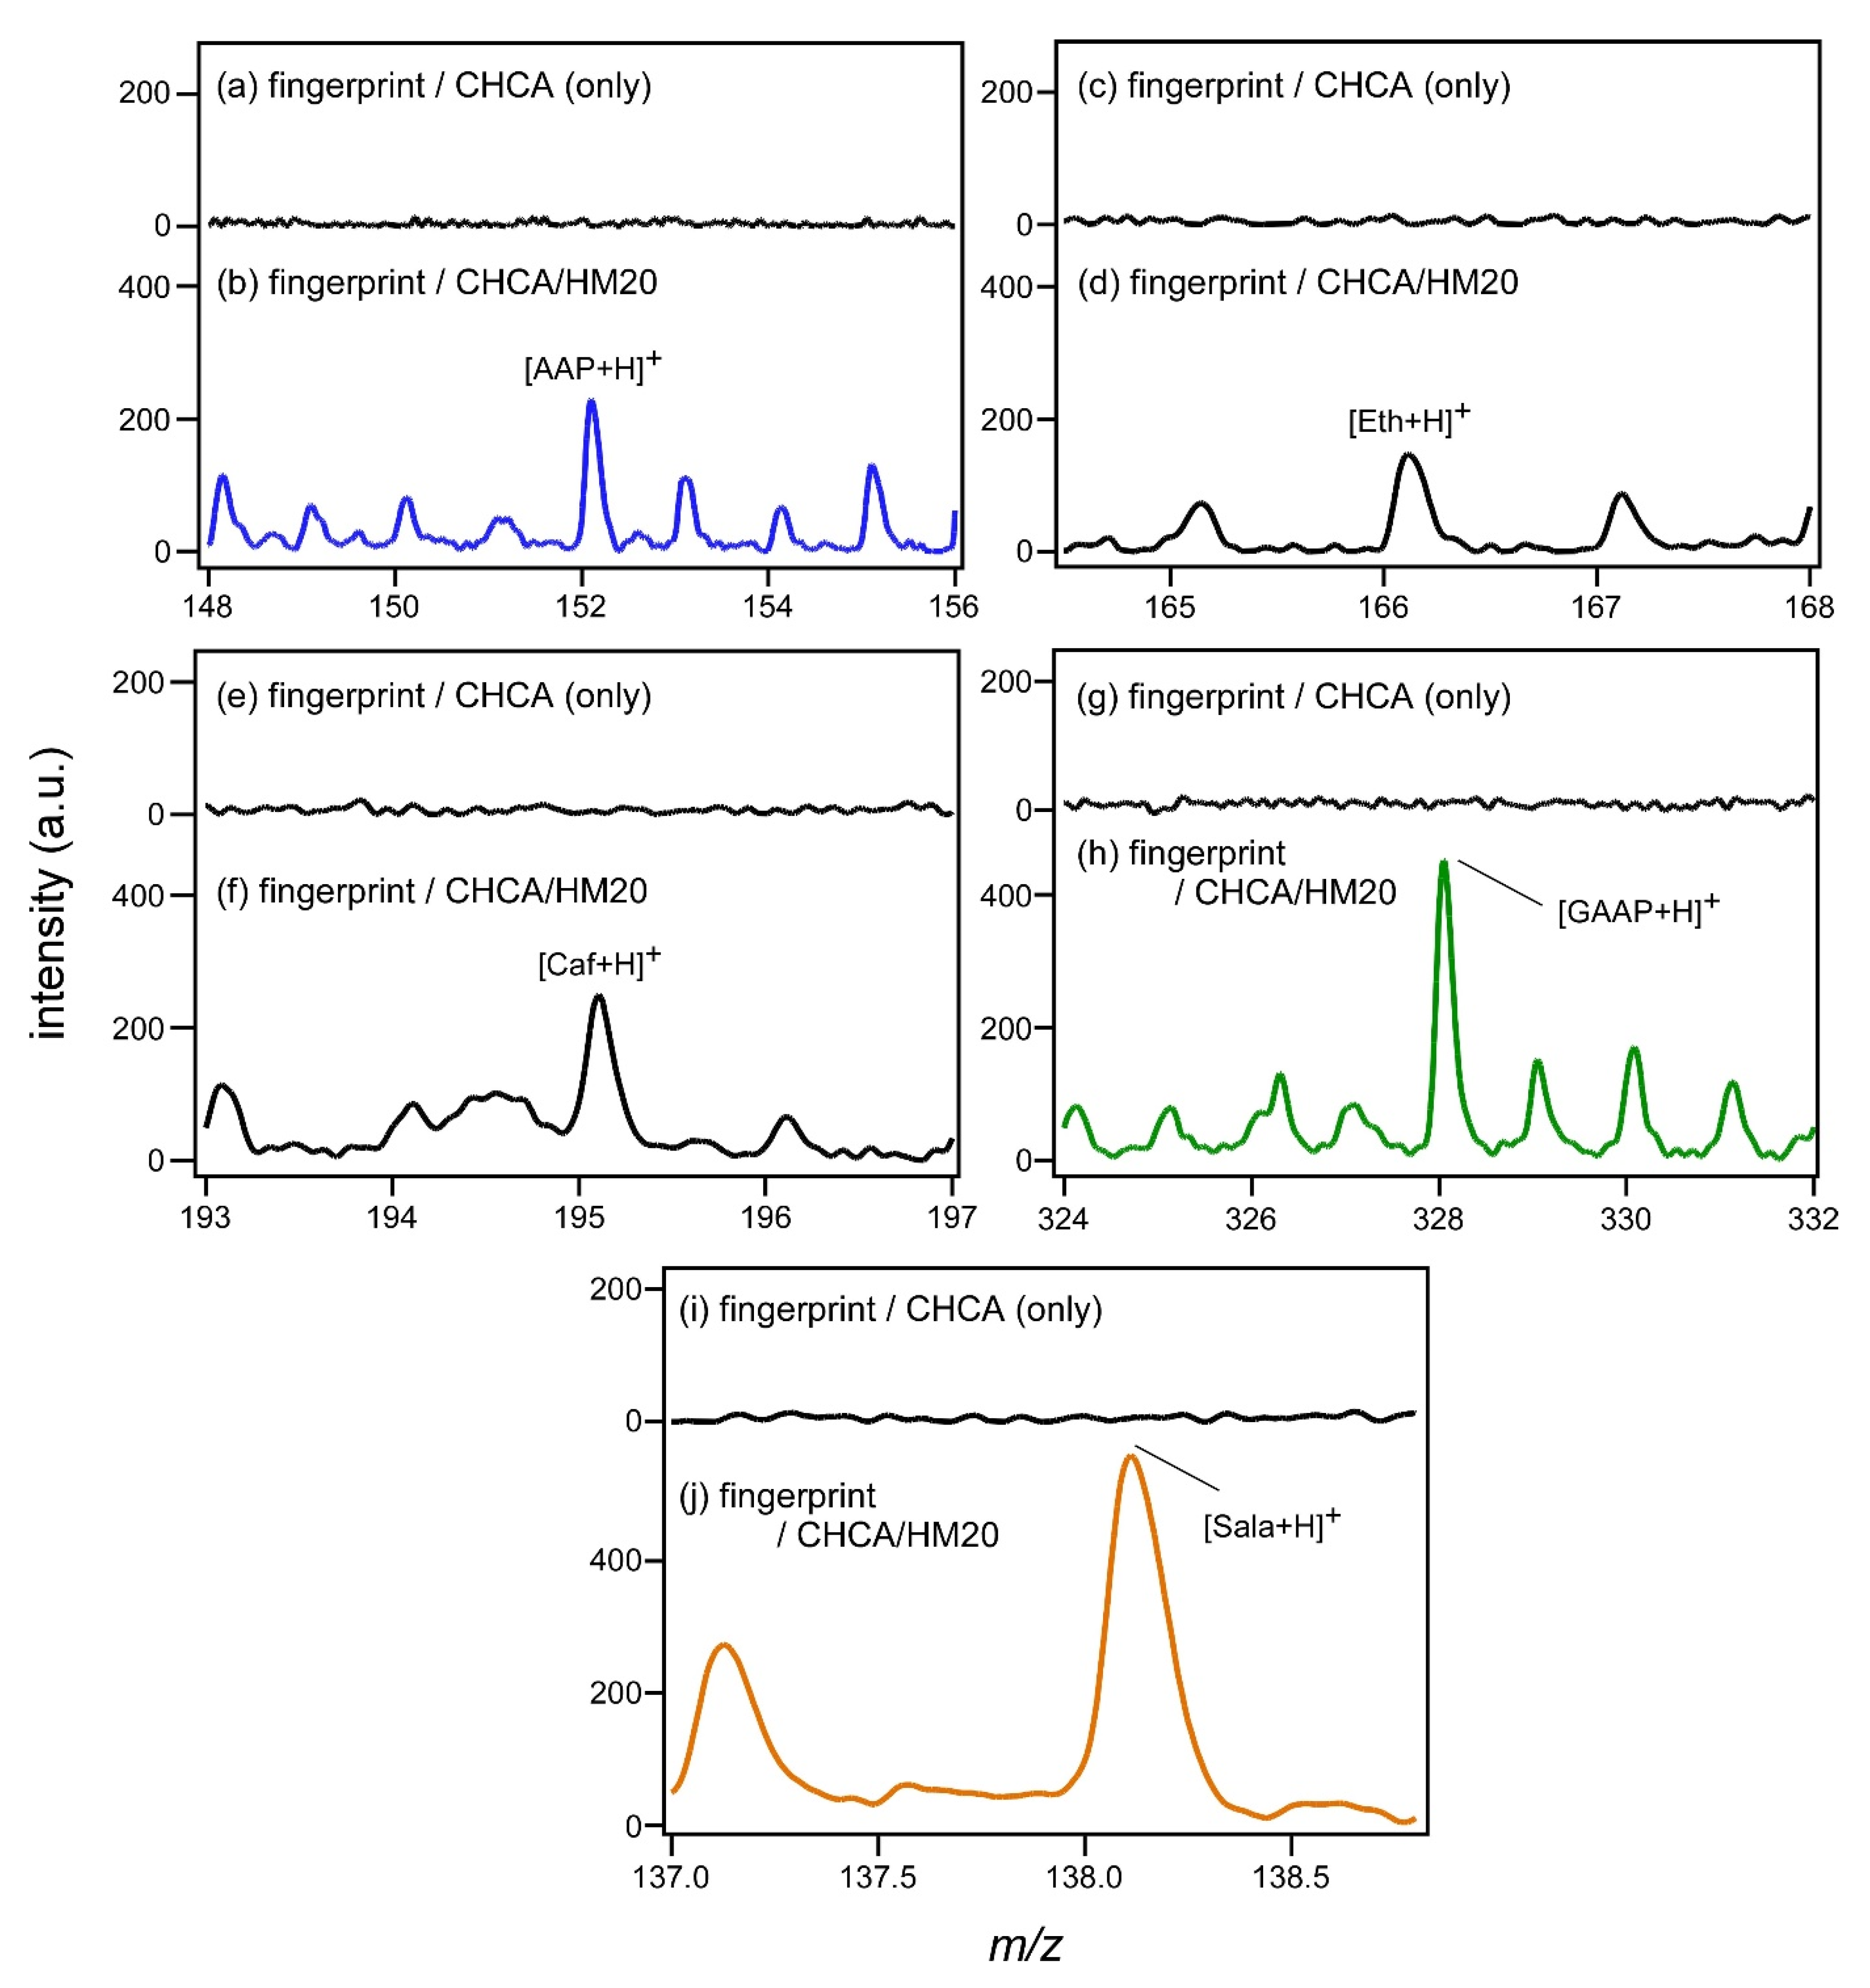
The peaks of protonated AAP, Eth, Caf, and GAAP in
Figure 2b are enlarged and displayed in
Figure 3. The results of MALDI mass measurement using CHCA only as the matrix are also shown for comparison. The peaks of the above-mentioned chemical species in the fingerprint were observed for the first time by using SALDI with zeolite support even though their intensities were low. It is known that Eth contained in the tablet is converted into Sala by hydrolysis. As the molecular weight of Sala is 137, the peak of protonated Sala should be observed at
m/
z = 138 if Sala is present in the fingerprint. In fact, a peak thought to be derived from protonated Sala was observed at
m/
z = 138, as shown in
Figure 3j. Regarding the strong peak of
m/
z = 139 observed in
Figure 2, it may be possible to consider that this was a peak of proton-adducted salicylic acid (Sal). As the acetaminophen tablets taken by the subjects do not contain Sal, it should be considered that Sal was produced by metabolism. However, it is noted that the peak intensity of
m/
z = 139 was strong and that it did not show a clear time dependence, as shown later in Figure 5 (
Figure S1). Peaks shown in
Figure 3, the peak at
m/
z = 139 in
Figure 2 and the deviations from the accurate mass, are summarized in
Table 2.
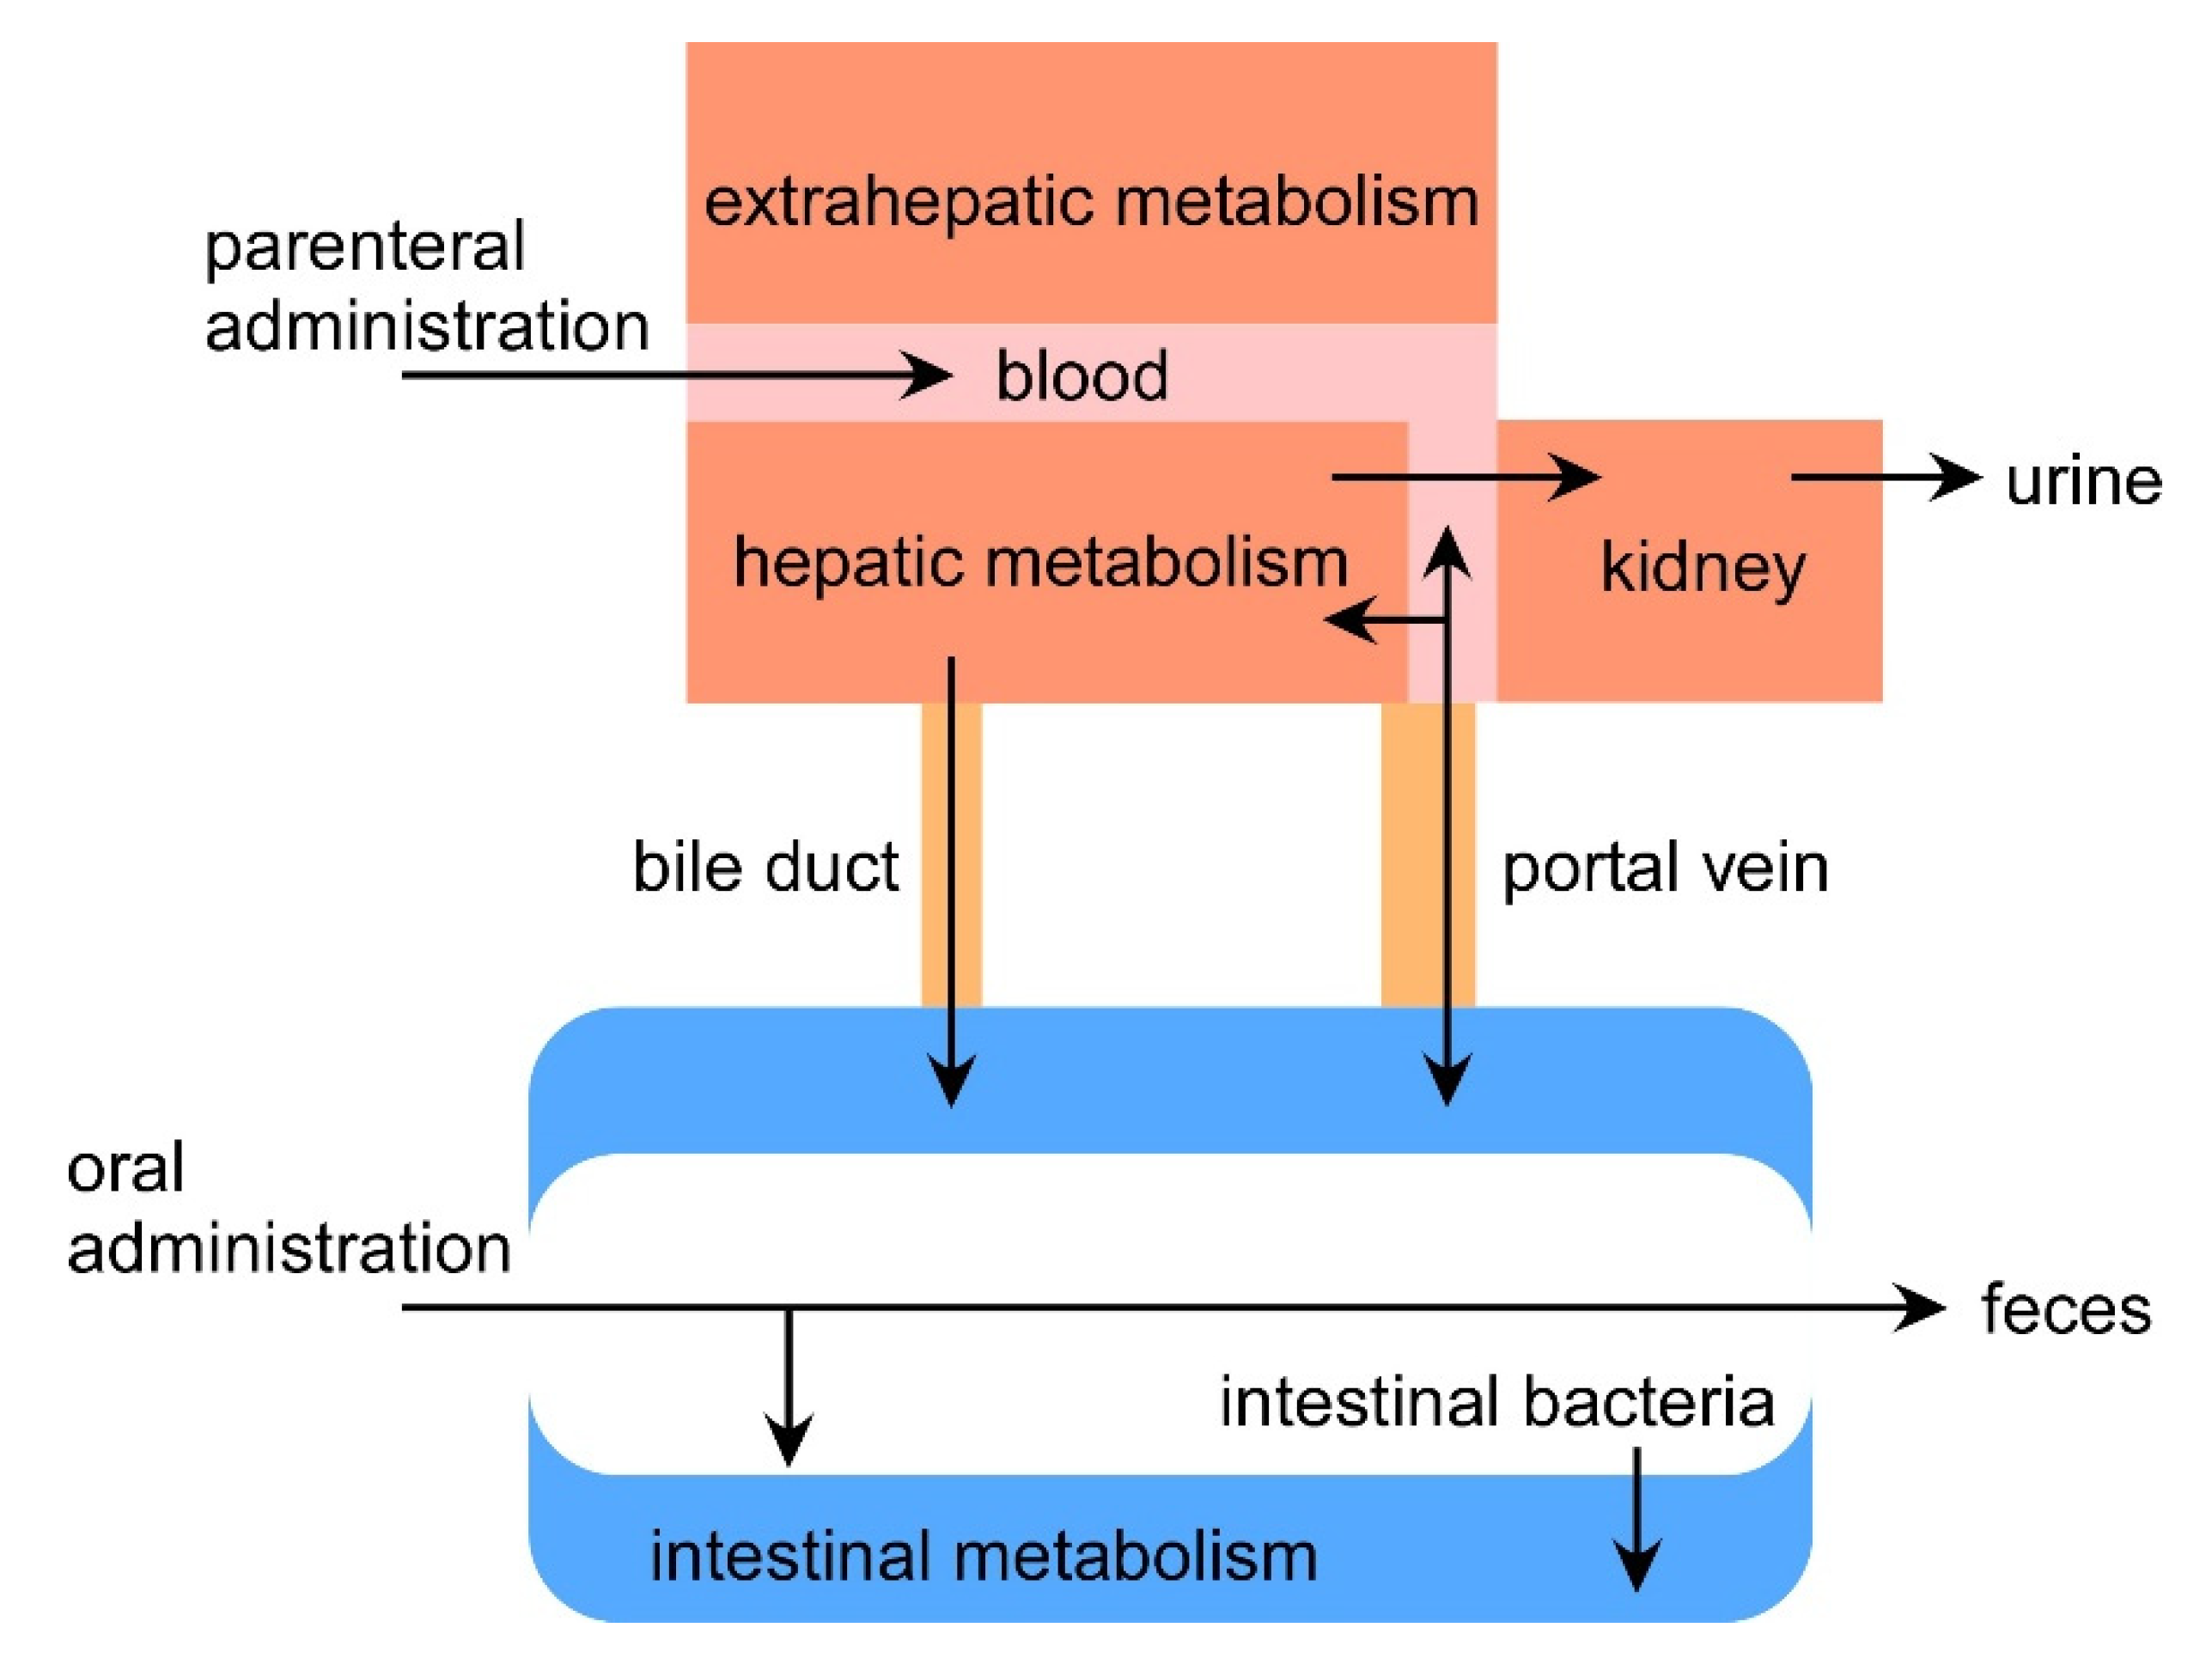
A schematic diagram of drug metabolism in the human body is shown in
Figure 4. A drug is metabolized by the liver and excreted into the bile by oral administration. Most drugs undergo oxidation by CYP450 (hepatic cytochrome CYP450 enzyme) in the liver (phase I reaction), followed by a conjugation reaction (phase II reaction) to become water-soluble, and are excreted with bile into the intestinal tract. In the phase I reaction, the drug undergoes oxidation, reduction, and hydrolysis to make it more soluble in water. In the phase II reaction, water-soluble substances, such as glucuronic acid, amino acids, and sulfuric acid, are attached to make the drug soluble in water. The conversion of Eth into Sala observed in
Figure 3j corresponds to the phase I reaction. A phase I reaction followed by a phase II reaction transforms AAP into its glucuronide conjugate (GAAP). This change was confirmed by the detection of GAAP excretion into the fingerprint, as shown in
Figure 3h.
Figure 2 and
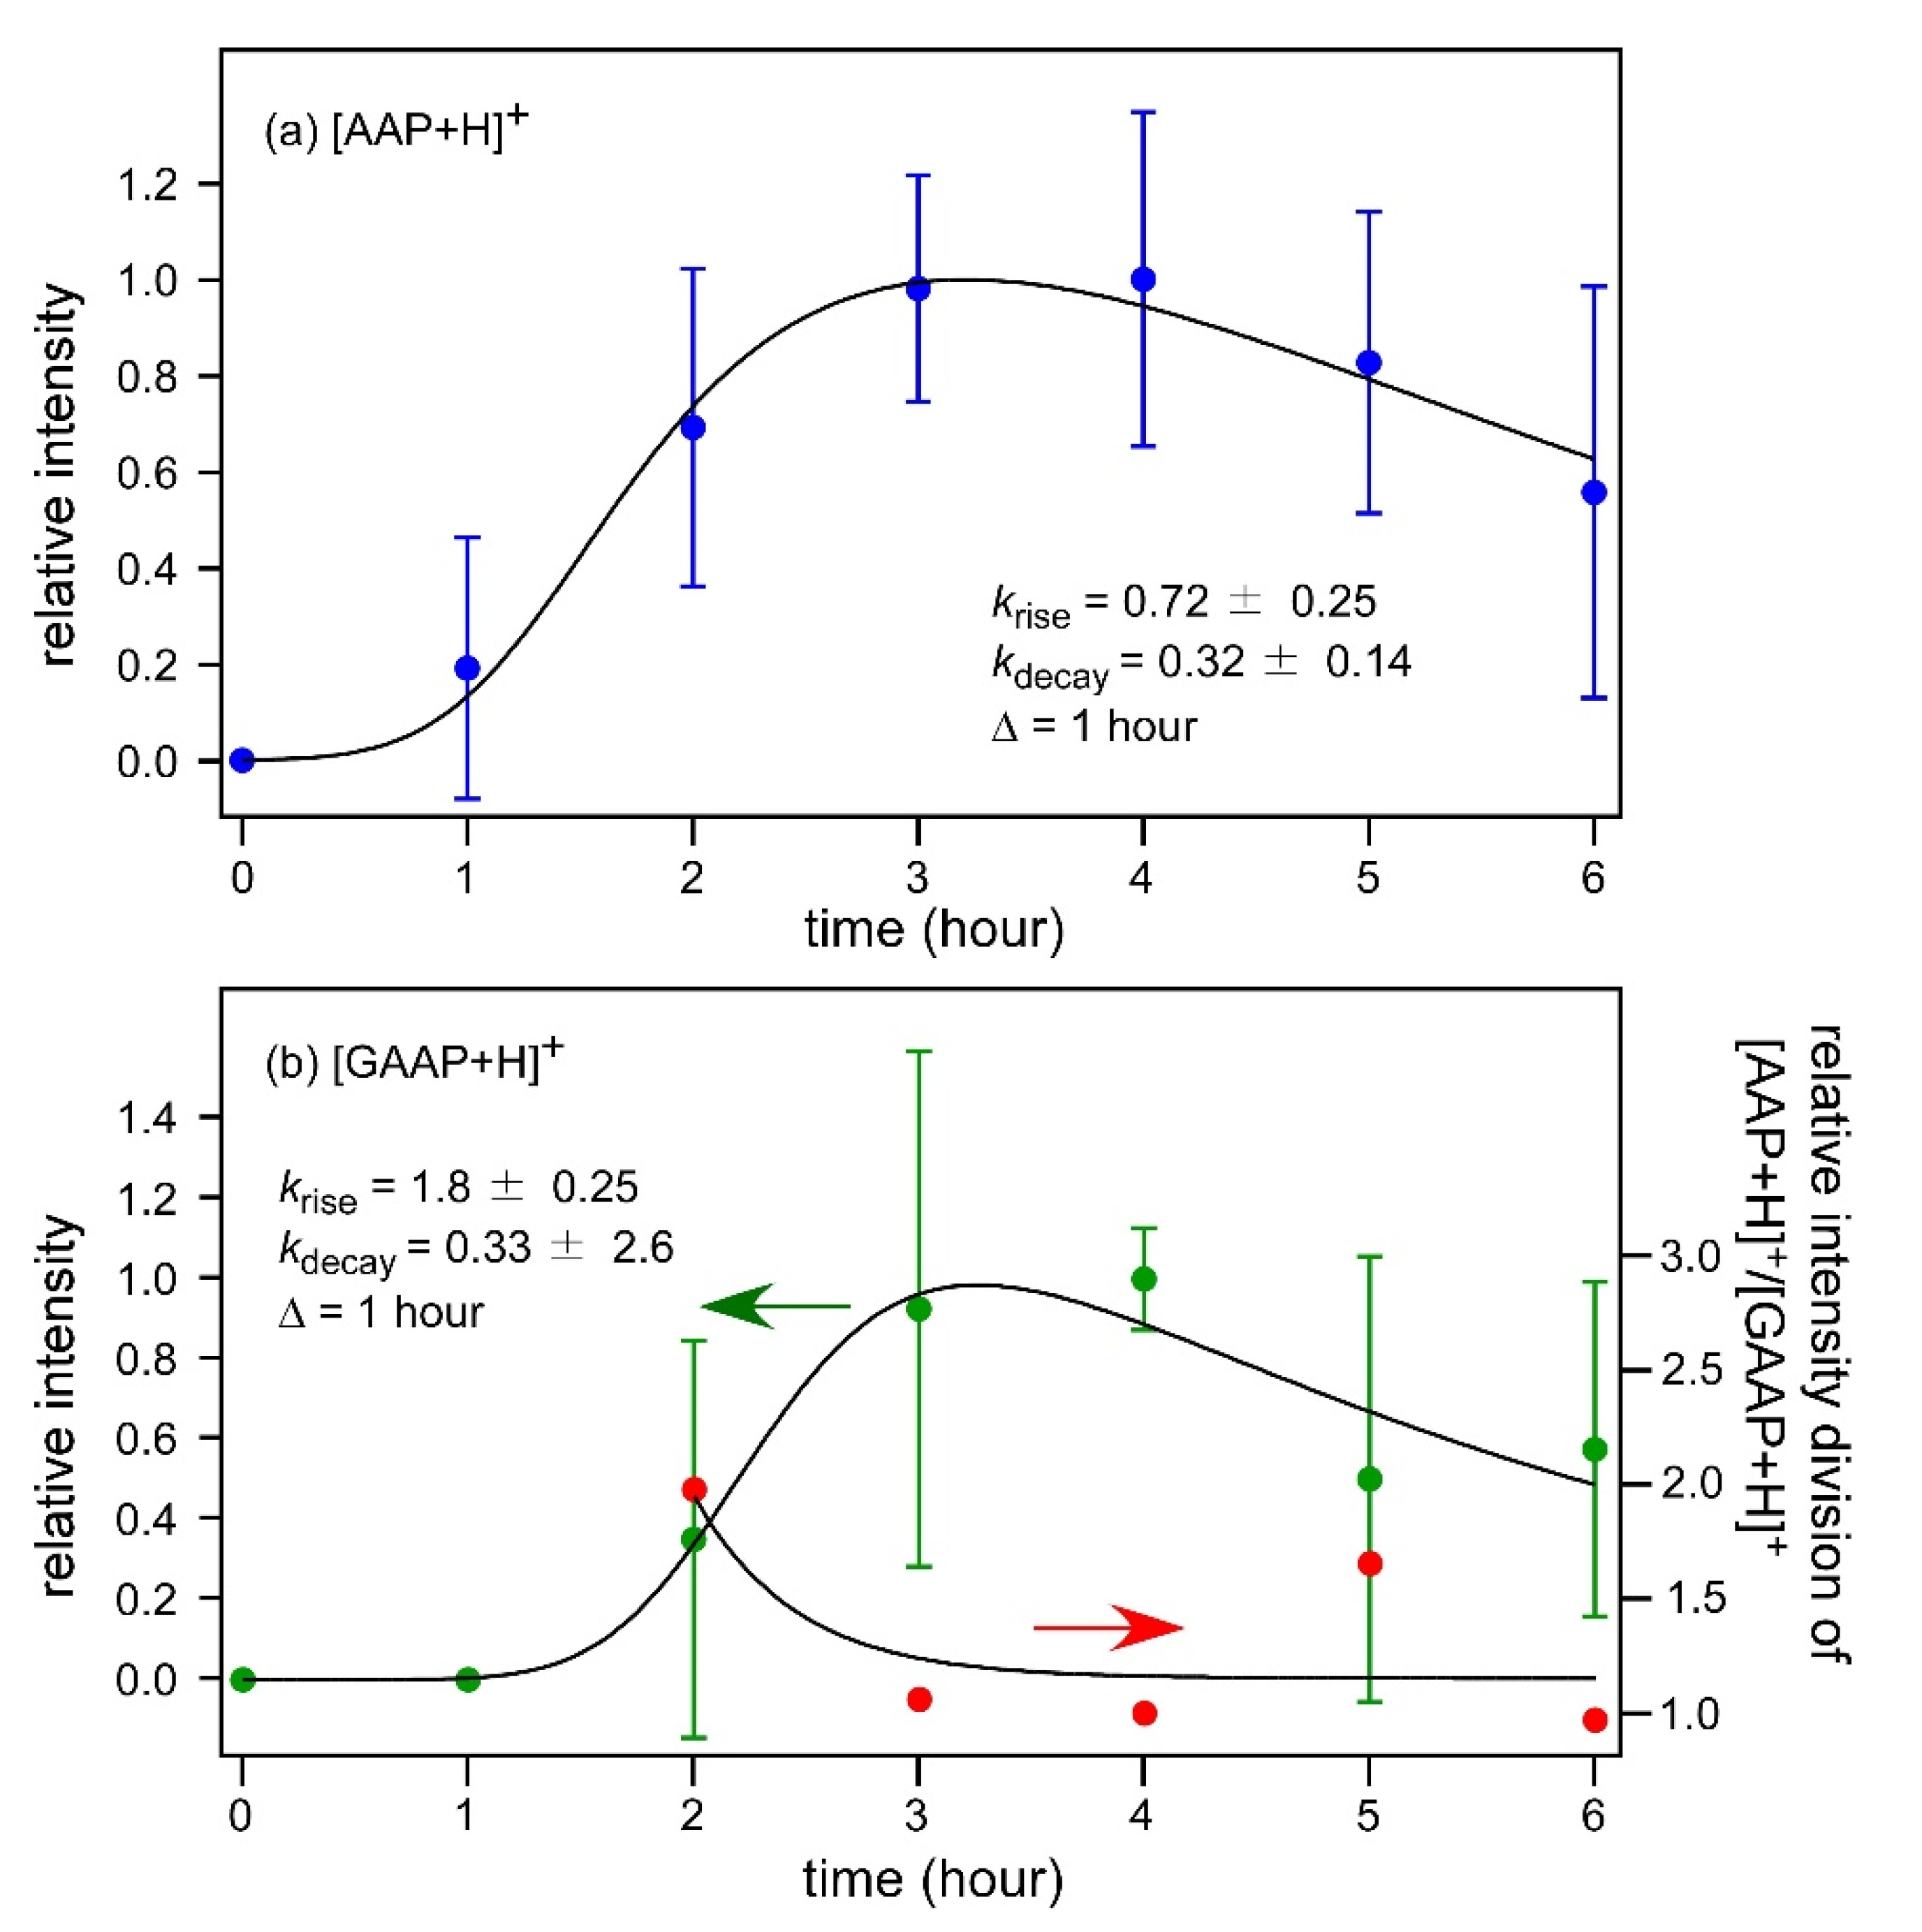
Figure 3 show the mass spectra of fingerprint obtained 4 h after ingestion of an AAP tablet. In order to investigate drug excretion and metabolism, mass spectra were measured at various times after ingestion; the time dependence of the peak intensities of [AAP+H]
+ and [GAAP+H]
+ is shown in
Figure 5. The results in
Figure 5 are the average of N = 3 measurements, and the standard deviations are shown as error bars. The results could be reproduced by double exponential functions convoluted with a Gaussian line profile as the response function. Here, the fitting was performed assuming that the response function by the human body was 1 h (Δ = 1 h). The reaction rate constants (
) for the rise and decay components are
and
for the peak intensity of [AAP+H]
+, and
and
for the peak intensity of [GAAP+H]
+, respectively. It can be seen that the increase of [GAAP+H]
+ peak started later than that of [AAP+H]
+ peak, although the rise time constant for GAAP is larger than that for AAP. In fact, the time intercepts for both time profiles were determined by the fitting analysis and were 1.1 h for [AAP+H]
+ and 1.9 h for [GAAP+H]
+ after ingestion of the drug. In other words, because it took time to metabolize AAP into GAAP in the body, the time until the appearance of [GAAP+H]
+ was delayed. Nevertheless, [GAAP+H]
+ showed a fast rise, and both [AAP+H]
+ and [GAAP+H]
+ reached maximum concentrations at approximately 3 h after ingestion. It could also be seen that the decay of both species was approximately 0.3 (h
−1). This means that AAP and GAAP were excreted from the body with a half-life of approximately 3.3 h. The measurement was performed only up to 6 h after ingestion. However, extrapolation of the figure revealed that the excretion of both components would be almost completed 8 h after ingestion. In
Figure 5b, the value of [AAP+H]
+/[GAAP+H]
+ was also depicted. It was confirmed that the amount of AAP decreased single exponentially compared with that of GAAP, reflecting the metabolism of AAP. For other metabolites of AAP, however, the time change as shown in
Figure 5 could not be measured due to the unstable observation of peaks.
Finally, we would like to discuss fingerprint recovery. Mass spectrometry is unsuitable for fingerprint measurement because it destroys the sample, which, in this case, is fingerprint that serves as important forensic evidence, during measurement.
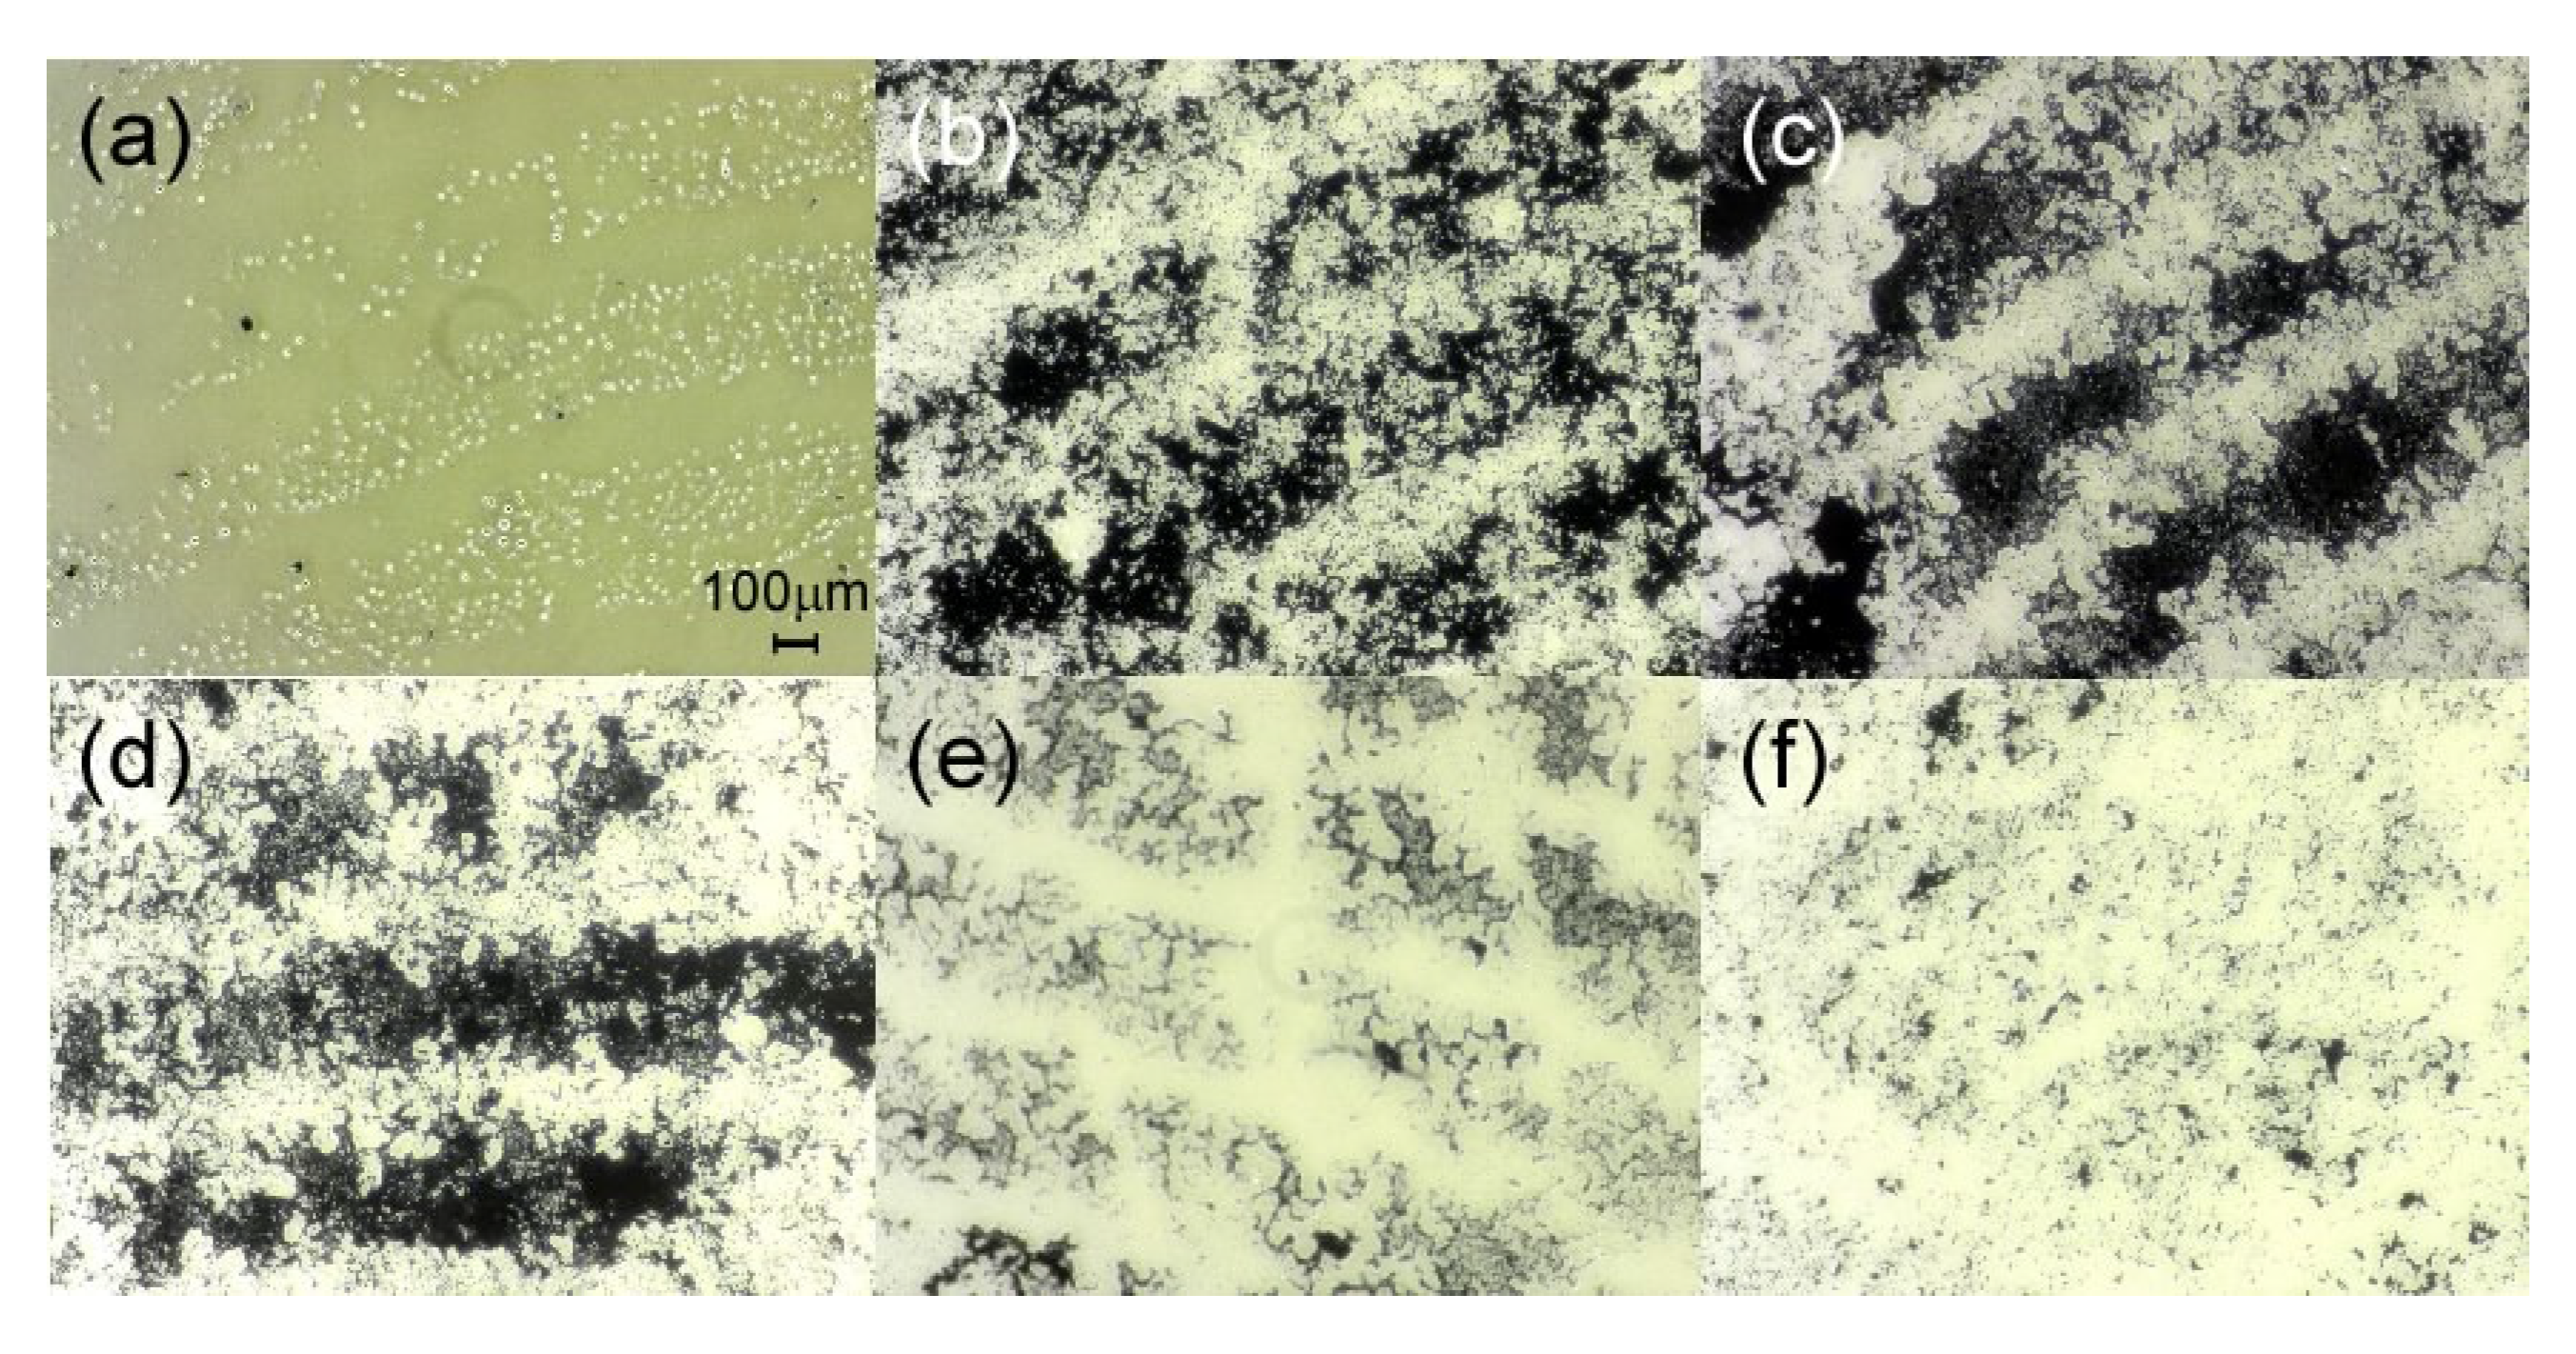
Figure 6 shows the optical micrographs of portions of fingerprints. It should be noted that these are not the fingerprints measured in this mass spectrometric study.
Figure 6a shows an image of an unprocessed fingerprint. The white stripes of the fingerprint are visible, although the stripes are not clear.
Figure 6b is an image of a fingerprint visualized with activated carbon. Activated carbon adheres to sweat and fat components in the fingerprint, making it easier to see the striped pattern. In
Figure 6c, CHCA/HM20 was applied to the fingerprint used in
Figure 6a and dried. Generally, fingerprint powder contains silica in addition to aluminum or magnetic particles. HM20, which is used as a material to support CHCA, is an aluminosilicate, and is thus expected to play the same role as silica in fingerprint powder. In fact, compared with
Figure 6b, the image was clearer when CHCA/HM20 was applied. Note that activated carbon was not used in
Figure 6c.
Figure 6d–f are fingerprint images after laser irradiation. From
Figure 6d, it was confirmed that the fingerprint shape remained distinct even after CHCA/HM20 was washed off after laser irradiation for 30 s. However, the fingerprint shape became unclear when the laser irradiation time was increased to 1 or 5 min. Of course, this situation would also be affected by the method of washing off CHCA/HM20, the amount of solvent, and the laser power. Here, the fingerprints from
Figure 6d–f were washed in the same way with 10 mL of solvent. The laser power is 18 μJ, which is approximately three times the power used in mass measurements. The wavelength used is 266 nm, which is also different from the wavelength used in the mass measurement in this study. In actual mass measurements, the laser irradiation time was 20 s (200 shots in 10 Hz operation), and the laser power used was sufficiently low (5.9 μJ). The results in
Figure 6 were obtained under fairly severe conditions. As the fingerprints are preserved even under such conditions, we can say that forensic evidence is preserved after mass measurements.


