1. Introduction
Today, histological scoring systems (HSS) are an essential tool of histological diagnosis, classification, and staging of chronic liver disease [
1,
2,
3]. To date, a considerable number of histological scoring systems (HSS) have been developed as a means to standardize tissue morphology and morphometry analyses, predict disease progression, outcomes, and mortality in liver disease [
1,
2,
3,
4]. However, most of the commonly used HSS can only provide qualitative or, at best, semiquantitative data, and are therefore associated with certain limitations, including suboptimal precision, reliability, and sensitivity. Importantly, quantitative statistical analysis cannot be performed directly on categorical data, which sometimes limits the interpretation of experimental results [
5,
6,
7].
In view of the above, this study was aimed to develop a simple and efficient algorithm for semiquantitative analysis of scored histology data using the extended Fisher’s exact test in the R environment.
Non-alcoholic fatty liver disease (NAFLD) is an umbrella term covering a wide range of conditions characterized by excessive hepatic lipid accumulation, defined by the presence of steatosis in >5% of hepatocytes, in the absence of significant ethanol consumption or other plausible causes of liver injury [
8]. With a global prevalence of up to 30% and a constantly increasing incidence, NAFLD is considered the leading cause of chronic liver disease worldwide [
9]. Due to the high heterogeneity of the pathogenesis of metabolic liver disease, the term ‘metabolic [dysfunction]-associated fatty liver disease’ (MAFLD) has been proposed as a broader alternative to the conventional ‘NAFLD’ [
10].
20–25% of NAFLD cases are classified as non-alcoholic steatohepatitis (NASH), which has a significantly higher risk of progression to liver fibrosis, cirrhosis and end-stage liver disease, and hepatocellular carcinoma [
11]. According to modern concepts, multiple hits, including genetic differences, insulin resistance and intestinal microbiota, inducing adipokine secretion, endoplasmic reticulum (ER) and oxidative stress, account for NAFLD development and progression [
12]. Today, the drug development pipeline for NAFLD includes a plethora of candidates with diverse and innovative mechanisms of action, including incretin mimetics, fibroblast growth factor analogues [
13], antihyperglycaemic agents, lipogenesis inhibitors, ω-polyunsaturated fatty acids, and many more [
14,
15].
Due to the high medical and socioeconomic burden of this disease as well as the lack of treatment approved by either the European Medicines Agency or the United States Food or Drug Administration (FDA), NAFLD/NASH pharmacotherapy remains a major focus for current drug research and development [
9,
14].
L-ornithine L-aspartate (LOLA) enhances ammonia utilization in the urea cycle, promotes glycolysis and lactate metabolism via the malate/aspartate shuttle, indirectly stimulates cellular respiration and protein biosynthesis, scavenges reactive oxygen species, attenuates lipid peroxidation, and takes part in the regulation of the cell cycle, autophagy, and apoptosis [
16,
17]. Currently, LOLA use is mostly reserved for liver cirrhosis patients to ameliorate hepatic encephalopathy by facilitating ammonia detoxification [
18]. LOLA has been shown to improve hepatic microcirculation and reduce serum transaminase and triglyceride levels in NAFLD patients [
19], and prevent fibrosis progression in rats [
20].
Empagliflozin, a selective sodium/glucose cotransporter 2 (SGLT2) inhibitor, is approved for use in type 2 diabetes mellitus (T2DM) patients as a hypoglycaemic agent. Recently, it has been recognized to be beneficial for several other conditions including NAFLD. A number of small-scale clinical trials have found empagliflozin to reduce serum lipid and liver enzyme levels, and improve hepatic steatosis, ballooning, and fibrosis in NASH patients with or without T2DM [
21,
22].
However, to the best of our knowledge, direct effects of LOLA and EMPA on liver morphology in NAFLD or NASH have not yet been thoroughly explored. Therefore, we aimed to evaluate the effects of preventive LOLA or EMPA treatment on histological liver damage induced in C57Bl/6 mice by a chemical/dietary model of NASH, using the novel algorithm as the main statistical approach.
2. Materials and Methods
Animal experiments were carried out in full compliance with the principles of the Basel Declaration, European Convention for the Protection of Vertebrate Animals used for Experimental and other Scientific Purposes (European Treaty Service No. 123, 18 March 1986), the Order of the Ministry of Health of the Russian Federation No. 199n (1 April 2016) “On the approval of the Rules of Good Laboratory Practice”, and the recommendations of the Bioethics Committee of the St. Petersburg State Chemical and Pharmaceutical University of the Ministry of Health of the Russian Federation. 100 young adult (2 month old) male C57Bl/6 mice weighing 15–20 g were purchased from the Rappolovo laboratory animal supplier (Leningrad Oblast, Russia). All animals were received in a single shipment, quarantined for 2 weeks, then housed in a standard animal facility with ad libitum access to standard chow and drinking water.
Prior to experimentation, the animals were randomized into 4 groups: Intact (0.9% NaCl;
n = 10), Control (NAFLD + 0.9% NaCl;
n = 30), LOLA (NAFLD + 1.5 g·kg
−1 b.w./d LOLA (Hepa-Merz
®, Merz Pharma GmbH & Co. KgaA, Frankfurt, Germany);
n = 30), and EMPA (NAFLD + 10 mg·kg
−1 b.w./d EMPA (Jardiance
®, Boehringer Ingelheim International GmbH, Ingelheim am Rhein, Germany);
n = 30). To model NAFLD, Control, LOLA, and EMPA mice were fed a high-fat, high-calorie “western” diet (HCD), given 42 g/L D-fructose solution to drink, and injected i.p. with carbon tetrachloride CCl4 (0.32 mg·kg
−1 b.w., in almond oil) weekly for 3 months. The HCD was composed of 36.65% standard chow + 21.1% beef tallow + 41% D-fructose + 1.25% cholesterol [
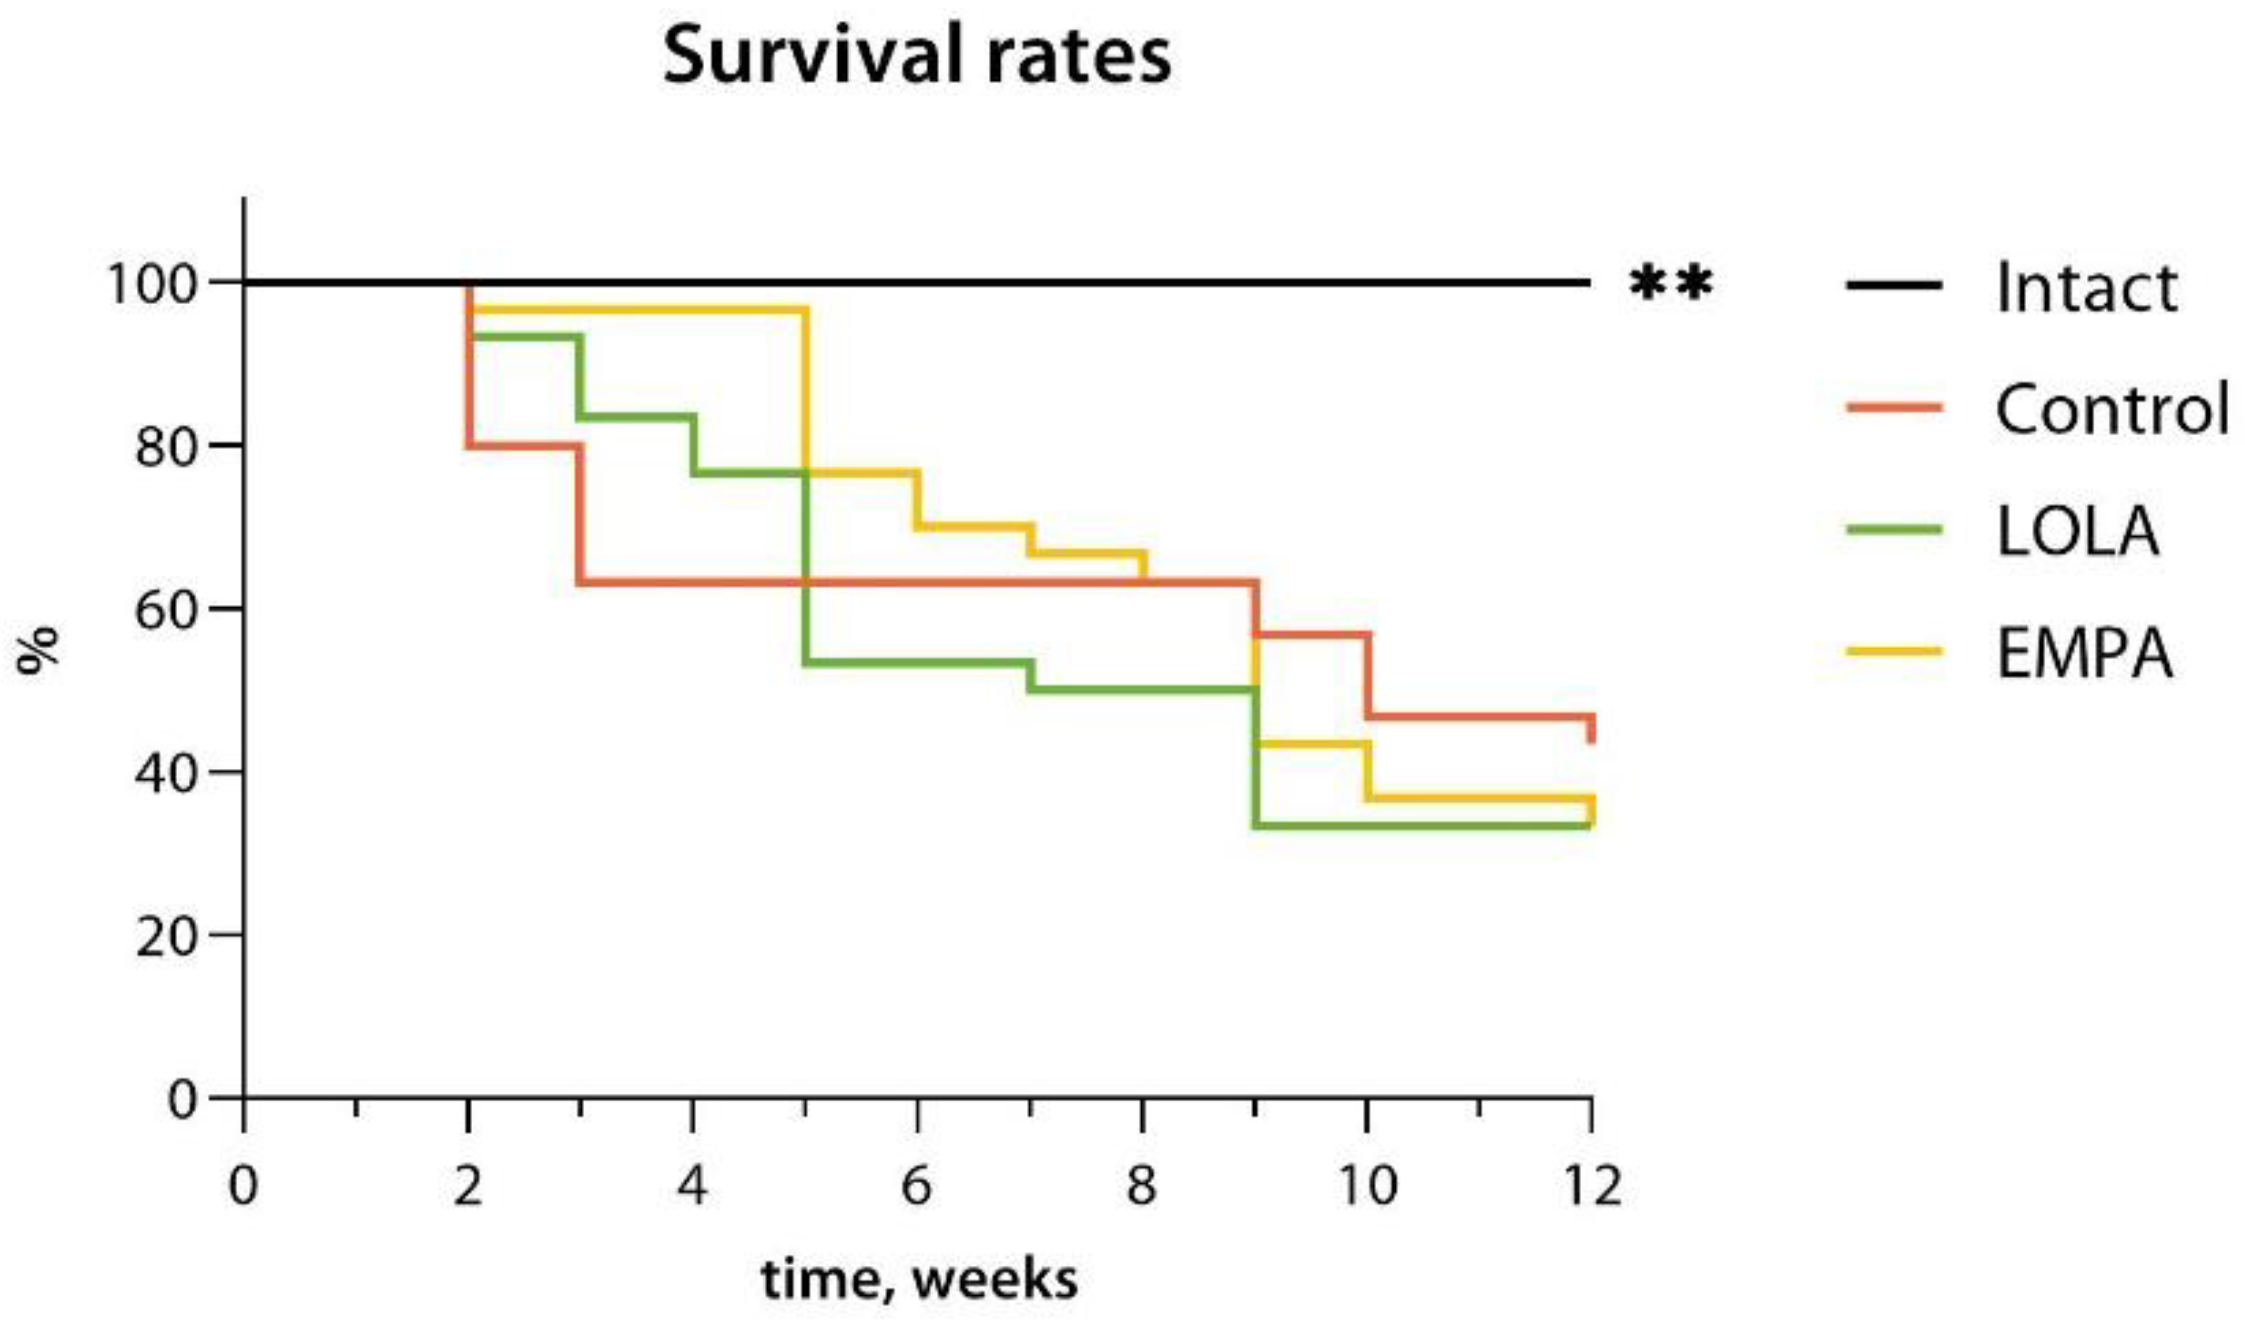
23]. Intact mice were offered standard chow (“Complete feedstuff for laboratory animals”, Laboratorkorm, Russia) and tap water, and injected i.p. with equivolume almond oil weekly. LOLA, EMPA, and 0.9% NaCl were administered via intragastric gavage once a day as freshly prepared aqueous solutions, starting from week 0 The animals were monitored for mortality daily, and survival rates were assessed using the Kaplan–Meier method [
24].
After 3 months of HCD, 10 mice from each group (chosen randomly if the number of surviving animals was greater than 10) were euthanized by carbon dioxide inhalation, and the liver was excised for gross morphological and histological examination. Liver tissue samples were fixed in 10% buffered formalin, dehydrated, cleared in isopropanol, and embedded in paraffin according to standard protocols. 4 µm sections prepared from paraffin blocks were mounted on slides, stained with hematoxylin-eosin or Van Gieson’s picrofuchsin, cover-slipped, and examined using light microscopy.
For each sample, hepatitis activity, steatosis, hepatocellular ballooning (HCB), cholestasis, necrosis, periportal fibrosis (PPF), central vein fibrosis (CVF), perisinusoidal fibrosis (PSF), and bridging fibrosis (BF) were scored as 0 (no), 1 (mild), 2 (moderate), or 3 (severe). Liver fibrosis was also staged according to the METAVIR-F scoring system as F0 (no fibrosis), F1 (portal fibrosis without septa), F2 (portal fibrosis with few septa), or F3 (numerous septa without cirrhosis) [
25].
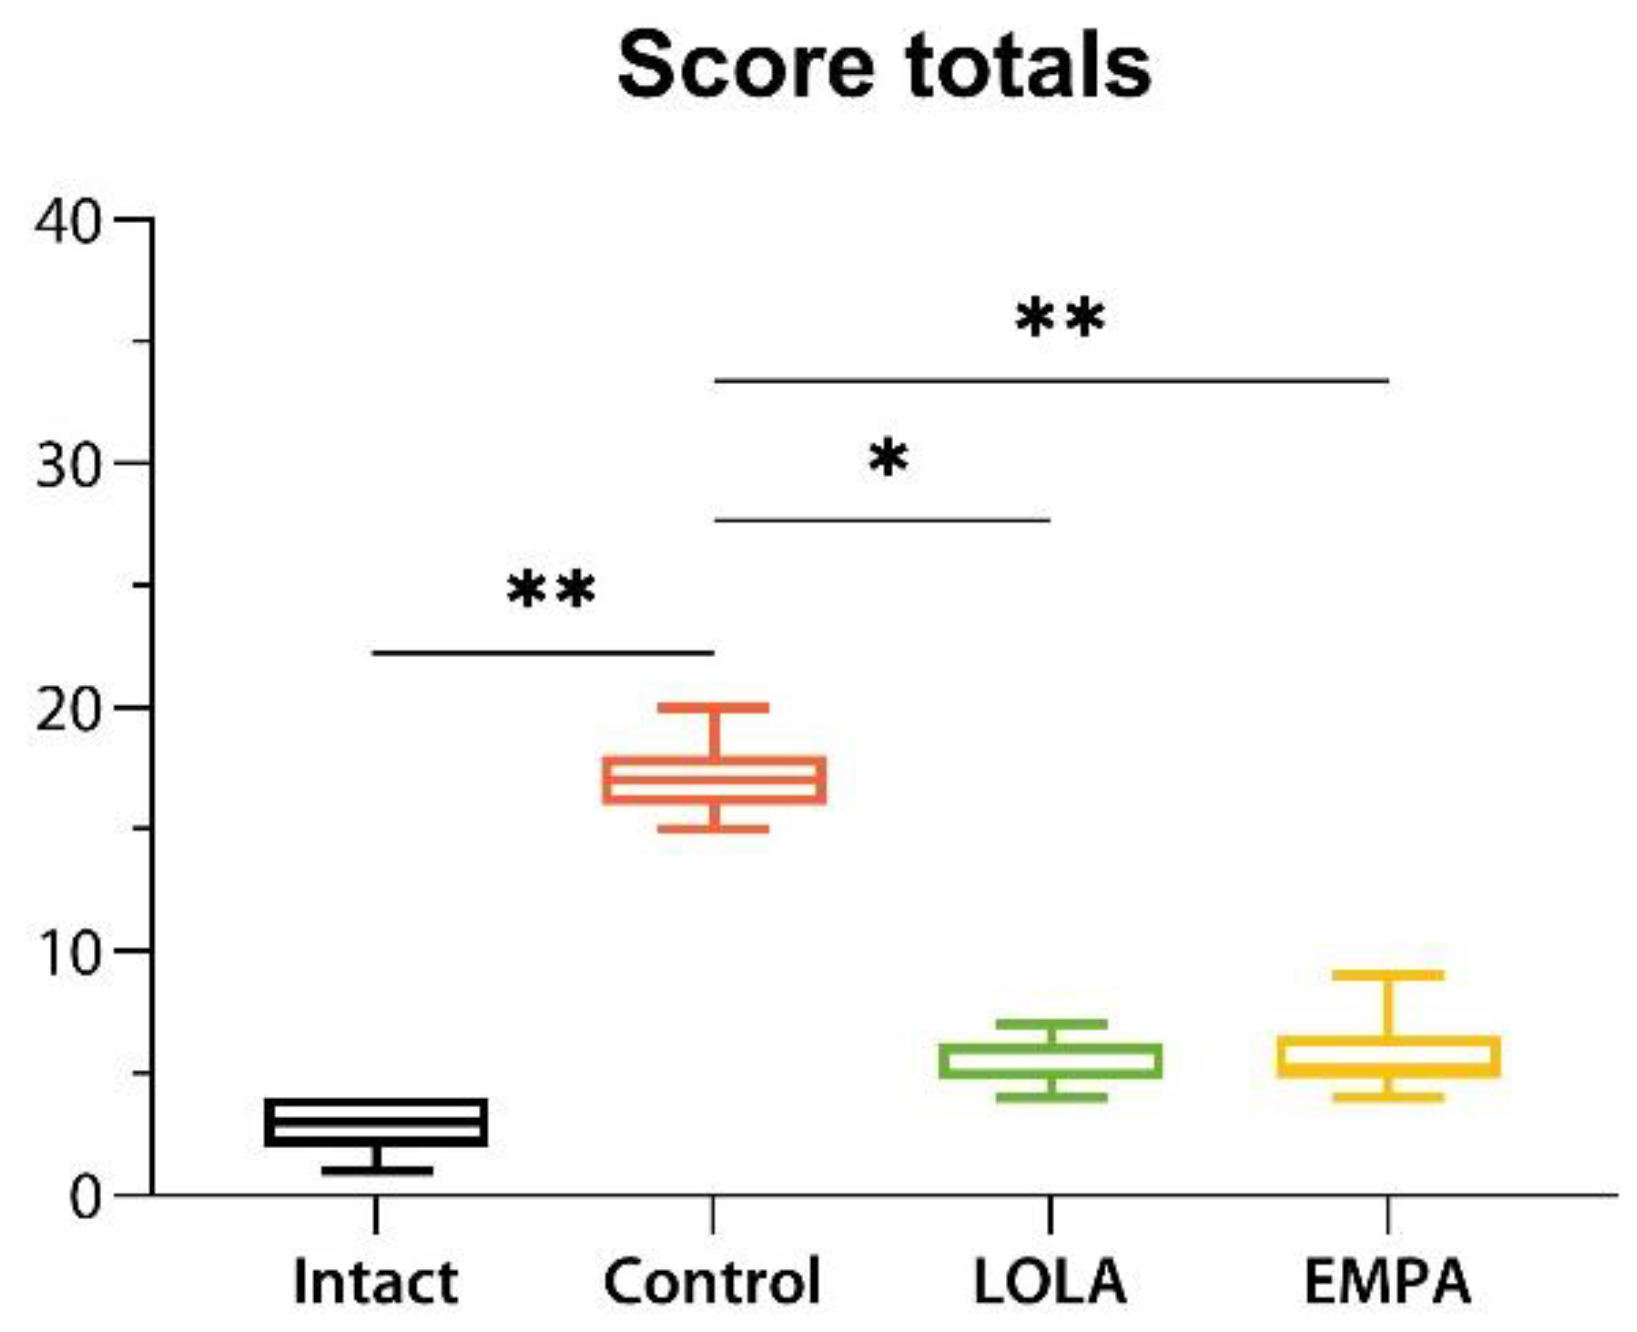
Statistical analysis was carried out in R 4.1.1 (R Foundation for Statistical Computing, Austria) with RStudio 1.4.1717 (RStudio PBC, Boston, MA, USA) and Prism 9.0.0 (GraphPad Software, San Diego, CA, USA). Survival curves were compared using the log-rank (Mantel-Cox) test; hazard ratios were calculated using the Mantel-Haenszel method. Score totals were tested for normality using the Shapiro–Wilk test, then tested for significant differences using the Kruskal–Wallis non-parametric test followed by Dunn’s post hoc test. Score totals are presented as median ± 95% confidence interval. Post hoc multiple comparisons of score frequency distributions were conducted using the RVAideMemoire 0.9-81-2 function package for R [
26]. The algorithm for semiquantitative analysis of scored data is detailed below in the Results section.
3. Results
By the end of the NASH induction period, the overall survival rates were 100.0%, 43.3%, 30.0%, and 30.0% for the Intact, Control, LOLA, and EMPA groups, respectively. NAFLD was associated with a severely reduced survival (hazard ratio 5.02 [95% confidence interval (CI) 1.68–15.00] vs. Intact;
p < 0.01; median survival time 10 weeks vs. >12 weeks in Intact). Neither LOLA nor EMPA improved animal survivability, resulting in 30.0% survival (
Figure 1). The hazard ratios were 1.23 [95% CI 0.61–2.46] and 1.13 [95% CI 0.57–2.24] vs. Control, and the MST amounted to 8 and 9 weeks in the LOLA and EMPA groups, respectively.
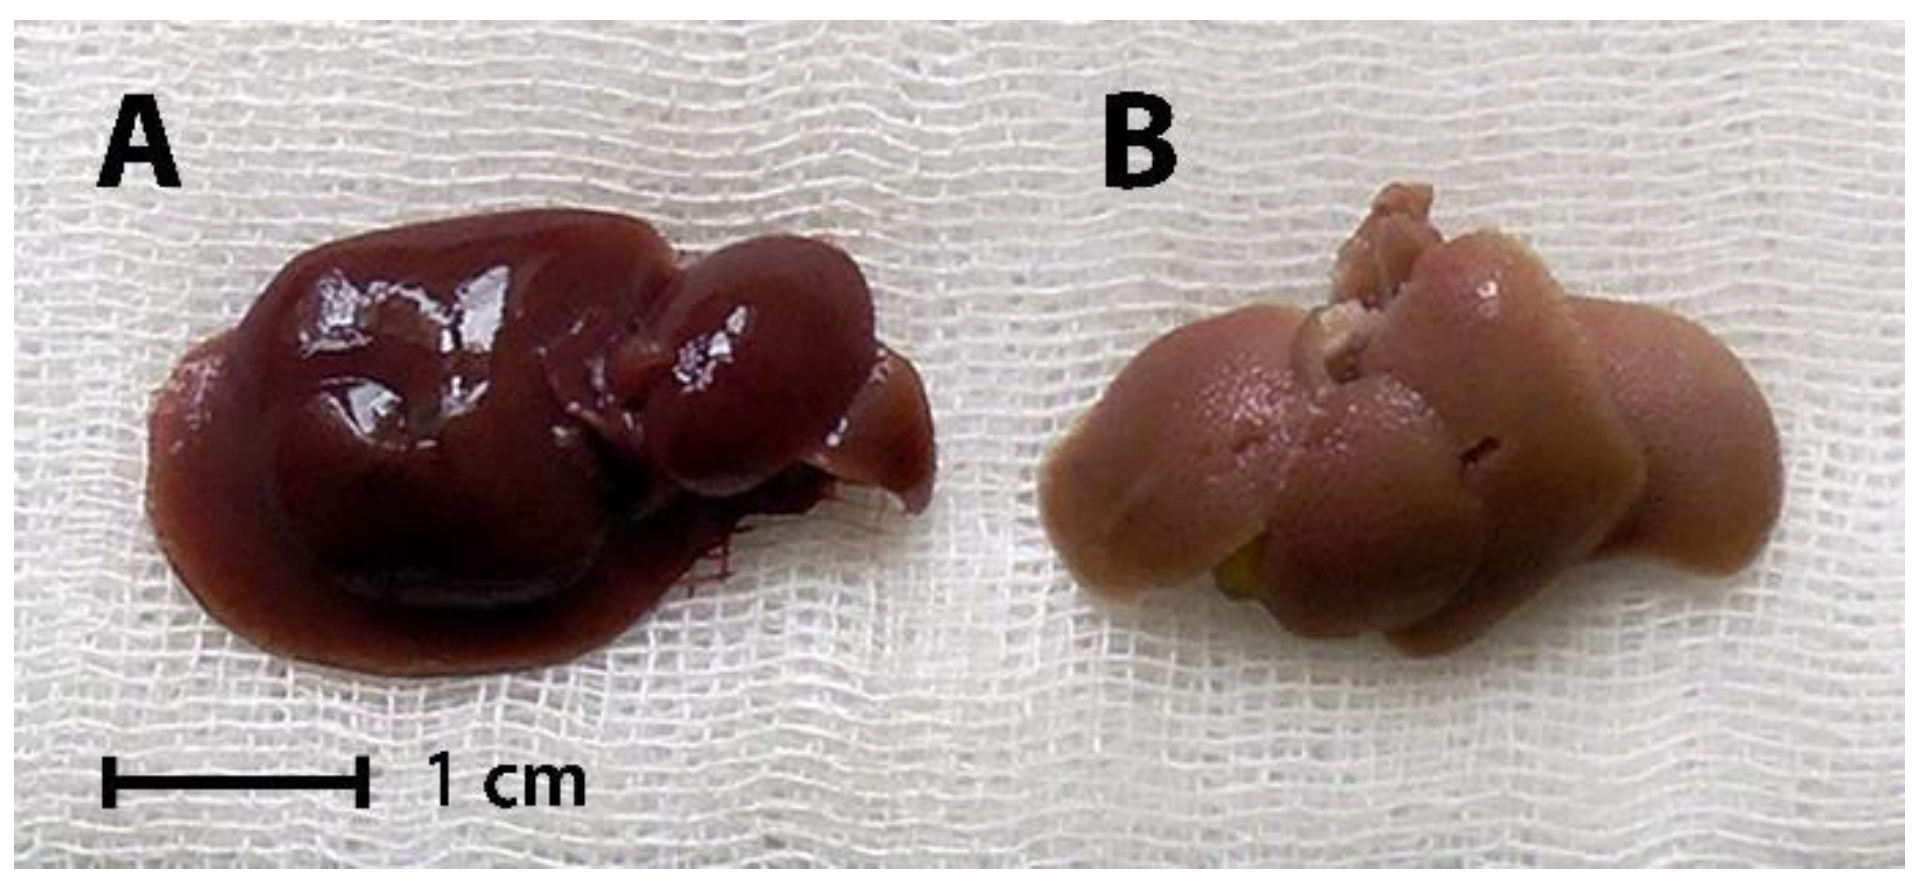
Gross morphology of representative liver samples from Intact and Control mice is shown in
Figure 2.
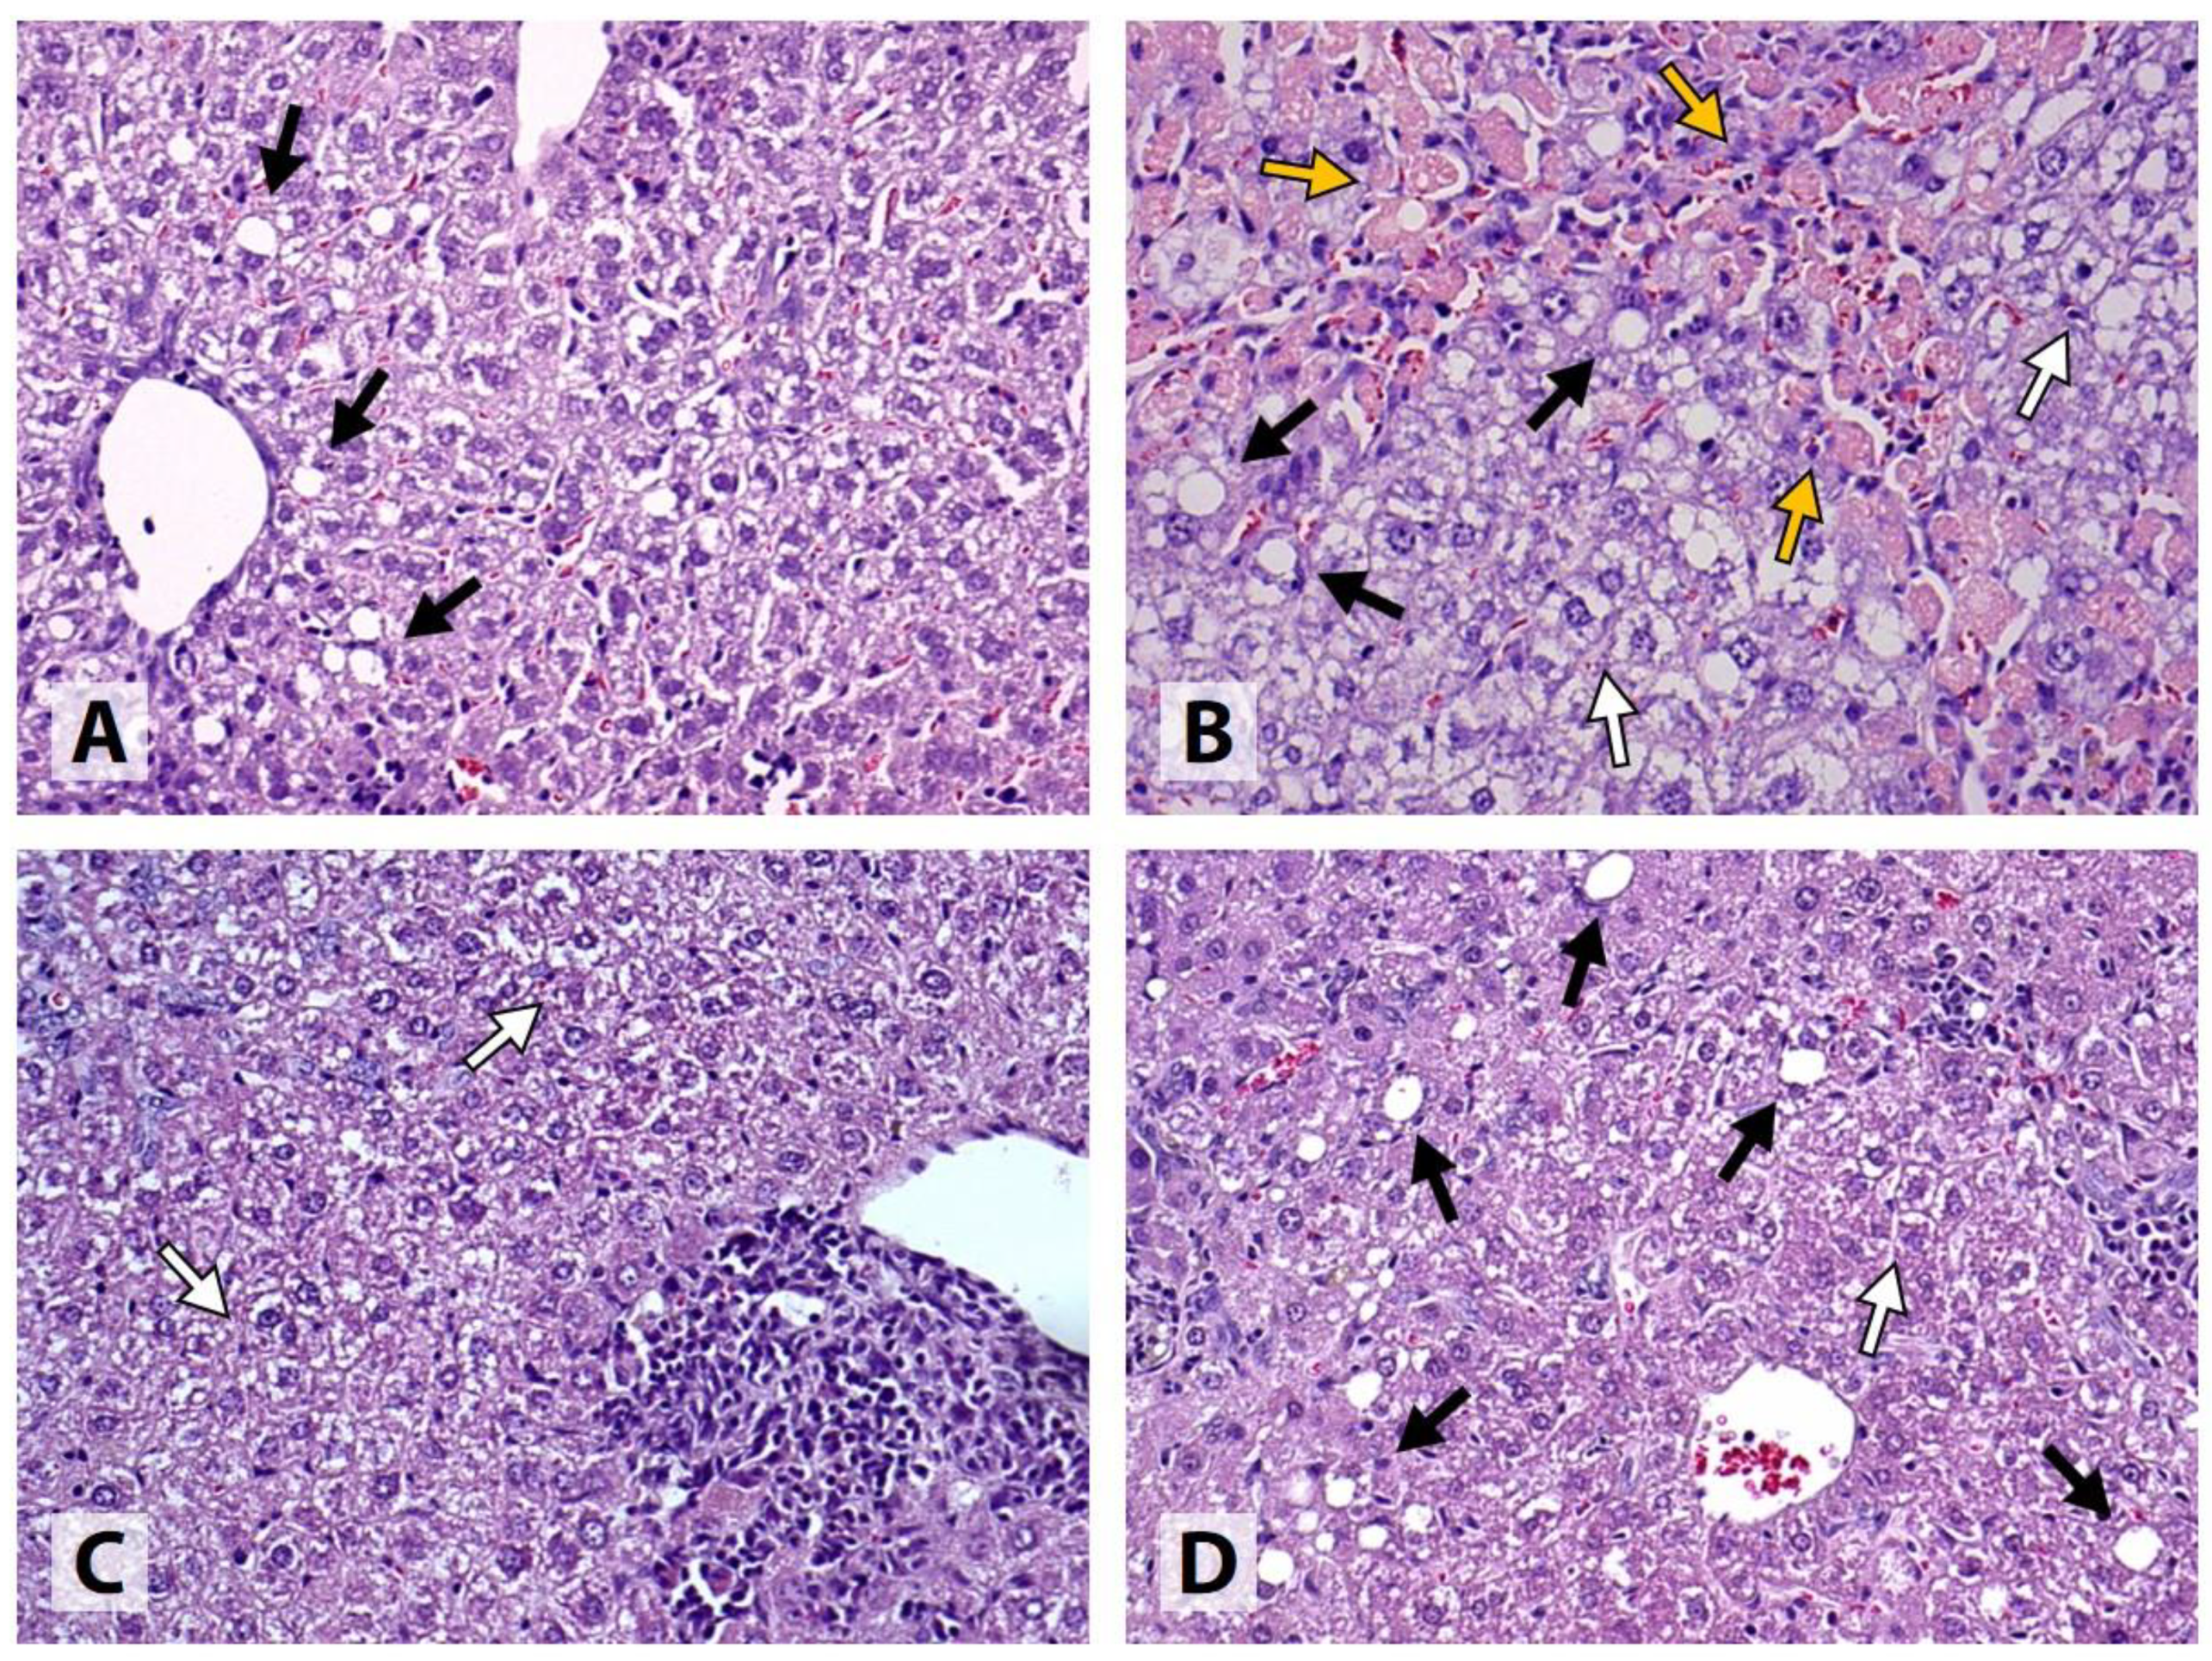
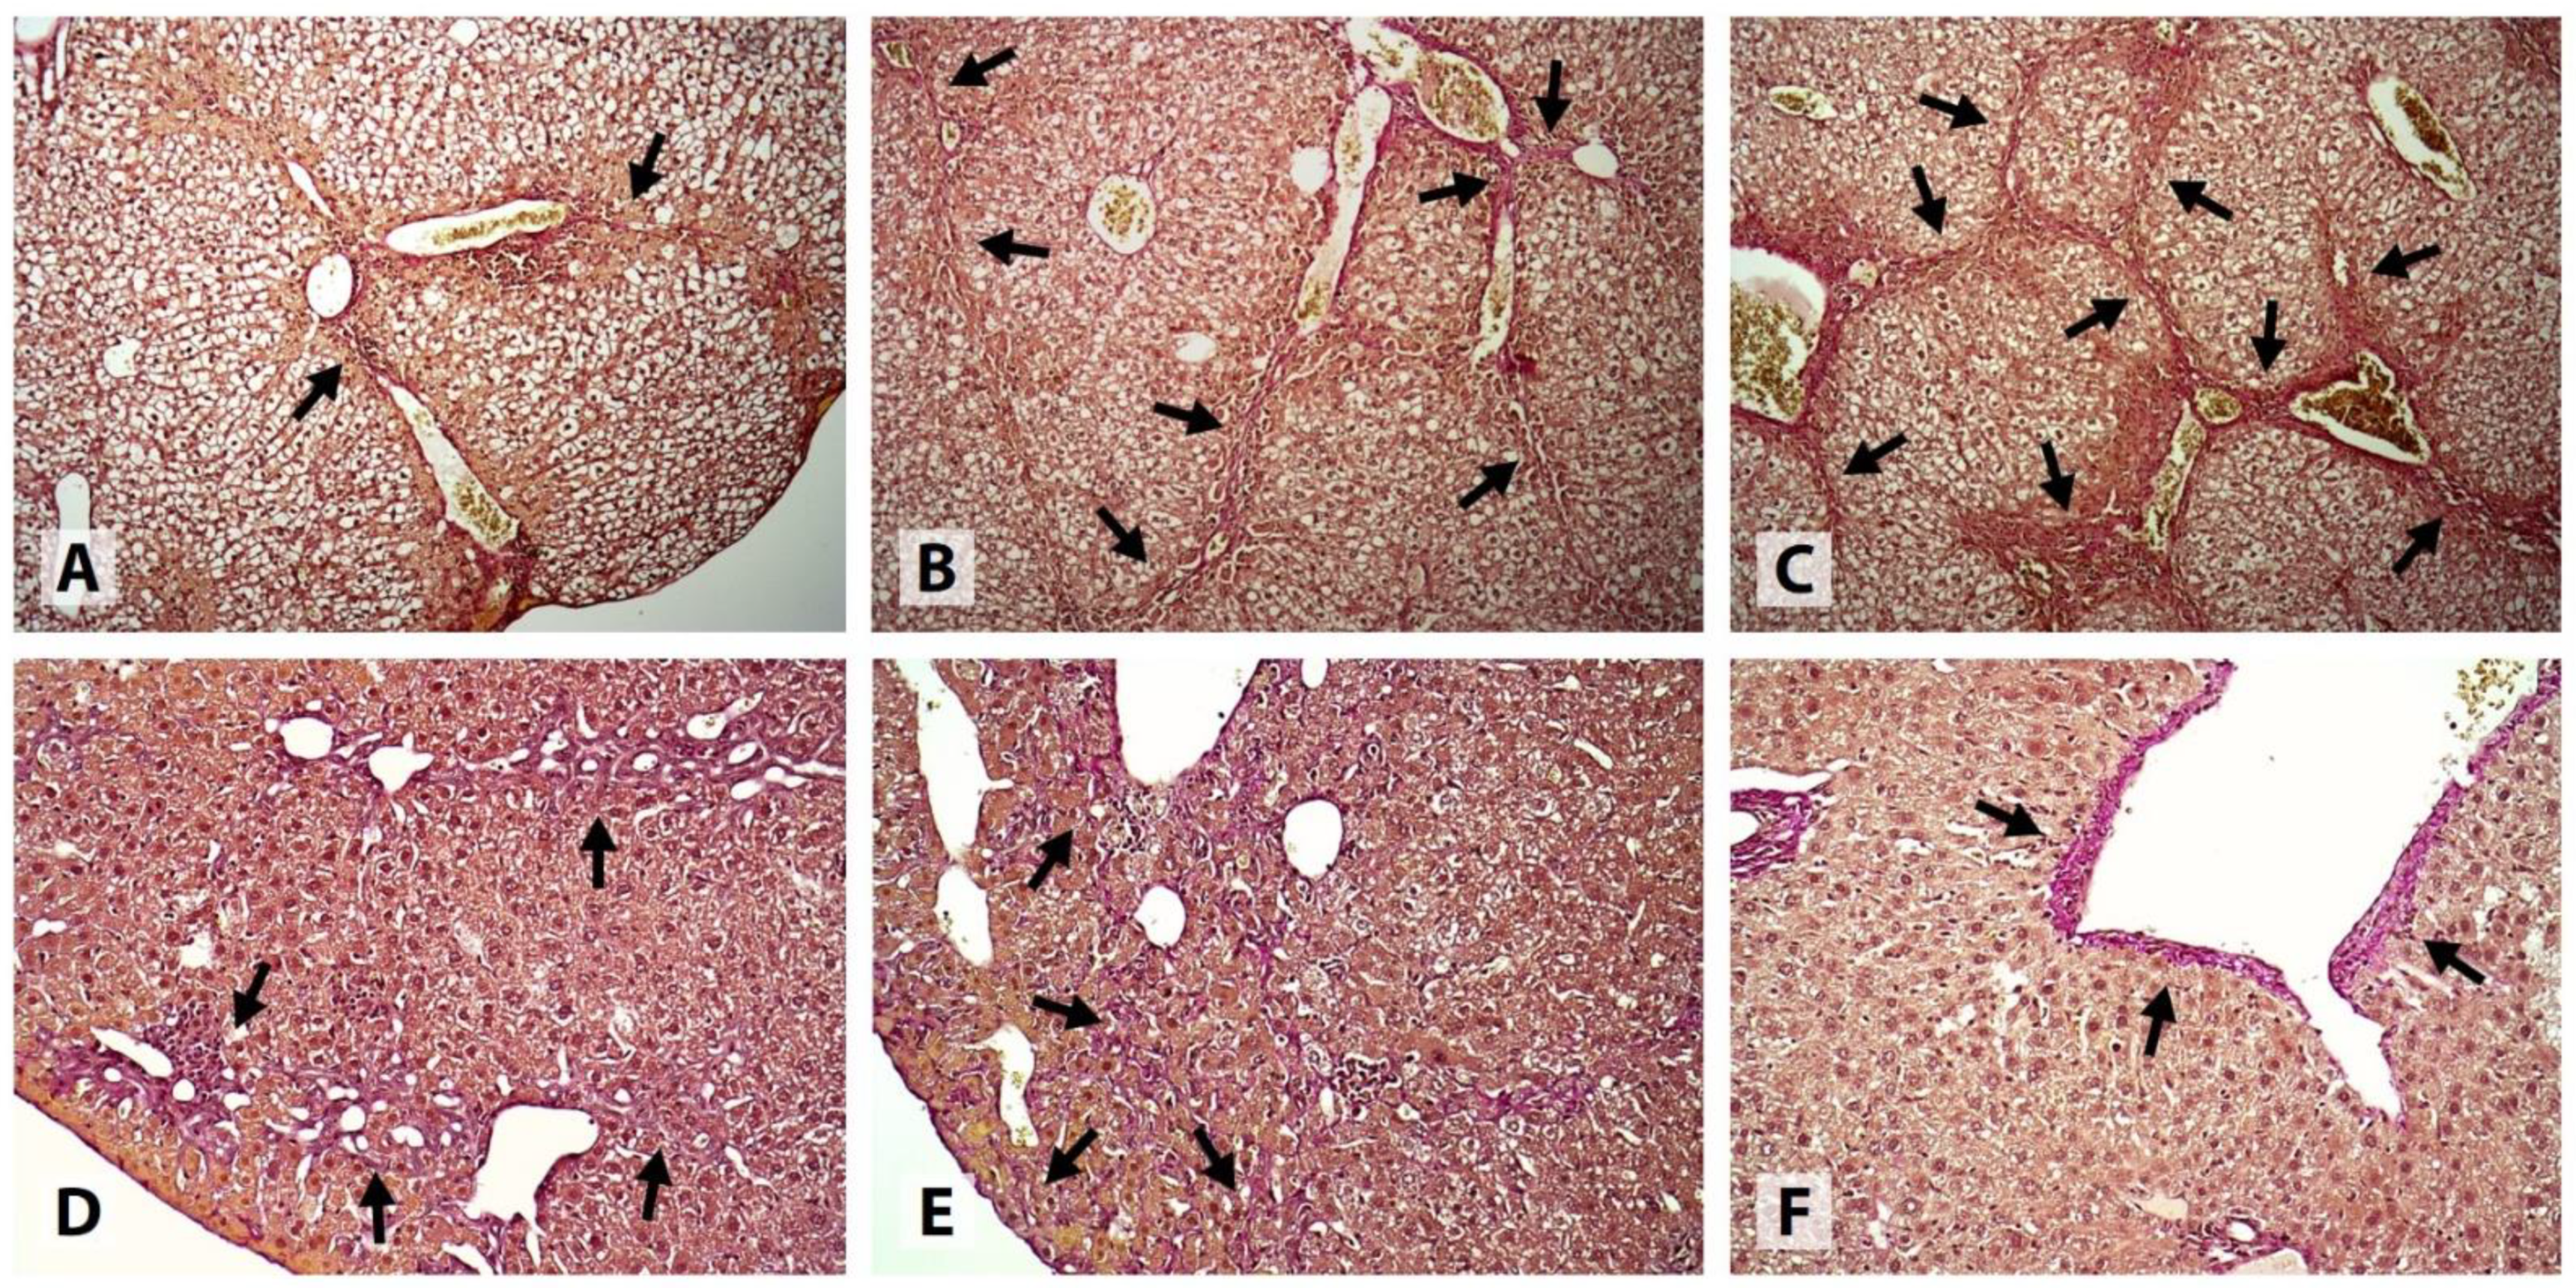
All Intact samples exhibited portal lymphohistiocytic infiltrate with a granulomatous pattern, indicating the presence of granulomatous hepatitis, which was mild or moderate in the majority (8/10) of the cases. In 1 sample, micro- and macrovesicular steatosis involving less than 1% of the hepatocytes was detected. Mild HCB was found in 3/10 samples, and mild intracellular cholestasis, in 2/10 samples. No signs of necrotic cell death or PPF were detected. All samples were classified as METAVIR F0; however, mild focal CVF was present in 2 of the samples, and another sample showed signs of mild intralobular PSF (
Figure 3).
In the Control group, substantial evidence of liver injury was found. All samples showed signs of moderate-to-severe cholestatic hepatitis, complicated by centrilobular and/or bridging necrosis in 9/10 cases. 4/10 samples exhibited mild medio- and macrovesicular steatosis involving up to 5% of the hepatocytes. HCB was classified as mild, moderate, and severe in 2, 3, and 5 samples, respectively. Intracellular cholestasis was either moderate (6/10) or severe (4/10) in degree. 1 sample was classified as METAVIR F1, 6 samples, as METAVIR F2, and 3 samples, as METAVIR F3. Extensive CVF and/or PSF was present in most cases, and all samples had at least a few visible septa. No signs of PPF or cirrhosis were detected (
Figure 3 and
Figure 4).
All samples obtained from the mice that received LOLA showed signs of mild (7/10) or moderate (3/10) cholestatic granulomatous hepatitis. Only 2 of the samples exhibited medio- and macrovesicular steatosis, which was classified as mild. Mild and moderate HCB was detected in 5 and 4 cases, respectively. All samples exhibited mild intracellular cholestasis and mild focal PSF, and 9/10 samples also showed mild CVF; however, all samples were classified as METAVIR F0. No signs of necrotic cell death, PPF, or fibrotic septa were present in any of the cases (
Figure 3 and
Figure 4).
Similar to LOLA, all mice receiving EMPA developed mild (6/10) or moderate (4/10) cholestatic granulomatous hepatitis. Medio- and macrovesicular steatosis was present in 1 case, while no signs of steatosis were found in the remaining samples. HCB was classified as either mild (7/10) or completely absent (2/10) in the majority of the cases. 7/10 samples had mild, and the remaining 3/10, moderate intracellular cholestasis. All samples were classified as METAVIR F0; however, evidence of mild (9/10) or moderate (1/10) focal CVF, and mild (7/10) or moderate (1/10) focal PSF was found. No samples exhibited necrotic lesions, PPF, or fibrotic septa (
Figure 3 and
Figure 4).
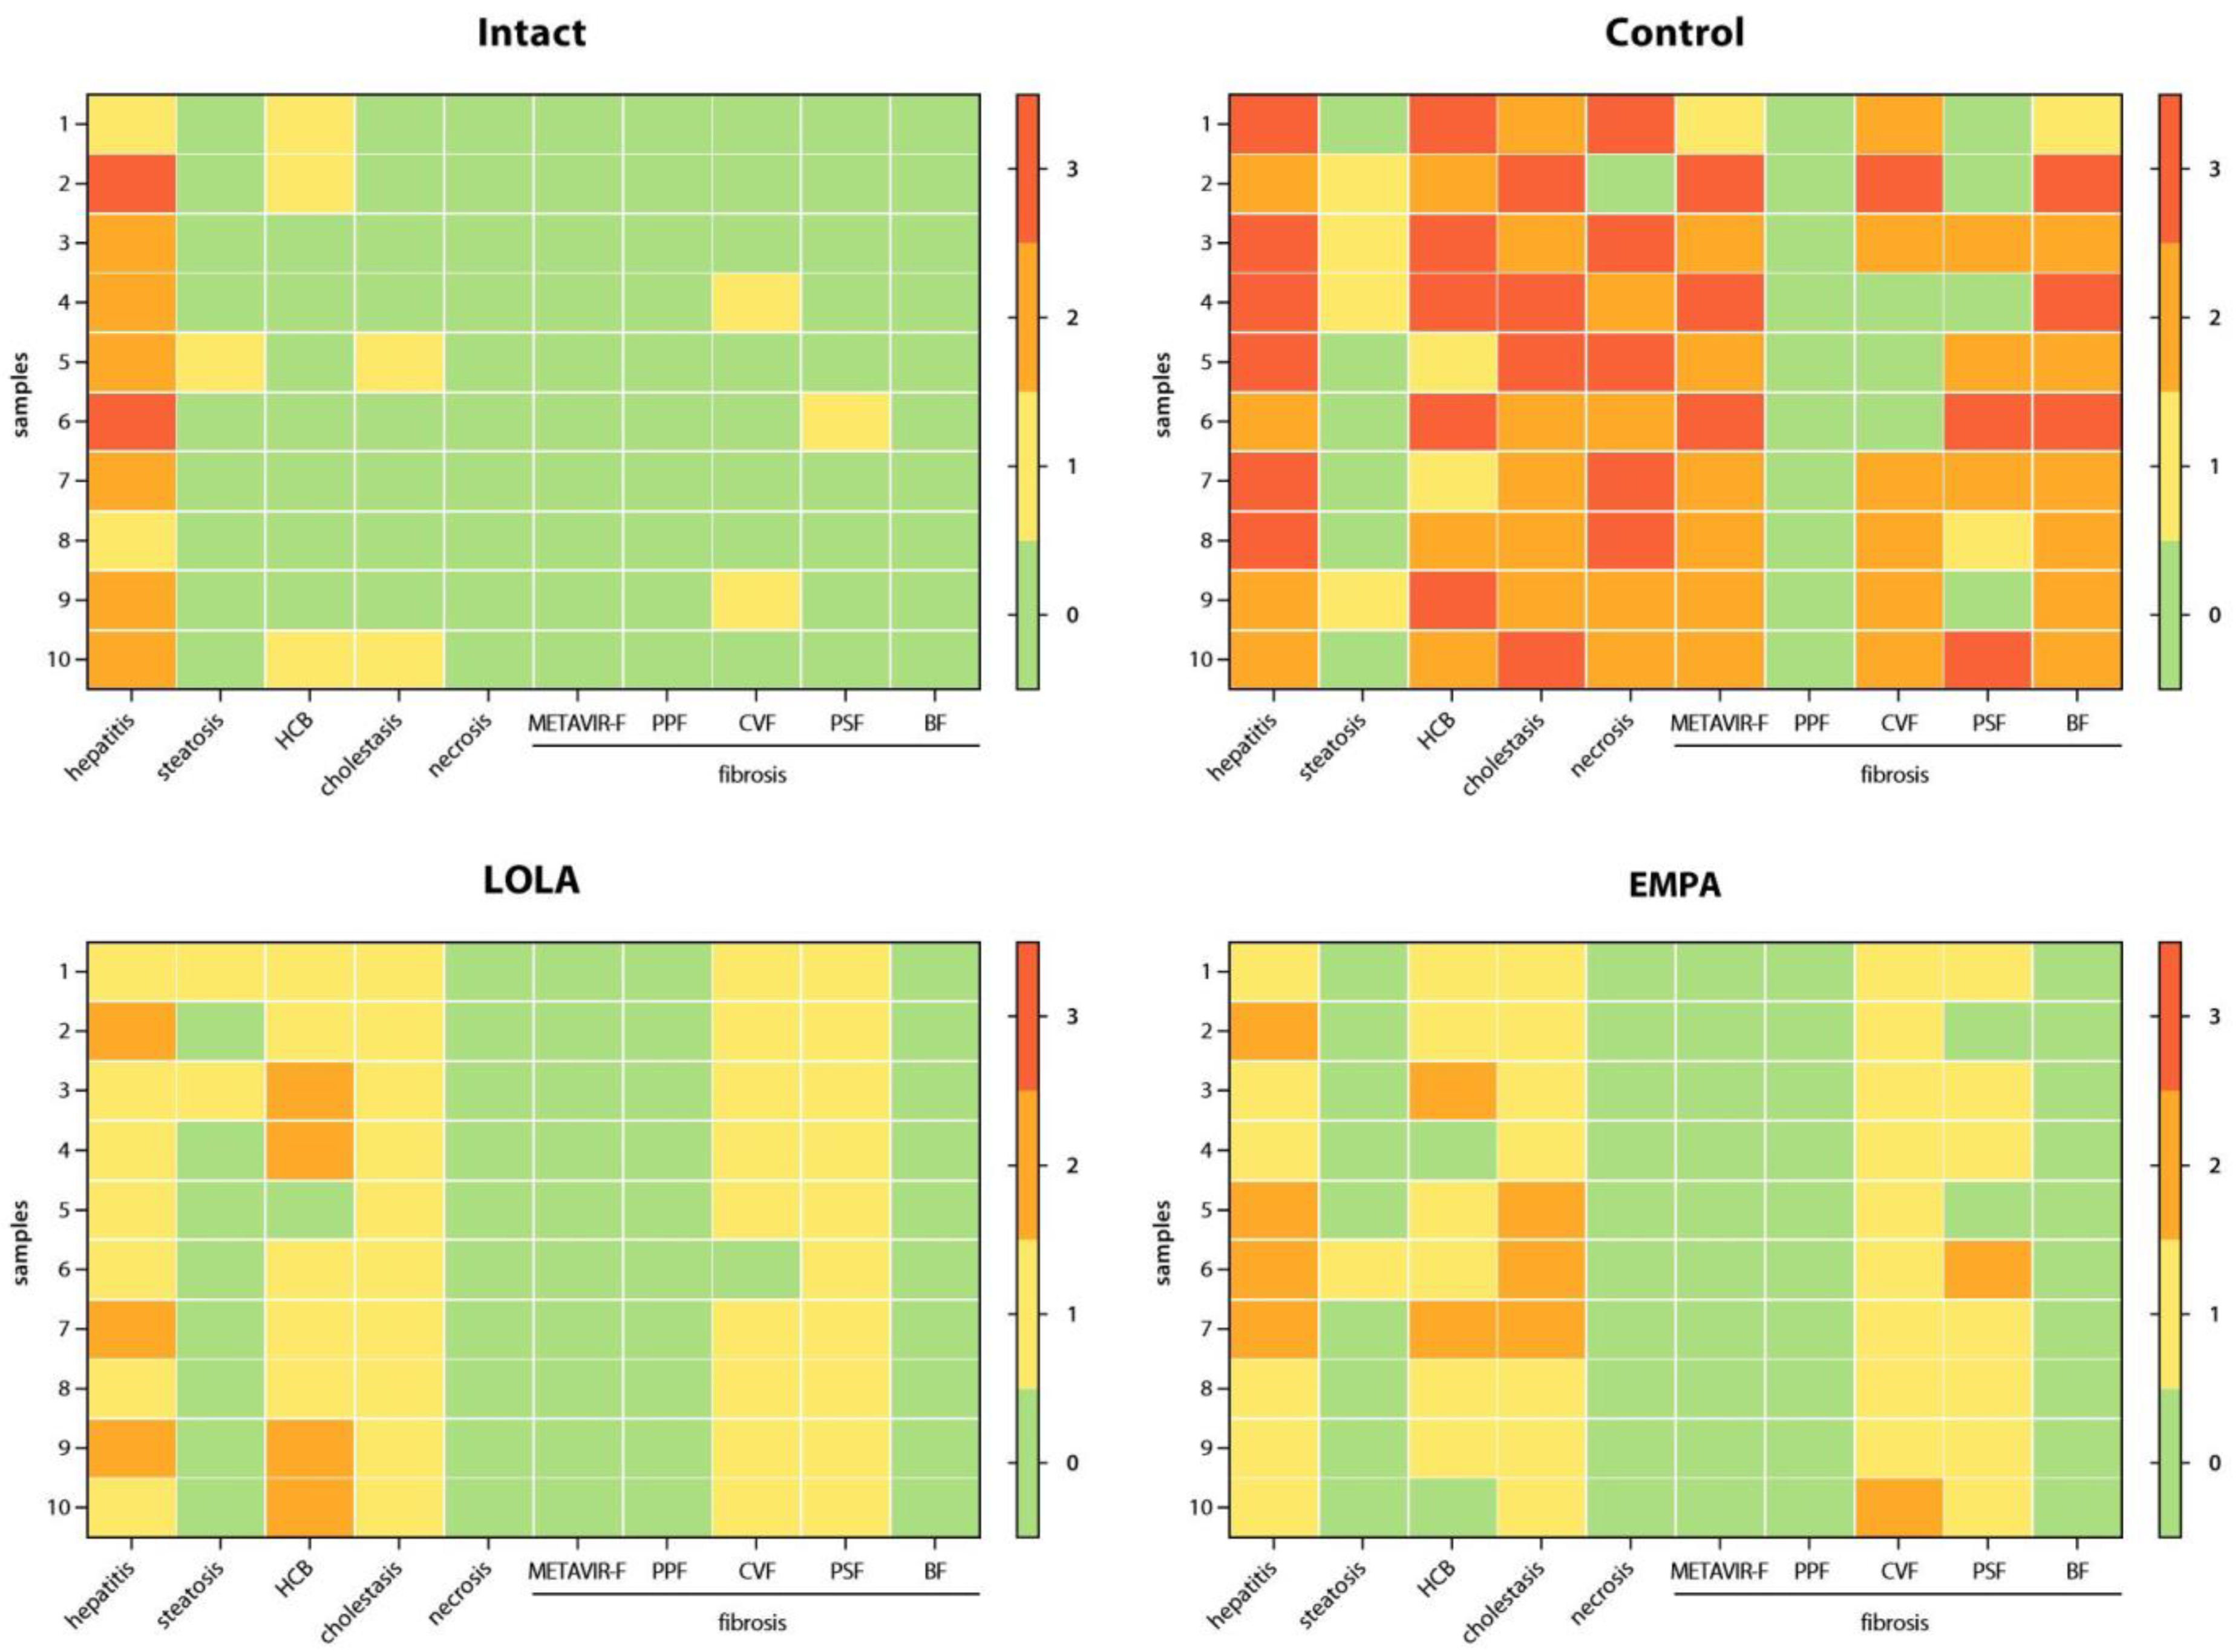
Individual scores obtained for all parameters for each liver tissue sample are illustrated by the heatmaps in
Figure 5, and score totals are shown in
Figure 6.
The algorithm for semiquantitative statistical analysis was the same for all scored data obtained in the experiment, and will therefore be demonstrated for a single model parameter, cholestasis. We have chosen cholestasis scores to serve as an illustrative example because they were found to have significantly different distributions among the experimental groups.
Table 1 shows the primary cholestasis scores given for each liver tissue sample analyzed.
Primary scores were then converted into a contingency table (
Table 2) according to the observed frequency distributions within the experimental groups. Expected frequency values were also calculated (
Table 2).
The observed frequency values were introduced into the R environment as a matrix and then converted into a table class object and given the name HB using the following command:
>cholestasis <- as.table(matrix(c(8,0,0,0,2,0,10,7,0,6,0,3,0,4,0,0), ncol = 4, dimnames = list(c(“Intact”, “Control”, “LOLA”, “EMPA”), c(“0”, “1”, “2”, “3”))))
Since >20% (100%) of the expected frequency values were less than 5 (
Table 2), two-sided eFET was conducted using the following command:
>fisher.test(cholestasis)
returning:
Fisher’s Exact Test for Count Data
data: cholestasis
p-value = 4.094 × 10⁻¹¹
alternative hypothesis: two.sided
Because the overall p-value indicated statistical significance,
post hoc multiple pairwise FET were conducted using the fisher.multcomp function available from the RVAideMemoire 0.9-81-2 package [
26]. The raw p-values were adjusted using the Holm-Bonferroni correction [
27] in order to maximize family-wise error rate control, which has been suggested for confirmatory studies [
28].
>install.packages(‘RVAideMemoire’)
library(RVAideMemoire)
>fisher.multcomp(cholestasis, p.method = “holm”)
returning:
Pairwise comparisons using Fisher’s exact test for count data
data: cholestasis
0:1 0:2 0:3 1:2 1:3 2:3
Intact:Control 1.00000 0.01166 0.06465 0.964286 1.00000 1
Intact:LOLA 0.02429 1.00000 1.00000 1.000000 1.00000 1
Intact:EMPA 0.07014 0.17576 1.00000 1.000000 1.00000 1
Control:LOLA 1.00000 1.00000 1.00000 0.004496 0.03297 1
Control:EMPA 1.00000 1.00000 1.00000 0.318182 0.09091 1
LOLA:EMPA 1.00000 1.00000 1.00000 1.000000 1.00000 1
p value adjustment method: holm
As indicated by the adjusted p-values, some of the cholestasis scores were distributed differently (
p < 0.05; highlighted in red) among the Intact, Control, and LOLA groups, while the EMPA group was not significantly different from any other. The algorithm detailed above was applied to all scored data obtained in the experiment. The adjusted p-values for the hepatitis, steatosis, HB, necrosis, METAVIR-F, CVF, PSF, and BF score frequency distributions are given in
Appendix A. Since no signs of PPF were observed in any of the samples analyzed, PPF scores were not taken into further quantitative analysis.
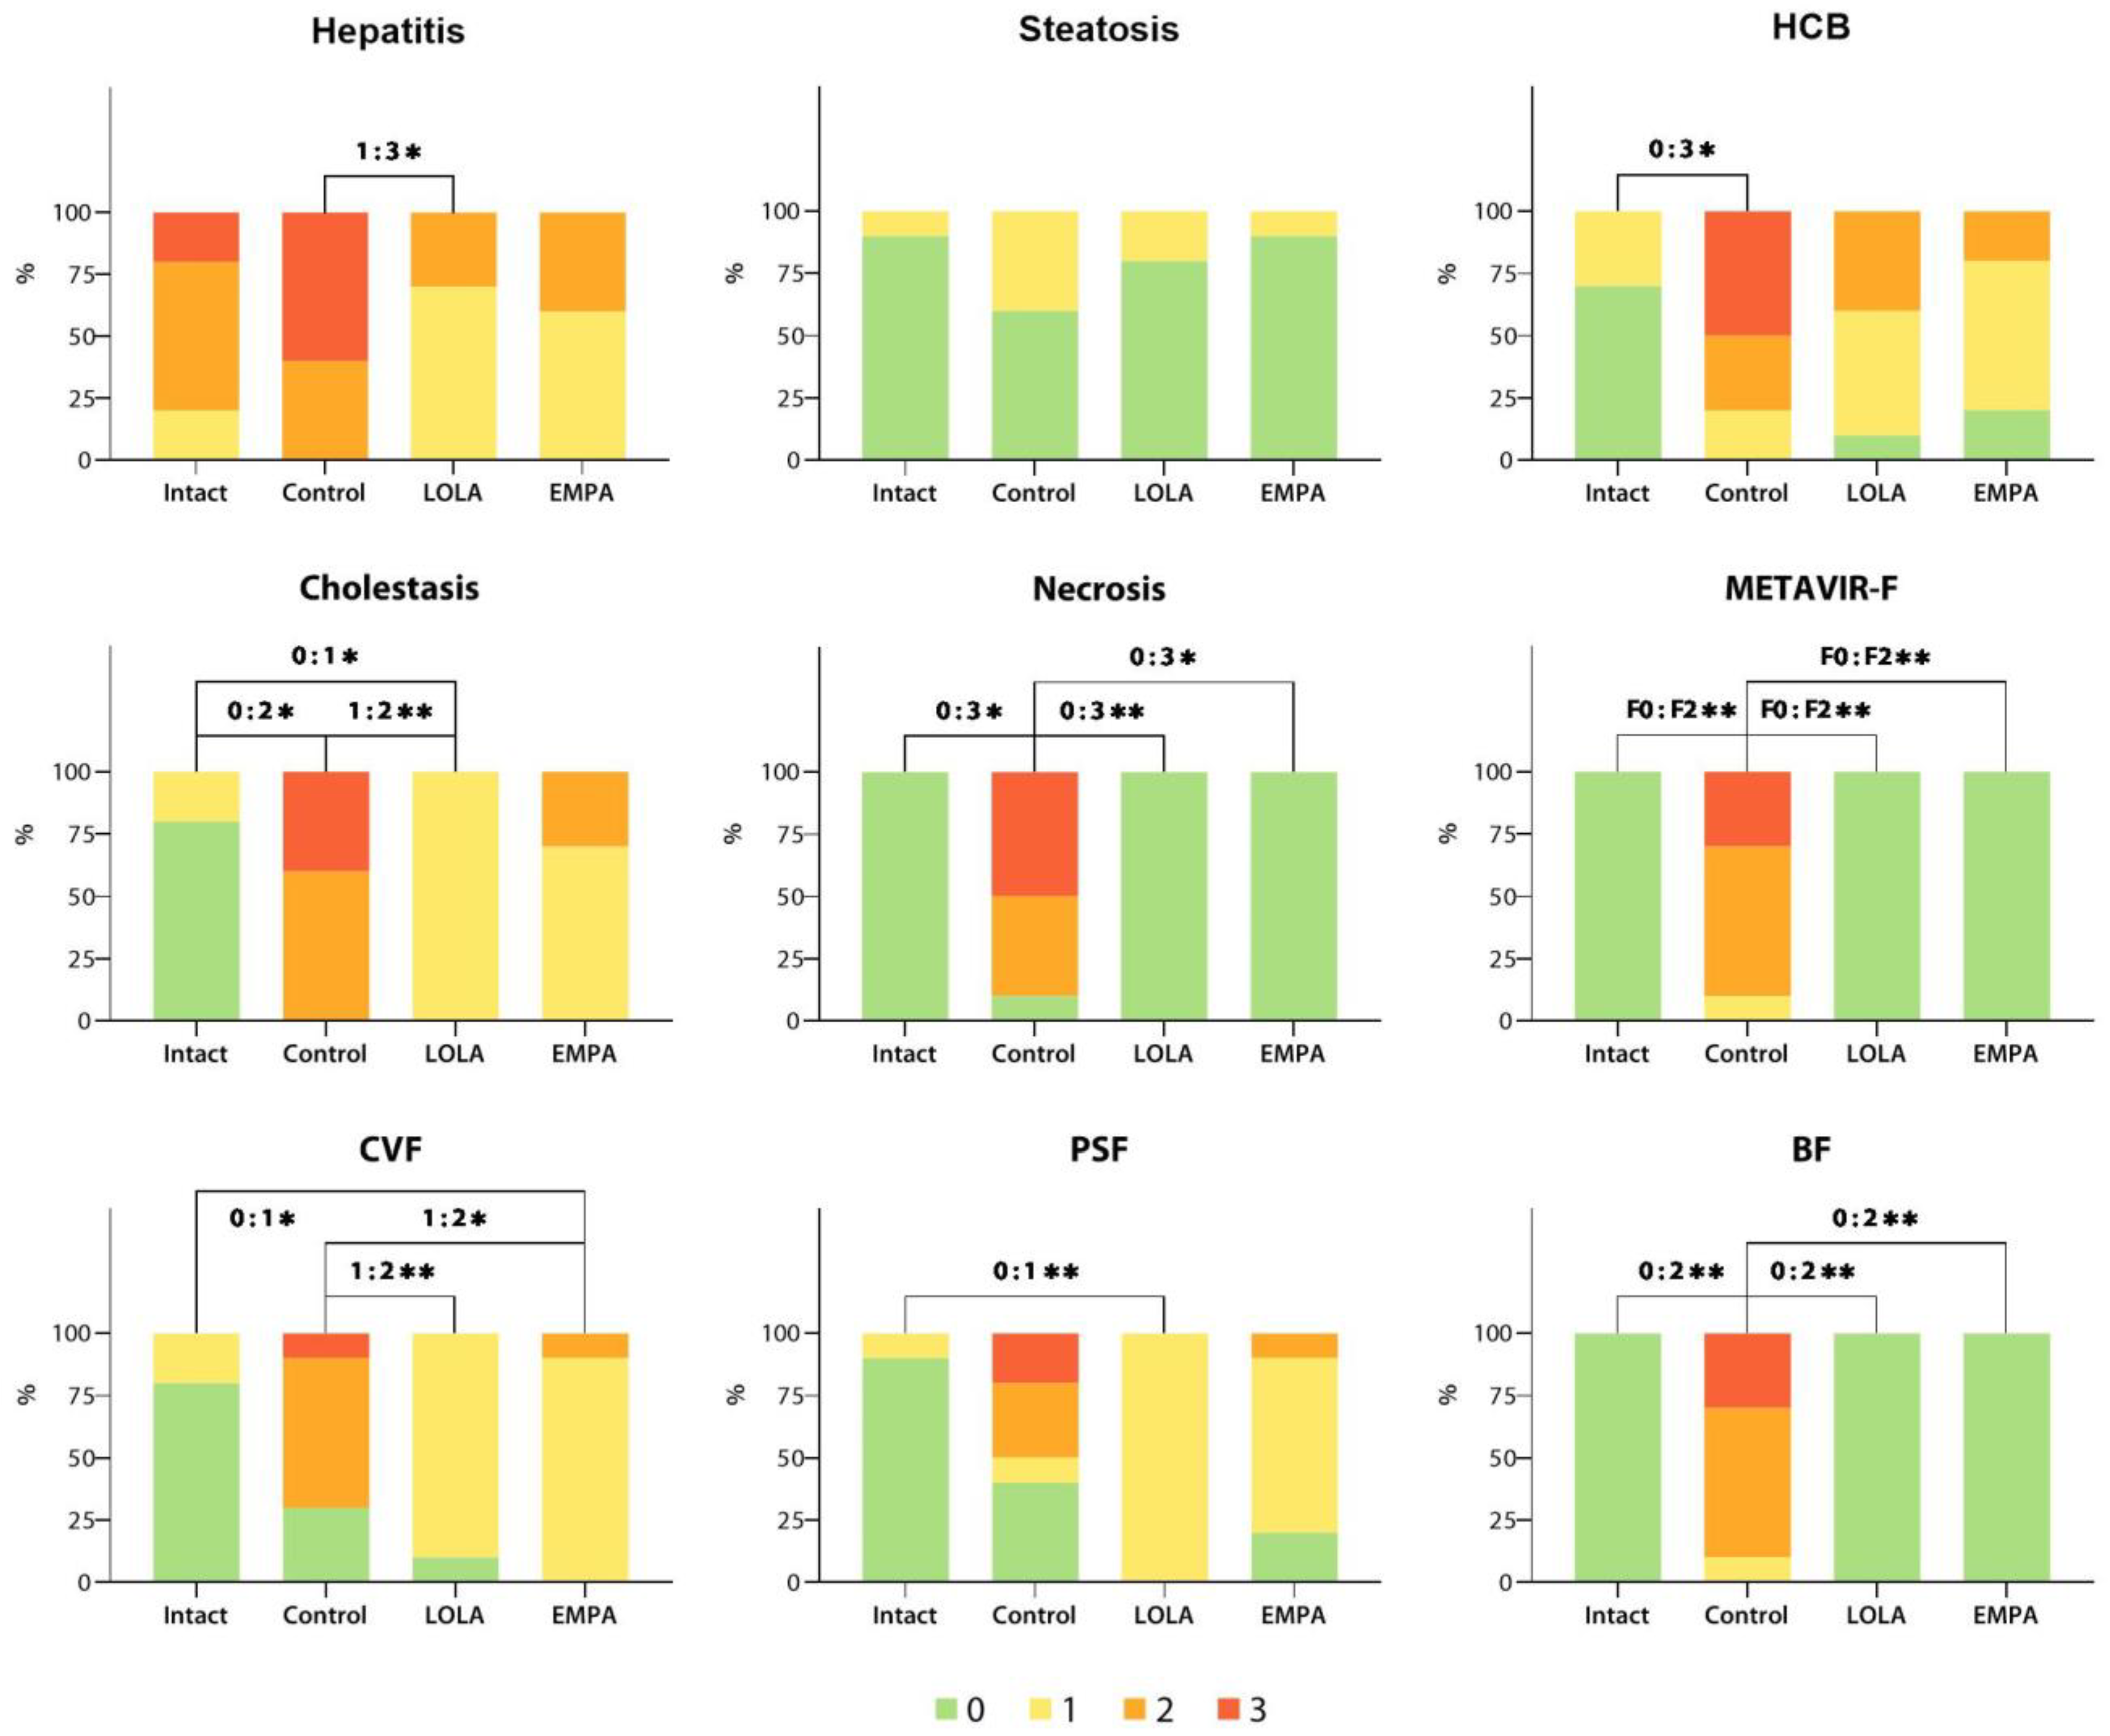
Observed score frequency distributions for all parameters analyzed are shown in
Figure 7.
4. Discussion
In the present study, we used a high-fat, high-sucrose diet combined with intraperitoneal administration of low-dose CCl4 to induce cholestatic steatohepatitis and liver fibrosis in C57Bl6 mice. The liver injury in Control mice was characterized by extensive inflammatory infiltrate, cholestasis, HCB, centrilobular and bridging necrosis, CVF, PSF, and the presence of fibrotic septa, with the majority (9/10) of the specimens having moderate-to-advanced (METAVIR F2/F3) liver fibrosis. Experimentally induced liver pathology was also associated with a nearly 5-fold increase in lethality compared with Intact animals.
Histological analysis revealed that oral LOLA administration at a daily dose of 1.5 mg mg·kg−1 b.w./d during the entire NAFLD induction period effectively prevented liver damage. As opposed to control once, mice that had been receiving LOLA exhibited no signs of cell necrosis or BF, and had greatly reduced severity of HCB, intrahepatic cholestasis, CVF, and PSF, resulting in METAVIR scores of F0. EMPA was less effective in ameliorating HCB, cholestasis, CVF and PSF, but, similarly to LOLA, completely prevented hepatocyte necrosis and the formation of fibrotic septa. These results might indicate the potential effectiveness of LOLA and EMPA for the treatment of NAFLD in its more advanced stages, i.e., liver fibrosis.
Scored, or graded histology data are commonly reported as contingency tables in order to perform quantitative analysis and test for statistical significance. Traditionally, contingency data analysis is carried out using either Pearson’s chi-squared test [
29], or Fisher’s exact test (FET) [
30]. The latter is often suitable for studies involving the use of laboratory animals, or pilot clinical studies, as they tend to have smaller sample sizes, yielding low expected observation frequencies.
Since many common HSS have 4–5 score levels in order to maximize sensitivity and reproducibility [
5], and the number of experimental groups often exceeds 2, the Freeman-Halton extension of FET can be used to analyze contingency tables larger than 2 × 2 [
31]. However, when the extended FET (eFET) returns a p-value indicating significant heterogeneity of the dataset, post hoc pairwise comparisons may be required in order to identify the groups that have significant differences.
The algorithm we describe is a relatively simple, straightforward, and efficient for semiquantitative statistical analysis of scored histology data. As opposed to computer-assisted image analysis, it does not require the use of specialized tissue imaging systems or software, and has no cost limitations. It is powerful and sensitive enough to detect significant differences among small size groups, i.e., consisting of ≥10 subjects. Finally, it provides an advantageous possibility to detect the differences between selected score pair distributions, allowing for quantitative analysis of the prevalence of different disease stages between experimental groups.
It must be said that the algorithm we propose has some notable limitations. First, since it can only compare the scores in sets of two, the individual sample sizes must be large enough for both of the scores taken into comparison, regardless of the overall group size. Second, it cannot be applied to score pairs in which neither of the scores was observed in at least one of the groups, since that would yield a nonsensical 0:0 distribution. Therefore, this method’s sensitivity and power might be insufficient for experiments with smaller group sample sizes as well as for those employing more complex scoring systems. Finally, since the described method is essentially an upscale of the original FET for 2 × 2 contingency tables, it is not completely suited to evaluate variance among multiple groups and score distributions. Therefore, we suggest that this algorithm be used as a complementary tool of exploratory statistical analysis, and not as a definitive measure of significance of experimental results.
