1. Introduction
Following the Great East Japan Earthquake in 2011, there has been an increased risk assessment and the practical application of its findings to safety enhancement. In particular, dynamic probabilistic risk assessment (PRA), in combination with plant dynamic analysis, is being considered for application in accident management (AM) development and operational support, in addition to conventional safety assessments. In AM development, prioritizing countermeasures presents challenges due to the variety of accident scenarios, uncertainty regarding the sequence of events, and time-dependent branching probabilities. Technological advances have expanded the automation range in plant operations, allowing for potential multi-unit operation where a single operator may be responsible for monitoring and controlling more units. However, relying solely on automated systems during events is not feasible; interventions, including manual operations informed by risk data, remain necessary. Simultaneous multi-unit disasters are expected to increase scenario complexity and make determining response priorities more demanding compared to single-unit operations.
This paper introduces a countermeasure priority decision function that utilizes dynamic PRA as a support function for nuclear power plant operations. Initially, a simple plant dynamic characteristic analysis model for a single unit is developed, and a preliminary evaluation of operator intervention priorities during events is presented.
This article is a revised and expanded version of a paper entitled Yamamoto et al. [
1].
2. Countermeasure Priority Determination Function Using Dynamic PRA
2.1. Continuous Markov Chain Monte Carlo Method
The continuous Markov chain Monte Carlo (CMMC) method, a dynamic PRA approach, has been studied [
2,
3]. In this methodology, scenario transitions are modeled as a Markov process, indicating that the plant’s current state (a combination of individual component states) is dependent only on its immediate past state, rather than any earlier states. Physical processes within plants are typically represented by Markov processes; plant dynamics analysis codes are employed to assess plant state. Events such as damage at a facility are influenced by local variables like temperature and pressure. That is, the occurrence probabilities of event are also updated based on the latest plant status. Thus, while static PRA has limitations in addressing fluctuations in plant conditions, the CMMC method allows these changes to be evaluated through plant simulation.
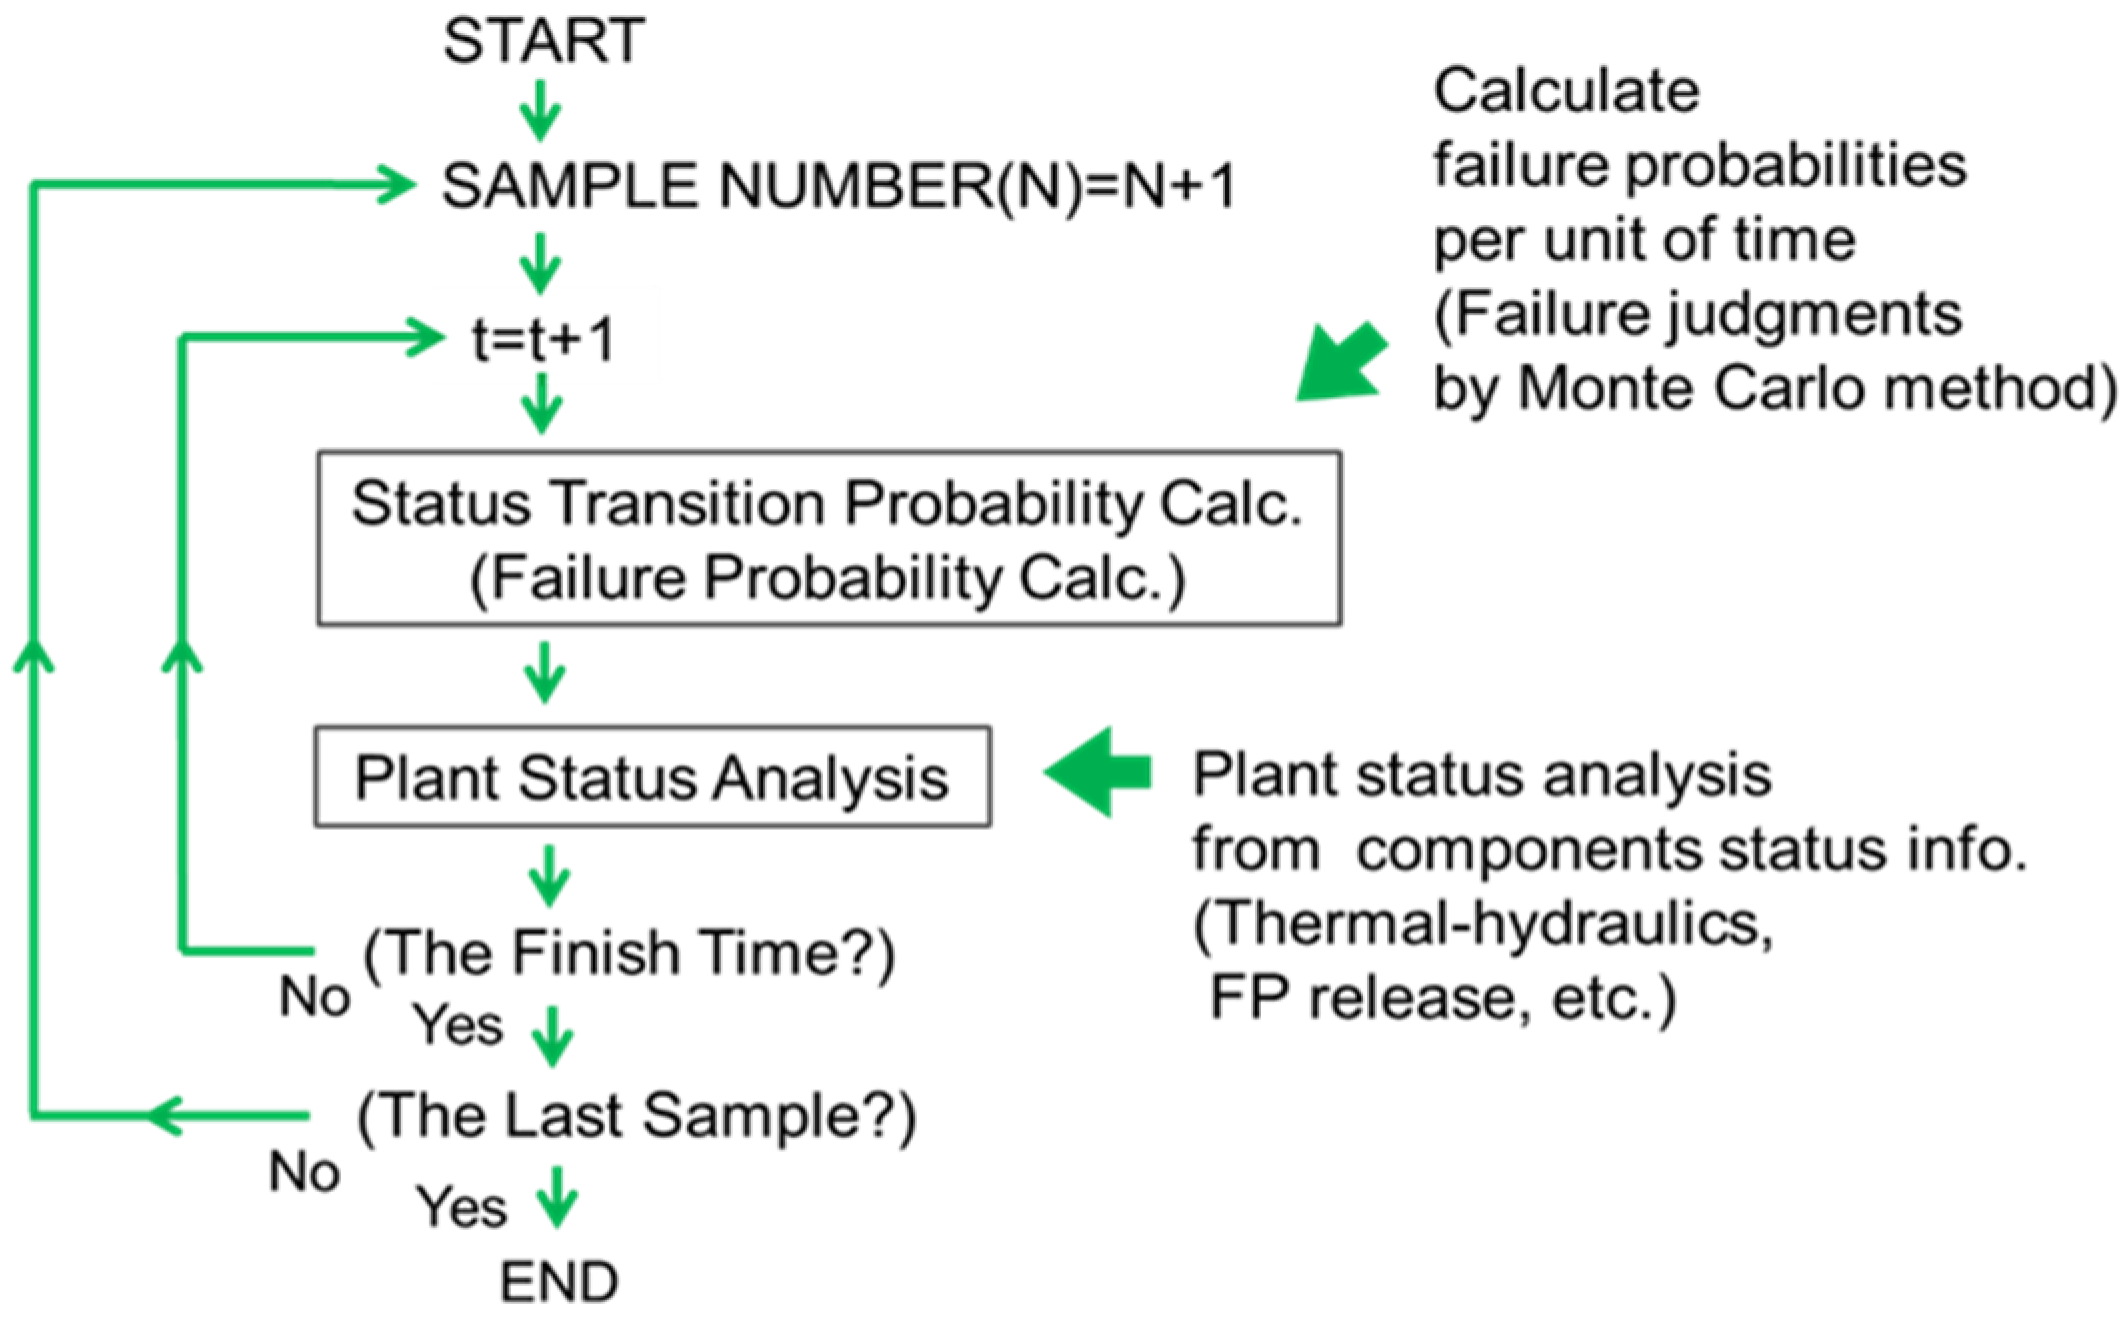
Figure 1 shows the basic concept of the CMMC method, where the procedure is repeated up to a specified analysis end time to generate a unique scenario.
Figure 2 shows the flow of scenario generation in the CMMC method. Upon completion of one scenario analysis, the same process is repeated to produce multiple accident scenarios until the pre-established target number is reached. The Monte Carlo technique is used to determine state transitions within each scenario, ensuring their uniqueness. This approach enables the quantification of a comprehensive set of accident scenarios by analyzing a large sample size, thereby providing statistical probabilities and uncertainty information such as the proportion of scenarios that result in core damage relative to all analyzed scenarios.
2.2. Countermeasure Priority Determination
The priority of countermeasures during a nuclear power plant event varies depending on the plant’s status and the progression of the incident. Plant conditions involve uncertainties and are not predetermined. These conditions can also be influenced by the countermeasures to be carried out and their timing, so evaluation within scenarios that account for different conditions is necessary. To address these problems, this paper proposes a countermeasure priority decision function using the CMMC method, which generates and evaluates scenarios efficiently and exhaustively as situations change. The CMMC method is used to create multiple scenarios involving plant events and responses, and to prioritize countermeasures in order of decreasing risk based on scenario-specific risk data. This approach supports assessment of countermeasure effectiveness and aids decision-making across various conditions when developing AM. In addition, when an event happens during plant operation, the countermeasures priority is presented to operators, helping simplify decision-making in complex scenarios.
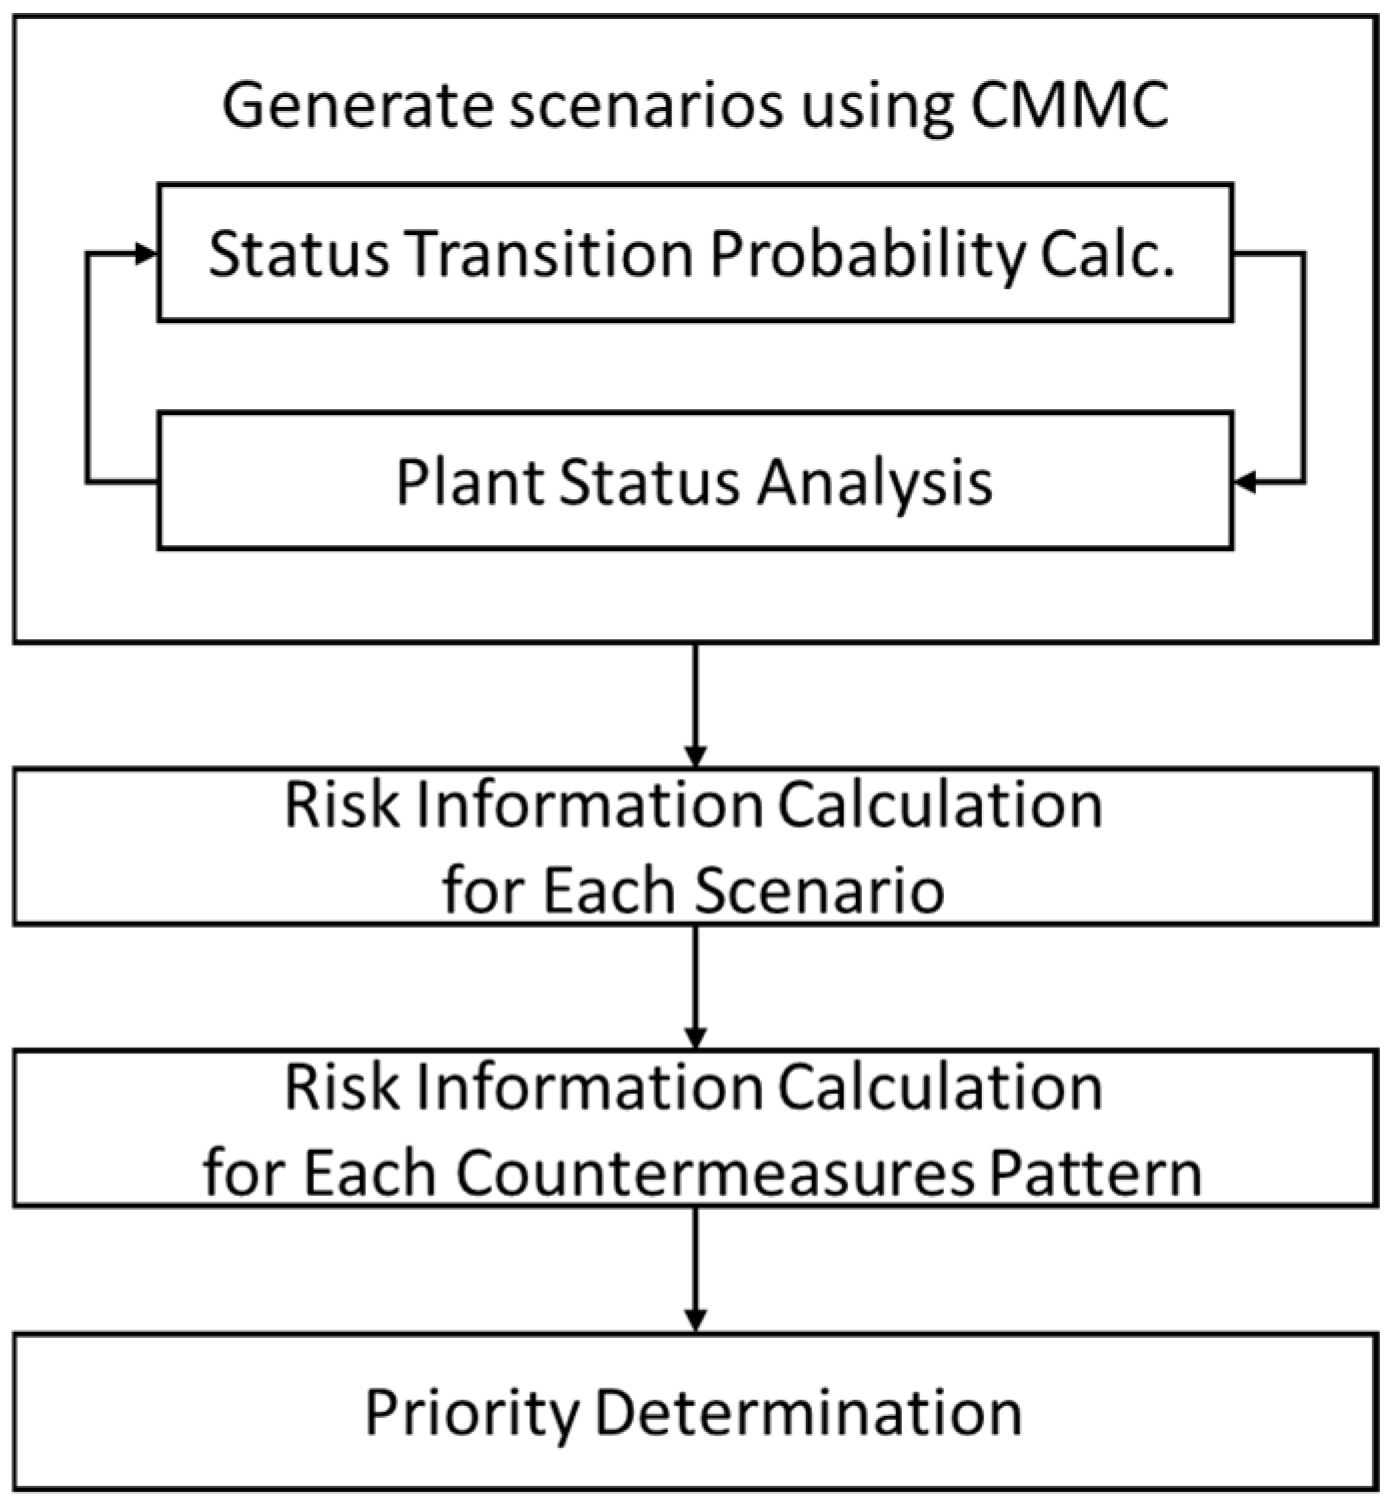
Figure 3 shows the process for determining countermeasure priorities with the CMMC method [
5]. Multiple scenarios are generated in which events and response operations occurred using state transition probabilities corresponding to the plant’s condition. For each scenario, risk information such as the core damage presence and final reactor pressure vessel (RPV) level is calculated. Scenarios are then grouped according to whether countermeasures are implemented and the timing of these operations, and risk information is consolidated by pattern. Based on the risk information for each pattern, the effectiveness of each countermeasure pattern is evaluated for priority.
3. Evaluation of Countermeasure Prioritization for SGTR Scenarios
The effectiveness of the proposed method will be evaluated in stages. As the first stage, we conducted a preliminary evaluation to determine whether a large set of scenarios, including uncertainty, could be classified into some countermeasure patterns and prioritized. A simple dynamic analysis model of a single-unit plant was constructed, and the scale of the initial event and the timing of countermeasures were determined while accounting for uncertainty. In this evaluation, event occurrences were assumed to follow a time-independent uniform distribution. Further details are provided in the following sections.
3.1. Evaluation Scenario
For the purpose of assessing the countermeasure priority determination function, specific events and countermeasures to be evaluated were selected. One scenario where the operator’s countermeasure priorities might shift based on the event’s progression is the failed steam generator isolation scenario during a steam generator tube rupture (SGTR) [
6]. In this scenario, primary coolant leaks out of the containment vessel because of an isolation failure of the steam generator on the failure side during the SGTR event, potentially resulting in core damage.
In response, operators perform core cooling through cooldown and recirculation operations. There are two primary response operations: heat removal via the steam generator using a main steam relief valve and auxiliary water supply system (cooling from the secondary system), and decompression of the primary system via a pressure relief valve. These response operations manage leakage by stabilizing pressure between the primary cooling system and the failed steam generator, followed by long-term cooling with the residual heat removal system. In actual plant operating procedures, the conditions under which these response operations may be initiated are described, but the precise timing and duration of their implementation are not specified. Therefore, the priority between depressurization by heat removal using the steam generator (DSG) and depressurization by opening the pressure relief valve (DP) is expected to be determined by the operator based on the reactor’s cooling condition. Two possible sequences include:
Scenario 1: Event occurrence → High-pressure water injection → Depressurization by heat removal using the steam generator (DSG) → Depressurization by opening the pressure relief valve (DP).
Scenario 2: Event occurrence → High-pressure water injection → Depressurization by opening the pressure relief valve (DP) → Depressurization by heat removal using the steam generator (DSG).
In this manner, the operator’s countermeasure priorities adjust based on the reactor’s cooling condition. Consequently, the steam generator isolation failure scenario on the damaged side during a SGTR was chosen as the focus of evaluation in this study.
3.2. Analytical System
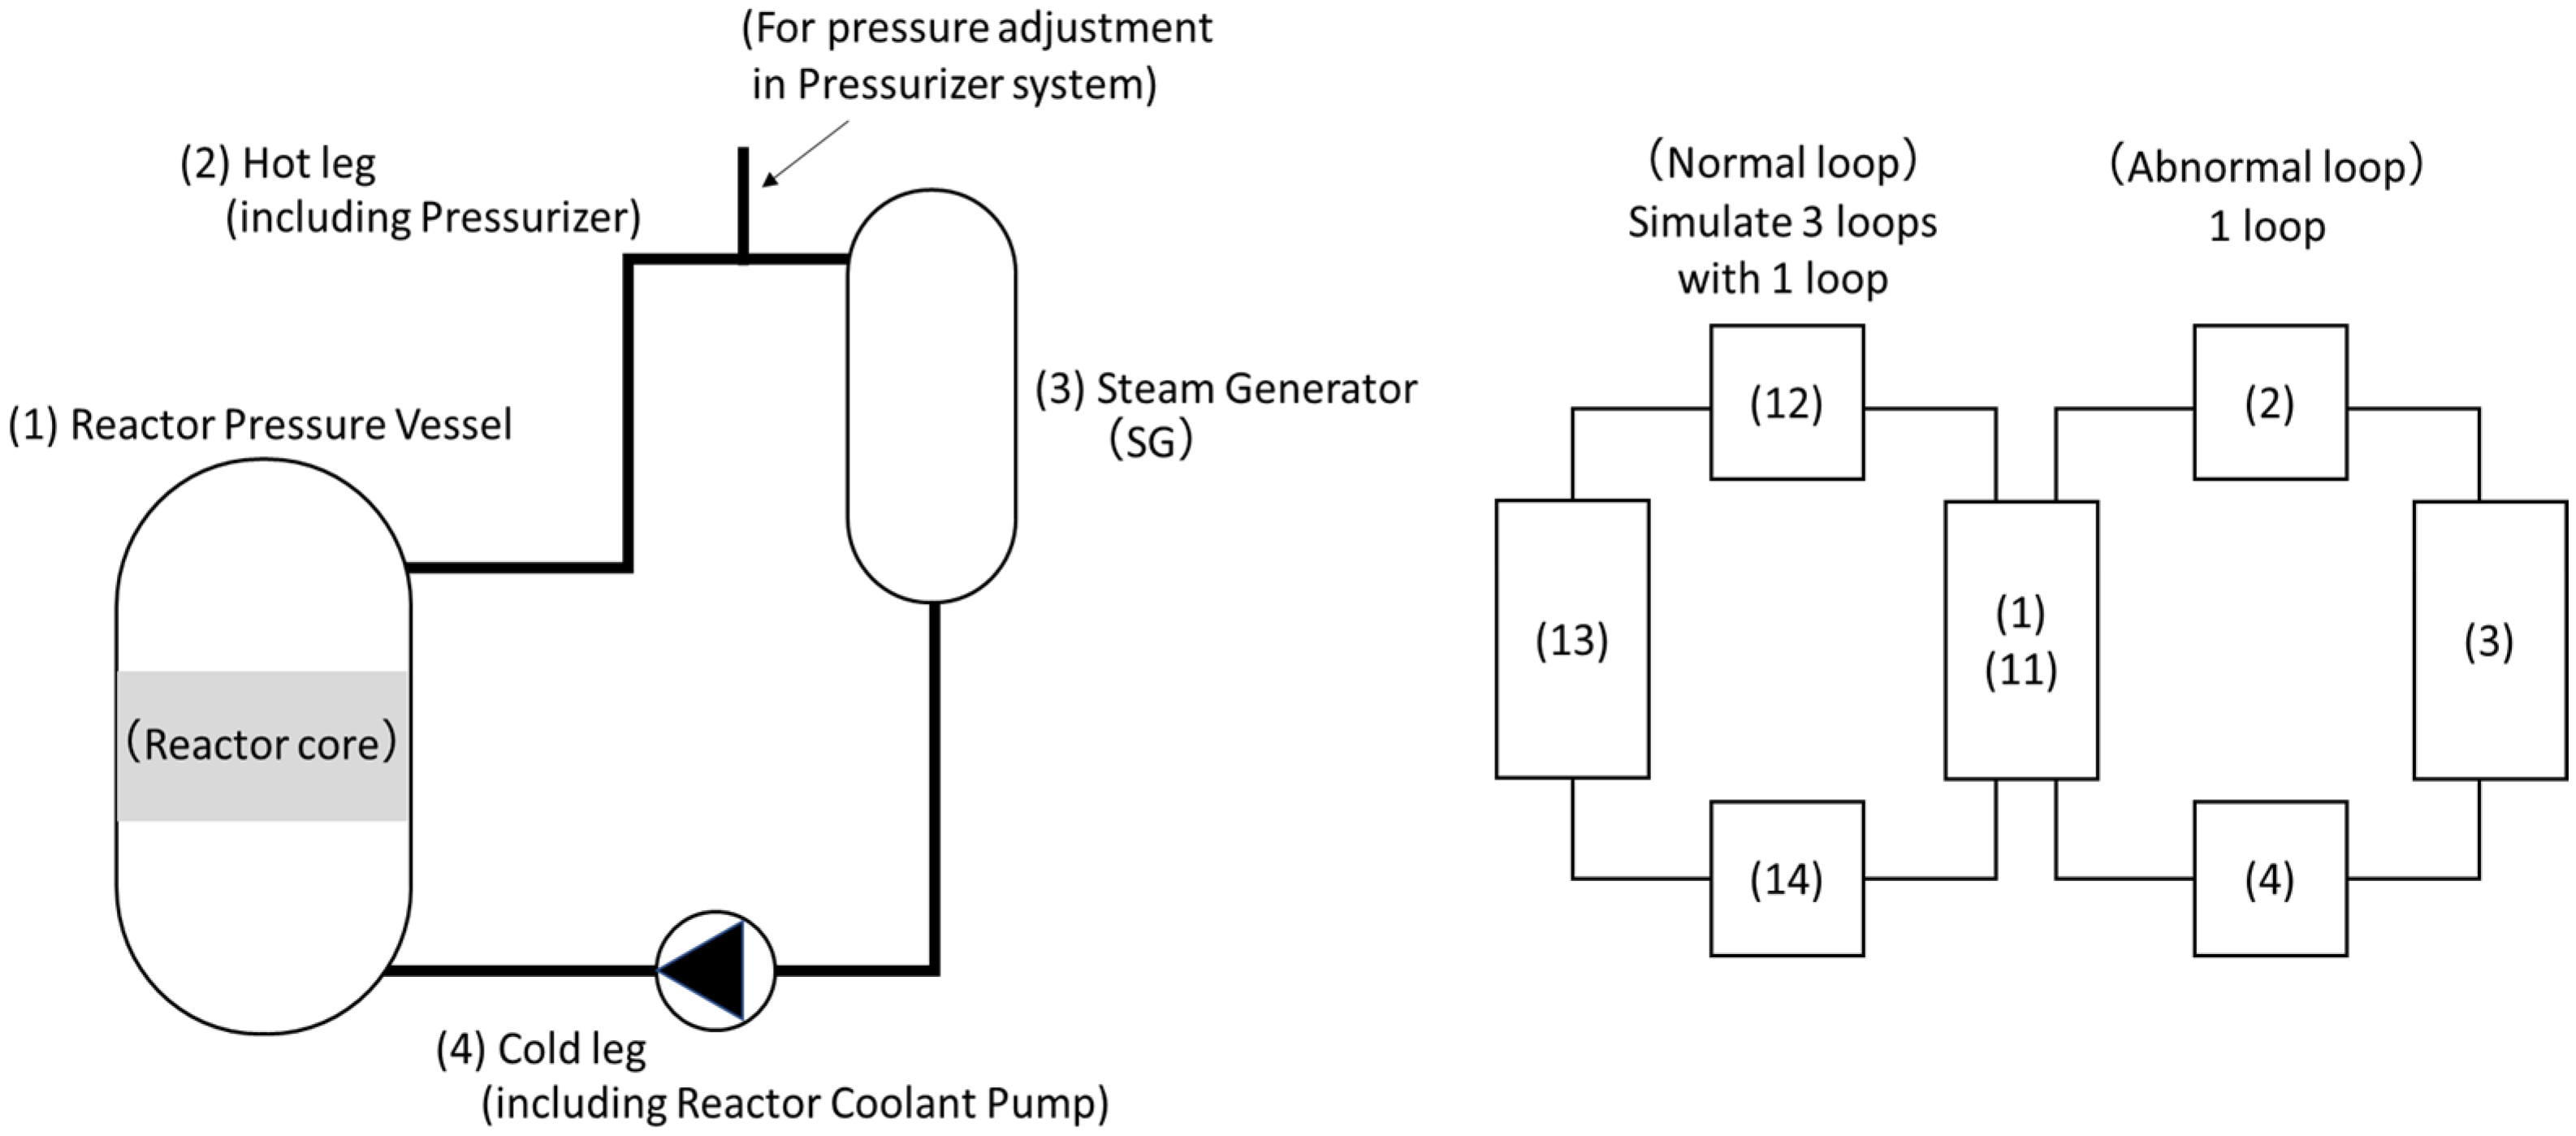
To simulate plant behavior within the selected scenario, a simplified plant dynamic analysis model of the primary system of a pressurized water reactor (PWR) assuming a single phase was constructed. An overview of the plant model is presented in
Figure 4. As shown in the figure, the primary system comprises four nodes: Reactor Pressure Vessel (RPV), Hot Leg (including Pressurizer line), Steam Generator, and Cold Leg (including pump). While the design assumes a four-loop configuration, three normal loops are simulated as one, resulting in an effective two-loop model—one normal and one abnormal loop. For each node, the governing equations for mass, energy, and momentum conservation are solved.
The RPV level serves as the criterion for assessing core damage. The coolant volume is determined from the inflow and outflow rates to the RPV, and the RPV level is calculated by dividing this volume by the representative cross-sectional area. Core damage is deemed to occur if the water level drops below 7.0 m during the analysis period [
7].
Upon occurrence of a SGTR, the emergency core cooling system (ECCS) is initiated at the early stage. In this study, the ECCS is represented as an injection of a certain amount of water into the RPV.
3.3. Analysis Conditions
The analysis conditions are presented in
Table 1. The SGTR event was initiated after the plant had reached a steady state. To assess the effects of uncertainty, four cases were evaluated: one scenario incorporated uncertainty in the initial SGTR leakage rate, while three scenarios applied fixed leakage rates without uncertainty. For the scenario involving uncertainty, the initial leakage rate was sampled from a uniform distribution ranging from 40 to 60 [kg/s]. In the cases without uncertainty, the initial leakage rate was set at fixed values of 40, 50, and 60 [kg/s], respectively. After the second step of the analysis, the leakage rate was determined by the prevailing pressure differential. The ECCS was activated in all scenarios, with consistent start and duration times maintained throughout. To evaluate two response operations, DP and DSG, and to account for the influence of their execution timing, the activation probability for both DP and DSG was set at 0.5 (only one decision per sample), and their initiation times were assigned using a uniform distribution. The overall analysis covered a period of 3600 [s], and 10,000 sample scenarios were generated for each case.
3.4. Priority-Determining Method
Each scenario generated from the analysis conditions described in
Section 3.3 is classified into seven patterns, as shown in
Table 2, based on the end state of the analysis.
For every classified pattern, the conditional core damage probability and the average RPV coolant level at the conclusion of the analysis are calculated. These values are used to prioritize and evaluate each pattern for response operations. The rules for prioritization are as follows:
Patterns without any analysis results (samples) are not assigned a priority.
If samples exist, patterns with a lower conditional core damage probability are prioritized higher.
When conditional core damage probabilities are equal, priority is given to patterns with a higher average RPV coolant level.
4. Results and Discussion
The analysis results for Cases 1 to 4 are discussed below.
4.1. Case 1
Table 3 presents the number of scenarios generated for each pattern, samples resulting in core damage, the core damage probability, the average RPV level at the end state, and the priority order results for Case 1 with an uncertainty of 40 to 60 [kg/s] for the leakage rate. Patterns 3 through 6 received higher priority, indicating that executing both response operations is more effective than performing each operation independently. Specifically, Patterns 4 and 3, which were activated from the DP, are prioritized highly, regardless of duplication status.
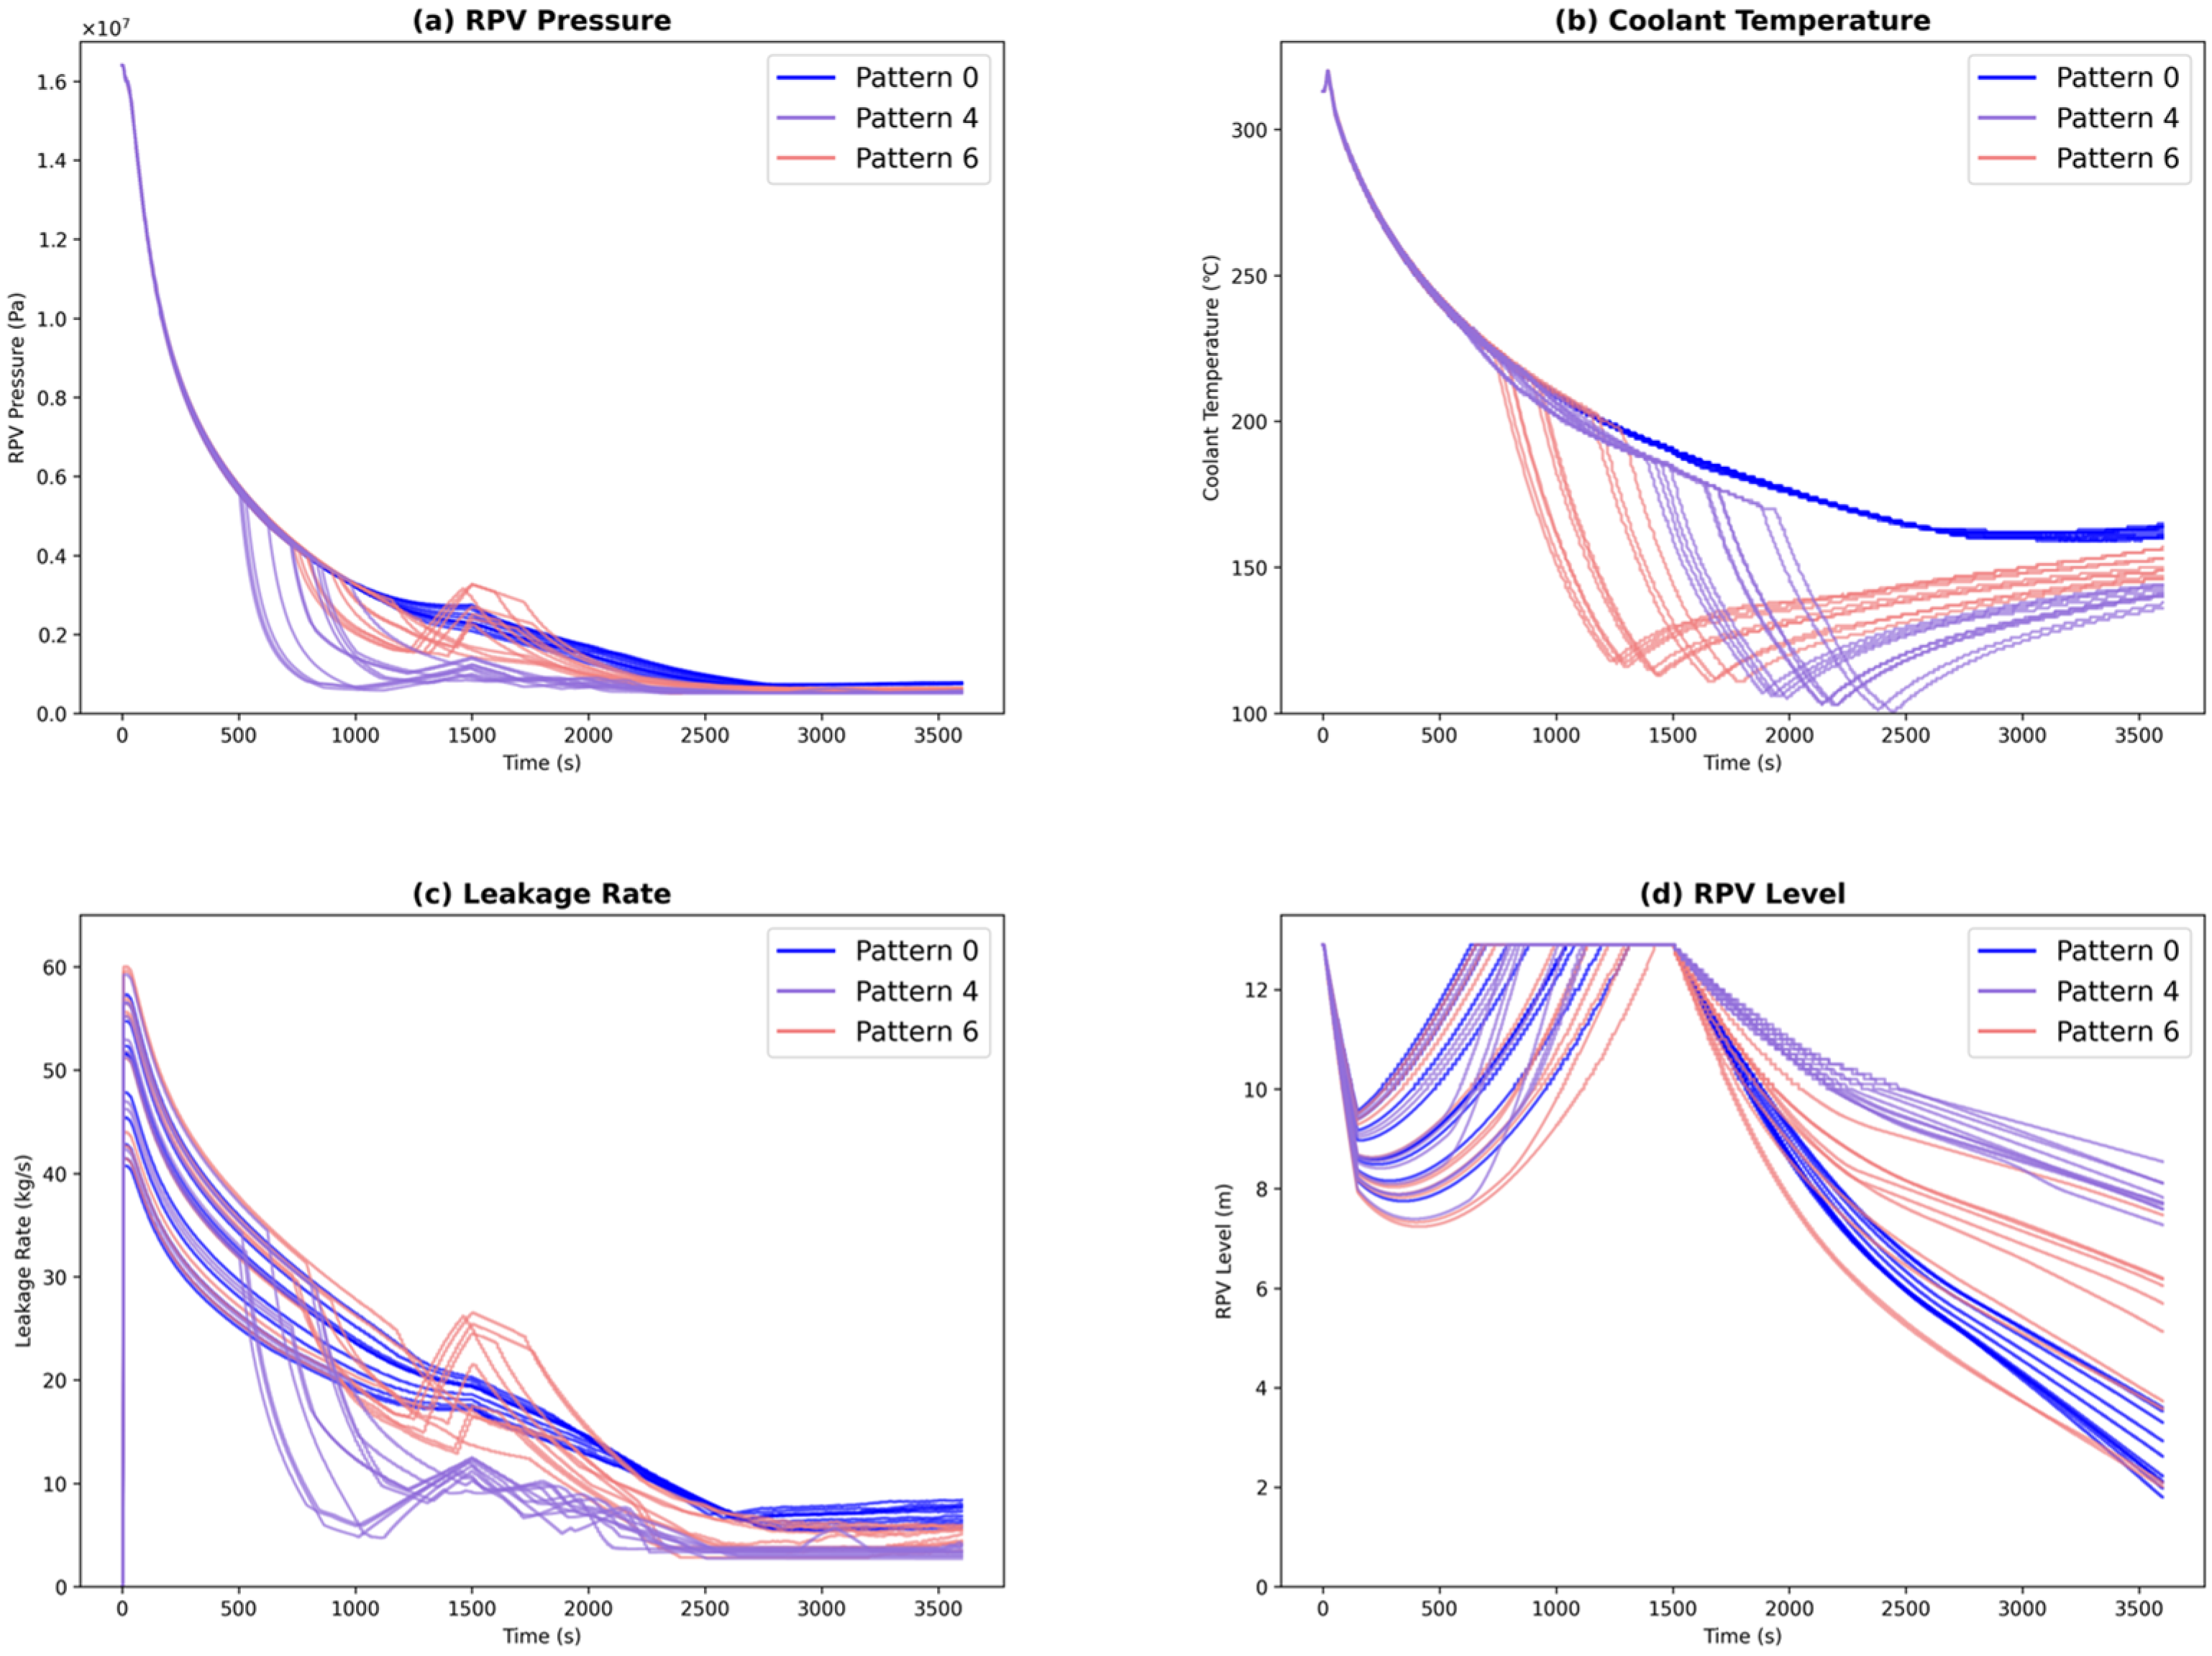
Figure 5 displays the trend graphs for RPV pressure, coolant temperature, leakage rate, and RPV level corresponding to Patterns 0, 4, and 6. The dashed line in
Figure 5 (d) makes the RPV level threshold for core damage, used as the criterion for success or failure of the event response. Patterns 4 and 6 are both involve execution of DP and DSG without time overlap but differ in operation sequence. In Pattern 4, where DP is initiated first, there is a reduction in leakage due to decreased RPV pressure, extending the time required to reach the core damage threshold. Conversely, in Pattern 6, in where DSG starts first, a rapid drop in coolant temperature results in a minor pressure decrease, though this has limited effect on reducing leakage and RPV level. Following DSG operation, the coolant temperature gradually increases, causing a slight rise in pressure. Consequently, the leakage rate increases, and the time to reach core damage is shorter than that in Pattern 4.
4.2. Case 2
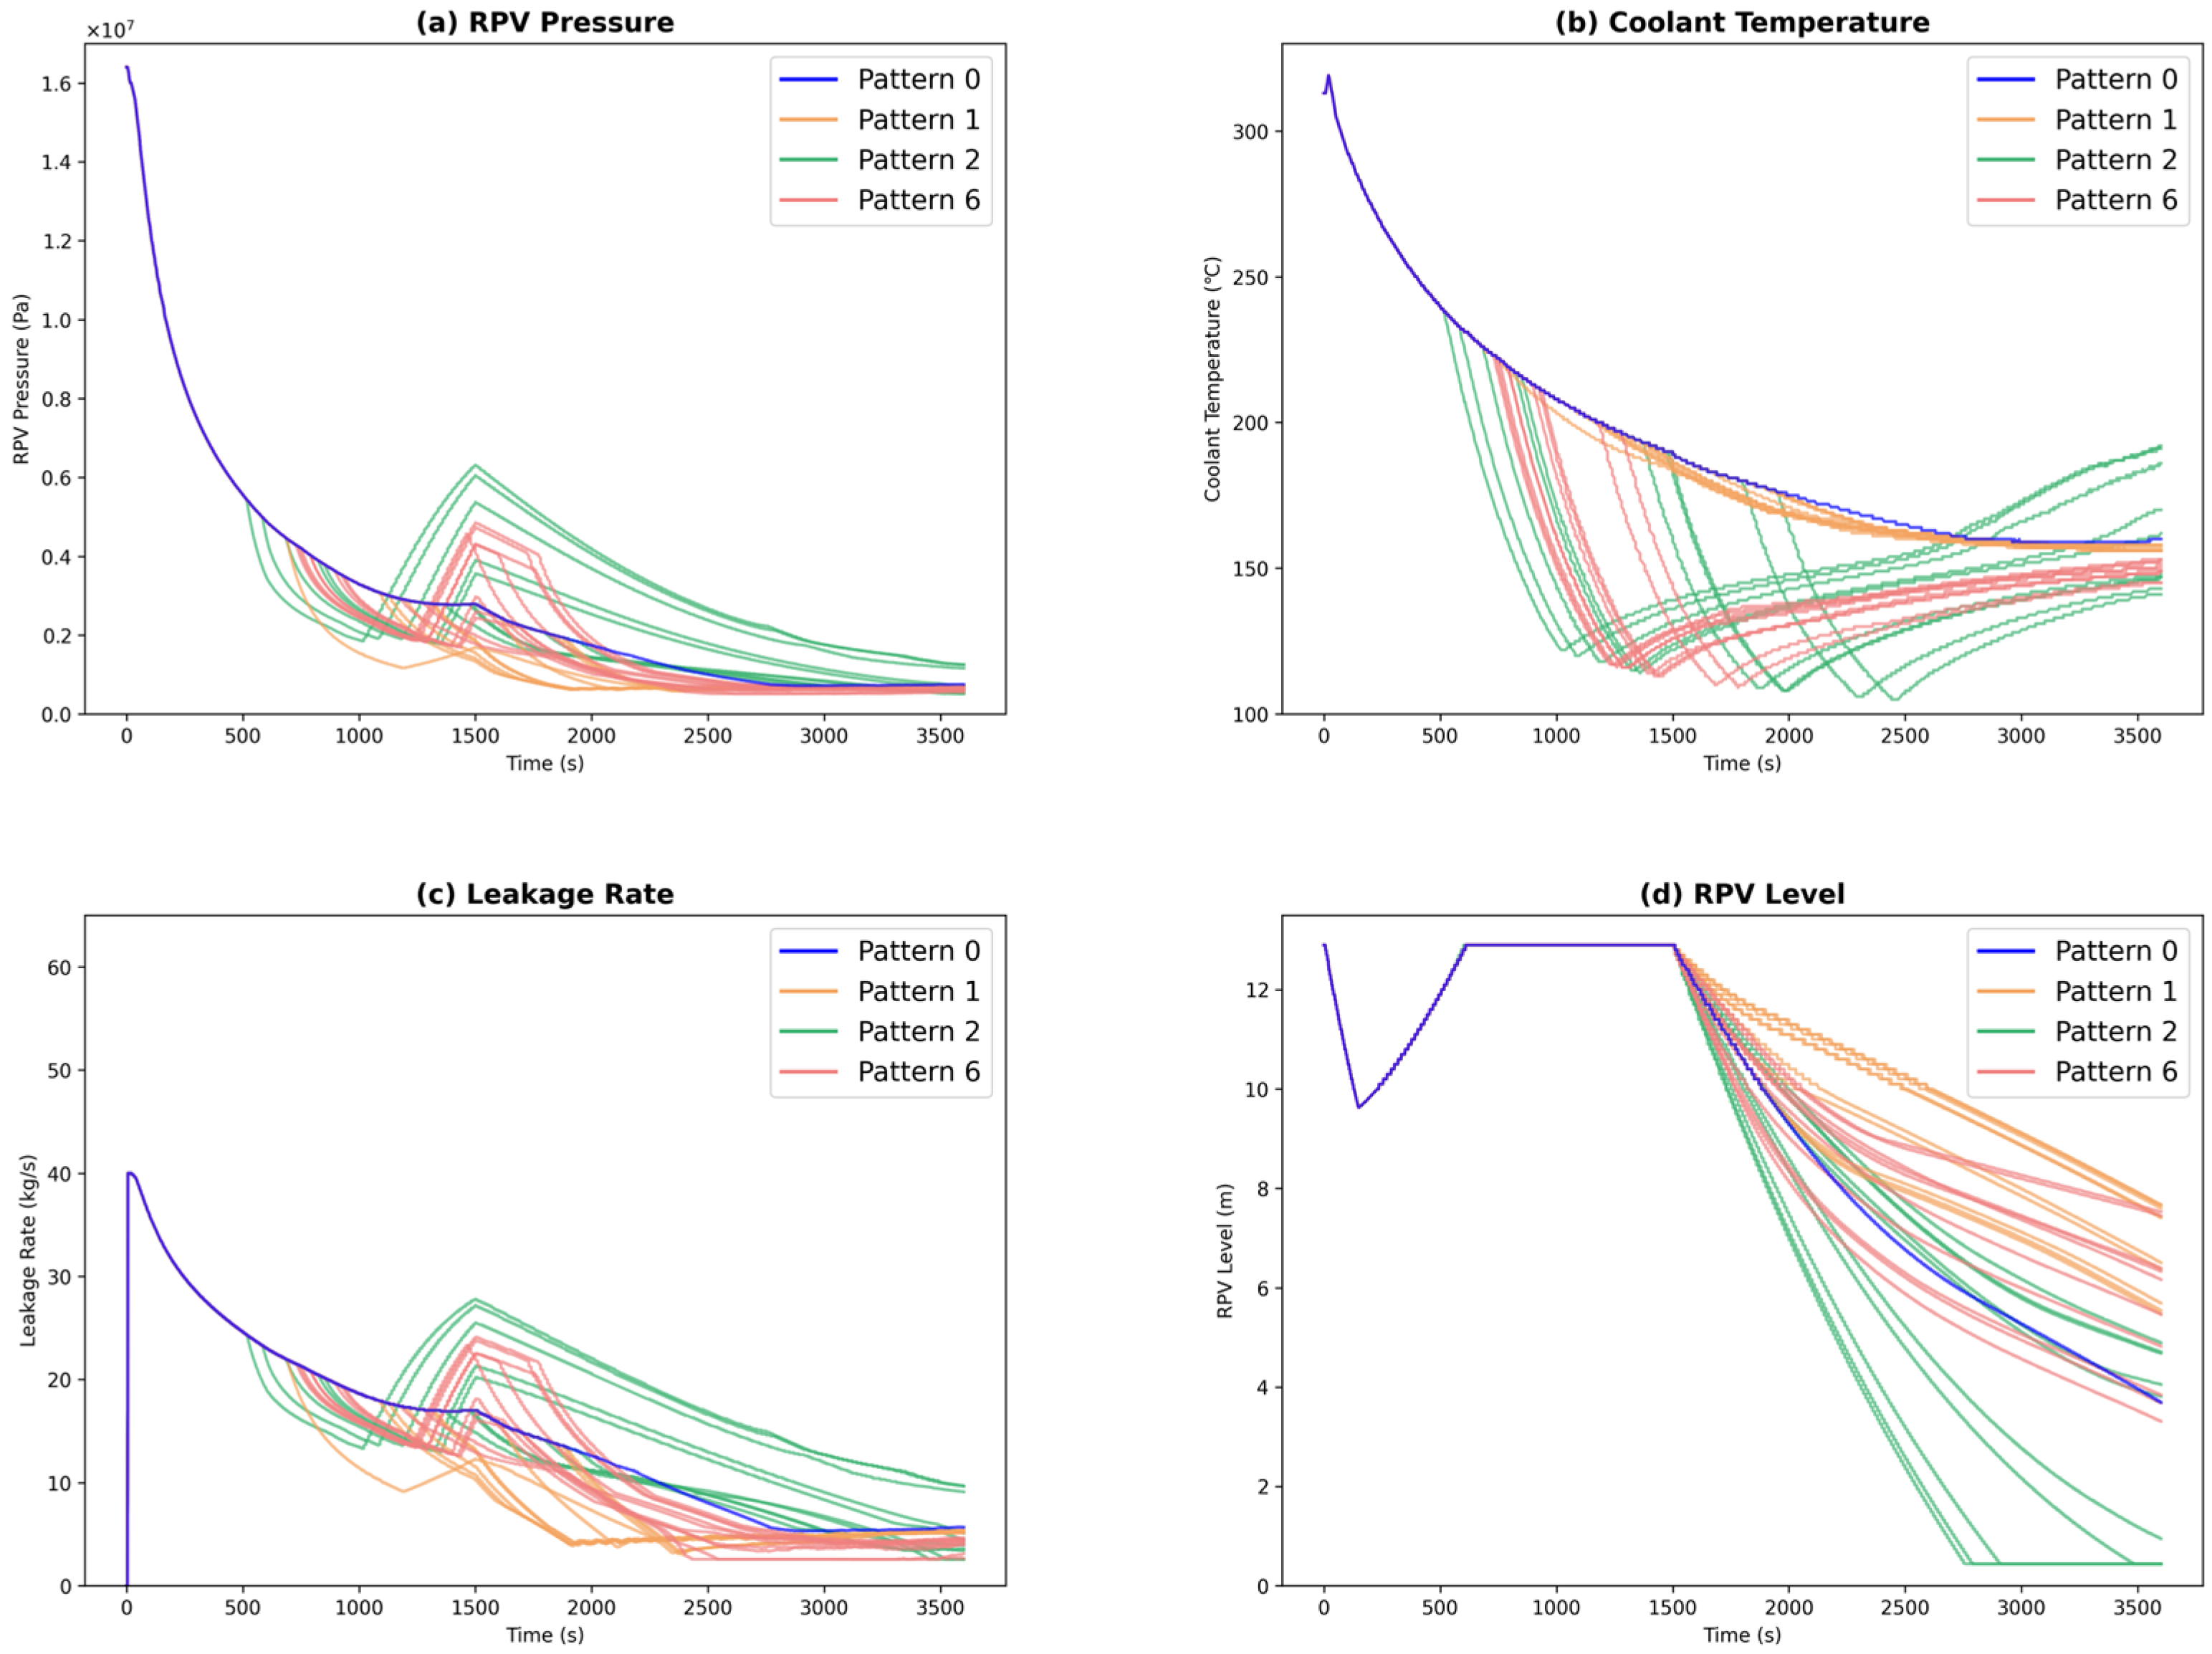
Table 4 shows the analysis results for Case 2 where the leakage rate was fixed at 40 [kg/s], and
Figure 6 shows the trend graphs in Patterns 0, 1, 2, and 6. Priorities 1 to 3 are the same as in Case 1. Pattern 2, which only implements DSG, has a lower priority than Pattern 0, which does not perform any response operations. This is because when DSG is implemented at an early stage, the coolant temperature gradually increases and the pressure rises after the DSG operation is completed, which leads to a higher leakage rate. Consequently, the number of samples that fall below the RPV level threshold, which is used to determine core damage, increased. Furthermore, Pattern 6, which implements both DP and DSG, has a lower priority than Pattern 1, which implements only DP. Pattern 6 involves implementing DSG and DP without overlapping time. Consequently, many samples implement DSG at the initial stage of response operation. These samples, similar to those in Pattern 2 that resulted in core damage, show an increase in pressure and leakage rate after DSG is performed. Therefore, it is considered that even if DP is performed to reduce pressure afterwards, the pressure and leakage will remain high compared to Pattern 1, increasing the probability of core damage. From these results, it was found that implementing DP at an early stage to reduce pressure and leakage rate is effective as a countermeasure.
4.3. Case 3
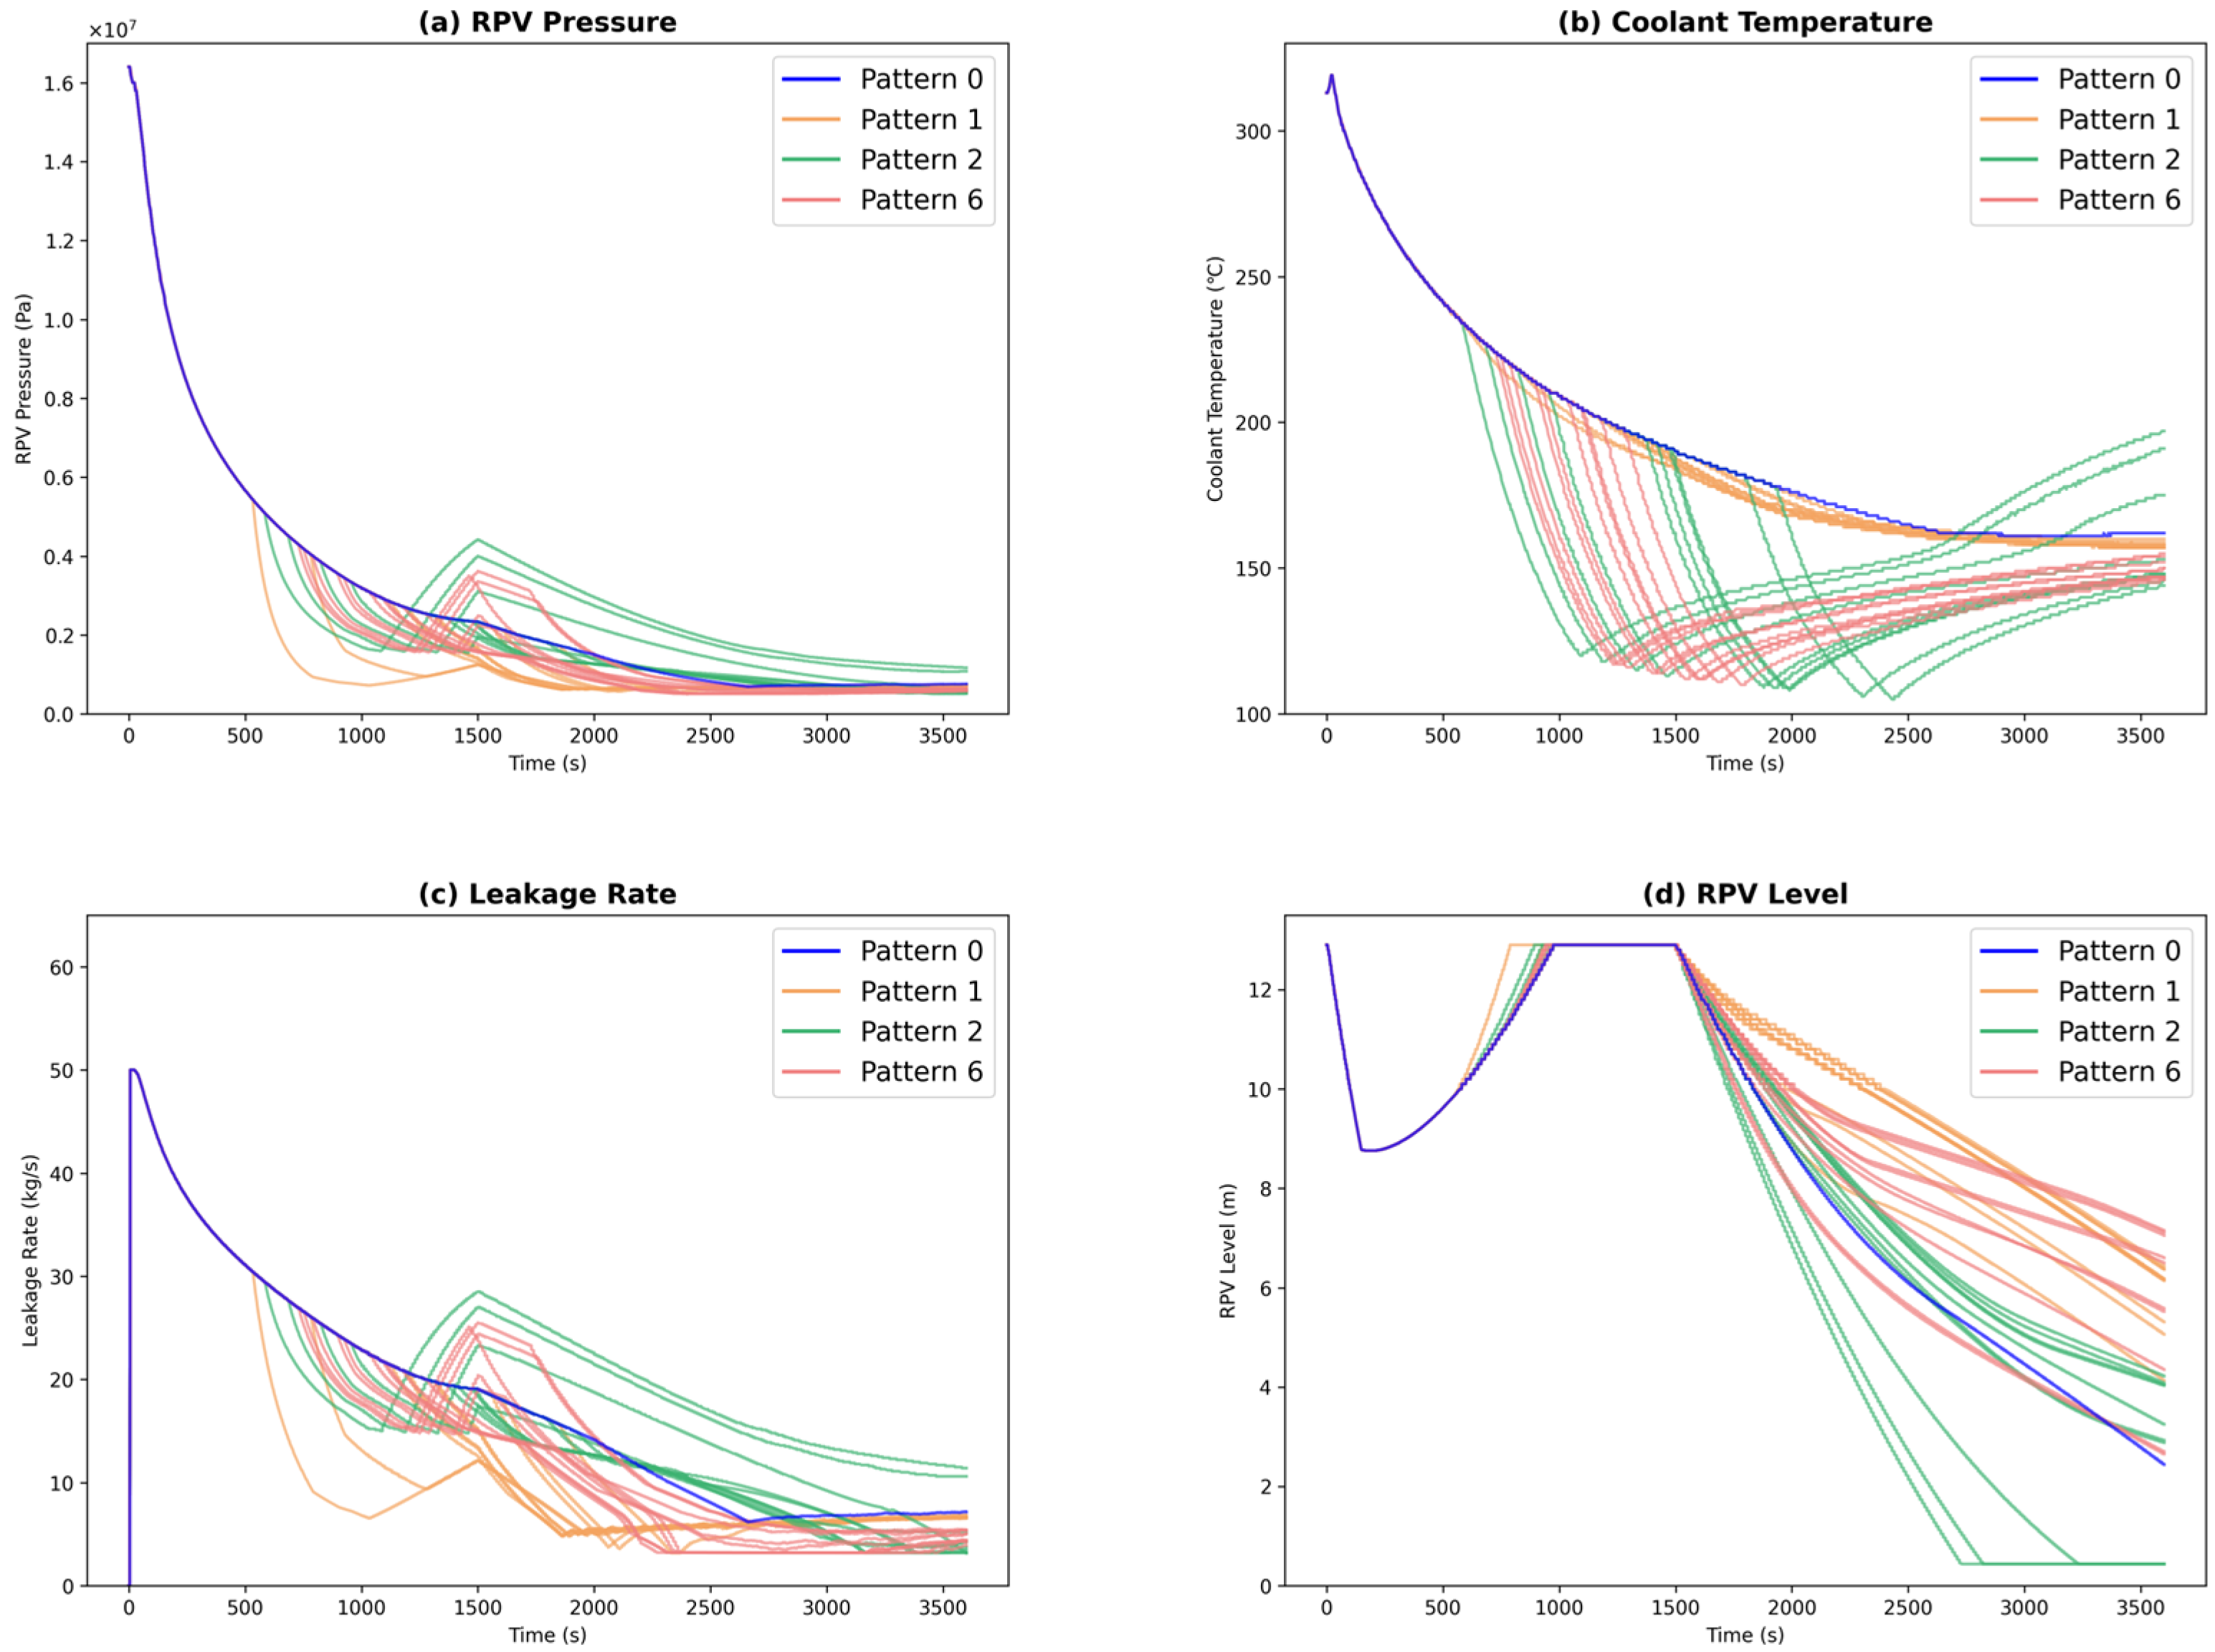
Table 5 shows the analysis results for Case 3 where the leakage rate was fixed at 50 [kg/s], and
Figure 7 shows the trend graphs in Patterns 0, 1, 2, and 6. Similarly to Case 1, patterns that perform both DP and DSG operations (Patterns 3 to 6) had higher priority. Comparing Patterns 1 and 6, the average RPV level is higher in Pattern 1, but the priority is higher in Pattern 6. In Pattern 1, DP was effective, but the leakage rate was high, and all samples led to core damage. On the other hand, in many of the Pattern 6 samples, the RPV level dropped due to an increase in leakage after DSG was implemented, leading to core damage. However, in approximately 10 [%] of the samples, DP was implemented immediately after DSG, preventing an increase in leakage rate and core damage. As a result, the probability of core damage in Pattern 6 was lower than in Pattern 1, and its priority became higher. Furthermore, when comparing the three patterns with a core damage probability of 100 [%], the final RPV level in Pattern 1, which implemented only DP, was more than twice that of Patterns 0 and 2. These results indicated that the implementation and timing of DP had a significant impact on the state of the plant.
4.4. Case 4
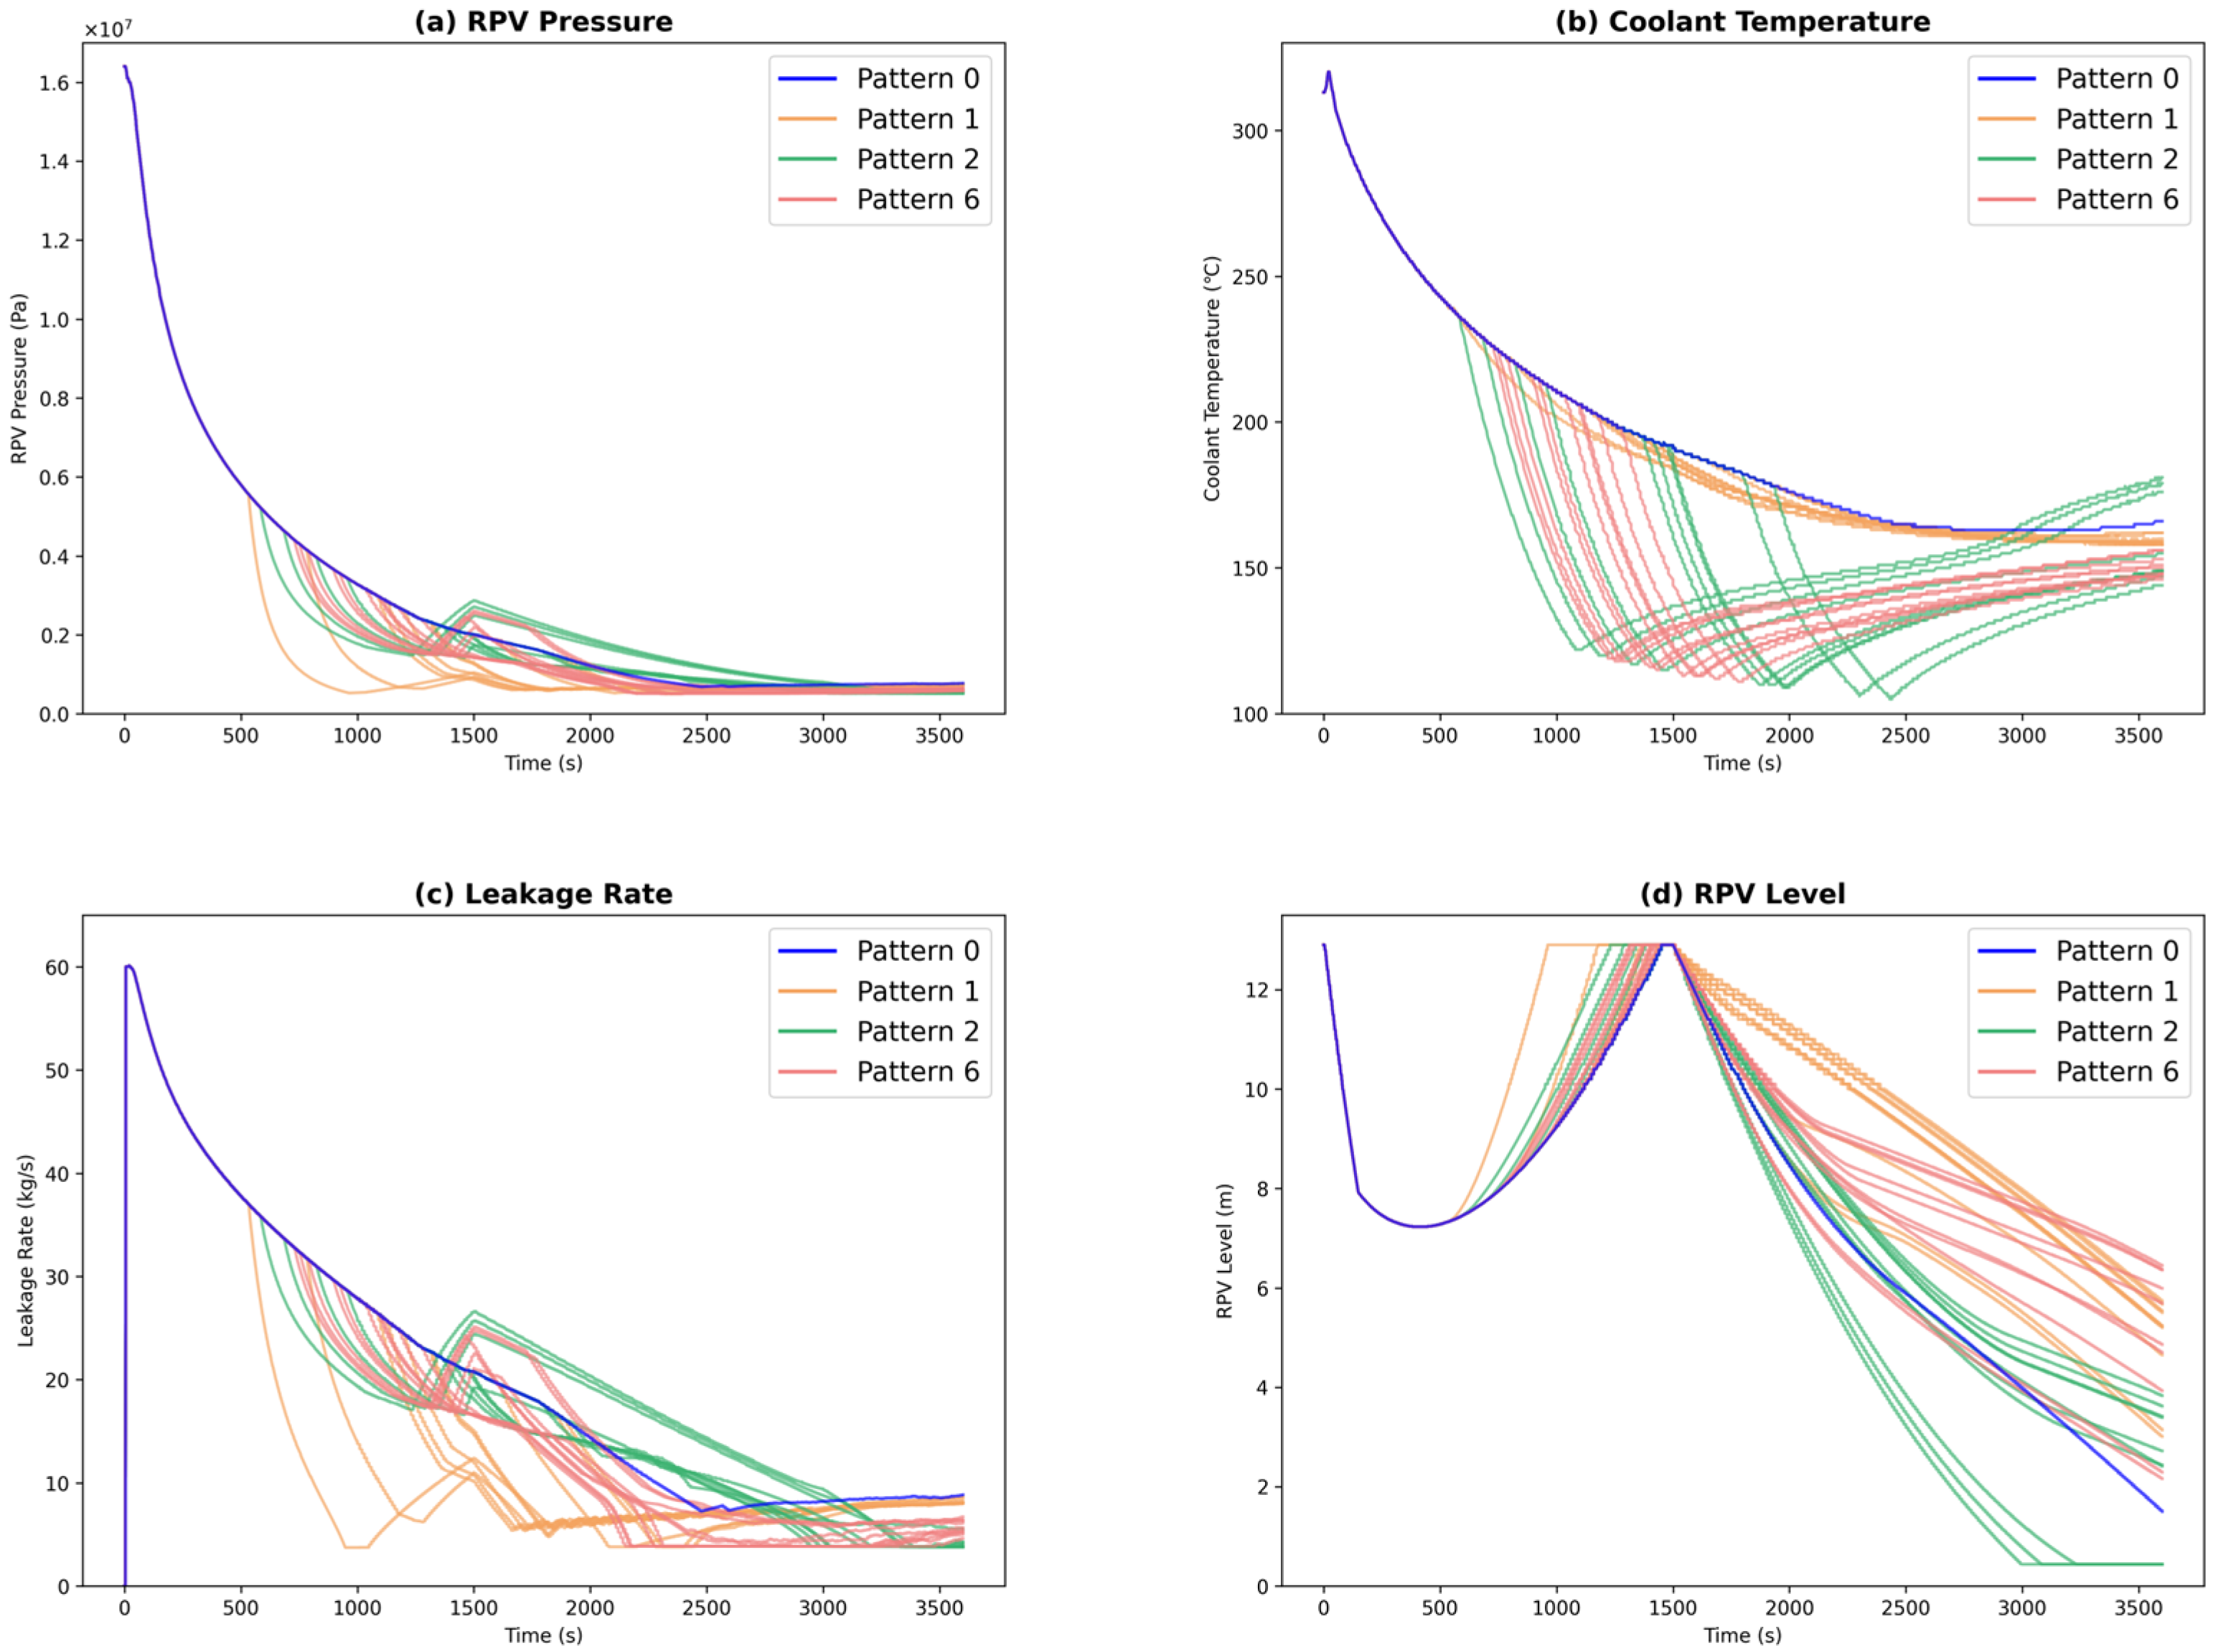
Table 6 shows the analysis results for Case 4 where the leakage rate was fixed at 60 [kg/s], and
Figure 8 shows the trend graphs in Patterns 0, 1, 2, and 6. Priorities 1 to 3 are the same as Cases 1 to 3. Case 4 contains the greatest number of samples resulting in core damage compared to the other cases. Comparing Patterns 1 and 6, Pattern 1 is higher in both priority and average RPV level. Even in the samples that did not suffer core damage in Case 3, i.e., the samples in which DP was performed immediately after DSG, all samples suffered core damage due to the impact of the initial leakage rate. Therefore, the core damage probability became the same at 100 [%], and Pattern 1, which had a higher average RPV level, became the higher priority. In addition, an approximate 1.00 [m] difference in RPV level was observed between Pattern 0, where no response operations were performed, and Pattern 2, where only DSG was implemented. The findings indicate that when the initial leakage rate is high, its impact surpasses the effect of the increased leakage rate resulting from the implementation of DSG.
4.5. Consideration of All Cases
Table 7 presents the priority order for scenarios generated under uncertainties in the SGTR initial leakage rate, ranging from 40 to 60 [kg/s], as well as for cases with fixed initial leakage rate of 40, 50, and 60 [kg/s], respectively. Across all leakage rates, Patterns 4, 3, and 5 consistently emerged as the top three priority scenarios. In addition, the priority order observed when incorporating uncertainty aligns with that found when the leakage rate is fixed at 50 [kg/s], representing the median value. There was a tendency for patterns that implemented both DP and DSG to have a higher priority. In particular, patterns in which the implementing times of DP and DSG overlapped had a high priority, and synergistic effects of simultaneous operations were observed. However, in patterns where there was no overlap between the implementation of DP and DSG, and DSG was implemented at an early stage, there were scenarios in which the effects of subsequent DP implementation could not be maximized due to increased pressure and leakage rate.
Table 8 and
Table 9 show the core damage probability and the average RPV level at the end state of all patterns in all cases, respectively. As the leakage rate increased, the probability of core damage increased, and the average RPV level decreased. When comparing each pattern in detail, in Cases 2 and 3, there were patterns with low priority due to high RPV levels but high core damage probability, and patterns with high priority due to low RPV levels but low core damage probability. In Case 4, the core damage probability of those patterns became the same at 100 [%], and the pattern with the higher water level became the higher priority. This result is consistent with the design philosophy of prioritizing scenarios with low core damage probability and then judging scenarios with higher RPV levels to be better.
The findings indicate that scenarios can be classified into patterns based on the occurrence and timing of response operations, and that priorities for these operations can be assessed using risk information like core damage probability and RPV water level. Furthermore, by generating scenarios that account for various uncertainties—including event magnitude within the plant and the timing of response operations—the analysis was able to assess both the effectiveness and distinctive characteristics of the response operations in the presence of uncertainty. In summary, the findings indicate that CMMC is a method suitable for determining the response operation priorities in complex scenarios.
5. Conclusions
This study proposed a countermeasure priority decision function utilizing the CMMC method, a dynamic PRA approach, to address the significant challenges associated with determining the optimal sequence of countermeasures following events arising from diverse and complex accident scenarios in AM countermeasure development and multi-unit operations.
As the first stage of the efficacy evaluation of the proposed method, we conducted a preliminary evaluation to determine whether a large set of scenarios, including uncertainty, could be classified into some countermeasure patterns and prioritized. A simple single-unit plant dynamic characteristic analysis model was developed. Multiple scenarios incorporating various uncertainties were generated using a uniform distribution to simulate failure scenarios involving SGTR breakage-side steam generator isolation, and response operations patterns were assessed. The findings indicate that the proposed method could be effective in establishing countermeasure priorities in intricate scenarios, as it enables evaluation of response operation effectiveness based on risk information that accounts for uncertainty.
We plan several future research efforts to determine priorities for more complex scenarios. The first effort is to implement state transitions that depend on the time-depend conditions. In this study, scenarios were generated according to a uniform distribution that is time--independent. However, in actual operation, the operator’s judgments and actions are expected to adapt to situations and contexts that evolve over time. To represent such operator behaviors, research has been conducted on modeling and evaluating operator performance through approaches such as dynamic human reliability analysis and simulation-based methods [
8,
9,
10,
11,
12]. Therefore, we plan to apply the CMMC method to generate more realistic and dynamic scenarios that consider the interactions between operator behaviors and reactor simulations. The second effort is to address multi-unit operations. We will extend the plant model to include multiple units and generate scenarios that consider mutual influences among units and dynamic personnel allocation [
13]. In addition, we plan to develop evaluation metrics for multi-unit operation to determine priorities in that context.
As these efforts progress, two additional challenges are expected to emerge. One such challenge is an increase in the number of patterns. This paper discussed the order and timing of two countermeasures, DP and DSG. While multi-unit operations are expected to involve a larger number of countermeasures, it is impractical to enumerate patterns for every possible order and timing combination of all countermeasures. In such cases, a method alternating between abstract and detailed evaluations can be considered. Specifically, the order and timing of phases—each abstracting several countermeasures—will be analyzed and evaluated. Subsequently, the order and timing of individual countermeasures within each phase will also be examined. Another issue is the use of large-scale simulation codes. In this study, a simple plant model was used for simulations. Because the proposed method relies on Monte Carlo simulation, computations using high-fidelity code that reproduces an actual plant are extremely time-consuming. When applying this method to safety analysis, one feasible approach is to perform comprehensive, first-order calculations with a simple plant model and then carry out detailed computations with large-scale code only for scenarios identified as risk-significant. Moreover, for applications that require real-time performance, a practical strategy is to precompute and evaluate a comprehensive set of scenarios, store the results, and retrieve the scenario that best matches the current situation. We will investigate mitigation measures for both issues in future work.
Author Contributions
Conceptualization, N.Y., M.K., Y.U., T.N. and T.T.; methodology, N.Y., M.K., Y.U., T.N. and T.T.; software, T.N. and T.T.; validation, N.Y., M.K., Y.U., T.N. and T.T.; formal analysis, N.Y., M.K., T.N. and T.T.; investigation, N.Y., M.K., T.N. and T.T.; data curation, T.N. and T.T.; writing—original draft preparation, N.Y.; writing—review and editing, M.K., T.N. and T.T.; visualization, N.Y., T.N. and T.T.; supervision, Y.U., T.N. and T.T.; funding acquisition, Y.U. All authors have read and agreed to the published version of the manuscript.
Funding
This study was funded by Mitsubishi Electric Corporation as part of the project titled “Research on Reliability Assessment Techniques for Nuclear Power Plants”.
Data Availability Statement
The datasets presented in this article are not readily available because the data include proprietary information. Requests to access the datasets should be directed to
Yamamoto.Nami@bp.MitsubishiElectric.co.jp.
Conflicts of Interest
Nami Yamamoto, Mami Kagimoto, and Yohei Ueno were employed by Mitsubishi Electric Corporation. These authors declare that this study received funding from Mitsubishi Electric Corporation. The funder was involved in the study as part of the joint research collaboration, including the study design, data analysis, and manuscript preparation.
References
- Yamamoto, N.; Kagimoto, M.; Ueno, Y.; Narukawa, T.; Takata, T. Application of Dynamic PRA to Nuclear Power Plant Operation Support—Evaluation of Plant Operation Support Using a Simple Plant Model. In Proceedings of the Probabilistic Safety Assessment and Management & Asian Symposium on Risk Assessment and Management (PSAM 17 & ASRAM 2024), Sendai, Japan, 7–11 October 2024. [Google Scholar]
- Shinzaki, S.; Yamaguchi, A.; Takata, T. Quantification of severe accident scenarios in level 2 PSA of nuclear power plant with continuous Markov Chain Model and Monte Carlo Method. In Proceedings of the 10th International Probabilistic Safety Assessment & Management Conference (PSAM10), Seattle, DC, USA, 7–11 June 2010. [Google Scholar]
- Takata, T.; Azuma, E. Event sequence assessment of deep snow in sodium-cooled fast reactor based on continuous Markov chain Monte Carlo method with plant dynamics analysis. J. Nucl. Sci. Technol. 2016, 53, 1749–1757. [Google Scholar] [CrossRef]
- Shinzaki, S. Scenario Quantification of Dynamic Level 2 PSA Based on Continuous Markov Monte Carlo Method and Plant System Analysis Code. Master’s Thesis, Osaka University, Osaka, Japan, 2012. [Google Scholar]
- Yamamoto, N.; Kagimoto, M.; Yoshinaga, M.; Ueno, Y.; Narukawa, T.; Takata, T. Application of dynamic PRA to nuclear power plant operation support (1) Evaluation of plant operation support using a simple plant model. In Proceedings of the Annual Meeting of the Atomic Energy Society of Japan 2024, Osaka, Japan, 26–28 March 2024. (In Japanese). [Google Scholar]
- Hokkaido Electric Power Company. Evaluation of the Effectiveness of Measures Against Severe Accidents at Unit 3 of the Tomari Nuclear Power Station: Confirmation of Validity—Supplementary Material; Hokkaido Electric Power Company: Hokkaido, Japan, 2013. (In Japanese) [Google Scholar]
- Hokkaido Electric Power Company. Severe accident analysis code for evaluating the effectiveness of severe accident management measures (Part 1 M-RELAP5). In 58th Review Meeting, Document 2-2-2, Revision 2; Hokkaido Electric Power Company: Hokkaido, Japan, 2013. (In Japanese) [Google Scholar]
- Park, J.; Boring, R. Dynamic Human Reliability Analysis using the EMRALD Dynamic Risk Assessment Tool. J. Reliab. Eng. Syst. Saf. 2025, 265, 111260. [Google Scholar] [CrossRef]
- Boring, R.; Ulrich, T.; Ahn, J.; Heo, Y.; Park, J. Software Implementation and Demonstration of the Human Unimodel for Nuclear Technology to Enhance Reliability (HUNTER); INL/RPT-22-66564; Idaho National Laboratory: Idaho Falls, ID, USA, 2022.
- Park, J.; Boring, R.; Ulrich, T.; Yang, T.; Kim, J. Human Unimodel for Nuclear Technology to Enhance Reliability (HUNTER) Demonstration: Part 1, Empirical Data Collection of Operational Scenarios; INL/RPT-22-69167; Idaho National Laboratory: Idaho Falls, ID, USA, 2022.
- Lew, R.; Ulrich, T.; Boring, R. Human Unimodel for Nuclear Technology to Enhance Reliability (HUNTER) Demonstration: Part 2, Model Runs of Operational Scenarios; INL/RPT-22-70076; Idaho National Laboratory: Idaho Falls, ID, USA, 2022.
- Lew, R.; Kim, J.; Park, J.; Ulrich, T.; Prescott, S.; Mortenson, T.; Boring, R. EMRALD-HUNTER: An Embedded Dynamic Human Reliability Analysis Module for Probabilistic Risk Assessment; INL/RPT-23-72783; Idaho National Laboratory: Idaho Falls, ID, USA, 2023.
- Yamamoto, N.; Kagimoto, M.; Ueno, Y.; Narukawa, T.; Takata, T. Application of Dynamic Probabilistic Risk Assessment to Nuclear Power Plant Operation Support—Evaluation of Countermeasure during Multi-unit Operation Considering Operator State. In Proceedings of the Asian Symposium on Risk Assessment and Management (ASRAM2025), Chonburi, Thailand, 27–29 August 2025. [Google Scholar]
Figure 1.
Concept of CMMC method. Reprinted with permission from Ref. [
3]. Copyright 2016, Taylor & Francis.
Figure 1.
Concept of CMMC method. Reprinted with permission from Ref. [
3]. Copyright 2016, Taylor & Francis.
Figure 2.
Scenario generation flow using CMMC. Reprinted with permission from Ref. [
4]. Copyright 2012, Satoshi Shinzaki.
Figure 2.
Scenario generation flow using CMMC. Reprinted with permission from Ref. [
4]. Copyright 2012, Satoshi Shinzaki.
Figure 3.
Determination flow of countermeasure priority. Reprinted from Ref. [
1].
Figure 3.
Determination flow of countermeasure priority. Reprinted from Ref. [
1].
Figure 4.
Plant model overview.
Figure 4.
Plant model overview.
Figure 5.
Analysis results (Case 1: Patterns 0, 4, and 6), (a) RPV pressure; (b) Coolant temperature; (c) Leakage rate; (d) RPV level.
Figure 5.
Analysis results (Case 1: Patterns 0, 4, and 6), (a) RPV pressure; (b) Coolant temperature; (c) Leakage rate; (d) RPV level.
Figure 6.
Analysis results (Case 2: Patterns 0, 1, 2, and 6), (a) RPV pressure; (b) Coolant temperature; (c) Leakage rate; (d) RPV level.
Figure 6.
Analysis results (Case 2: Patterns 0, 1, 2, and 6), (a) RPV pressure; (b) Coolant temperature; (c) Leakage rate; (d) RPV level.
Figure 7.
Analysis results (Case 3: Patterns 0, 1, 2, and 6), (a) RPV pressure; (b) Coolant temperature; (c) Leakage rate; (d) RPV level.
Figure 7.
Analysis results (Case 3: Patterns 0, 1, 2, and 6), (a) RPV pressure; (b) Coolant temperature; (c) Leakage rate; (d) RPV level.
Figure 8.
Analysis results (Case 4: Patterns 0, 1, 2, and 6), (a) RPV pressure; (b) Coolant temperature; (c) Leakage rate; (d) RPV level.
Figure 8.
Analysis results (Case 4: Patterns 0, 1, 2, and 6), (a) RPV pressure; (b) Coolant temperature; (c) Leakage rate; (d) RPV level.
Table 1.
Analysis conditions.
Table 1.
Analysis conditions.
| | | Case 1 | Case 2 | Case 3 | Case 4 |
|---|
| SGTR | Initial leakage rate [kg/s] | 40 to 60 | 40 | 50 | 60 |
| Start Time [s] | 5 |
| ECCS | Start Time [s] | 150 |
| Duration [s] | 1350 |
| DP | Start Time [s] | 500 to 2000 |
| Duration [s] | 500 |
| DSG | Start Time [s] | 500 to 2000 |
| Duration [s] | 500 |
Table 2.
Pattern classification by final state.
Table 2.
Pattern classification by final state.
| Pattern | Description |
|---|
| 0 | Neither DP nor DSG is activated |
| 1 | Only DP is activated |
| 2 | Only DSG is activated |
| 3 | DP, DSG are both activated in that order (with overlapping periods) |
| 4 | DP, DSG are both activated in that order (no overlapping periods) |
| 5 | DSG, DP are both activated in that order (with overlapping periods) |
| 6 | DSG, DP are both activated in that order (no overlapping periods) |
Table 3.
Analysis results (Case 1).
Table 3.
Analysis results (Case 1).
| Pattern | Sample | CD-Sample | CD-Probability
[%] | AVG-RPV
Level [m] | Priority |
|---|
| 0 | 2488 | 2488 | 100 | 2.49 | 7 |
| 1 | 2464 | 2258 | 91.6 | 5.75 | 5 |
| 2 | 2572 | 2572 | 100 | 2.91 | 6 |
| 3 | 666 | 124 | 18.6 | 8.05 | 2 |
| 4 | 529 | 0 | 0.00 | 8.05 | 1 |
| 5 | 690 | 222 | 32.2 | 7.15 | 3 |
| 6 | 591 | 514 | 87.0 | 4.56 | 4 |
| ALL | 10,000 | 8178 | 81.8 | 4.51 | - |
Table 4.
Analysis results (Case 2).
Table 4.
Analysis results (Case 2).
| Pattern | Sample | CD-Sample | CD-Probability
[%] | AVG-RPV
Level [m] | Priority |
|---|
| 0 | 2488 | 2488 | 100 | 3.69 | 6 |
| 1 | 2464 | 1375 | 55.8 | 6.74 | 4 |
| 2 | 2572 | 2572 | 100 | 3.59 | 7 |
| 3 | 666 | 86 | 12.9 | 8.74 | 2 |
| 4 | 529 | 8 | 1.51 | 8.17 | 1 |
| 5 | 690 | 126 | 18.3 | 7.83 | 3 |
| 6 | 591 | 398 | 67.3 | 5.42 | 5 |
| ALL | 10,000 | 7053 | 70.5 | 5.38 | - |
Table 5.
Analysis results (Case 3).
Table 5.
Analysis results (Case 3).
| Pattern | Sample | CD-Sample | CD-Probability
[%] | AVG-RPV
Level [m] | Priority |
|---|
| 0 | 2488 | 2488 | 100 | 2.44 | 7 |
| 1 | 2464 | 2464 | 100 | 5.72 | 5 |
| 2 | 2572 | 2572 | 100 | 2.84 | 6 |
| 3 | 666 | 125 | 18.8 | 8.04 | 2 |
| 4 | 529 | 0 | 0.00 | 8.04 | 1 |
| 5 | 690 | 239 | 34.6 | 7.12 | 3 |
| 6 | 591 | 539 | 91.2 | 4.51 | 4 |
| ALL | 10,000 | 8427 | 84.3 | 4.46 | - |
Table 6.
Analysis results (Case 4).
Table 6.
Analysis results (Case 4).
| Pattern | Sample | CD-Sample | CD-Probability
[%] | AVG-RPV
Level [m] | Priority |
|---|
| 0 | 2488 | 2488 | 100 | 1.50 | 7 |
| 1 | 2464 | 2464 | 100 | 4.87 | 4 |
| 2 | 2572 | 2572 | 100 | 2.44 | 6 |
| 3 | 666 | 174 | 26.1 | 7.44 | 2 |
| 4 | 529 | 0 | 0.00 | 7.96 | 1 |
| 5 | 690 | 306 | 44.3 | 6.58 | 3 |
| 6 | 591 | 591 | 100 | 4.14 | 5 |
| ALL | 10,000 | 8595 | 86.0 | 3.82 | - |
Table 7.
Priority of countermeasures (all cases).
Table 7.
Priority of countermeasures (all cases).
| Pattern | Case 1
(40 to 60 [kg/s]) | Case 2
(40 [kg/s]) | Case 3
(50 [kg/s]) | Case 4
(60 [kg/s]) |
|---|
| 0 | 7 | 6 | 7 | 7 |
| 1 | 5 | 4 | 5 | 4 |
| 2 | 6 | 7 | 6 | 6 |
| 3 | 2 | 2 | 2 | 2 |
| 4 | 1 | 1 | 1 | 1 |
| 5 | 3 | 3 | 3 | 3 |
| 6 | 4 | 5 | 4 | 5 |
Table 8.
Core damage probability (all cases).
Table 8.
Core damage probability (all cases).
| Pattern | Case 1
(40 to 60 [kg/s]) | Case 2
(40 [kg/s]) | Case 3
(50 [kg/s]) | Case 4
(60 [kg/s]) |
|---|
| 0 | 100 | 100 | 100 | 100 |
| 1 | 91.6 | 55.8 | 100 | 100 |
| 2 | 100 | 100 | 100 | 100 |
| 3 | 18.6 | 12.9 | 18.8 | 26.1 |
| 4 | 0.00 | 1.51 | 0.00 | 0.00 |
| 5 | 32.2 | 18.3 | 34.6 | 44.3 |
| 6 | 87.0 | 67.3 | 91.2 | 100 |
| ALL | 81.8 | 70.5 | 84.3 | 86.0 |
Table 9.
Average RPV level (all cases).
Table 9.
Average RPV level (all cases).
| Pattern | Case 1
(40 to 60 [kg/s]) | Case 2
(40 [kg/s]) | Case 3
(50 [kg/s]) | Case 4
(60 [kg/s]) |
|---|
| 0 | 2.49 | 3.69 | 2.44 | 1.50 |
| 1 | 5.75 | 6.74 | 5.72 | 4.87 |
| 2 | 2.91 | 3.59 | 2.84 | 2.44 |
| 3 | 8.05 | 8.74 | 8.04 | 7.44 |
| 4 | 8.05 | 8.17 | 8.04 | 7.96 |
| 5 | 7.15 | 7.83 | 7.12 | 6.58 |
| 6 | 4.56 | 5.42 | 4.51 | 4.14 |
| ALL | 4.51 | 5.38 | 4.46 | 3.82 |
| Disclaimer/Publisher’s Note: The statements, opinions and data contained in all publications are solely those of the individual author(s) and contributor(s) and not of MDPI and/or the editor(s). MDPI and/or the editor(s) disclaim responsibility for any injury to people or property resulting from any ideas, methods, instructions or products referred to in the content. |
© 2025 by the authors. Licensee MDPI, Basel, Switzerland. This article is an open access article distributed under the terms and conditions of the Creative Commons Attribution (CC BY) license (https://creativecommons.org/licenses/by/4.0/).

