Article

Two-Phase Flow Studies in Steam Separators Using Interface Capturing Simulations †

Department of Nuclear Engineering, North Carolina State University, 2500 Stinson Drive, Raleigh, NC 27695, USA
*
Author to whom correspondence should be addressed.
Certain results in this work were presented at the 14th International Topical Meeting on Nuclear Reactor Thermal Hydraulics, Operation and Safety (NUTHOS-14), Vancouver, BC, Canada, 25–28 August 2024; the American Nuclear Society (ANS) Winter Conference, Orlando, FL, USA, 17–21 November 2024; the American Physical Society (APS) Gallery of Fluid Motion, Salt Lake City, UT, USA, 24–26 November 2024.
J. Nucl. Eng. 2025, 6(4), 42; https://doi.org/10.3390/jne6040042
Submission received: 2 July 2025 / Revised: 27 July 2025 / Accepted: 30 September 2025 / Published: 15 October 2025
(This article belongs to the Special Issue Advances in Thermal Hydraulics of Nuclear Power Plants)

Abstract

The two-phase flow within a Boiling Water Reactor steam separator is investigated using an interface capturing method. The simulations are focused on resolving the flow around the first pickoff ring which is the highest contributor to steam carryunder phenomenon. Multiple simulations are conducted of varying levels of resolution to evaluate the capabilities of interface capturing technique for this challenging problem. First, high-resolution simulations of the flow using a simplified 30 ° wedge are conducted without a swirling velocity field present in the actual system. In order to understand the flow field generated by the separator swirler, secondary simulations of single-phase flow passing through a swirler model are conducted. Using this information, a coarse simulation of the full 360 ° model was performed, which incorporated the effect of the swirler using a custom inflow boundary condition. Instantaneous carryunder/carryover along with void fraction and film thickness are evaluated at the pickoff ring entrance. Overall, these simulations demonstrate that interface capturing simulations can be an accurate tool for studying full-scale components within nuclear power plants.

1. Introduction

Boiling Water Reactors (BWRs) utilize a series of fixed mechanisms which remove moisture from the steam produced in the reactor core. These are made up of two main components—the steam separator and steam dryer assemblies [1]. A simplified design of a steam separator is shown in Figure 1. The steam-water mixture that exits the core is first split into multiple steam separator standpipes. These standpipes allow the fluid to establish an annular flow, which then encounters a mixing vane or swirler. The swirler imparts a centrifugal force that pushes any entrained liquid droplets to the sidewalls of the separator. Above the swirler, the flow encounters three pickoff rings (PORs) which draw out the liquid film on the sidewalls and direct it back down to the lower plenum.
The best steam separator must optimize three competing quantities of interest: steam carryunder, liquid carryover, and pressure drop. Carryunder describes the steam which enters the pickoff rings and is captured by the liquid water in the lower plenum. This decreases the subcooling of the core inlet flow and contributes to a reduction in the natural circulation head. Carryover refers to the net amount of liquid mass that is able to bypass the moisture removal systems and reach the steam turbines. This would enhance turbine corrosion. Finally, a smaller pressure drop is always desirable since that reduces the power needed for pumps or the chimney height required for appropriate natural circulation.
Studying steam separators at BWR conditions is expensive and difficult due to the high system pressure. Measurements would likely be limited to coarse, system-level quantities, which do not provide two-phase flow details useful in physics-based modeling of this phenomenon. In recent years, multiple downscaled experiments using air and water have been conducted. In [2], Kataoka et al. measured the net carryover/carryunder, pressure drop, film thickness, and droplet entrainment in a 1/5th scale separator with a single pickoff ring. Katono et al. in [3] measured carryover and pressure loss in a 1/2 scale model with three pickoff rings. Funahashi in [4] measured the film thickness, pressure distribution, and carryover in a 1/5th scale separator with three pickoff rings. In [5], Funahashi measured the friction factors associated with swirling annular flow—demonstrating that the classic Wallis correlation under-predicts the friction factor. Matsubayashi, in [6], studied the effect of swirler design in a 1/5th scale separator. These studies all use air and water at atmospheric pressure for their working fluids, which limits their applicability to BWR systems. However, Kataoka and Funahashi have demonstrated that certain BWR system-level quantities like carryover can be mimicked in air-water systems if the flow quality and centrifugal force are matched in the air-water system.
In [7], a steam separator design similar to BWR separators is studied using steam/water at inlet flow qualities up to 20% (nominal quality for their design is about 14.85%). Their total carryover and carryunder ranges from 2.5 to 20% and 0.2–0.4%, respectively. Between 10% and 20% quality, both carryunder and carryover begin to increase with increasing flow quality. However, above about 12% quality, there is no measured carryover exiting the separator itself. The carryover in this case comes from steam that has exited through one of the pickoff rings and entrained liquid on the outside of the separator. Above 12–14% quality, carryunder appears to grow linearly because of the smaller liquid film in the separator.
These experiments are useful at understanding certain qualitative characteristics of the steam separator flow and can be used to develop correlations for existing separator models. However, these correlations are still limited to the conditions and geometries used in the experiments. In order to study a wider range of conditions, simulation can be used to inform these models. To date, simulation studies of steam separators have been limited to either one-dimensional models ([8,9]) or multiphase CFD like the two-fluid model used in [3]. One-dimensional models must rely on correlations derived from experiments for accurate predictions. Multiphase CFD can model a wider range of conditions but relies on closure models for turbulence and two-phase interactions, which may not be applicable in all flow regimes or geometries. Direct numerical simulation (DNS) requires no closures or correlations and can be applied to any flow regime. By directly solving the Navier–Stokes equations, all scales of turbulent motion can be resolved. The downside of DNS is quite a steep computational cost. However, improvements in high performance computing have made it possible in recent years to study larger components using DNS.
In this work, the flow within a BWR steam separator is investigated using DNS combined with an interface capturing method (namely, the Level Set method). DNS combined with interface capturing can resolve individual bubbles and droplets in the flow without the need of additional closures or correlations. The main simulation code used here is the finite element code PHASTA, which has been used to study several single and two-phase flows relevant to nuclear engineering. Some specific examples are PWR subchannels [10,11], involute fuel channels [12], flow boiling [13], and annular flow [14].
The study of a full-scale steam separator presents a novel “challenge problem” for PHASTA. Higher Reynolds-number flows require finer computational meshes to resolve all scales of motion. This is somewhat easier in simple geometries because often periodic boundary conditions can be used to shrink the streamwise length of the domain and save on computational cost. However, when simulating a complex component like a steam separator, the domain size is restricted by the true physical geometry. Additionally, due to the model complexity, a large amount of CPU hours may be required to reach a steady state. This has limited past two-phase flow studies in PHASTA. In 2009 [15], the annular flow within a 2 cm ID (2.5 cm length) pipe ( R e 400k) was simulated for 150 ms and was not able to reach a complete steady state due to the compute limitations of the time. This model used about 60 million elements in the computational mesh. 10 years later in 2019 [11], a study of a full-scale PWR subchannel with spacer grids was conducted using different meshes between 1 and 3 billion elements. This simulation ran for 35 ms, but additional time was also used developing the turbulent flow within the system. In the present work, a mesh size of 1.6 billion elements is simulated for over 200 ms (smaller meshes are simulated for nearly 1 s). These examples are stated here to demonstrate how the increase in HPC capability over the years make DNS and interface capturing more applicable to wider ranges of problems relevant to nuclear engineering.
Several modeling assumptions were made to approach this complex two-phase flow problem in order to demonstrate the interface tracking capabilities within the capabilities of available leadership computing resources. We believe that those assumptions allowed us to demonstrate the potential of the methodology and outline future requirements to approach full-physics simulations in the future. These challenges and assumptions are described below.

2. Materials and Methods

As stated previously, the code used here is PHASTA—a DNS/LES code which models two-phase flows using the Level Set method [16]. The specific implementation of the Level Set method in PHASTA is described in [17], and the full description of the finite element implementation is found in [18,19]. In DNS mode, the incompressible Navier–Stokes equations are solved:
u = 0 ρ u t + u ρ u = P + μ u + u T + f g + f S T
f g and f S T refer the gravitational and surface tension forces, respectively. The Level Set method tracks a scalar field, ϕ , throughout the domain which defines the distance to the nearest interface. The zero Level Set or zero contour demarcates the interface location. Typically, a positive value of the level set function indicates the liquid phase, while a negative value indicates the gas phase. These features are summarized in Equation (2).
    ϕ < 0 G a s                       ϕ = 0   I n t e r f a c e             ϕ > 0   L i q u i d
The interface location is updated every timestep by solving the advection equation:
ϕ t + u ϕ = 0
Fluid properties like viscosity and density are transitioned over a finite interface thickness using a smoothed Heaviside function:
H ϕ = 0 ,     i f   ϕ < ϵ 1 2 1 + ϕ ϵ + 1 π sin π ϕ ϵ ,     i f   ϕ ϵ 1 ,     i f   ϕ > ϵ
Properties are smoothed with H :
ρ = H ρ l + 1 H ρ g μ =   H μ l + 1 H μ g
ϵ defines the interface half-thickness and varies throughout the mesh to ensure that the interface is about 3 mesh elements wide. The surface tension force is calculated using the continuum model [20]:
f s t = σ κ n
The interface curvature, κ , is easily calculated using the level set defined normal vector: κ =   n = ϕ | ϕ | . To calculate the fluid properties and surface tension correctly, the level set field must maintain its “distance-field” property. The advection equation will violate this property over time, so another operation is required to correct the Level Set field. The re-distancing equation can be solved to correct the Level Set function:
d τ = S ϕ 1 d
d is a temporary variable which takes on the value of ϕ at the end of a timestep. Equation (7) is then solved to a steady state in pseudo-time, τ .   S ϕ is a smoothed sign function which uses the Heaviside function: S ϕ = 2 H ϕ 1 . The re-distancing equation produces a slightly modified version of ϕ with the property that ϕ = 1 everywhere (satisfying the distance-field condition).
It is assumed that all fluid in the steam separator is at saturation temperature, and since no heat source is present, the energy equation does not need to be solved (the flow is adiabatic). PHASTA utilizes a generalized alpha method for time integration, which provides 2nd-order accuracy in time [21]. For two-phase flow simulations, linear shape functions are used to interpolate all variables, and 2nd-order Gauss quadrature is used to integrate the equations, which provides 2nd-order accuracy in space. Technically, the code utilizes SUPG stabilization, which adds more terms to Equations (1) and (3), but these are omitted here for clarity since they do not affect the overall physics [19]. For the simulations performed here, all meshes use unstructured tetrahedral elements.

3. Results

The results of this work are organized into three parts. The first section describes the initial high-resolution simulation of a simplified steam separator geometry. The second section describes the secondary simulation of a swirler model, which was used to obtain a better understanding of the swirling velocity profile found in steam separators. The third section incorporates the swirling velocity profile into a simulation of a full 360 ° model separator.

3.1. Simulations of a Simplified Model Geometry
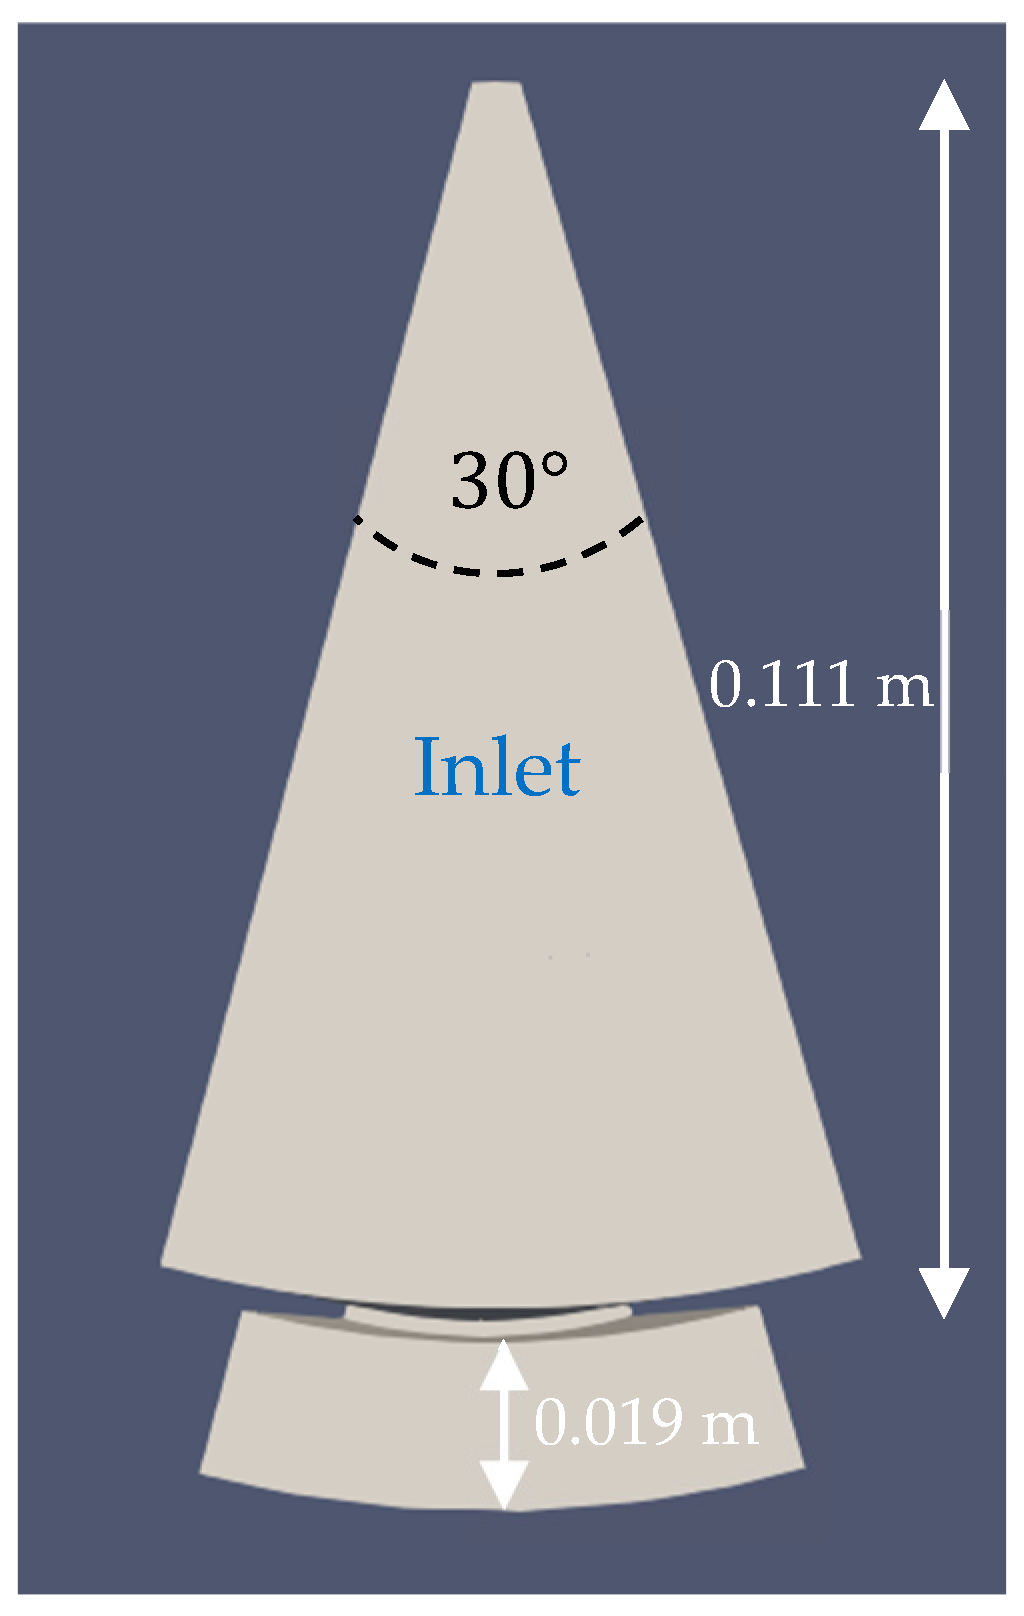
A typical steam separator radius is on the order of ~22 cm in diameter [22], and at operational conditions, the average flow velocity is around 4 m/s. At BWR pressures of 7.2 MPa, the resulting Reynolds number is around 4 million. These estimates were derived from the chimney studies in [23] by using the upper limit of the given superficial velocities to calculate the steam/water flowrates going into the steam separators. The velocity profiles described in later sections were adjusted to give superficial velocities and flow quality, which aligned with the values derived from the chimney study. The resulting average flow velocity was roughly 4 m/s. To save on computational cost, a 30 ° slice of the geometry is modeled in this section (see Figure 2 and Figure 3). This is allowable since the flow should be axisymmetric at normal conditions. However, even with this computational saving, the resolution of all scales of motion is currently intractable. Using the estimation techniques described below, the full resolution of all turbulent scales of motion would likely require a computational mesh on the order of 1 trillion elements. In this particular set of simulations, the viscosity is artificially increased to help reduce the mesh resolution requirements.
Figure 2. View of simplified geometry in the streamwise direction. Reproduced from [24].
Jne 06 00042 g002
Figure 3. Side-view of simplified geometry. Reproduced from [24]. The inner 7 mm of the model is clipped to avoid instabilities associated with modeling a fine point. We assign a symmetric boundary condition to the resulting face, which allows the flow tangential to the surface but prevents the flow normal to the surface. Figure 4 shows the typical mesh design.
Jne 06 00042 g003
The finest mesh region is placed around the pickoff ring entrance in order to resolve more of the fine-scale droplets/bubbles, which contribute to carryover/carryunder. After the pickoff ring, the mesh is coarser towards the steam outlet and pickoff ring outlet. This adds numerical diffusion, which stabilizes the simulation by preventing backflows at the outlets.
Unfortunately, the solution has a tendency to diverge even with the coarse outlet mesh. To stabilize the simulation further, the viscosity is artificially increased in the regions slightly upstream of the outlets. In the main separator pipe, this elevated viscosity region starts about halfway between the pickoff ring and steam outlet. Similarly, about half of the pickoff ring section also has an elevated viscosity. Qualitatively, this technique does not appear to have an effect on the upstream flow. This was tested by turning off the viscosity override temporarily after a steady flow was achieved. Visually, there was no apparent change in the upstream flow behavior. However, this is a crude method of stabilization. In the future, alternative outlet stabilization techniques will be investigated.

3.1.1. Boundary Conditions and Mesh Design

The flow is driven by specifying a fixed velocity field on the inlet plane. The streamwise velocity field is shown in Figure 5.
The liquid film thickness at the inlet is set to 12 mm. The velocity profile and film thickness were adjusted to create flow quality and superficial velocities that roughly aligned with the flow exiting the chimney in the BWRX-300 design [23]. This resulted in the use of a very large steam superficial velocity. In order to model the swirling flow, periodic boundary conditions are needed on the angled faces of the geometry. For those simulations, simplified models were used with symmetric conditions. Without the swirler, there is no centrifugal force present to push the liquid towards the wall, so high liquid entrainment is expected. The effect of the swirler is studied in the next section. The outlets both use a natural pressure boundary condition of 0. Note that, in true BWR conditions, the reactor water level is somewhere above the first POR outlet. This creates hydrostatic pressure at the POR outlet, which helps reduce carryunder but can increase carryover if it is too high. By setting the POR outlet pressure to 0, we are effectively modeling a situation where the water level is at or below the POR outlet. All other faces are set as no-slip walls.
Table 1 summarizes the relevant fluid and flow properties of the simulation. The densities and surface tension coefficient are nearly the same as the values found at BWR pressures (7.2 MPa). The viscosities were chosen to be roughly 25× higher than the true values at these conditions. The decision to elevate the viscosities was based on an estimate of the Δ y + (the dimensionless node spacing in the wall-normal direction) value:
Δ y + = Δ y ν τ ρ
For direct numerical simulation, it is usually necessary to have Δ y + < 1 at the wall and 12 in bulk flow region. This typically allows DNS to resolve all scales of motion and replicate experimental results for single-phase flow [25]. The wall shear for annular flows can be estimated from the classic Wallis correlation [26]:
τ w = 1 2 ρ l f w V l 2 , f w = 0.079 R e l 0.25
V l and R e l are the phase-averaged liquid-phase velocity and film Reynolds number, respectively. Using the values from Table 1, this estimates that a wall element size of 0.02 mm is necessary for a dimensionless wall distance of y + = 1 at the first node off the wall. The finest mesh used here has an element size of 0.15 mm at the wall, which leads to a y + 7.5. This yields a total mesh size of 1.6 billion elements. After the simulation was run, the y + was measured to be about 3. It is impressive that the simple Wallis correlation does a pretty good job at predicting y + . Upstream of the pickoff ring, the elements are 2× larger, which would mean the upstream y + 6 . Since our y + is above 1 at the wall, the fine mesh simulation does not strictly meet the requirements for a true DNS.
The level set method imposes its own set of mesh requirements that are potentially more important than resolving all scales of motion. Previous studies have shown that at least 20 elements across a bubble diameter are needed to resolve the velocity field within a bubble [10]. This would mean that the smallest bubble that this simulation could resolve is 3 mm. Entities smaller than this would likely lose mass and eventually disappear due to the mass loss problem associated with the level set method [27,28]. Entrainment in steam separators creates many droplets that are on the order of micrometers in size [2]. So, even with a high degree of turbulence resolution, the mesh will still not capture all bubbles/droplets and can lose fluid mass over time.
In this particular study, three separate meshes of increasing refinement were utilized. These are summarized in Table 2.
The “intermediate” and “fine” meshes are generated from uniform refinements of the initial coarse mesh. Each refinement increases the number of elements by 8× but only increases the resolution by 2×. Since a CFL controller is used to maintain the same CFL number between each case, this adds another 2× factor to the runtime for each refinement. So, at a minimum, each refinement will incur a 16× higher cost in terms of CPU hours. The Perlmutter supercomputer at NERSC was used to run these simulations. The intermediate case actually demonstrated a 19.4× increase in runtime relative to the coarse case. If the fine mesh case had run for 0.9 s like the others, it would have demonstrated a 10× increase in run-time relative to the intermediate case. As noted in the table, the number of elements per core was not kept constant at higher refinement. This may be the cause of the unusual runtime increase between each case. The finest case took many more core hours to run; therefore, a shorter dataset was obtained for this case due to limited computing resource allocation.
The simulation is initialized with a flat liquid film that fills the pickoff ring region. This is stable for a considerable amount of time, and the flow is quite laminar during this period. Eventually, the large liquid film slows down due to its weight and begins to fall back down. The flow then develops into a churn-like regime. A significant “burn-in” time is required to get through this pseudo-stable laminar flow regime. To save compute, the Coarse case is simulated first through this burn-in period (≈0.72 s of simulated time). Then, the state of the simulation is transferred to the Intermediate and Fine mesh cases at the start of the churn flow. This is accomplished with the partitioning tool Chef, which is a part of the PUMI software stack [29]. All three cases are then continued from this point in time to test the mesh convergence. Note that the core hour count does not include the burn-in period.

3.1.2. Results

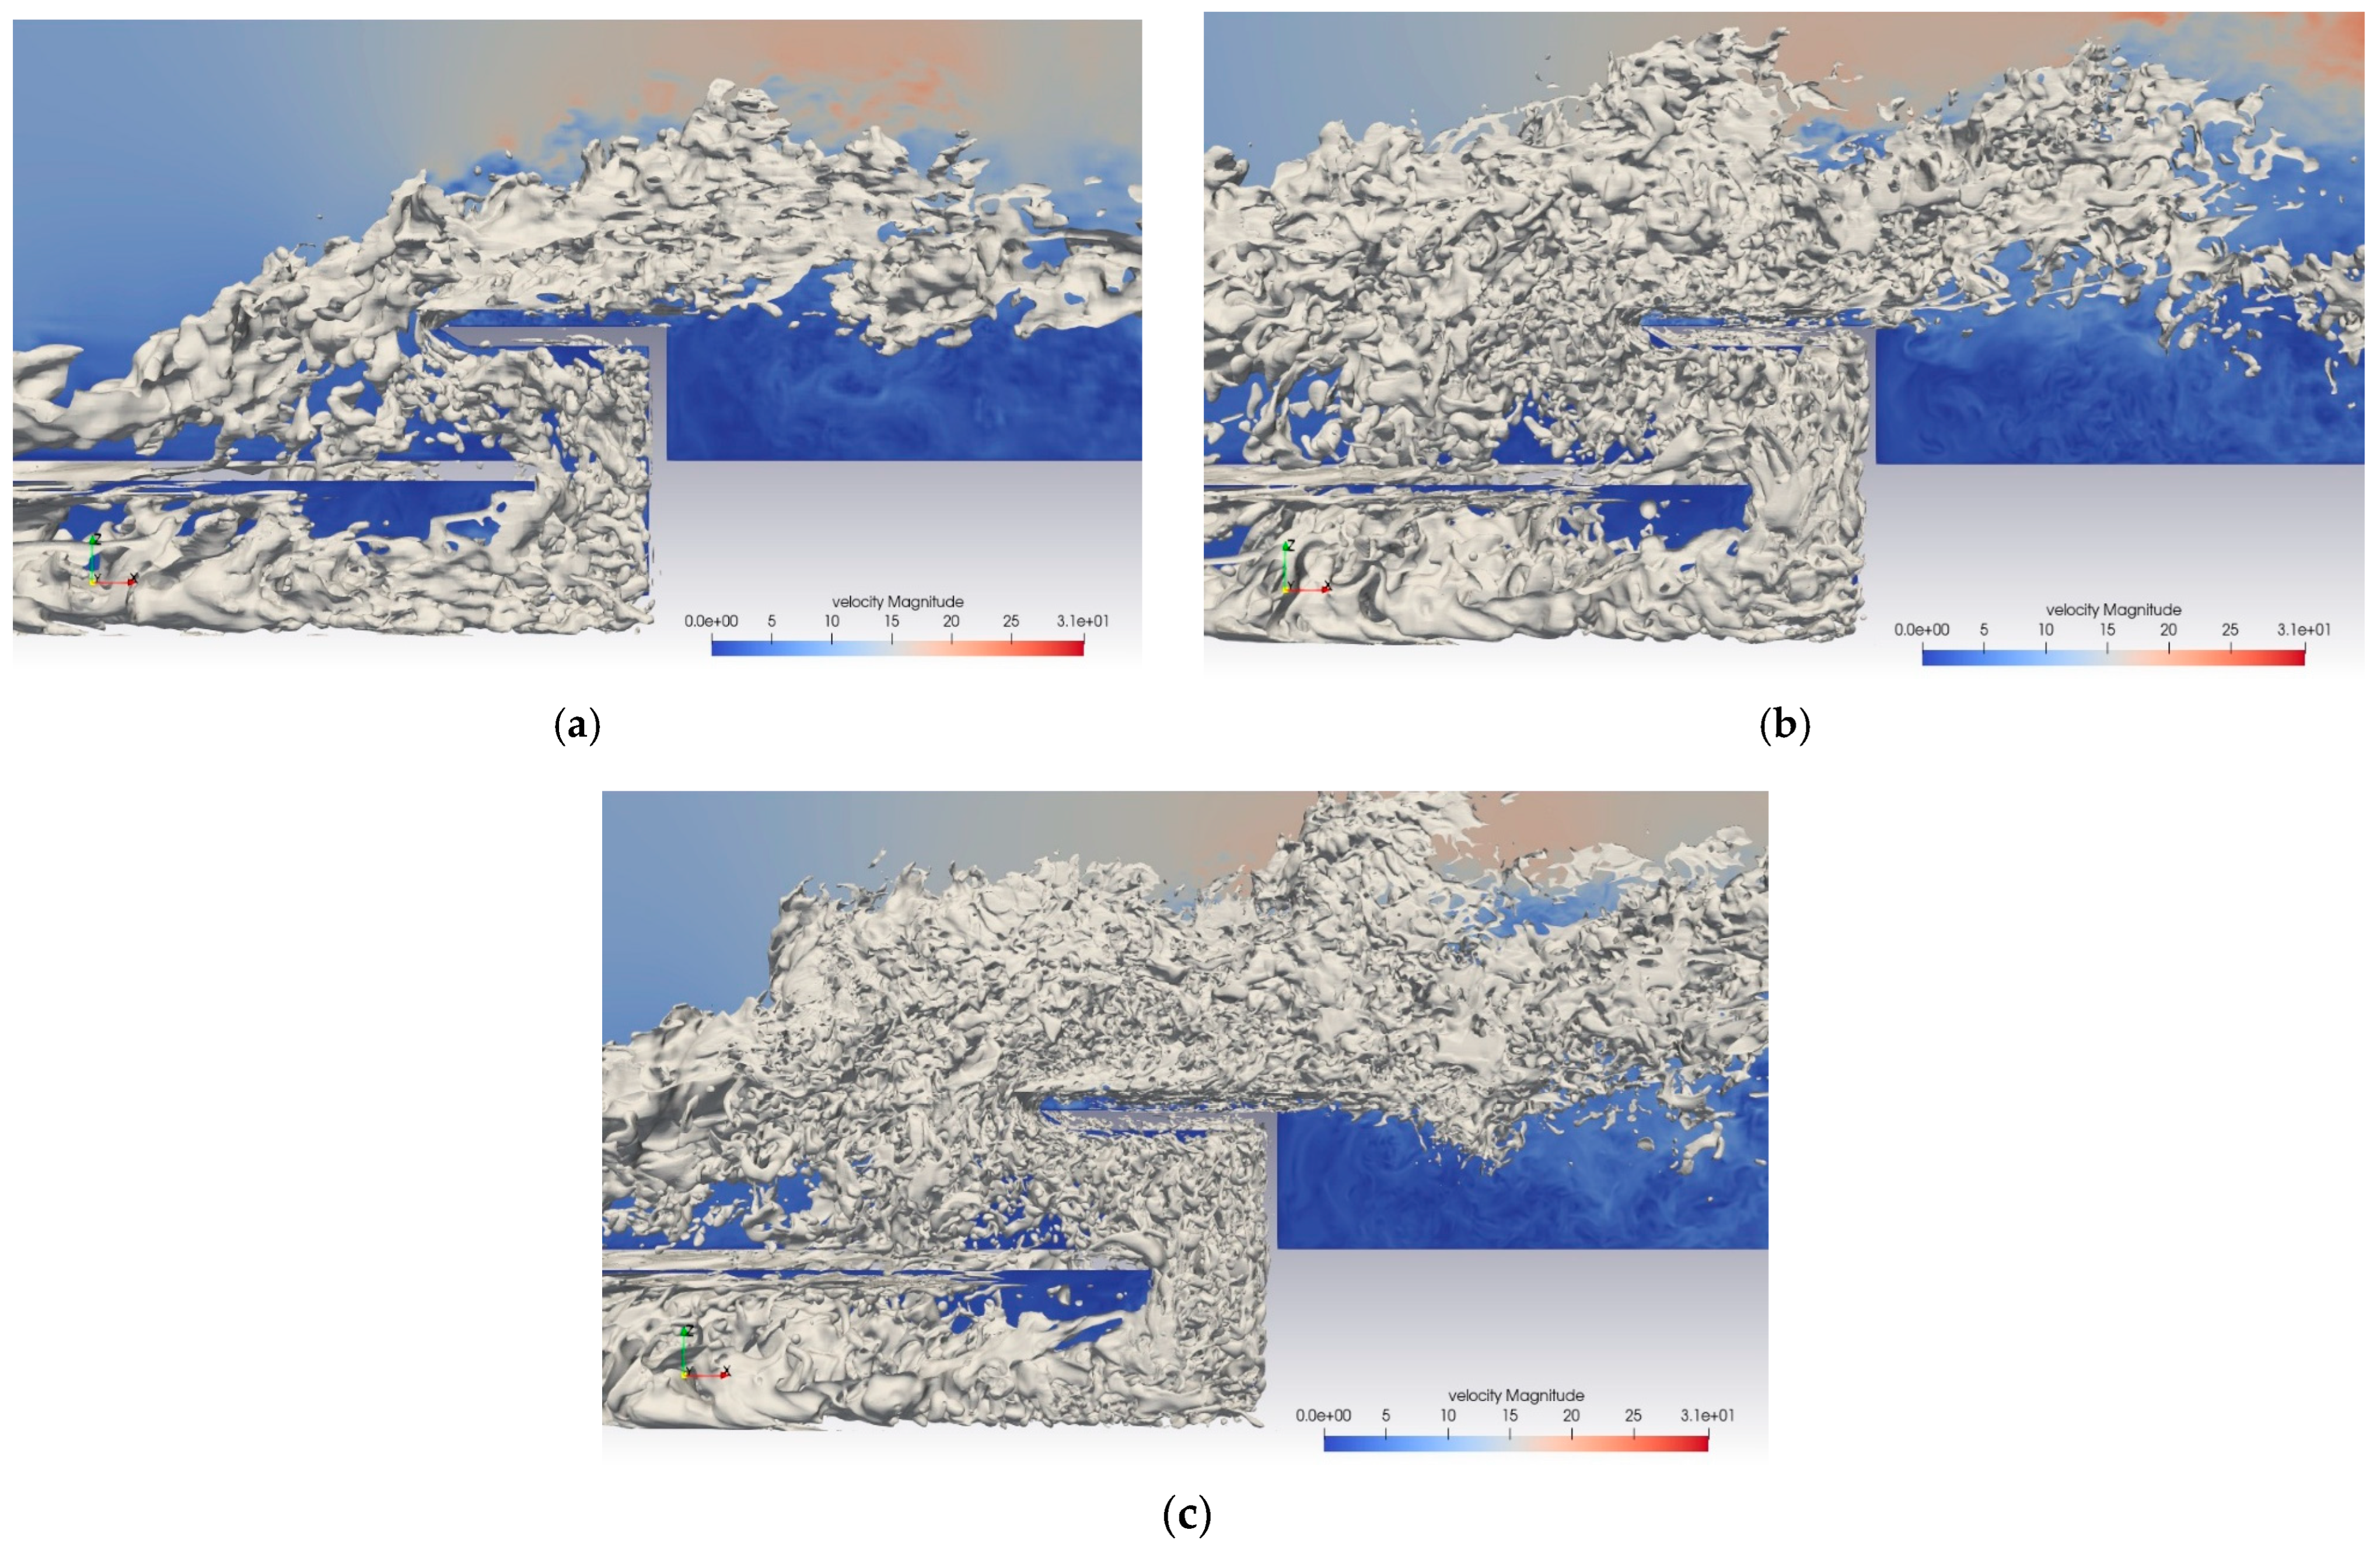
Analysis of the resulting data is performed with ParaView [30]. To visualize the flow, a slice is made along the streamwise direction, which displays the velocity magnitude. The steam-water interface is depicted as a gray 3D contour. Figure 6 illustrates the flow in the three different meshes when a large liquid wave is passing over the pickoff ring.
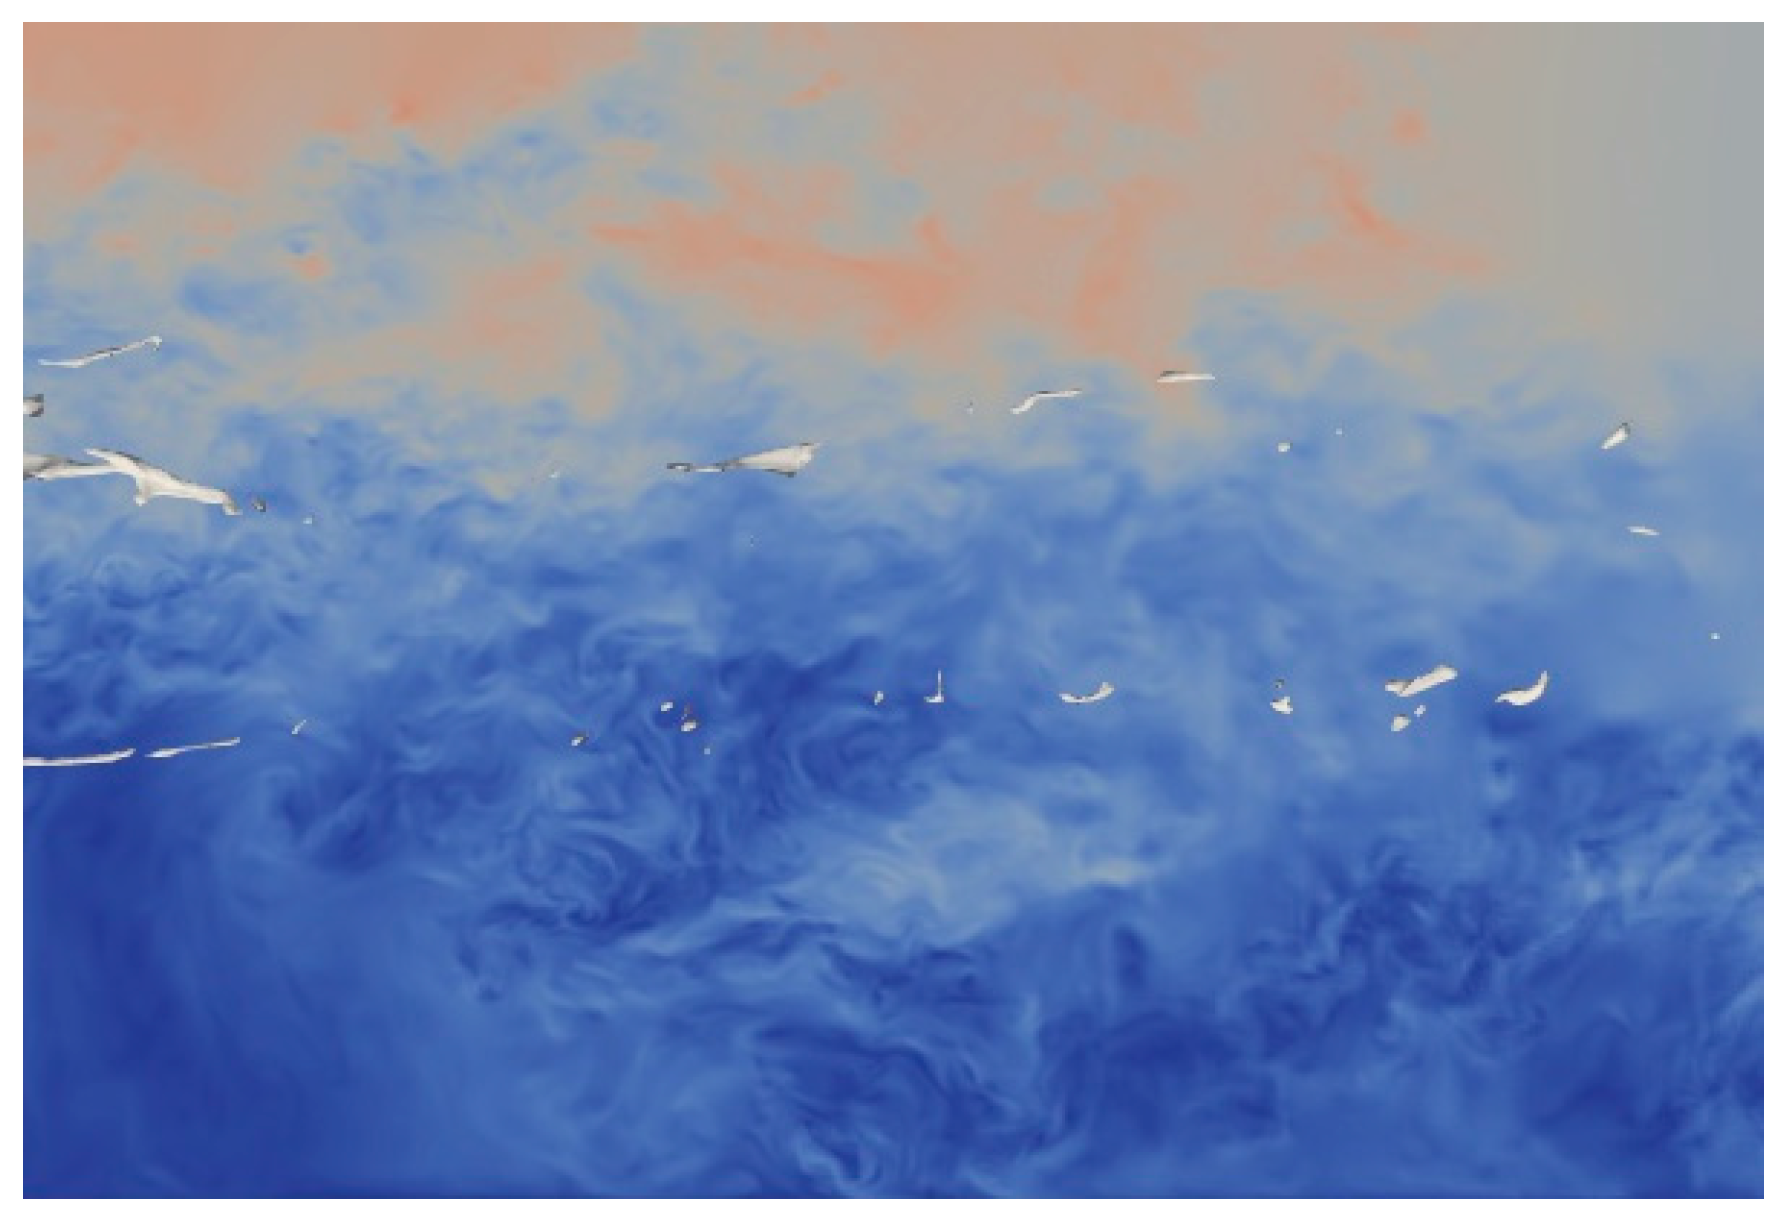
As expected, with a finer mesh, more and more small-scale droplets can be seen in the flow. Figure 7 shows a view that focuses only on the velocity field slightly past the pickoff ring. Qualitatively, the flow looks very well resolved, with many small eddies being captured. The flow is also very chaotic. Most of the time, there is a steady stream of a small number of entrained droplets, which bypass the pickoff ring. However, periodically a large disturbance wave will generate a massive amount of entrained liquid that bypasses the pickoff ring. The two situations are illustrated in Figure 8.
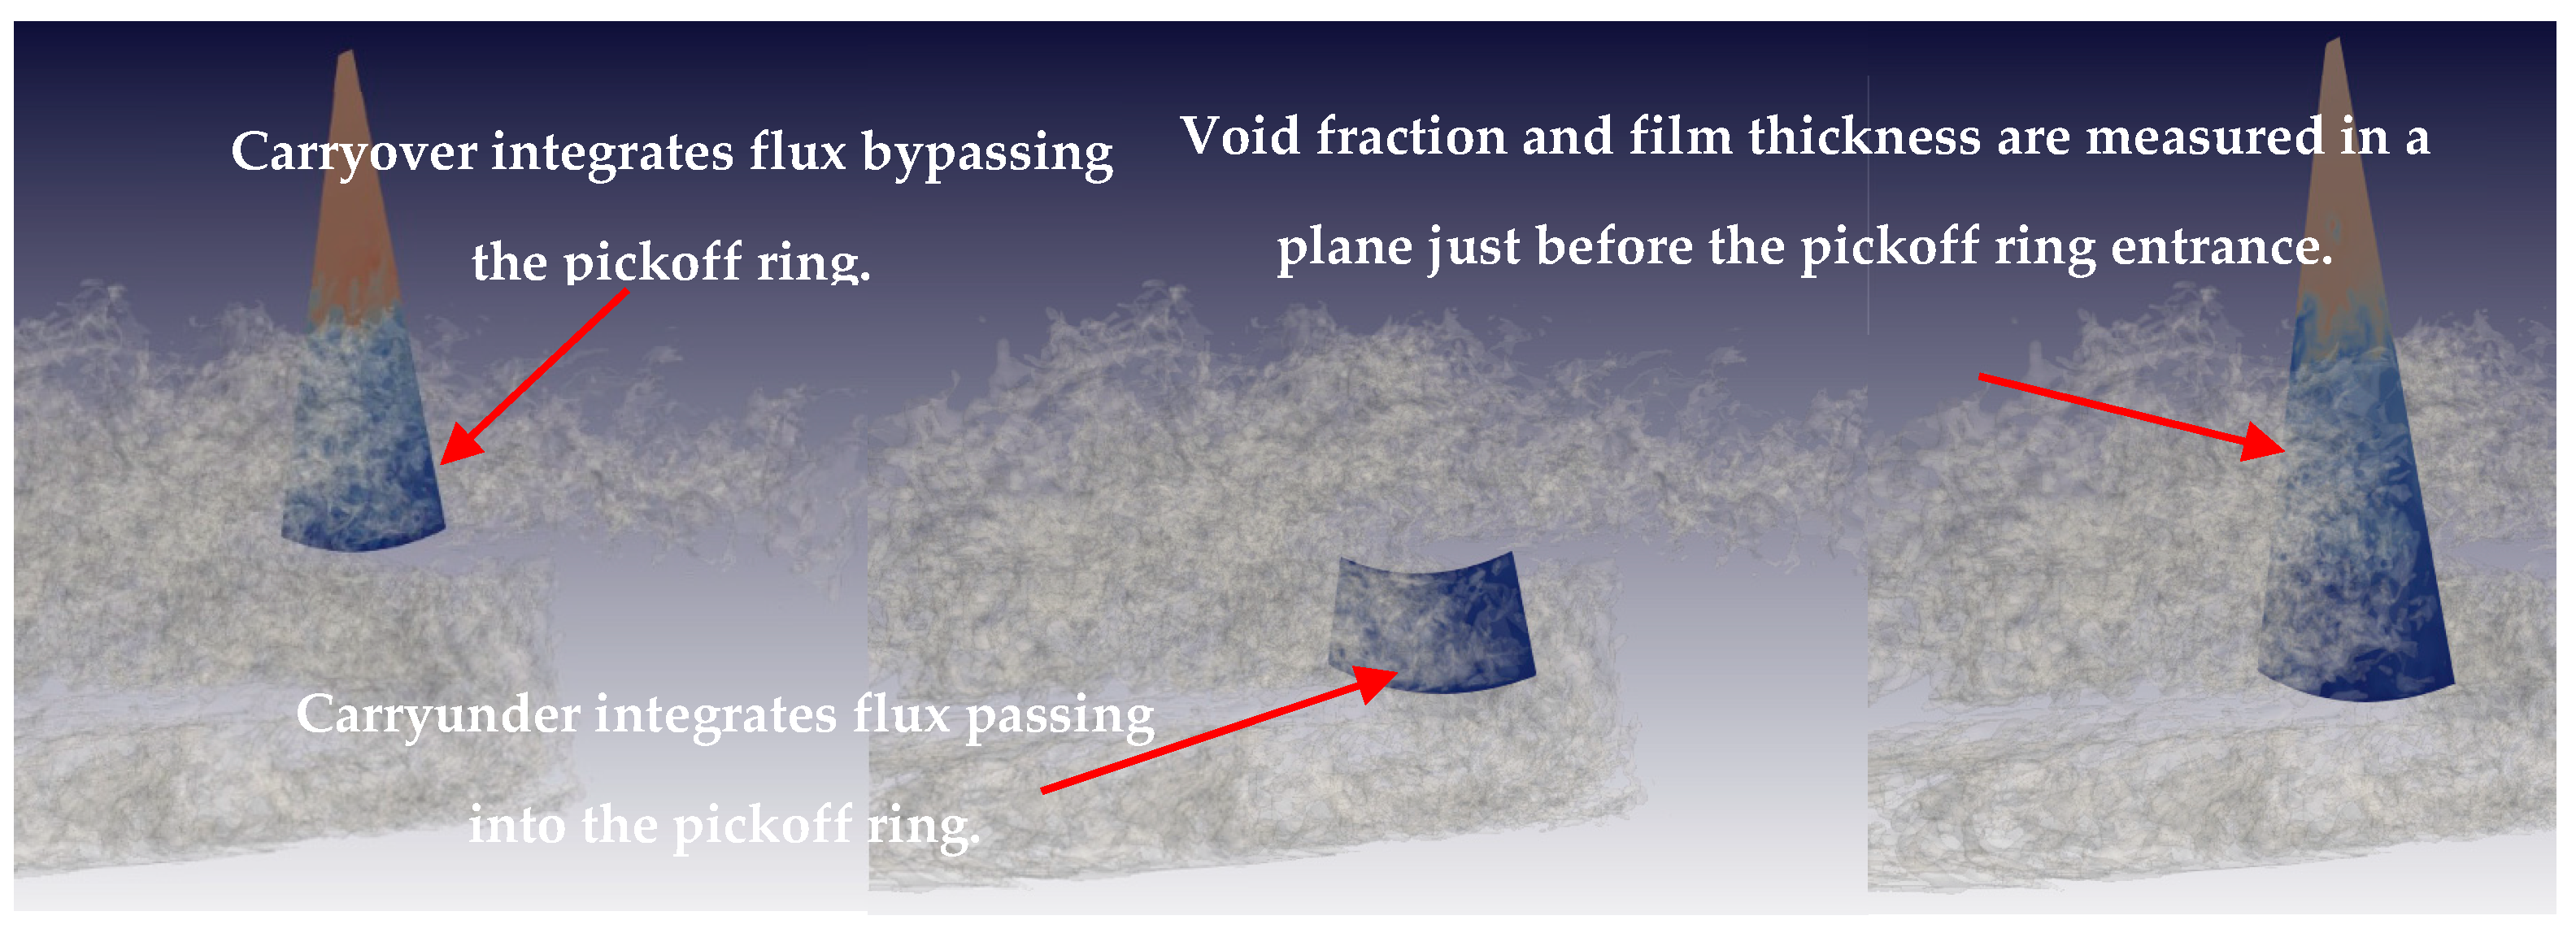
Figure 9 illustrates how and where the measurements of macroscopic quantities are performed. The mass flow rates of individual phases are measured by integrating the flow through different slices. Carryover ( C O ) and carryunder ( C U ) are defined by
C O = w l w l + w g ,     C U = w g w l + w g
Technically, carryover is the combined result of all liquid flow that bypasses the steam separator and dryer. A more apt name for the quantity measured here would be “First-stage carryover,” since it measures only the carryover around the first pickoff ring. The term “carryunder” is accurate since most of the carried under steam comes from the first pickoff ring. This is because the first pickoff ring outlet is located below the RPV water level. Higher pickoff rings discharge into the steam filled region above the water level. Film thickness is a difficult quantity to measure using unstructured mesh data. Here, we use a simple approach by recording the first interface location off the wall as the “film thickness.”
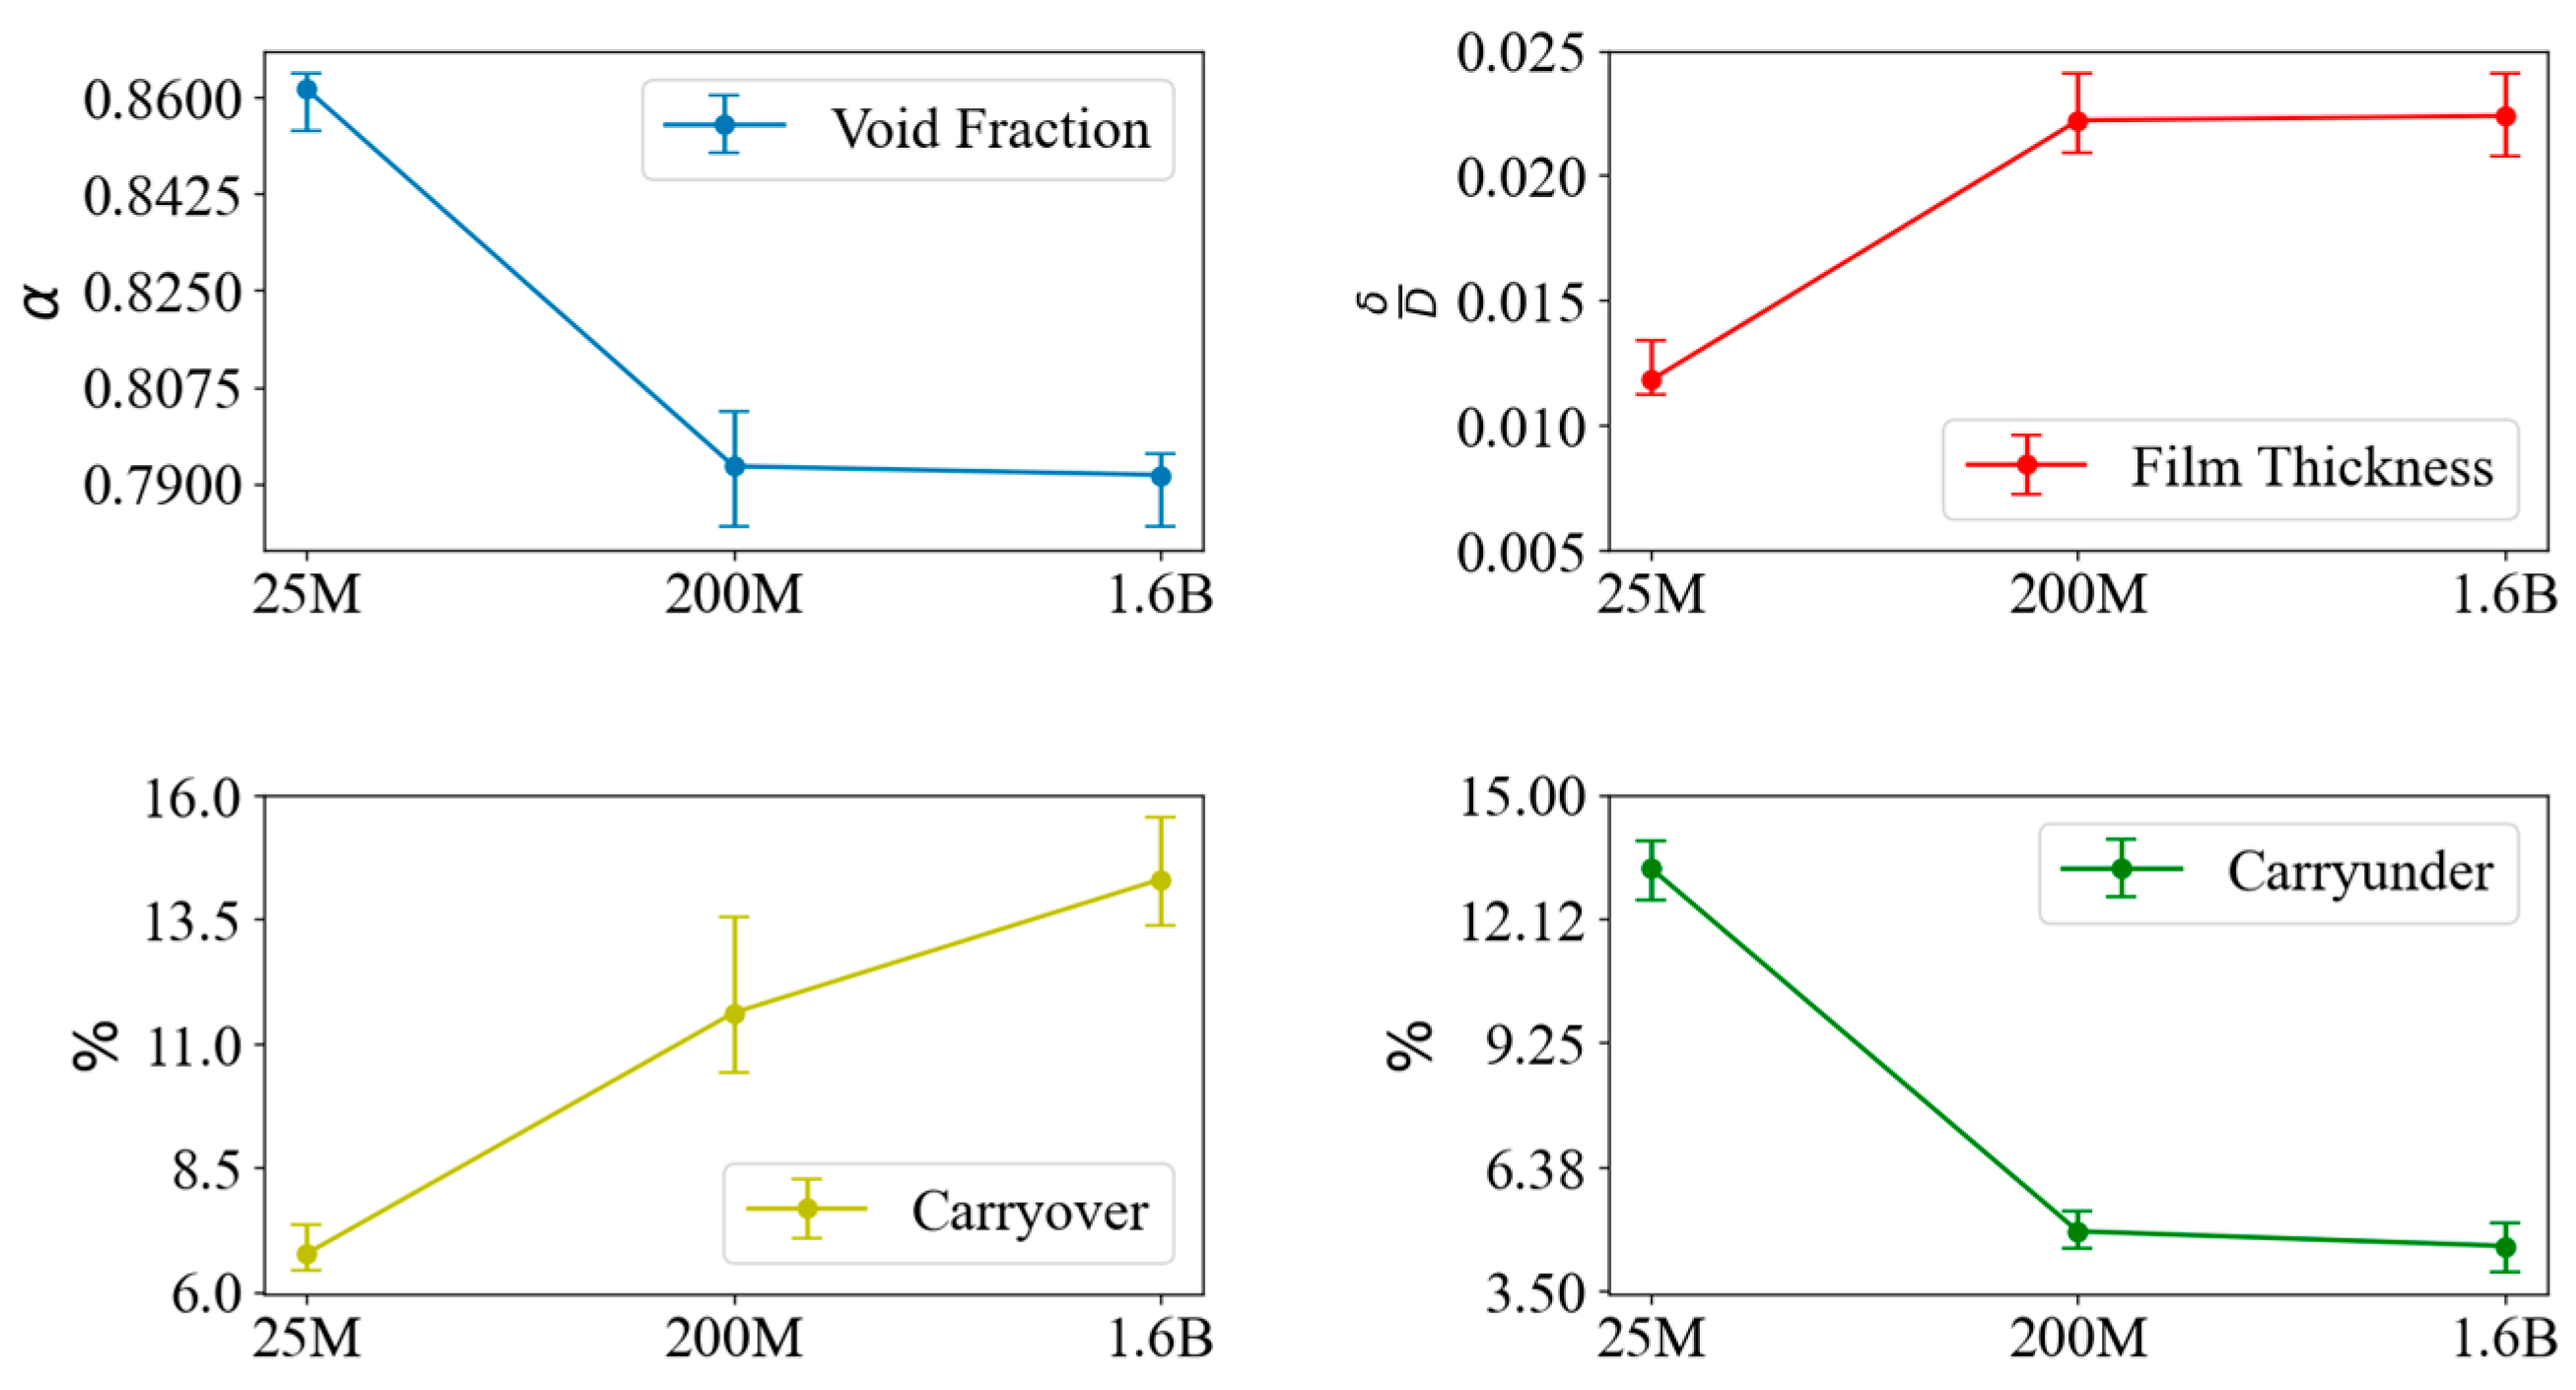
The carryover, carryunder, void fraction, and film thickness are time-averaged using the data collected at the various slices. Due to the chaotic nature of the flow, the resulting average can vary significantly depending on where the averaging begins. To capture some of this uncertainty, several averages are taken using random starting points. The maximum and minimum of each quantity of interest (QOI) is then plotted as an error bar (Figure 10). To emphasize: the error bars are not the result of any sensitivity analysis; they only capture the uncertainty associated with where time averaging begins.
For most quantities, the results appear to converge nicely with higher mesh refinement. The one exception is the carryover. This is more obvious if the grid convergence index (GCI) [31] is calculated for each quantity (Table 3). The GCI is a measure of the uncertainty associated with the mesh discretization error. For most quantities, this uncertainty is less than 1%—but for carryover, it is nearly 30%. The large uncertainty in carryover may be due to the lack of data in the fine mesh case. The carryover region is also filled with mostly small liquid droplets, whose mass quickly drops due to the Level Set mass loss issues mentioned previously. This could potentially lead to the nonconvergent behavior seen here.

3.1.3. Discussion

The results from simplified model geometry have mixed success. The relative film thickness at the finest mesh level agrees well with experimental data for air/water tests [4]. The converged void fraction measured at the POR agrees well with the inlet value, meaning that mass is at least being conserved up to the POR entrance. The carryover and carryunder on the other hand are quite large. However, it is difficult to make significant claims since there is little data studying steam-water separators at these high qualities.
The biggest source of error in this simulation is likely the lack of a swirling flow. The swirl has a major effect on the stability of the liquid film and, therefore, droplet entrainment. The lack of a turbulent inlet would also change the result, but since the flow does develop turbulence naturally, this may be a second-order effect compared to the lack of swirl. One promising result from this set of simulations was that the macroscopic quantities were mostly converged using the intermediate mesh of 200 million elements. This suggests that it is not necessary to resolve all turbulent scales of motion to obtain a good estimate for engineering-relevant quantities.

3.2. Simulations of a Swirler Geometry

In order to understand the velocity profile generated by the separator swirler, a secondary simulation of a swirler geometry was performed. Due to the lack of necessary symmetry in a typical swirler, it is not possible to place the swirler directly in the 30 ° model shown previously. Also, the accurate modeling of the flow around the swirler might increase the mesh size to prohibitive levels. Instead, a separate single-phase flow simulation of the swirler was conducted. The heavier liquid film at the walls is not expected to obtain a significant circumferential velocity component due to its higher density. The lighter steam core, on the other hand, would gain a high circumferential velocity, which causes any entrained droplets to be pushed into the liquid film. Therefore, for this simulation only steam is modeled.

3.2.1. Boundary Conditions and Mesh Design

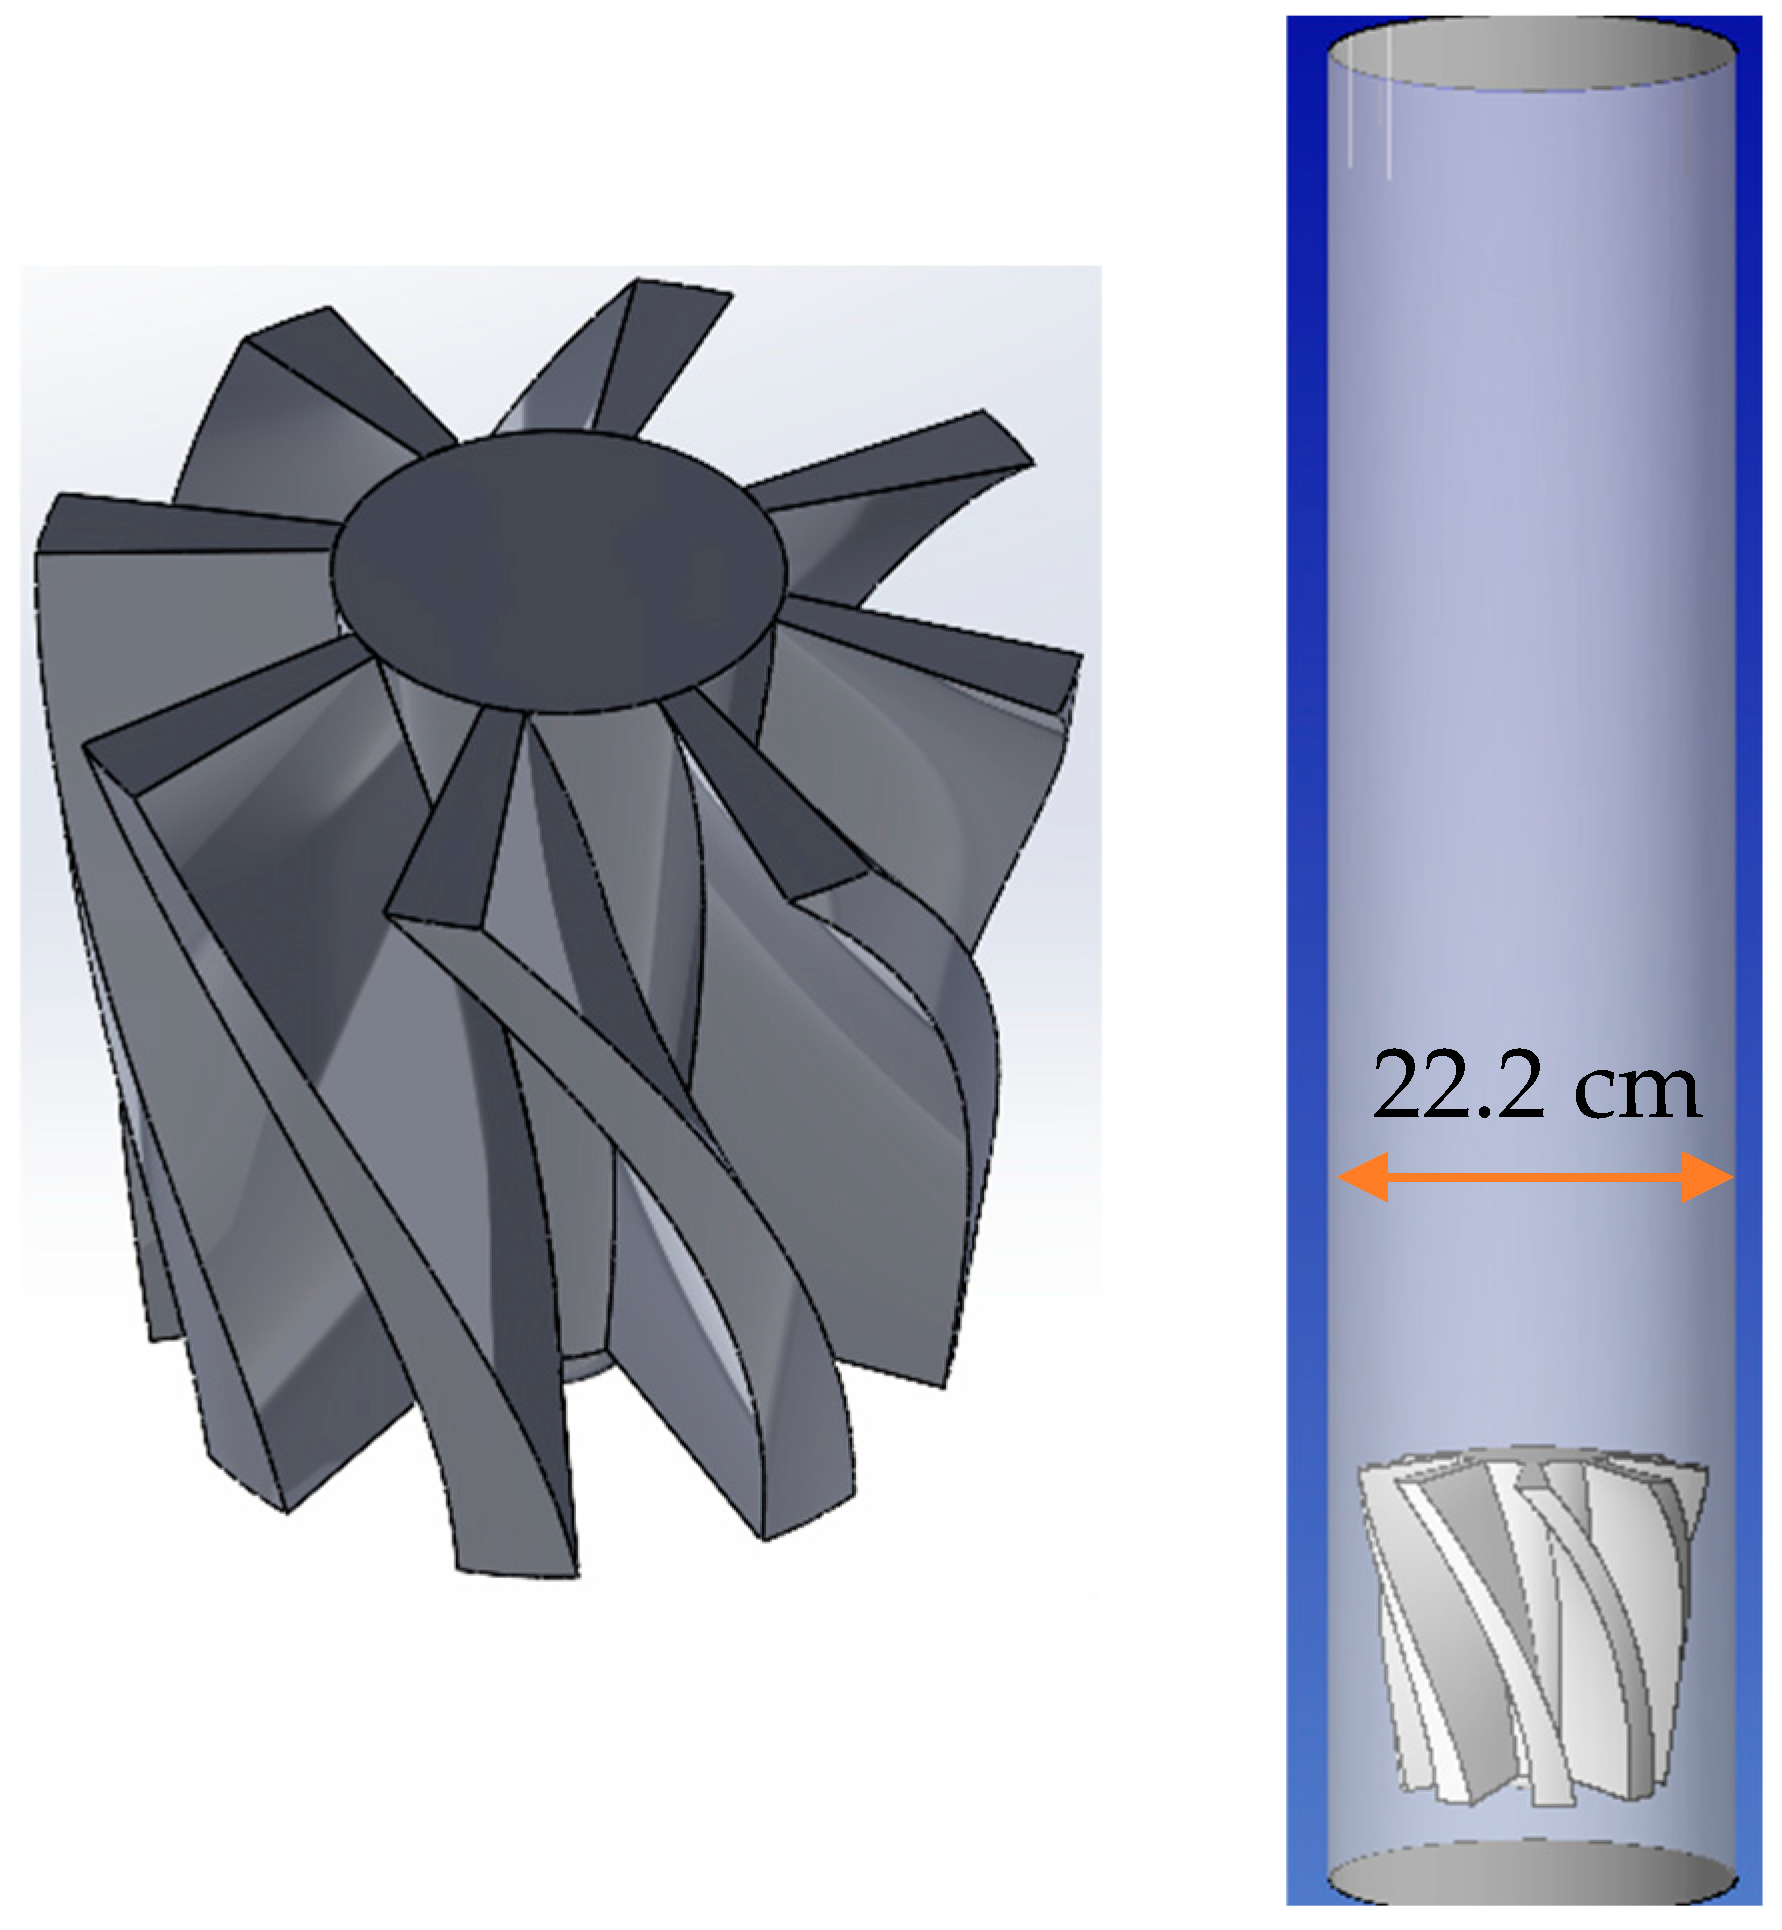
Figure 11 shows the model of swirler along with the domain used to simulate the flow.
The general shape and dimensions of the swirler were derived from [22] but scaled up to fit the size of the separator diameter simulated in the previous section. A uniform streamwise velocity of 3.75 m/s is assigned to the inlet of the geometry, which corresponds to a volumetric flow of 0.145 m3/s. Other properties are listed in Table 4. The outlet is a natural pressure condition. All other faces are no-slip BCs. A more realistic option may be to use some form of a slip BC at the pipe walls to replicate the effect of the liquid film on the steam phase. The pipe diameter could also be reduced by the film thickness—effectively treating the liquid film as the pipe “wall.” However, this was not considered or used here. Figure 12 shows the mesh design. Like the previous simulations, the mesh is finest around the region of interest (the swirler) and is made coarser towards the outlet. The smallest element size is 2.55 mm, which is quite coarse but still creates a mesh of 5.43 million elements because the full pipe circumference is being modeled here.
For this simulation, the goal was to gain a better understanding of the average velocity profile, not full resolution of all turbulence. It also serves as a way of generating data for turbulent velocity inlet BC. This is described in greater detail later.

3.2.2. Results

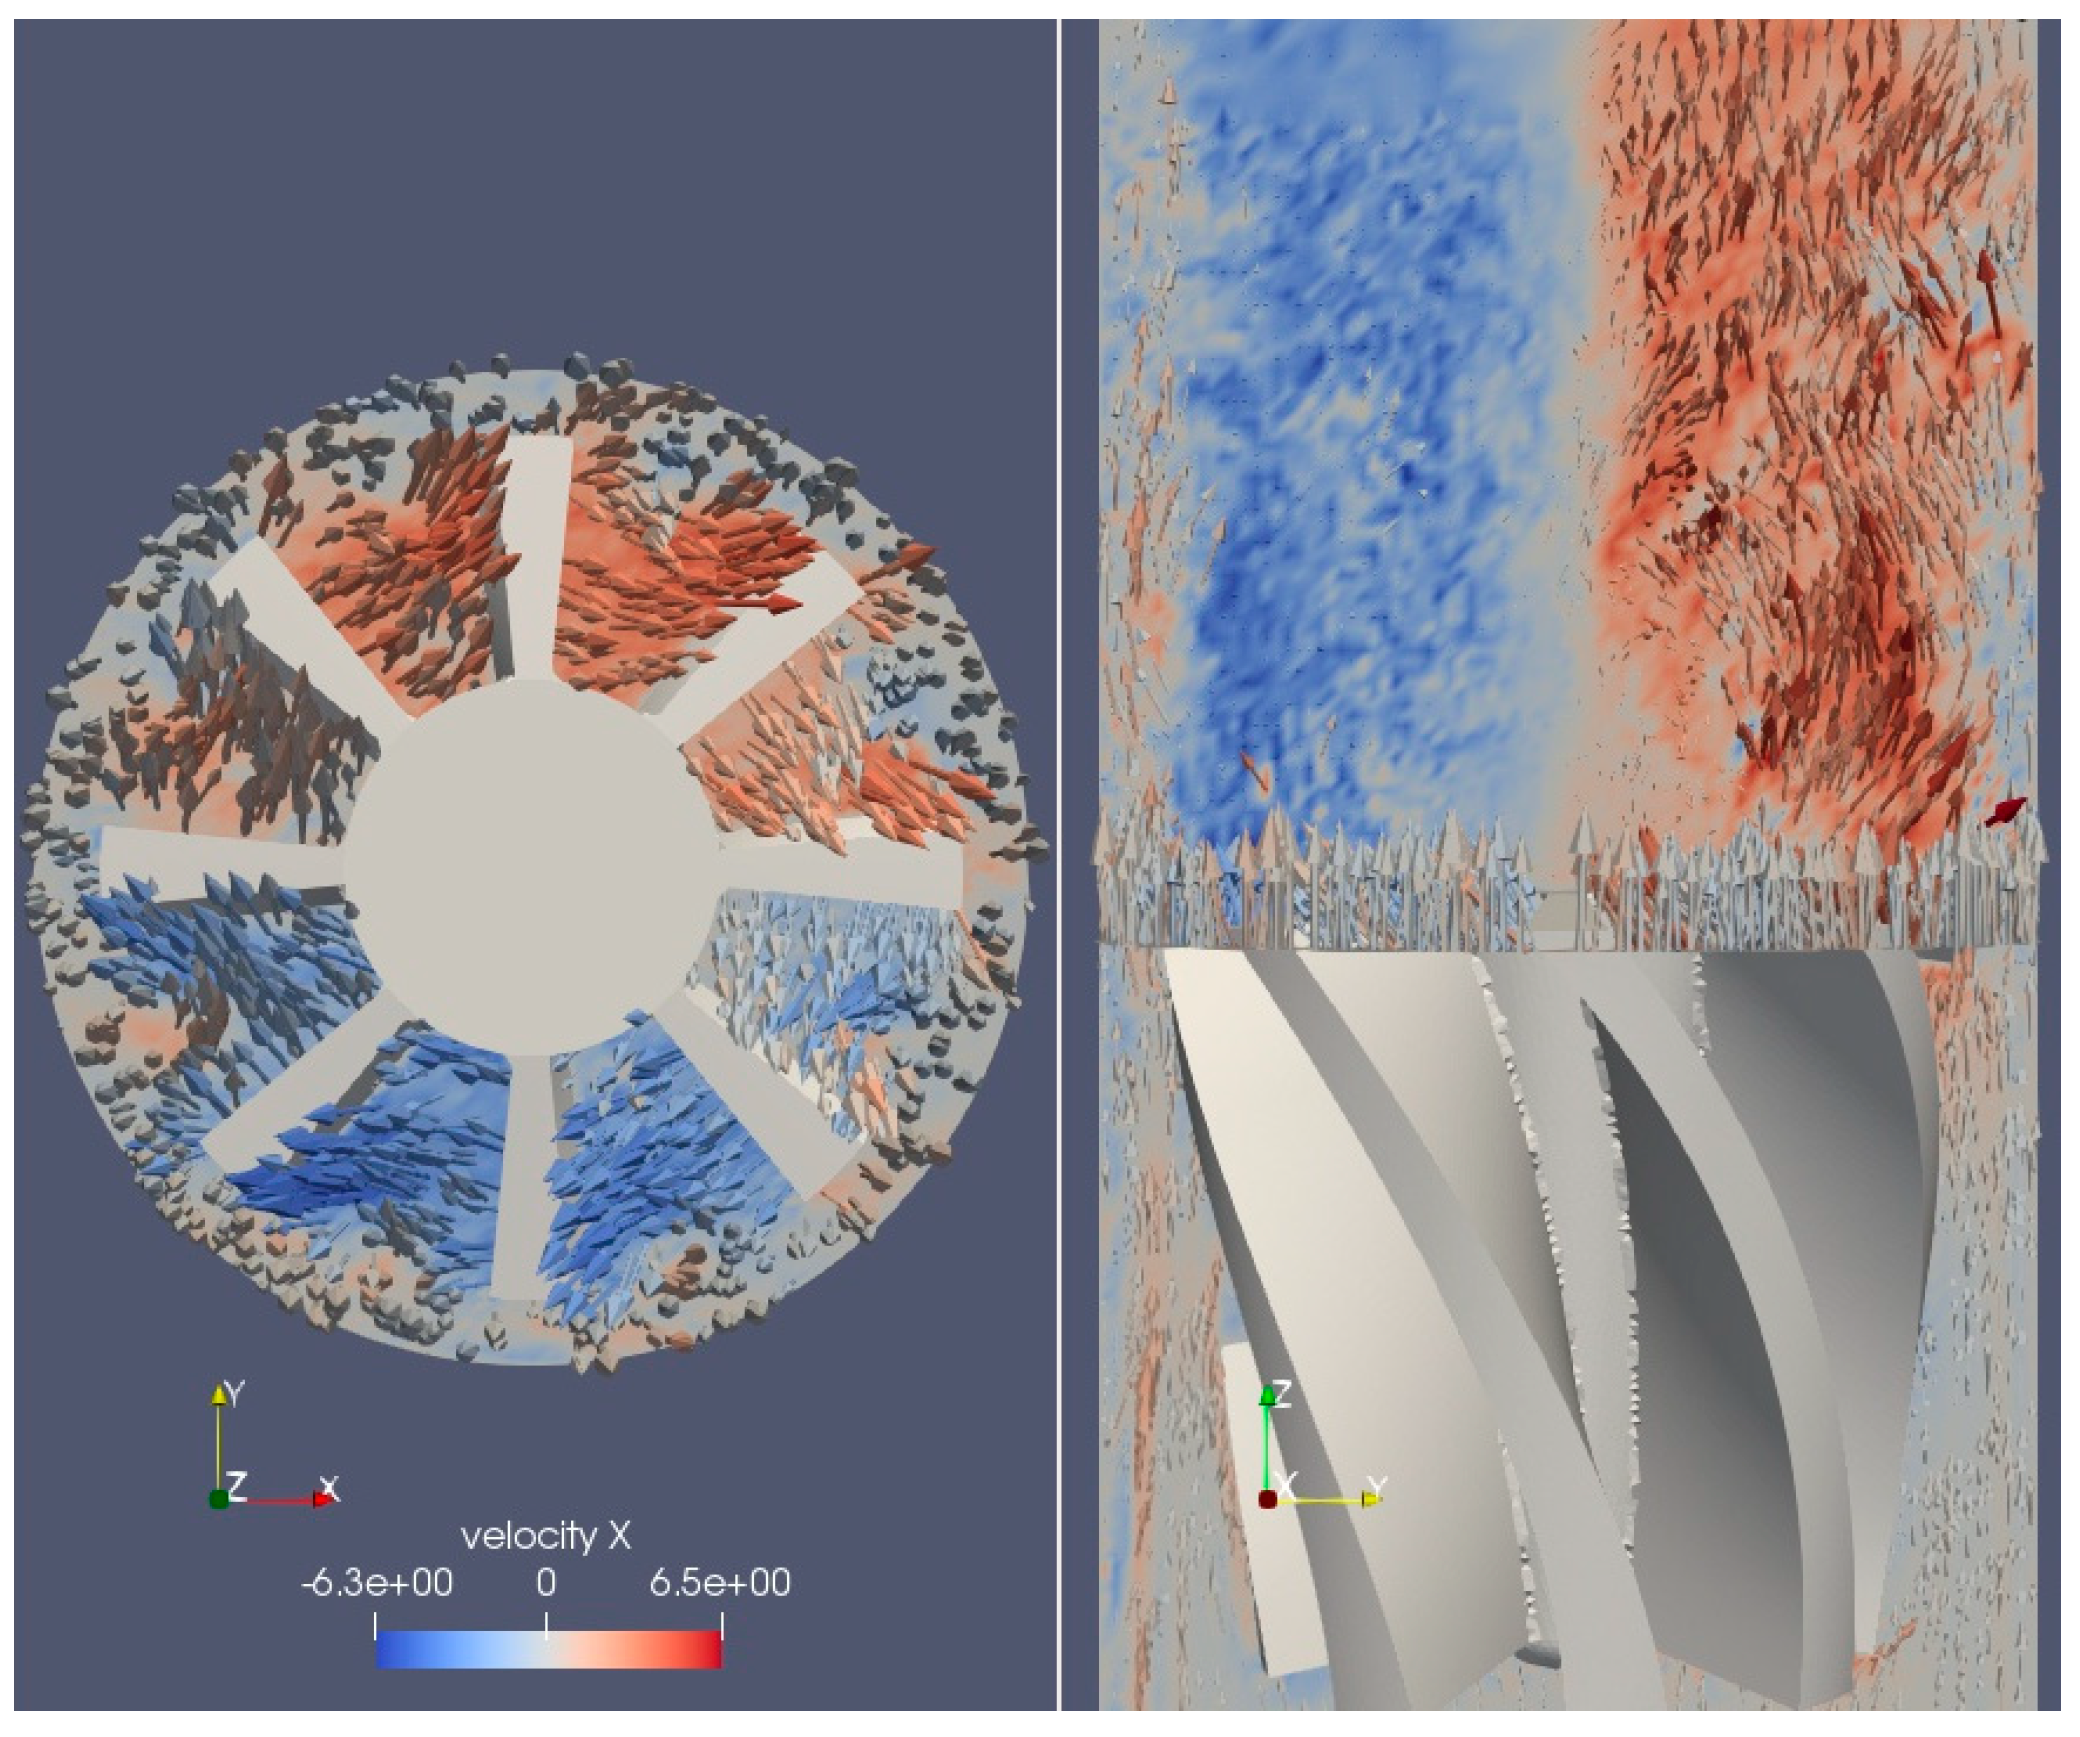
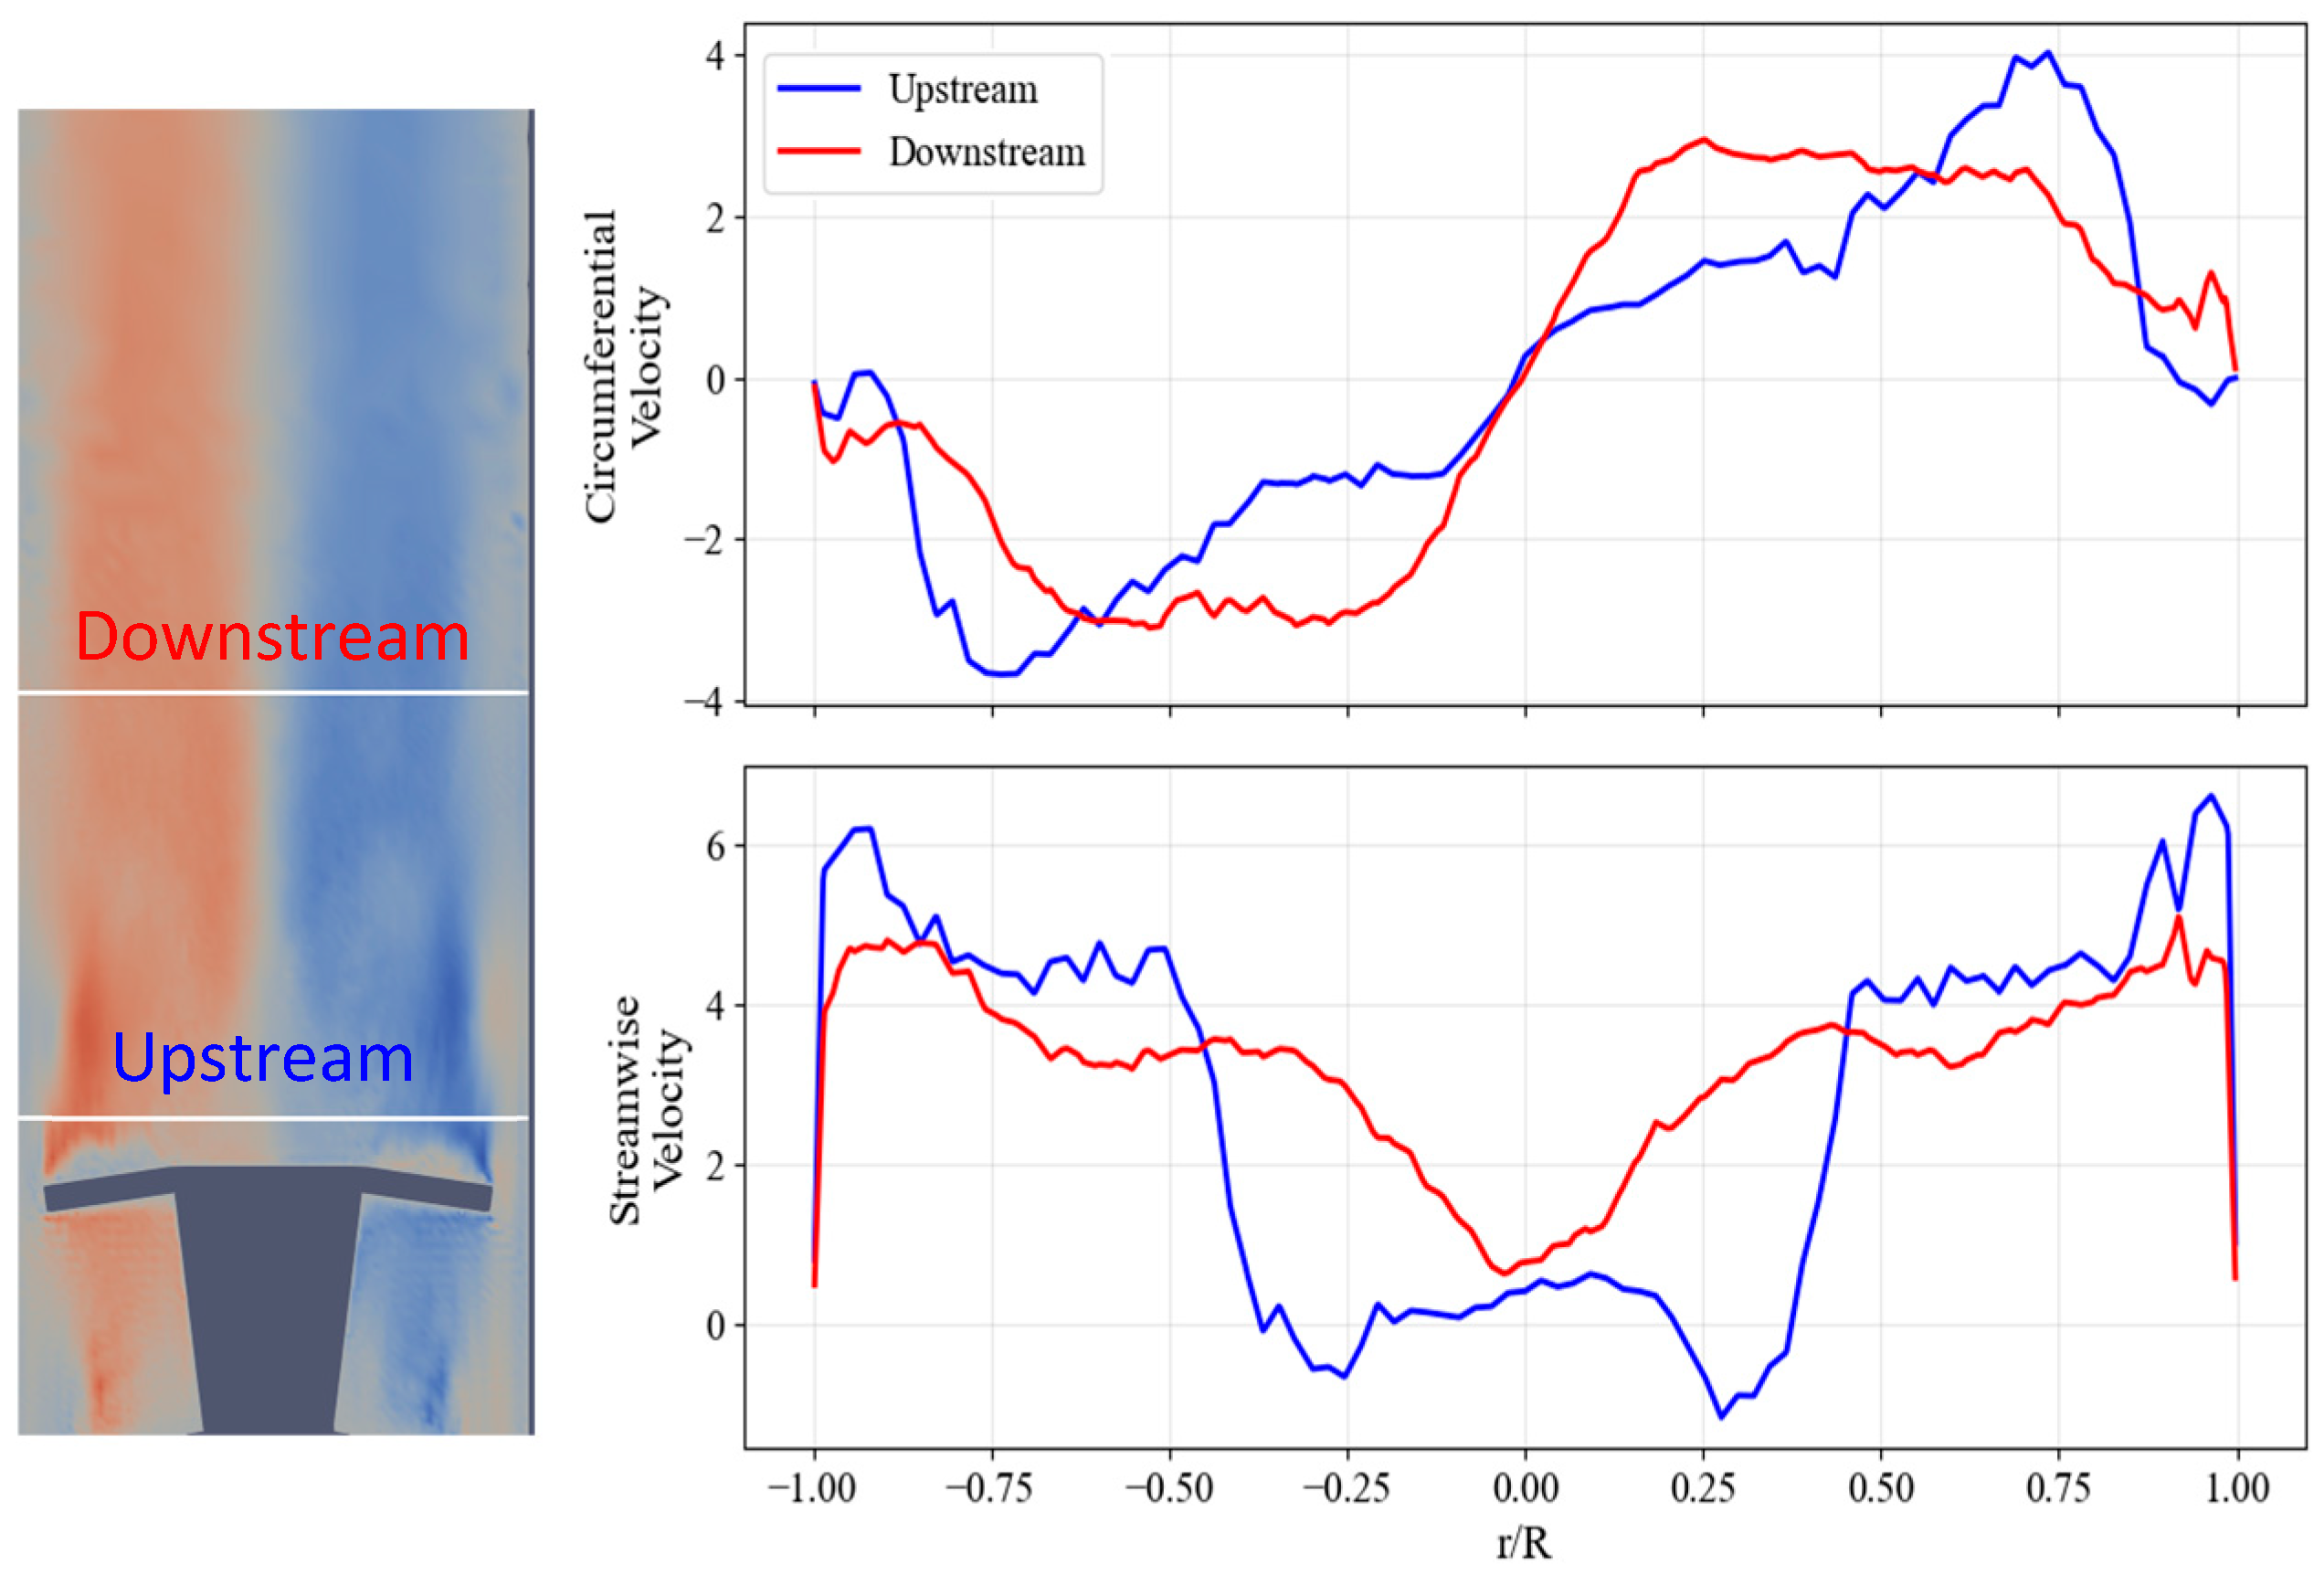
Figure 13 shows an instantaneous snapshot of the flow field exiting the swirler. The flow is clearly under-resolved due to the high turbulence and coarseness of the mesh. In Figure 14, the flow is averaged over time. One interesting aspect of the swirling flow is seen in the streamwise velocity profile. The peak in the streamwise velocity now occurs much closer to the wall. Towards the centerline, the velocity is very low and can actually be negative close to the swirler. This shift in velocity peak comes from the fact that the central body of the swirler is blocking a significant region of the flow centerline. The negative velocity comes from a recirculation zone that forms around the downstream-facing side of the swirler.
The simulation of the swirler is an interesting problem on its own which warrants further study. Here, it is just used to inform the inlet profile for the main separator simulation, but many other avenues could be explored. Higher mesh resolution would allow for the measurement of Reynolds stress or other quantities relevant to turbulence analysis. Two-phase flow could also be incorporated to investigate the formation of the swirling annular flow profile. These problems are left for future work.

3.3. Simulations of a 360 ° Model

In order to properly model the swirling velocity field using the 30 ° wedge model, periodic boundary conditions must be applied to the angled faces of the geometry. In PHASTA, the equations are always solved in a cartesian coordinate system. So, any vectors (solution values and residuals) that are communicated between angled periodic faces need to be properly rotated to maintain consistency. This has recently been correctly implemented in the PHASTA code, but at the time of this study, it had not been finished. So, to test the effect of the swirling flow, a full 360 ° model simulation was conducted.

3.3.1. Boundary Conditions and Mesh Design

All relevant dimensions for the 360 ° model are the same as the 30 ° model. This necessitated some change in mesh design. If the same mesh design from Section 3.1 were applied to this new geometry, all mesh sizes would increase by a factor of 12. In order to reduce the cost of these simulations, some reduction in resolution was made. The overall mesh design is shown in Figure 15.
The finest element size is 0.6 mm in a small region just before the pickoff ring entrance. The total mesh size here is 116 million elements. Only one mesh was studied here due to the computational constraints.
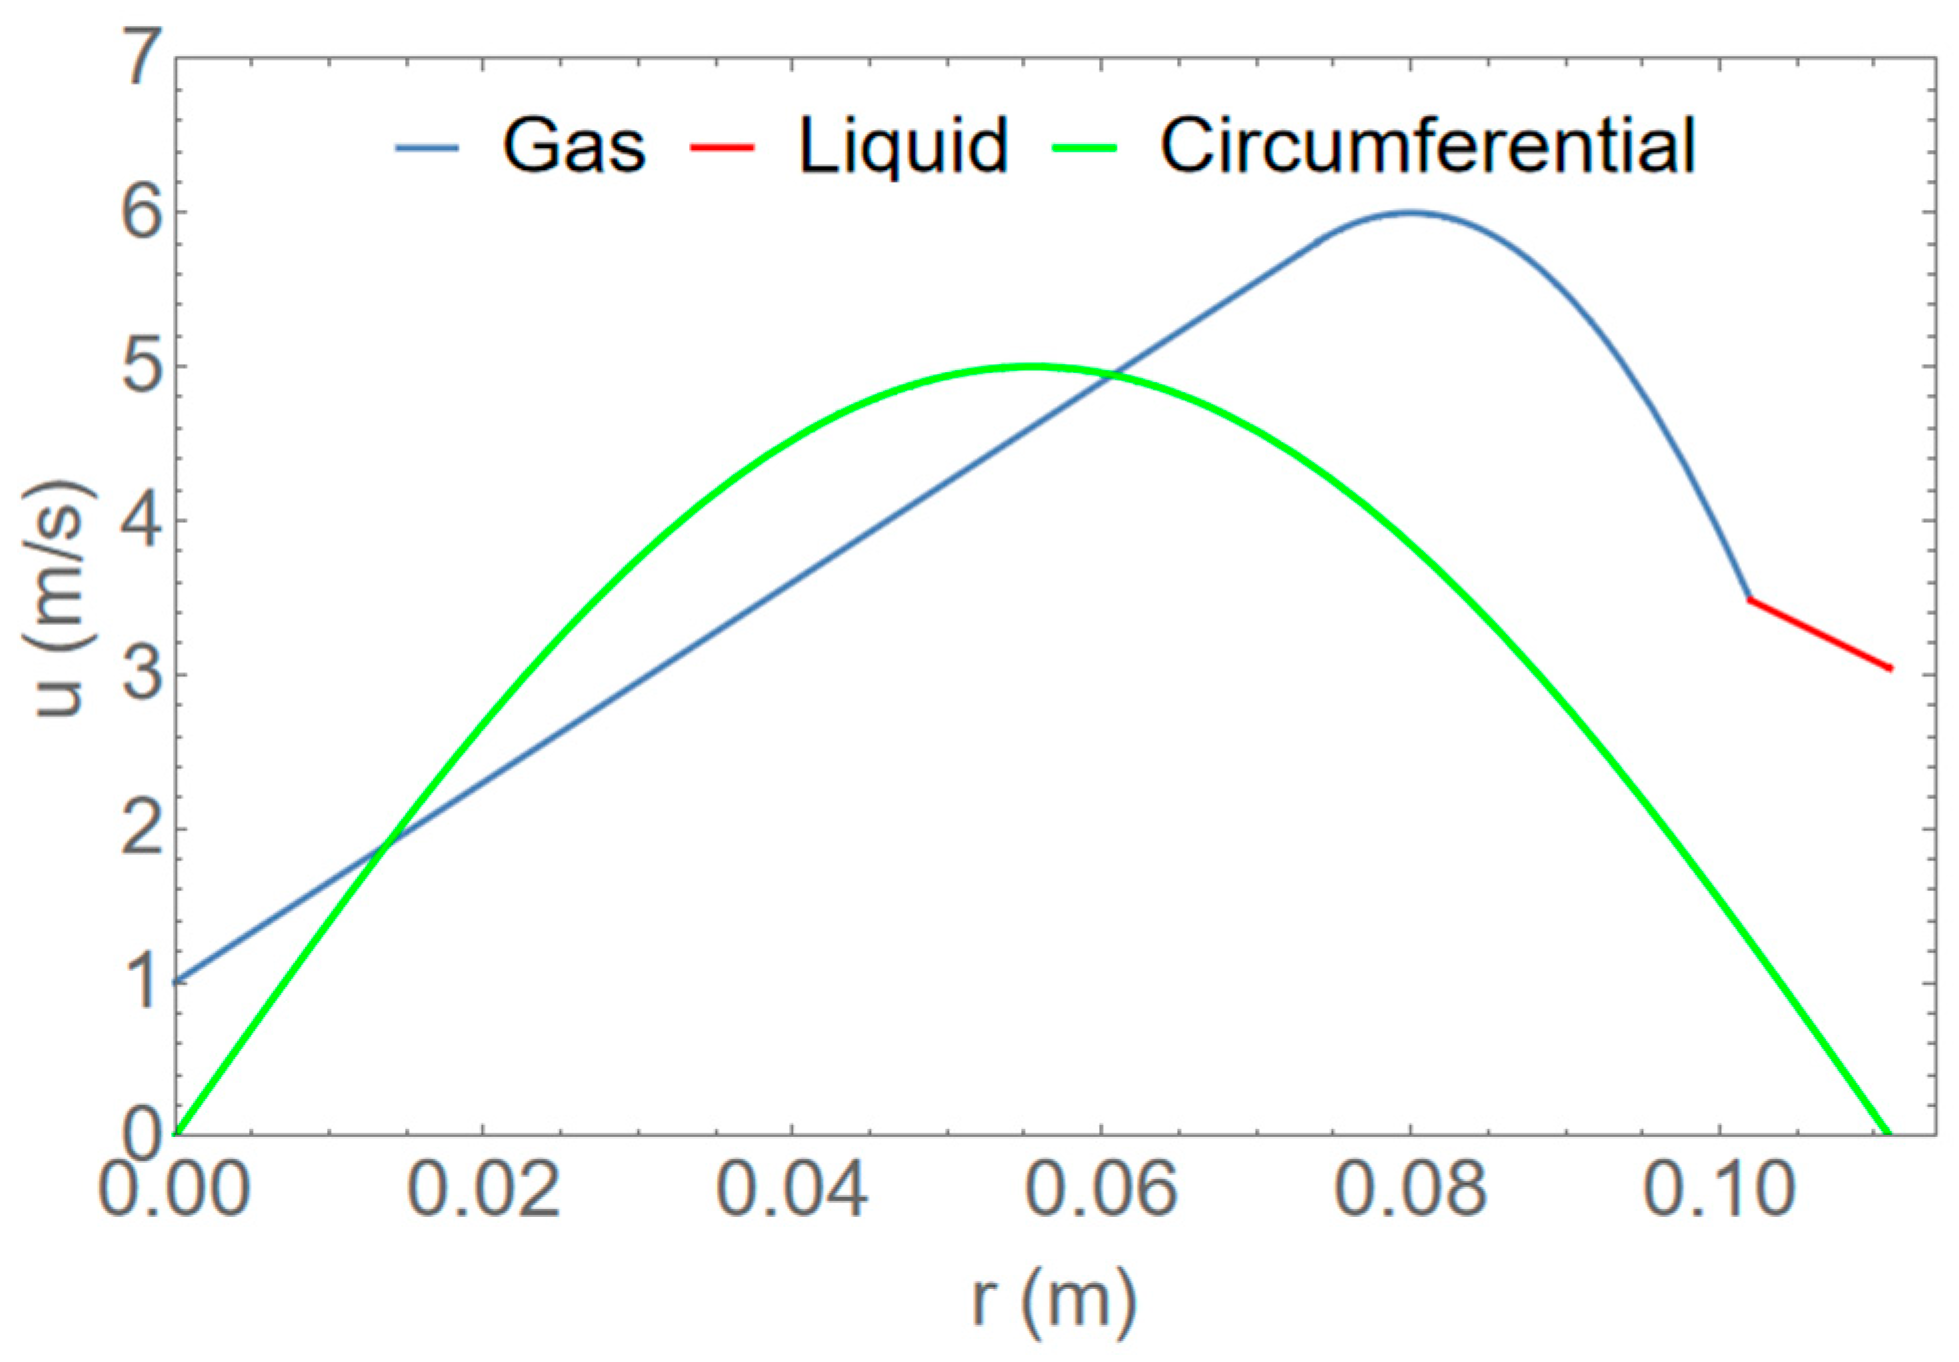
The results from the swirler simulation in Section 3.2 were used to develop a new analytical velocity profile at the inlet. A better solution would be to directly map the instantaneous velocity field from the swirler outlet to the inlet of the separator simulation. This is a capability which now exists in PHASTA, and this will be incorporated in future simulations. The velocity profile is specified in the form shown in Figure 16.
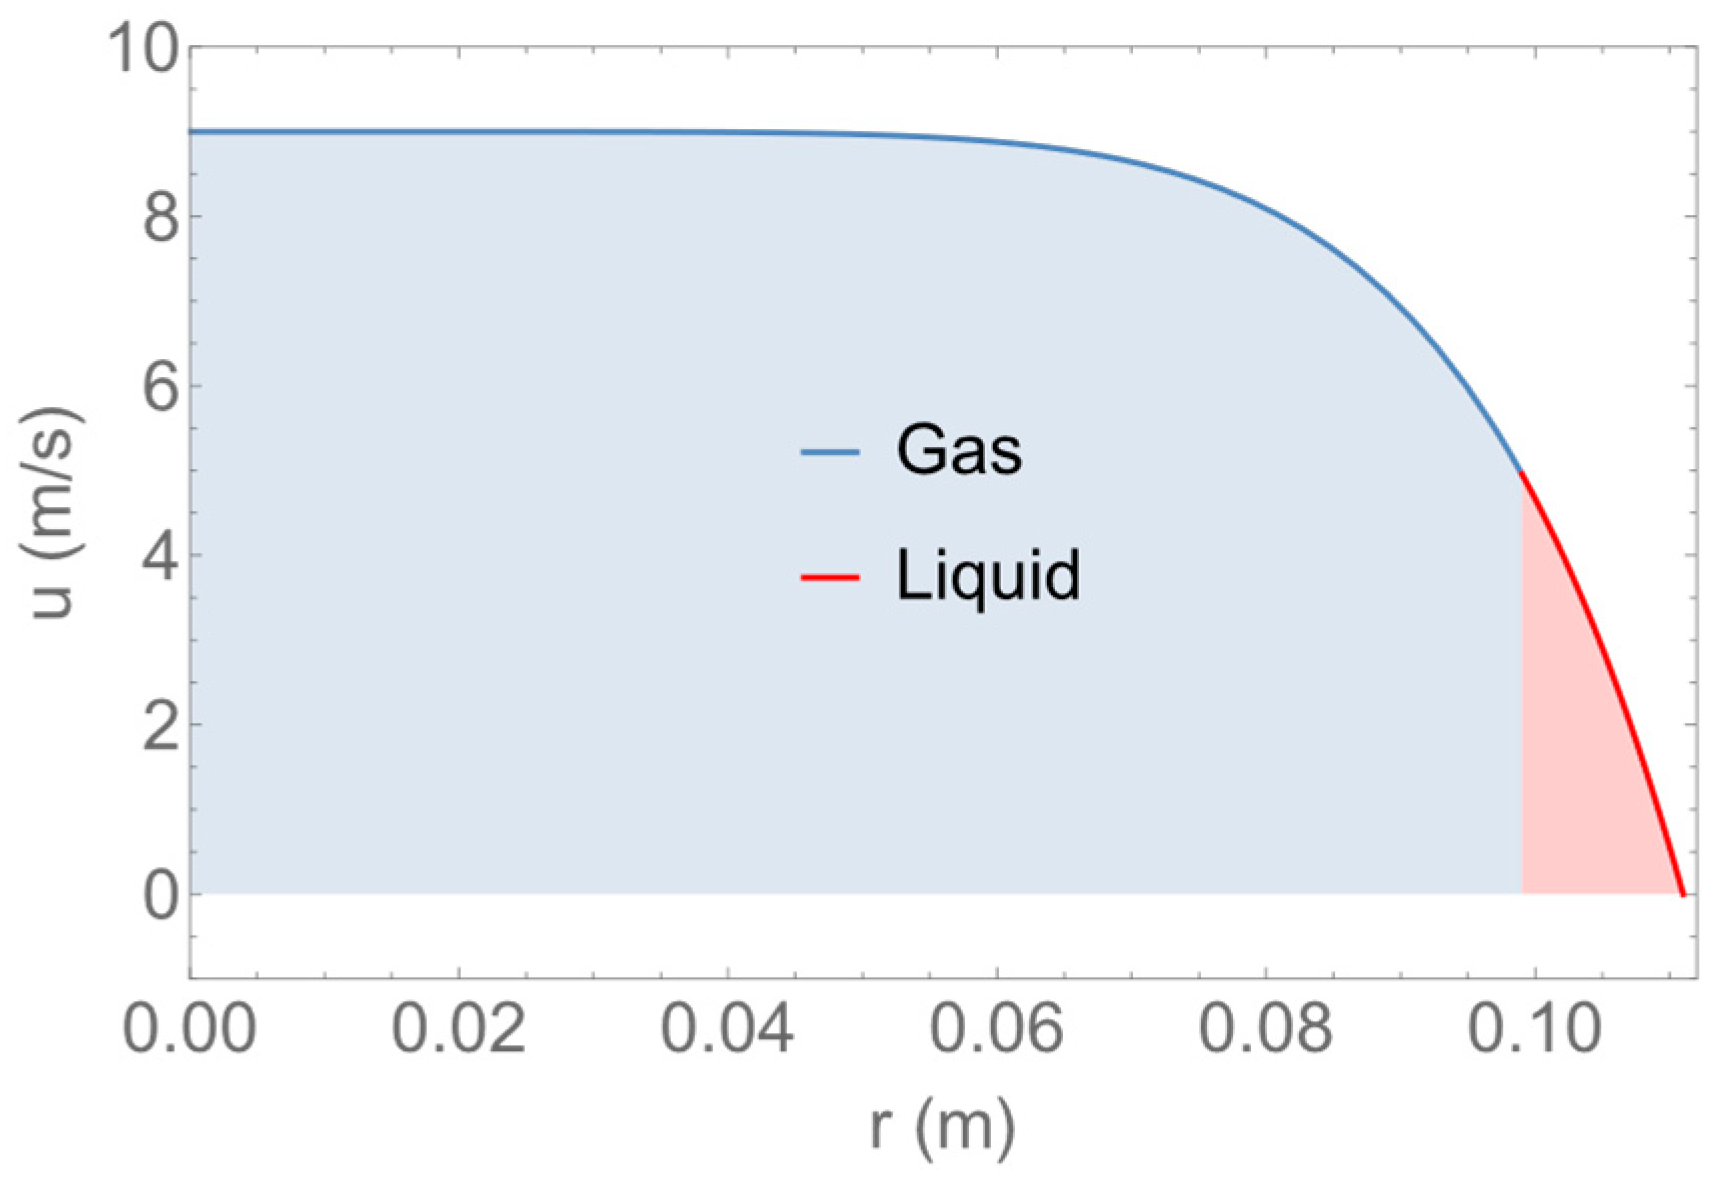
The streamwise velocity peaks close to the wall and decays linearly towards the center. The slope of the streamwise velocity changes at the interface in order to approximate the jump condition resulting from the difference in viscosity. The circumferential velocity magnitude is approximated using a sine wave, which peaks halfway between the pipe center and side walls ( r = R / 2 ) . The magnitude of the streamwise velocity profile is adjusted to obtain reasonable values for the superficial velocities and flow quality. Swirler simulations indicated that the peak circumferential velocity is slightly lower than the peak streamwise velocity. Here, the peak circumferential velocity is set about 16% lower than the peak streamwise velocity. The velocity profile is symmetric around the full circumference, with the direction modified appropriately to create a swirl.
Table 5 summarizes the main properties of the simulation. Due to the more accurate velocity profile, the superficial steam velocity and flow quality are lower and more in line with the values derived from [23]. Viscosities were also lowered to the true values found at BWR conditions. Previous results from the 30 ° geometry showed that system-level quantities mostly converged very well without resolving all scales of motion. Additionally, the presence of the swirl should stabilize the liquid film, resulting in less entrainment and less mass loss in the liquid phase. Therefore, using lower viscosities was believed to be justified.

3.3.2. Results

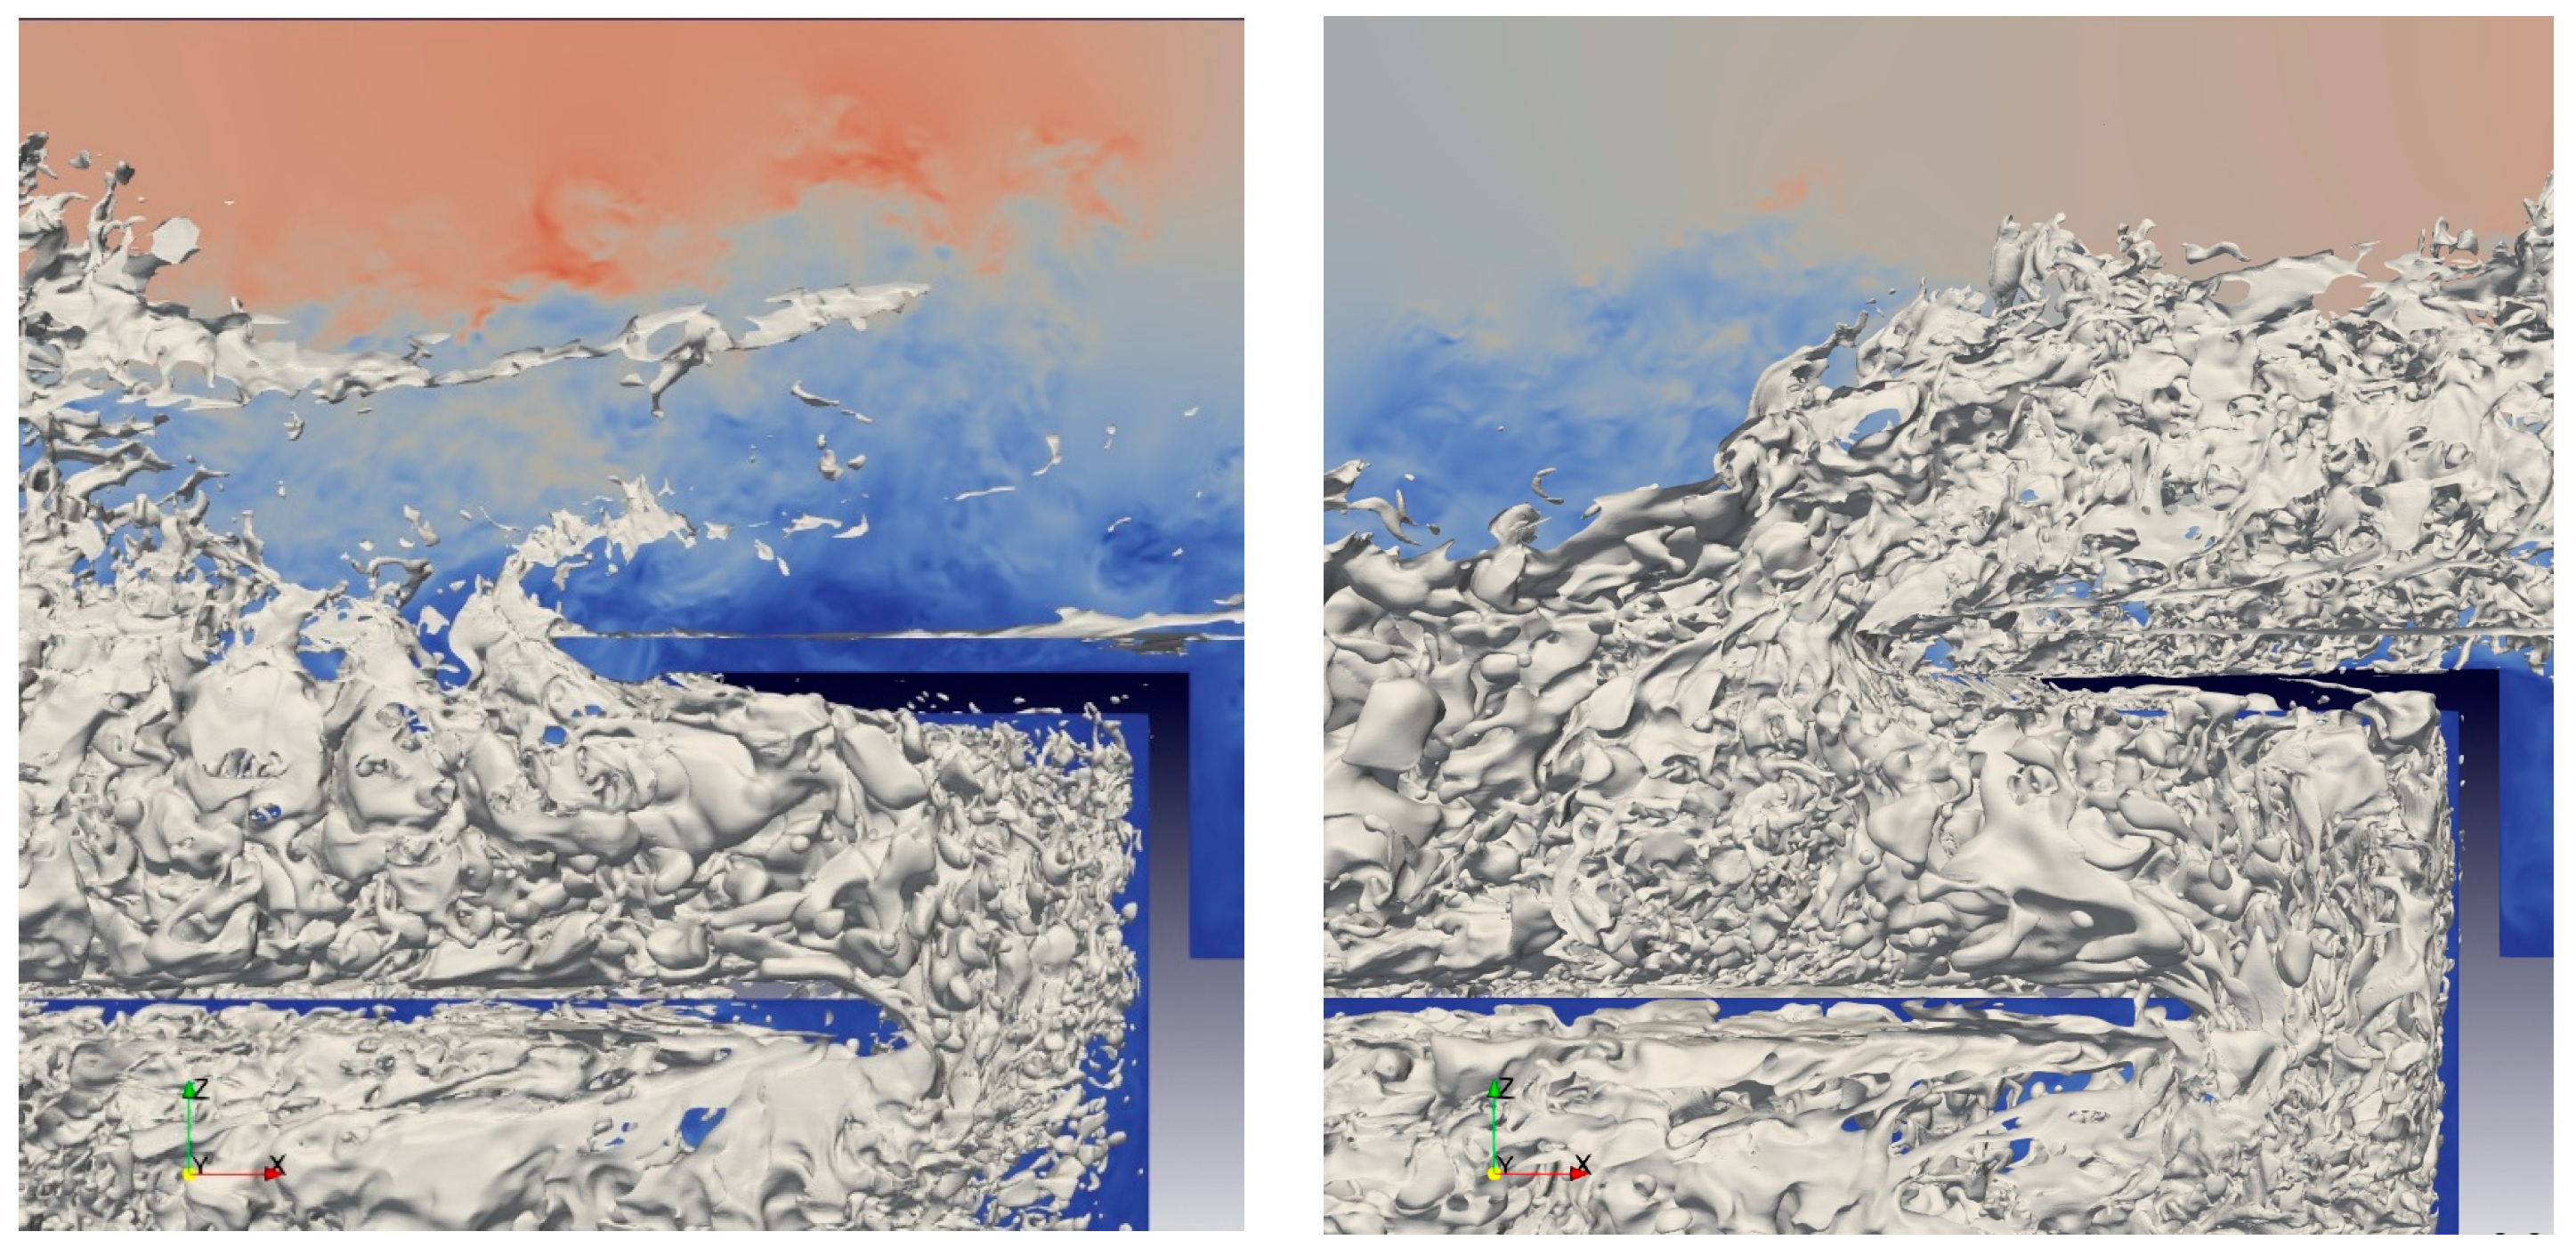
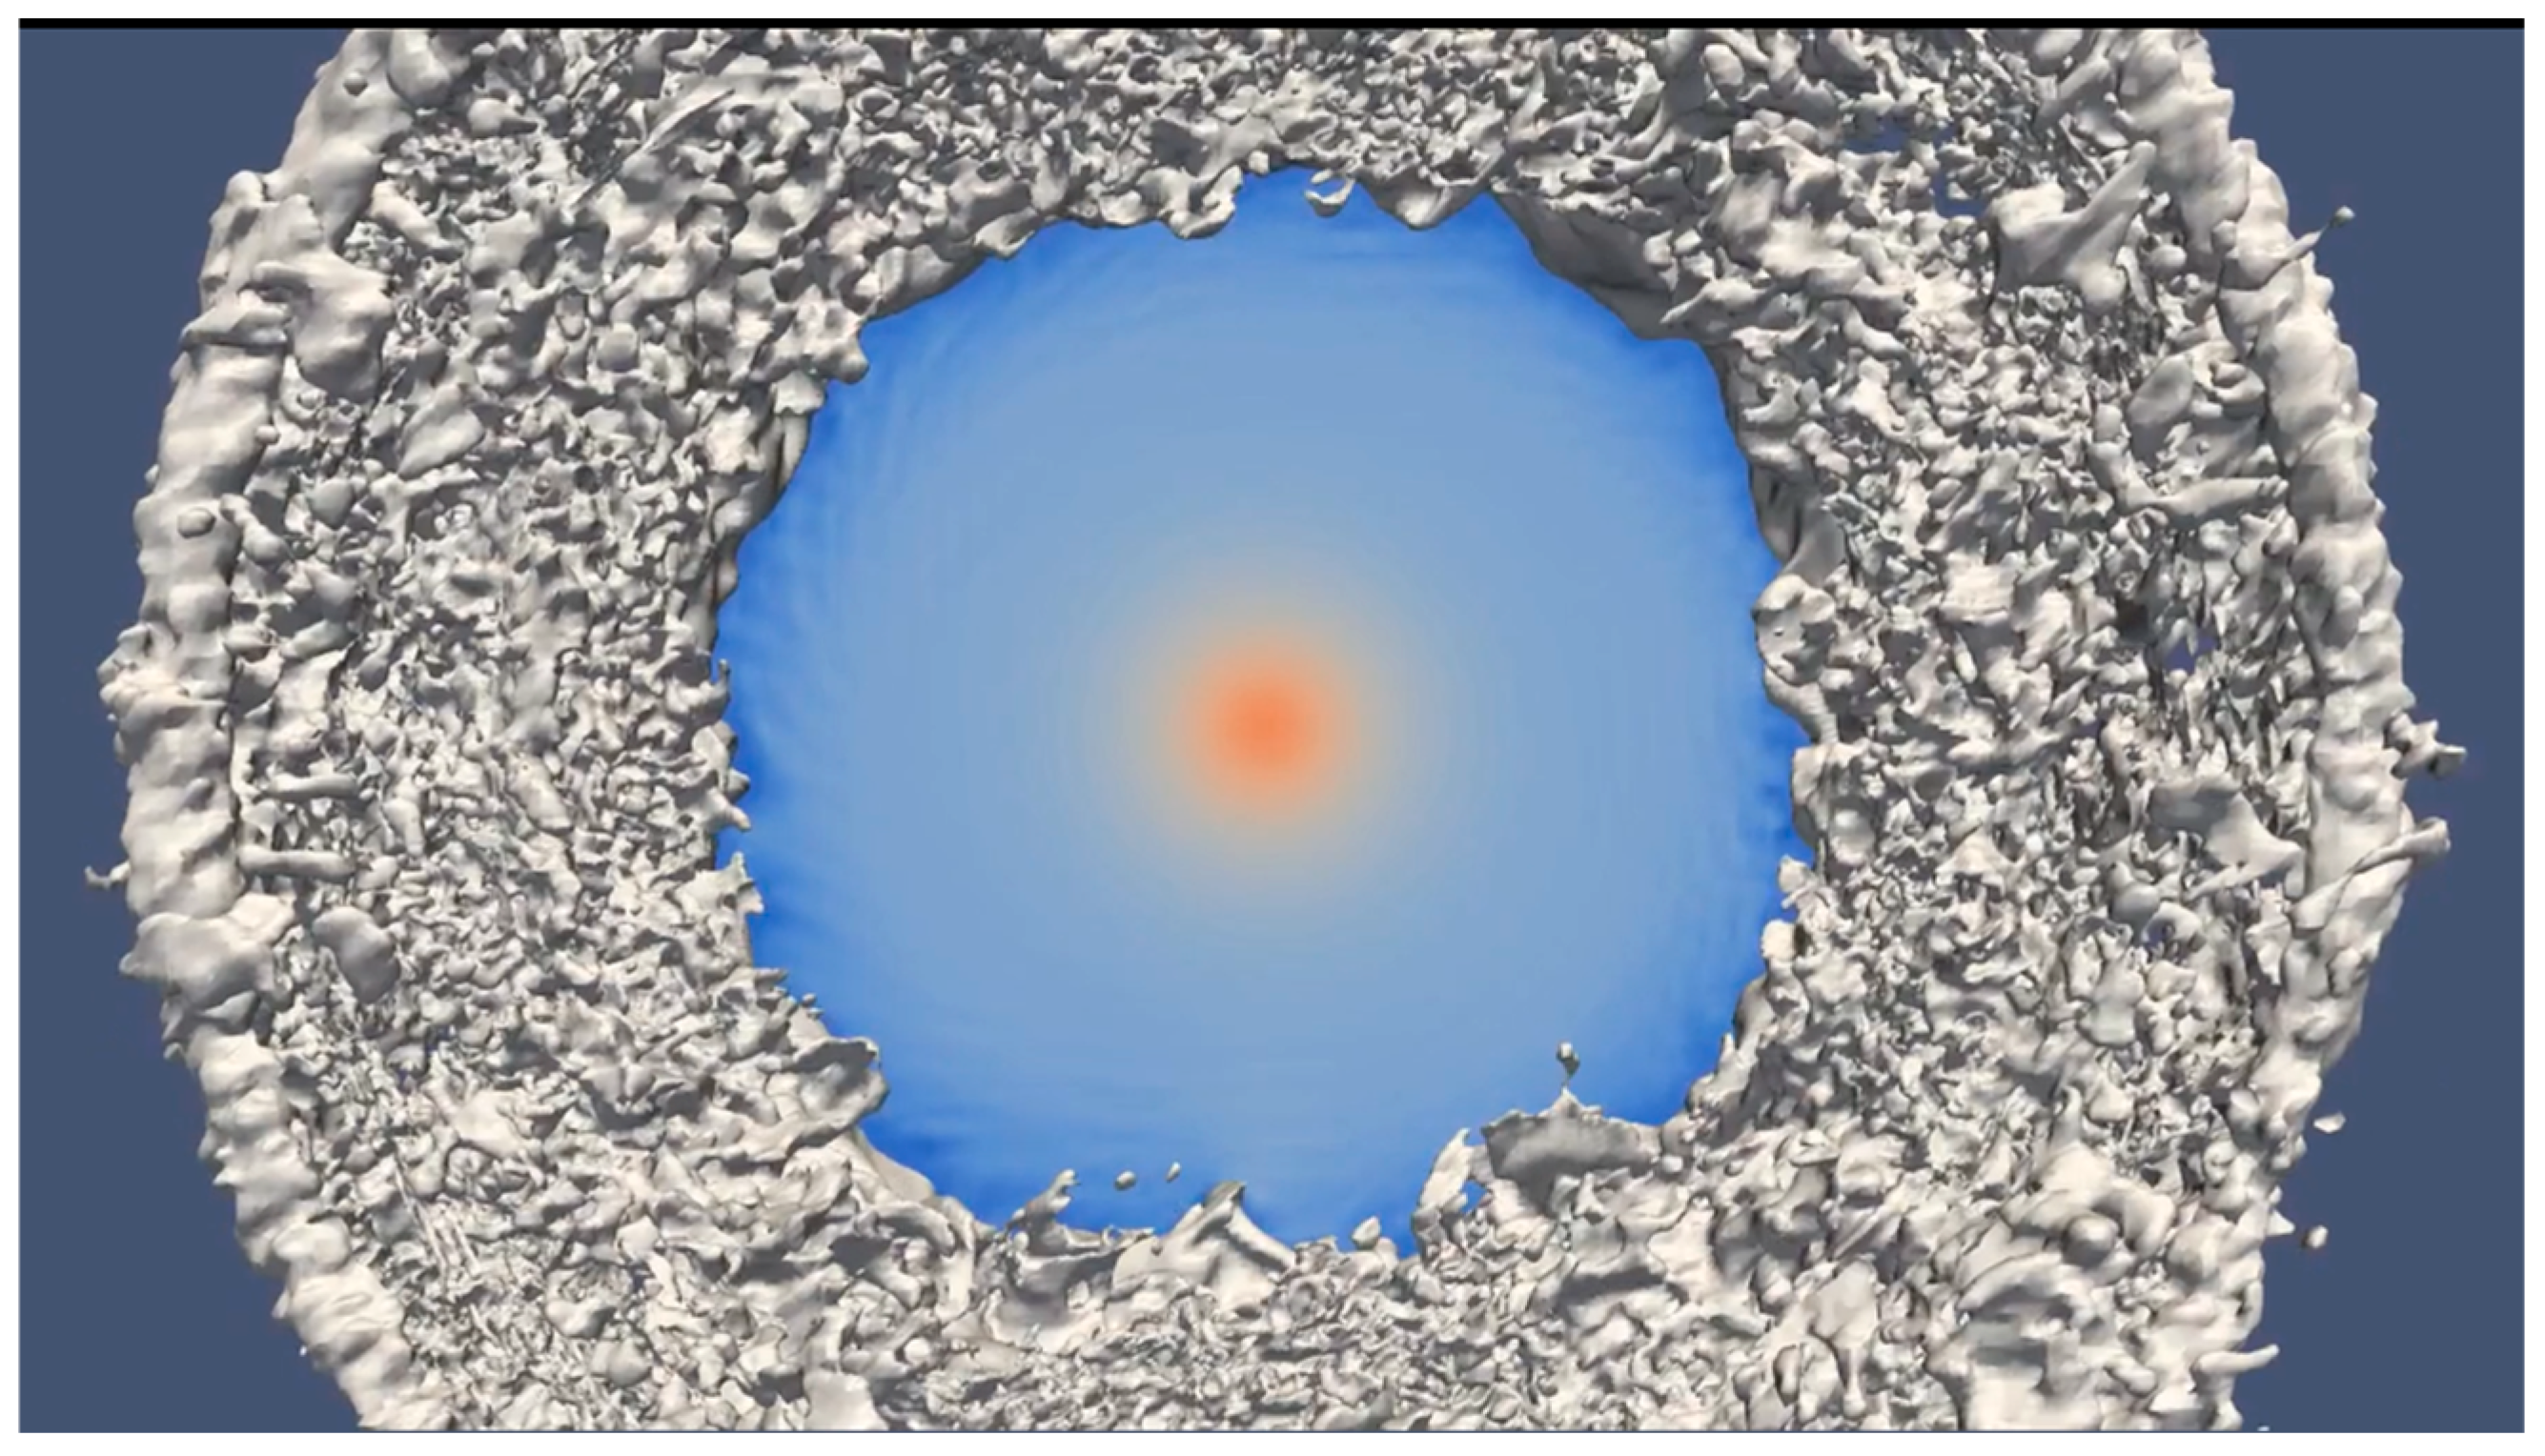
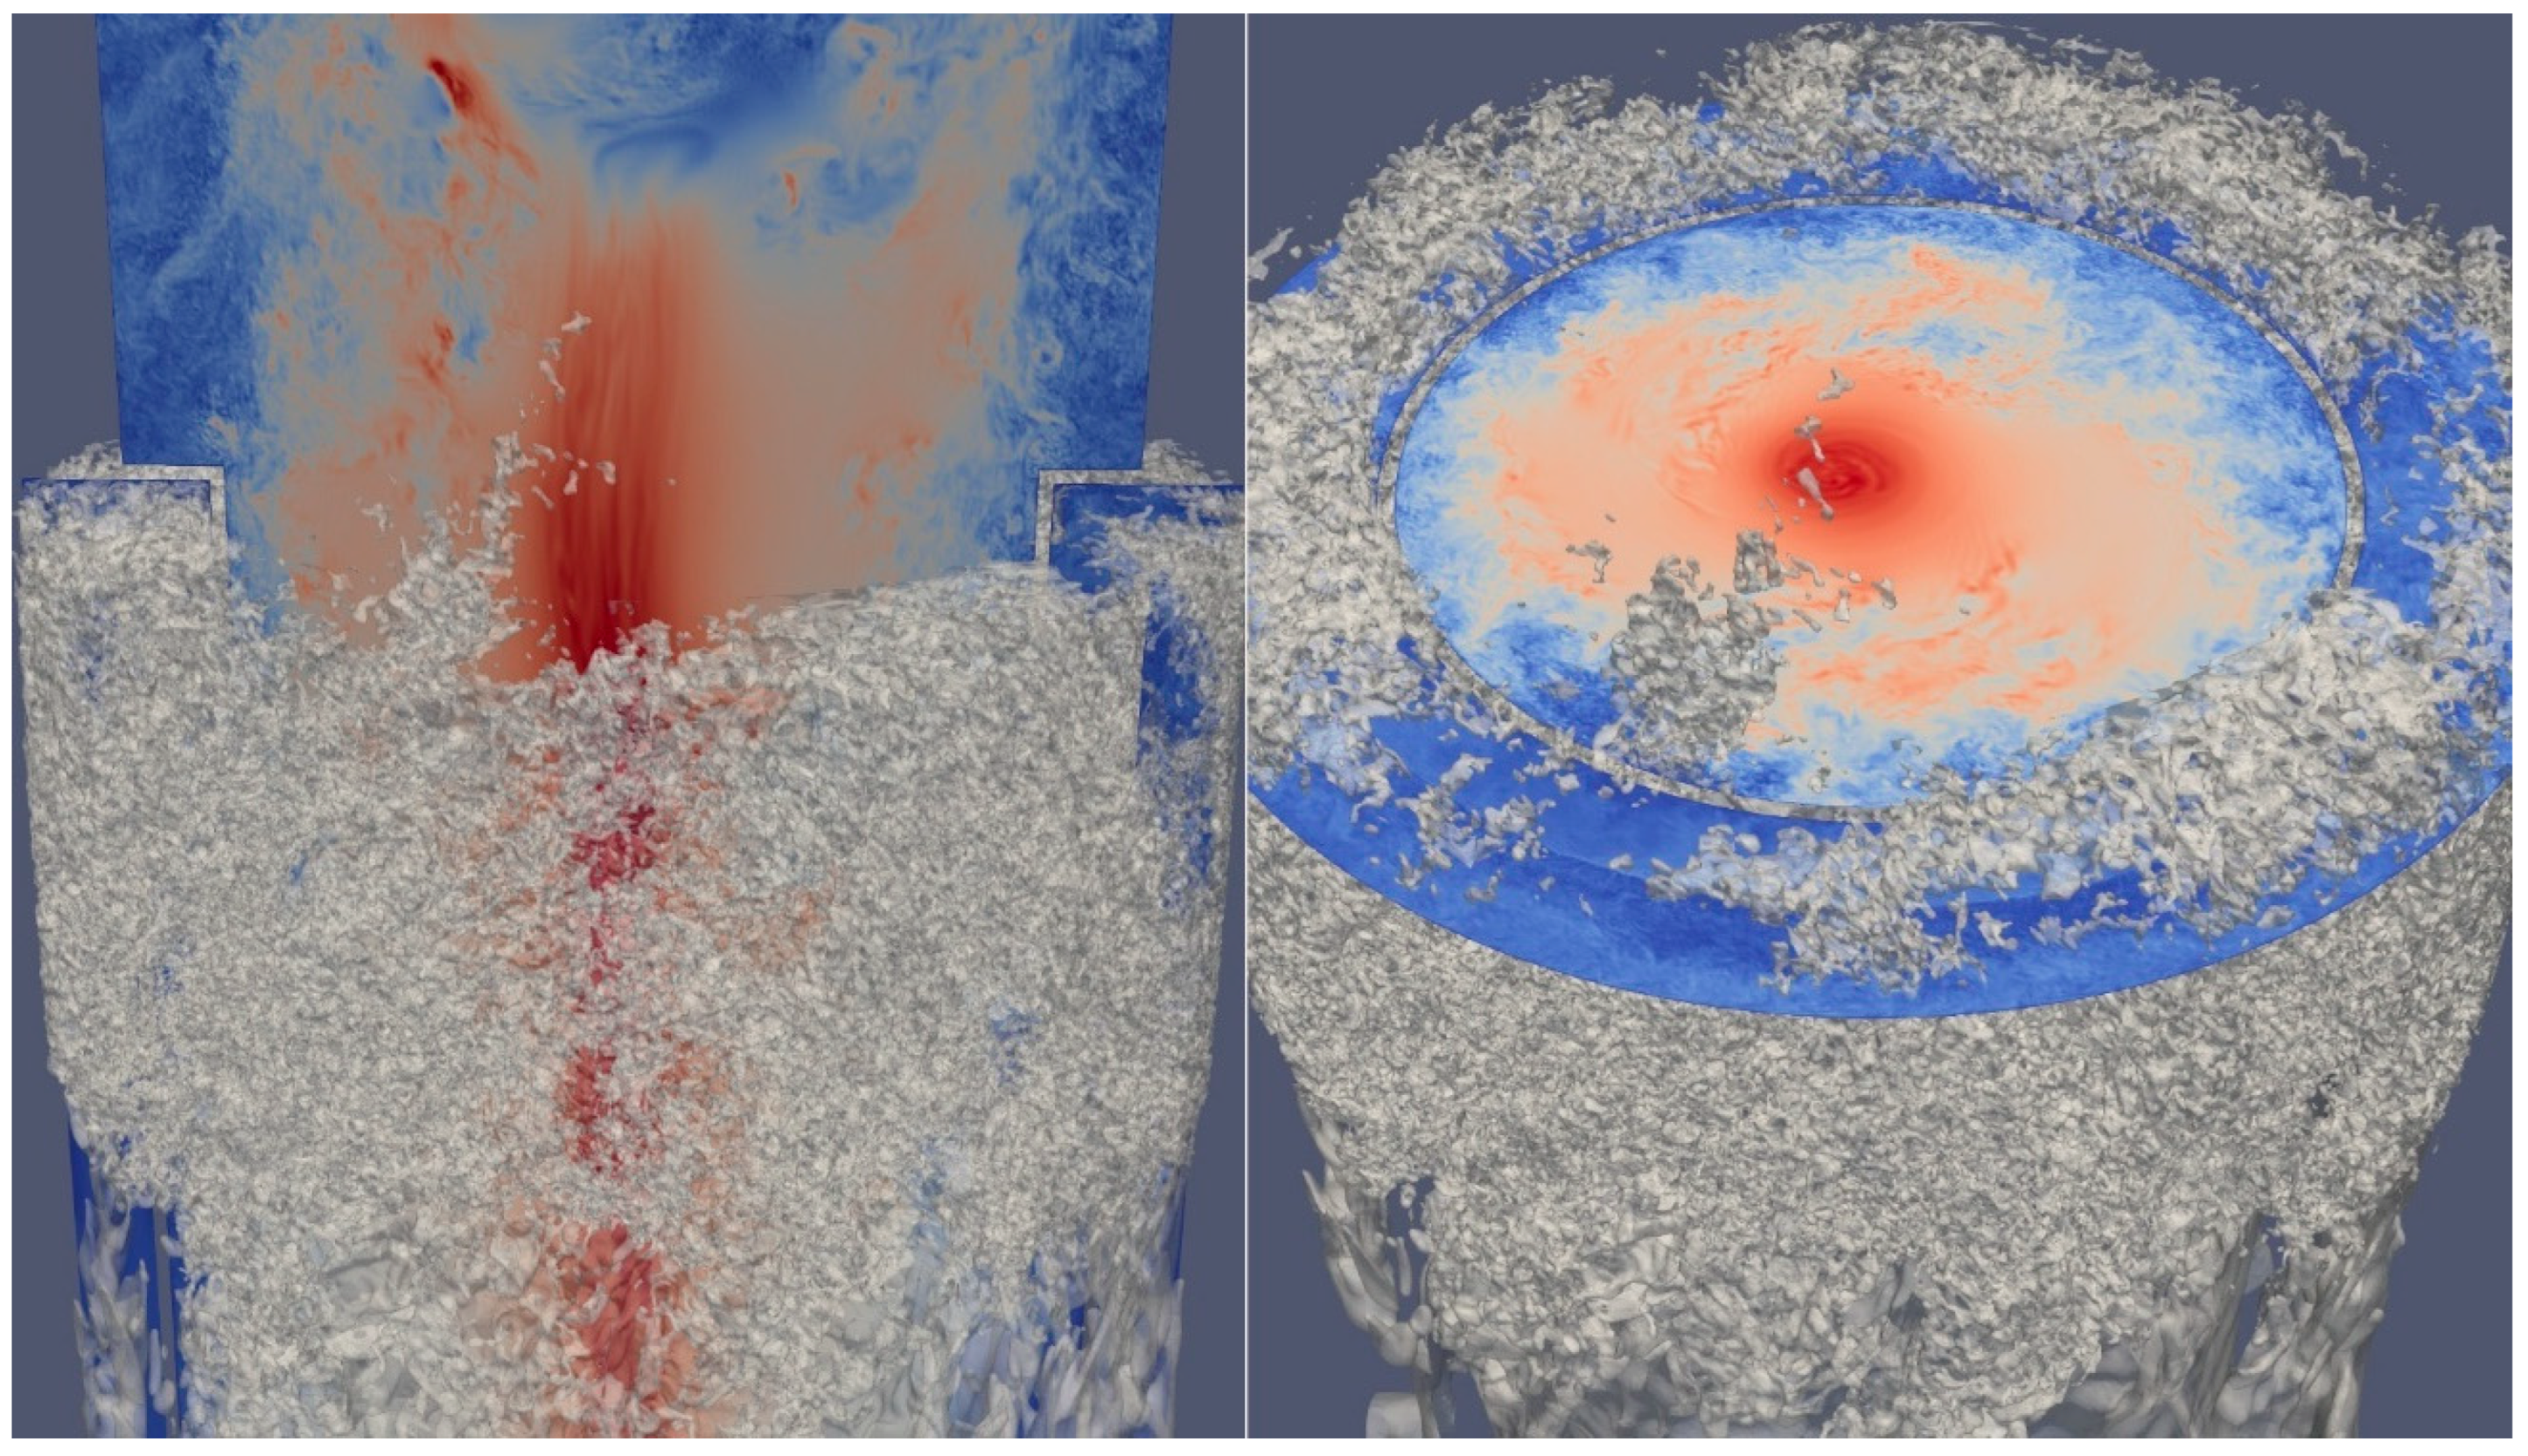
Visualizations of the flow are shown in Figure 17 and Figure 18. Due to the presence of liquid around the entire geometry, it becomes somewhat difficult to visualize both the velocity and interface in the same image. A detailed video of the flow was presented at [33] and is publicly available. As expected, the swirling velocity profile helps to stabilize the liquid film and prevents the more chaotic wave formation seen in the previous simulations. There is still nontrivial droplet entrainment, which results in a higher carryover than in previous cases. But the stability of the liquid film prevents more steam from entering the POR.
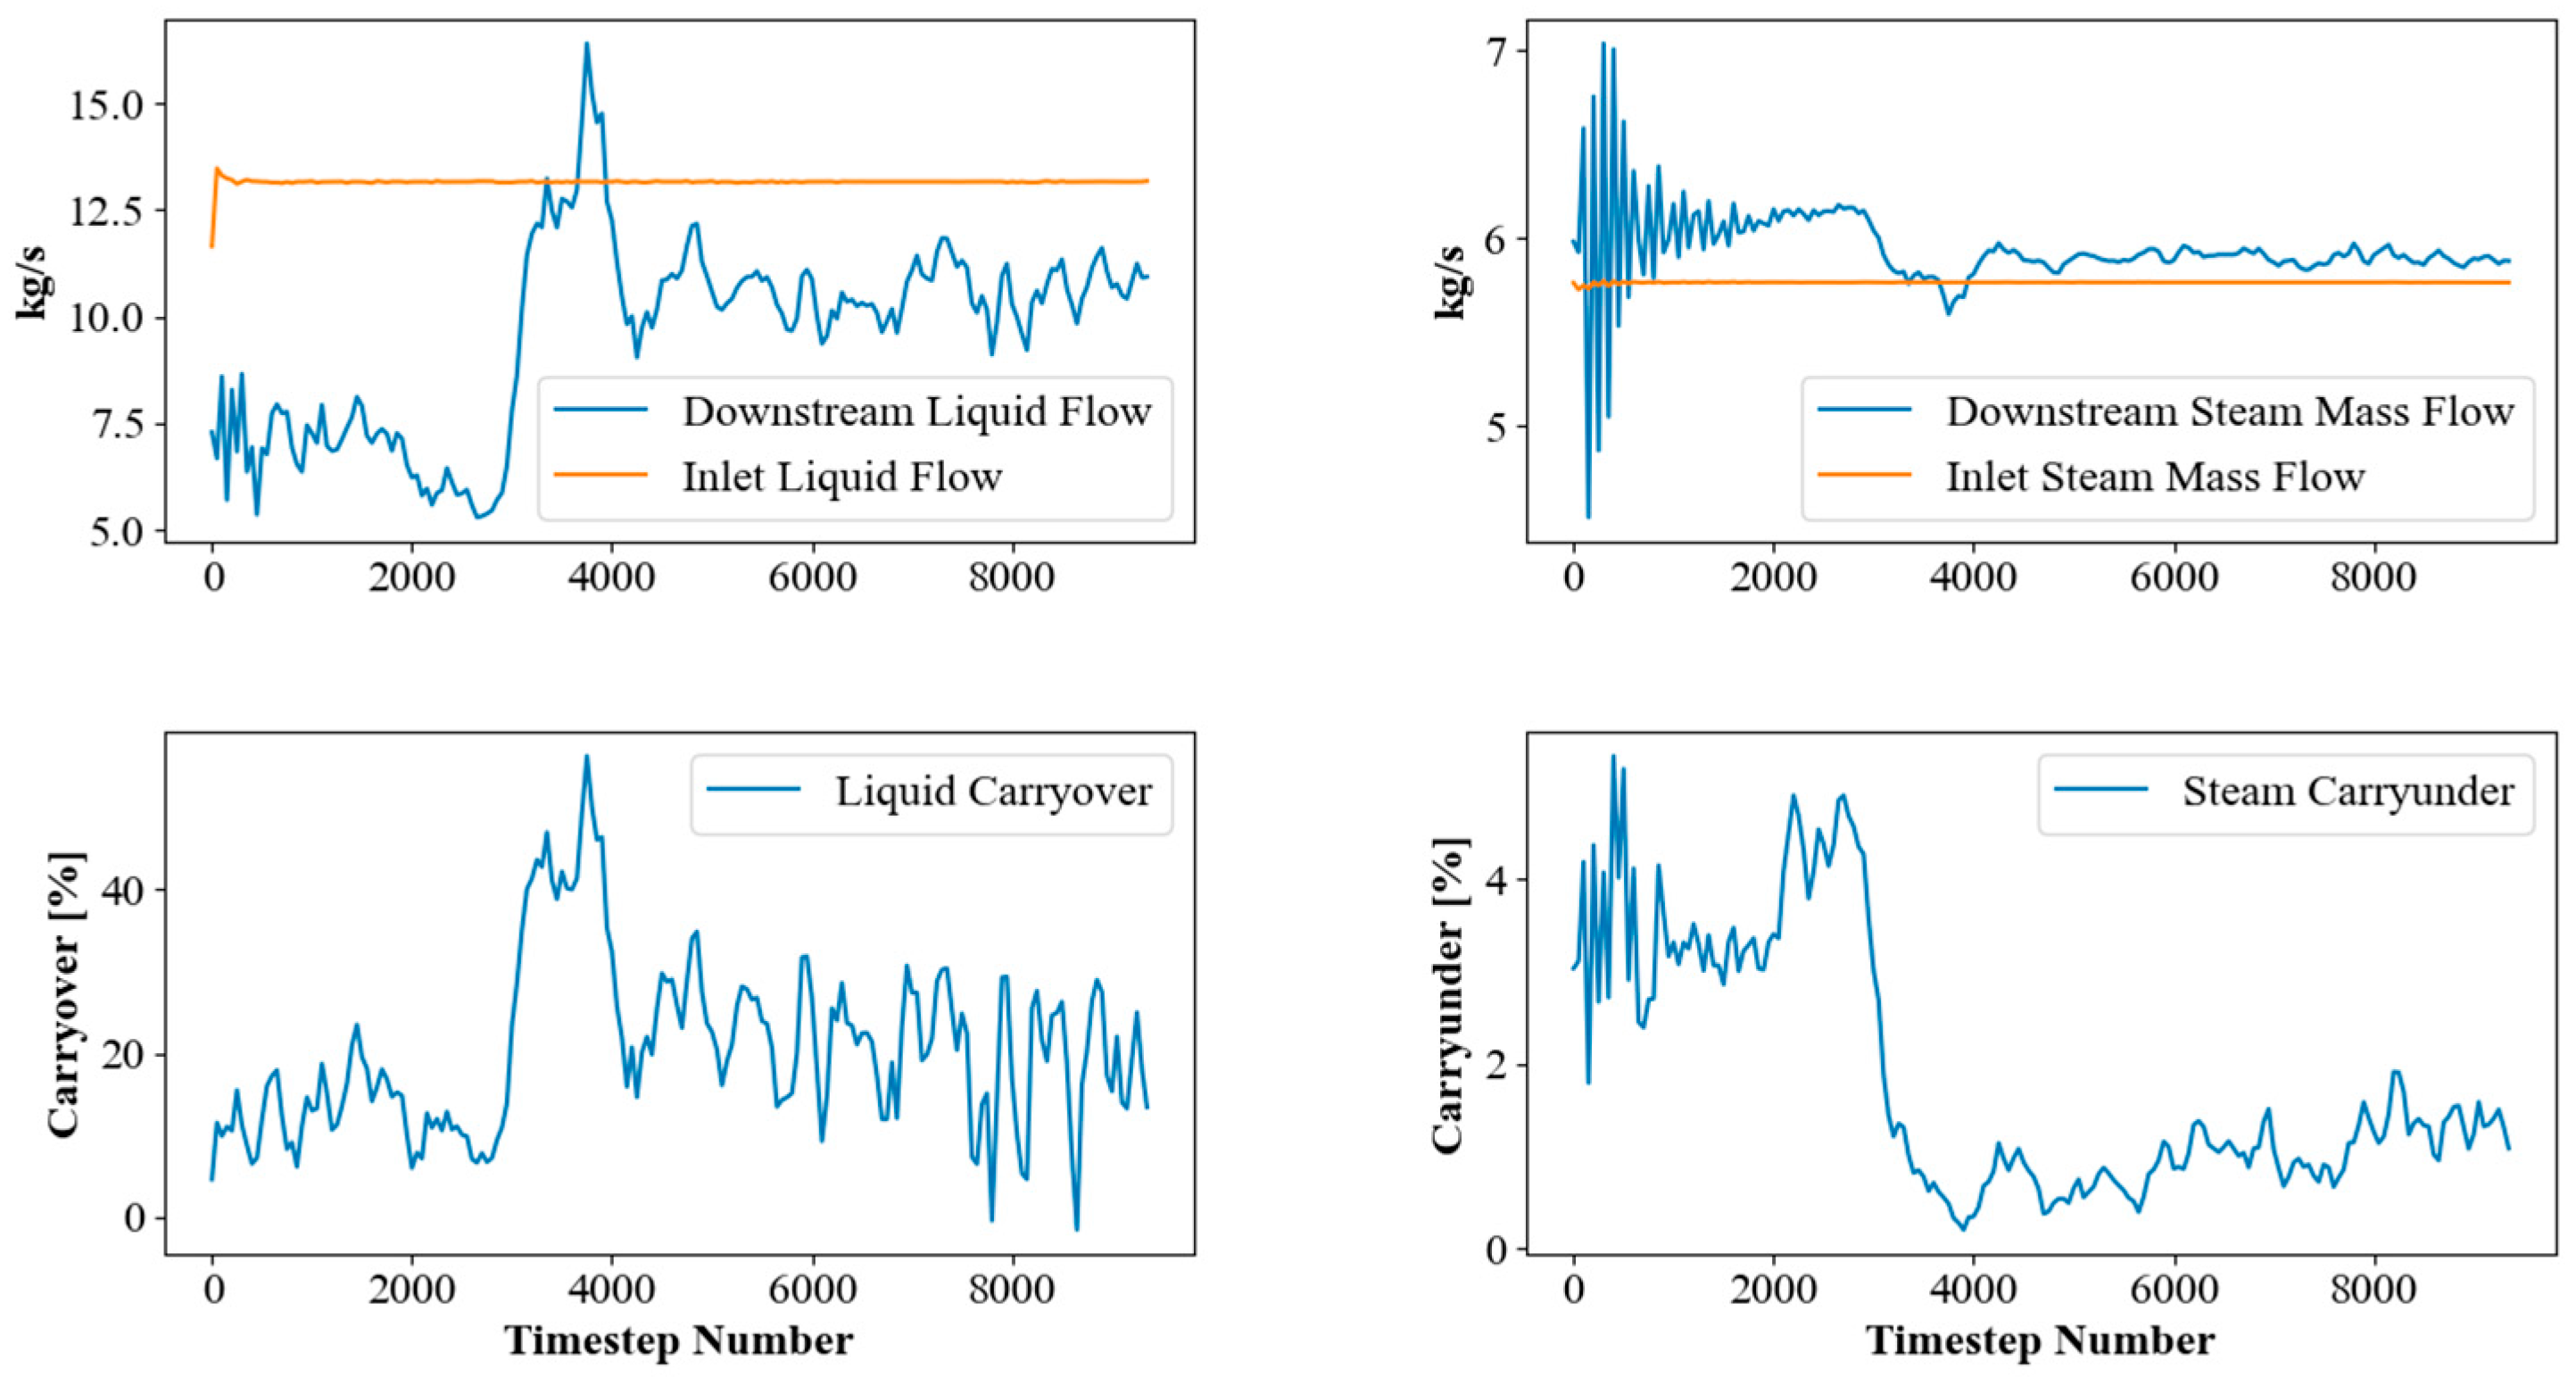
Instantaneous flow rates, carryunder, and carryover are shown in Figure 19. The data is quite noisy, likely due to the poor mesh resolution. We can also see that it takes around 4000 timesteps for the solution to reach a semi-steady state. Problems that start from zero velocity and pressure can have large fluctuations in pressure and velocity before the flow reaches an equilibrium. So, the data prior to timestep 4000 should be ignored. The carryunder and carryover also appear to have some small slope to them, meaning they may not yet be truly converged. However, the net change is small compared to the timescale involved (4000 timesteps here is equivalent to about 0.3 s of simulated time). So, the flow is assumed to be at a steady state.
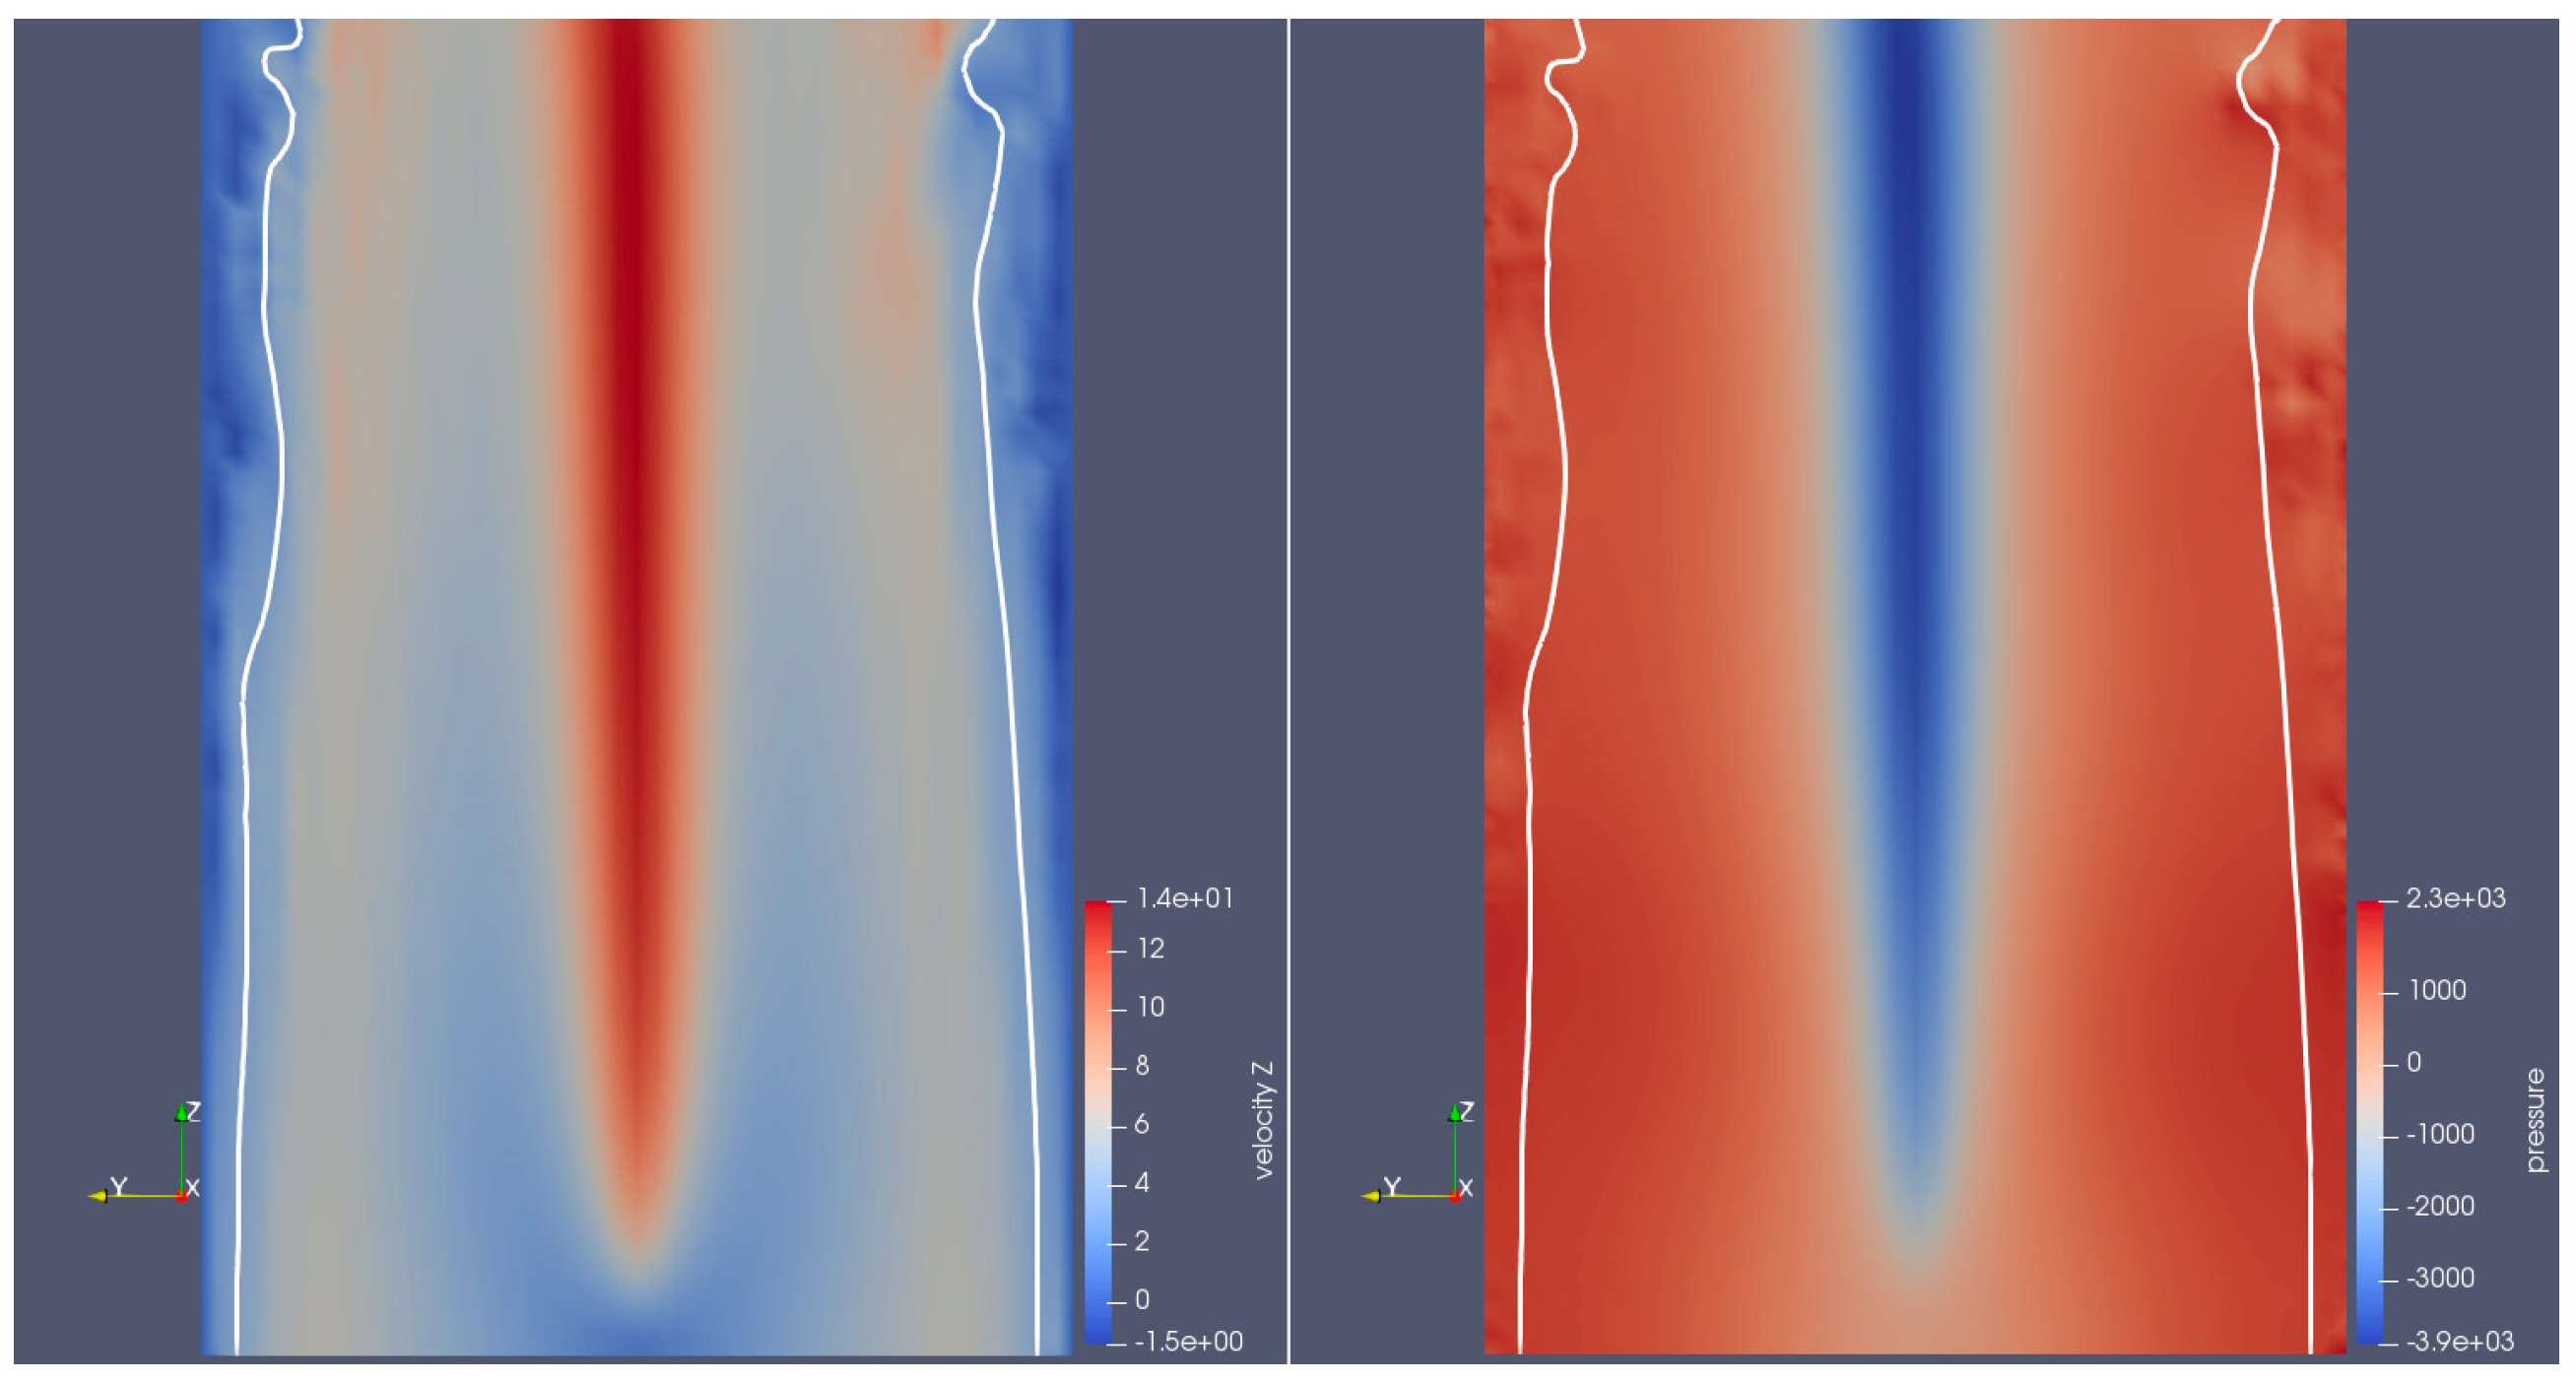
One interesting observation is the change in mass flow rate that occurs between the inlet and pickoff ring. The liquid flow rate drops while the steam flow rate increases. This can be explained by analyzing the velocity field. Figure 16 and Figure 17 both show the presence of a very high velocity region at the center of the gas core. When the centrifugal force of the flow pushes the heavier water to the sidewalls, it creates a low-pressure region in the centerline. This was reproduced using the same boundary conditions as the present problem but for a simpler annular flow geometry (Figure 20).
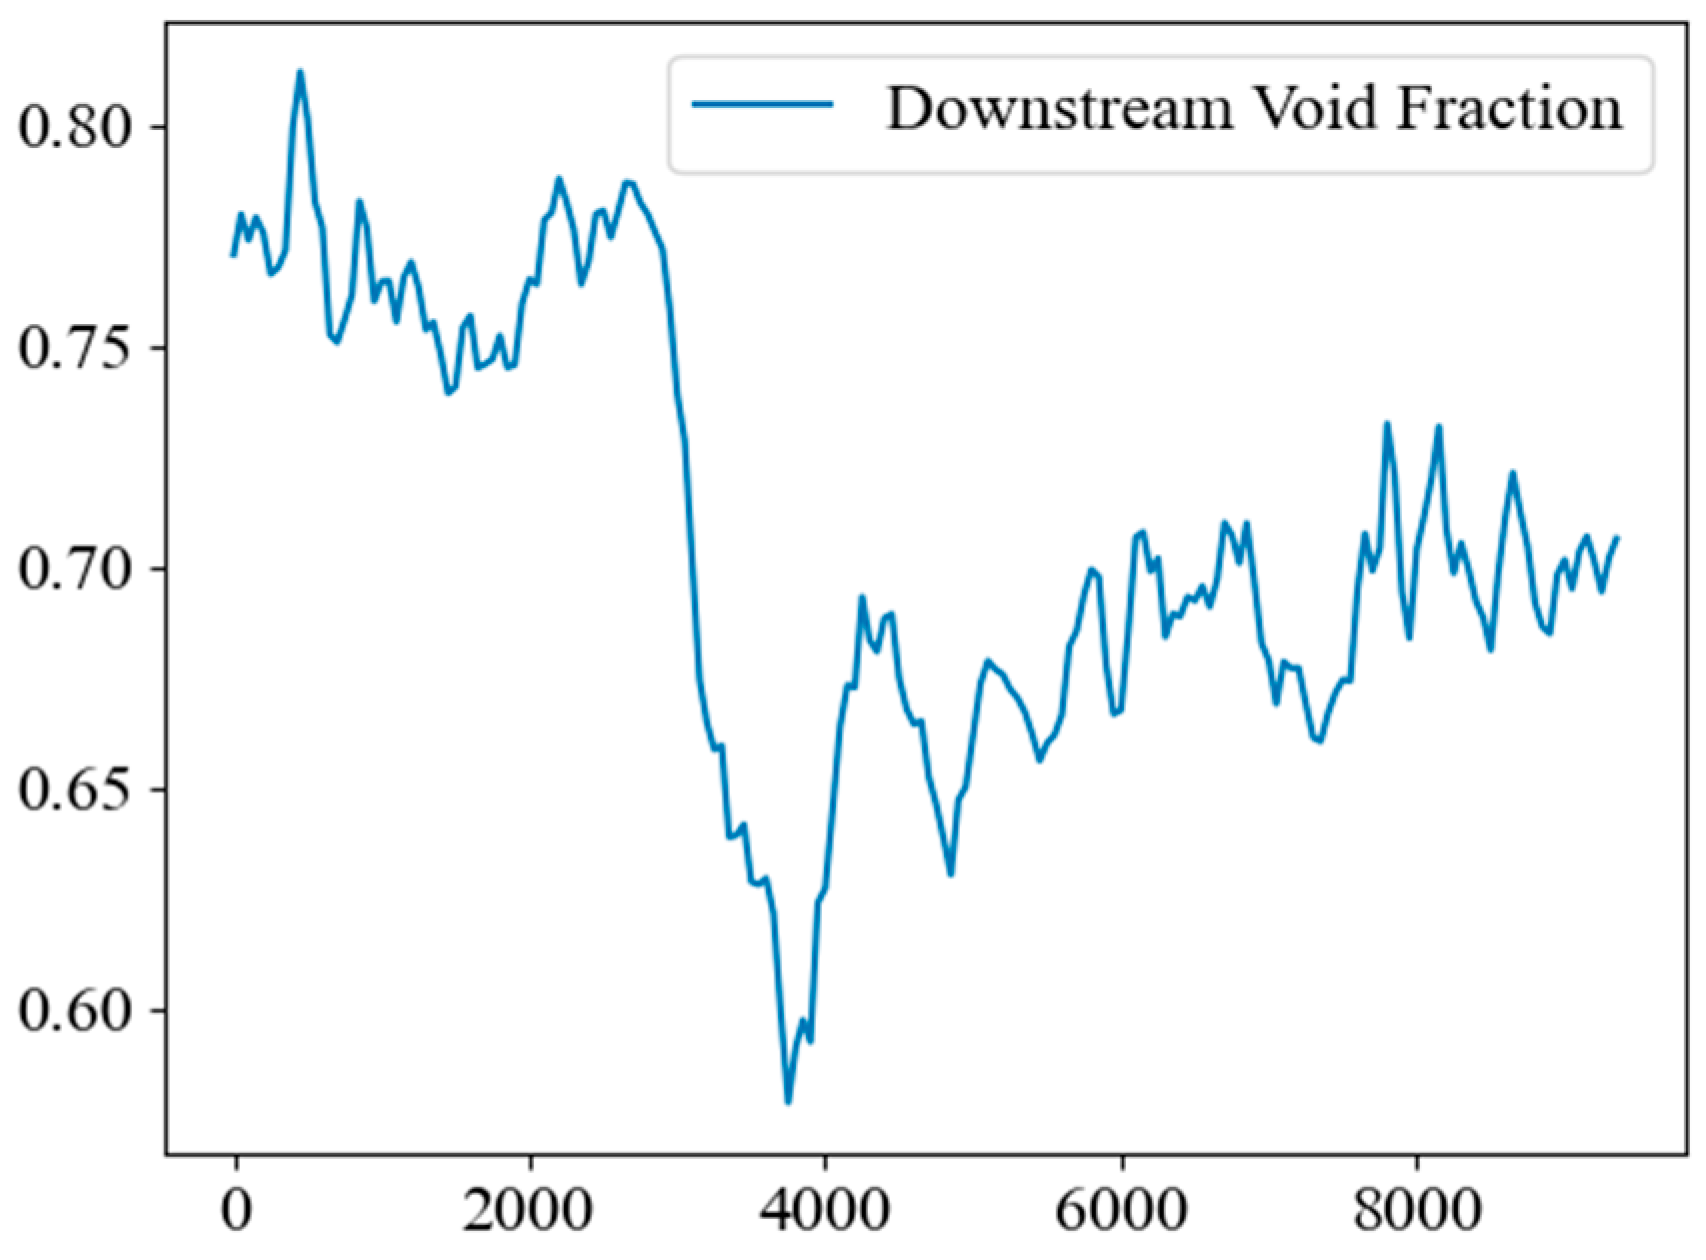
This low-pressure region accelerates the steam phase at the cost of the liquid phase, which is slowed by the additional friction experienced at the wall. This slowing of the liquid phase causes a buildup of liquid closer to the POR, reducing the local void fraction there (Figure 21). This increase in the liquid film thickness restricts the flow area of the steam phase, accelerating it further.
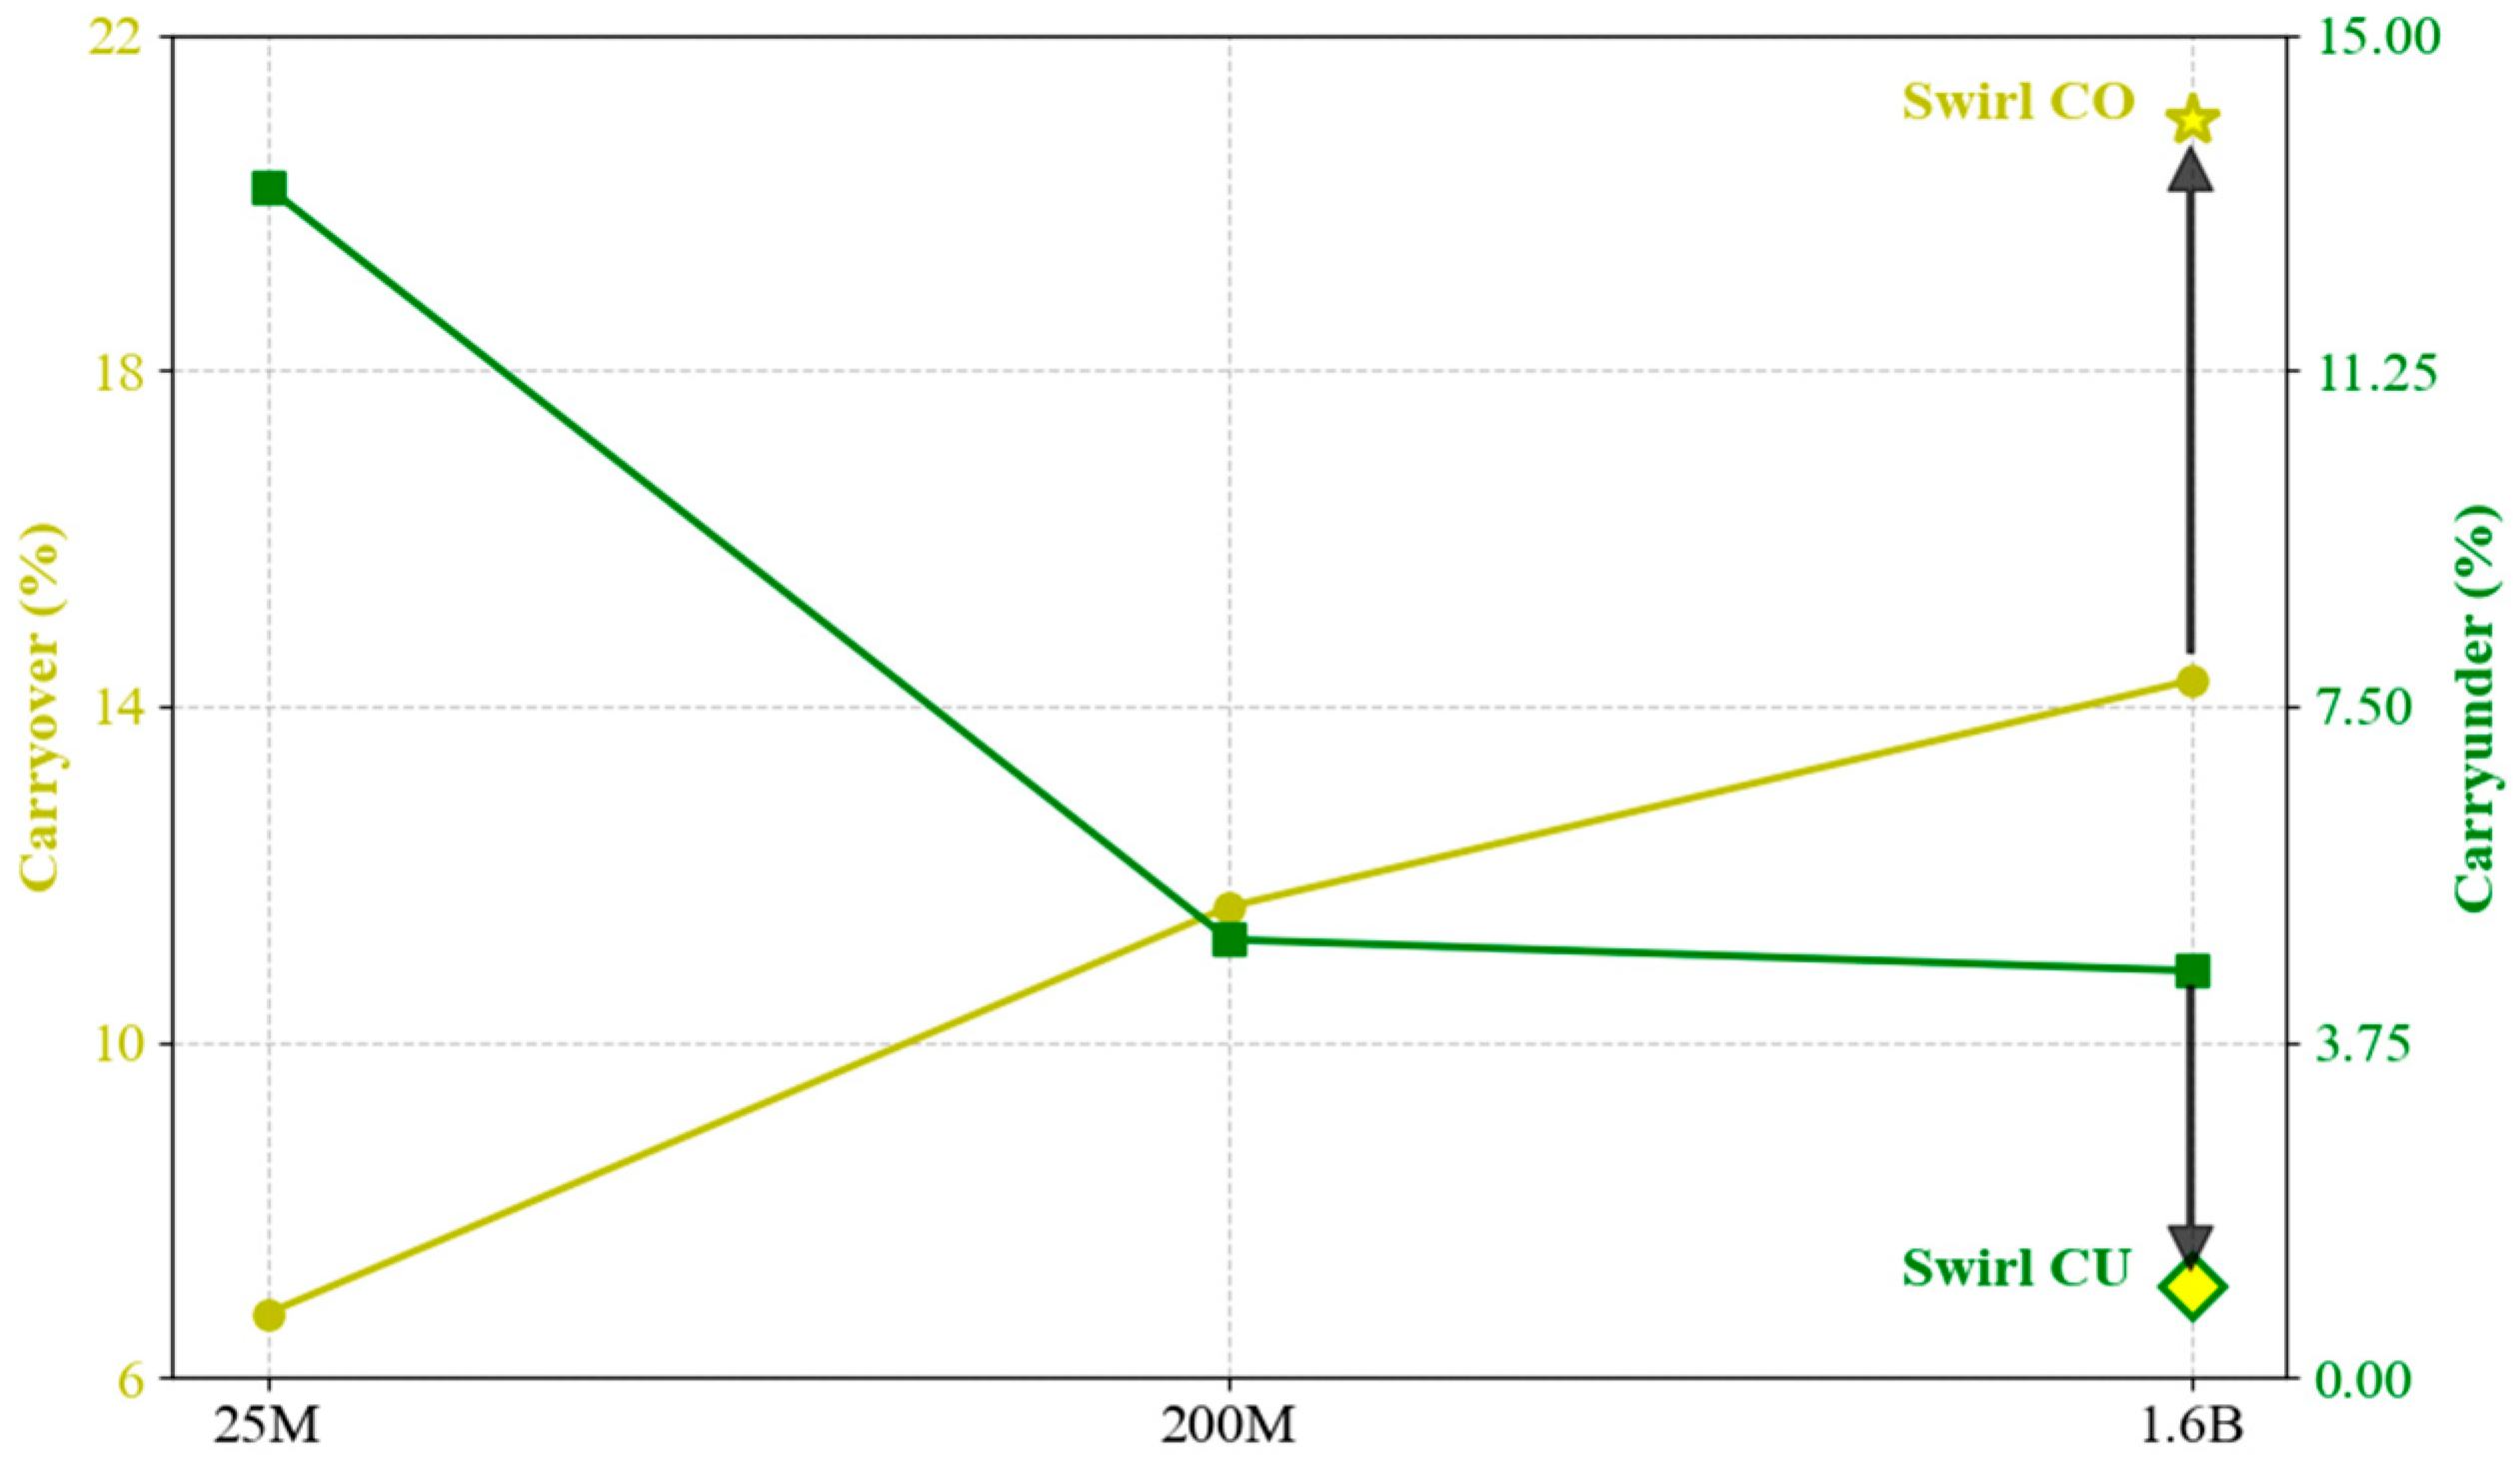
The time-averaged carryunder and carryover are plotted on top of the previous non-swirling data in Figure 22. The exact values are shown in Table 6. The greater stability of the liquid film helps prevent steam from entering the POR, causing a much lower carryunder. On the other hand, the larger film thickness that develops at the POR entrance causes more liquid entrainment and, therefore, higher carryover. Overall, the addition of the swirling velocity profile has decreased carryunder by about 77% and increased the carryover by 47%.
The carryunder here is about 1%, which is reasonable when compared to the results from [7]. In that work, a carryunder of 0.4% was measured at an inlet quality of 20%. The higher quality simulated here would create higher carryunder. Additionally, the lack of water level also increases the carryunder.

4. Conclusions

In this work, single-phase and two-phase flow simulations were conducted to investigate the flow within a BWR-type steam separator. First, very high-resolution simulations were conducted using a 30 ° wedge without a swirling velocity profile. Without the swirl, a very high steam flow was needed to maintain a reasonable liquid flow rate and flow quality. Due to the lack of swirl, the flow was very chaotic, with very large disturbance waves forming sporadically, which created large amounts of entrainment. These waves allowed significant amounts of steam to be caught by the pickoff rings, resulting in very high carryunder ( 4%).
Section 3.2 discussed the results of a single-phase simulation through a swirler geometry. It was noted that the swirler creates significant changes to both the circumferential and streamwise velocity. Specifically, the peak in streamwise velocity shifts towards the wall, while the centerline velocity drops to near zero just after the swirler.
The swirler simulation was used to design a new analytic velocity profile in a full 360 ° model geometry. With the new swirling velocity profile, the liquid film is stabilized at a much lower steam flow. However, the presence of the swirling flow creates a significant low-pressure region in the flow centerline, causing an acceleration in the steam phase there. This results in slower liquid film, which increases in size as it approaches the pickoff ring. The higher stability and thickness of the liquid film prevent most steam from entering the POR, creating a much lower carryunder. But the added film height creates more entrained liquid that bypasses the POR, causing more carryover.
The values of carryunder/carryover here are thought to be reasonable, but it is difficult to validate due to the lack of open-source data of full-scale separators operating at BWR conditions. Additionally, in the data that does exist, carryover is measured after the flow has passed through three PORs. Since only a single POR is modeled here, this adds additional complications when comparing with experiments.
Higher carryunder should be expected in this system due to the higher flow quality. However, both carryunder and carryover depend heavily on the flow rates, quality, reactor water level, and geometry of the separator. Ideally one should run many simulations, which vary these parameters to gauge the accuracy of the method.
The results shown here are significant, but there are many areas which can be improved or modified to further enhance the simulation fidelity. Utilizing proper periodic boundary conditions with the 30 ° model would allow for a higher mesh resolution and let PHASTA capture small-scale droplets/bubbles in the flow. Using a more mass-conservative numerical method like the conservative Level Set method [34] would also help in this regard. Applying the turbulent data collected from the swirler simulation would provide a more accurate inlet boundary condition for the main separator simulations. By adjusting the pressure at the POR outlets, the effect of varying water levels could also be tested. Finally, the application of some other outlet stabilization method would be preferable to the artificial increase in viscosity which is used here.
In addition to the enhancements mentioned above, the steam separator geometry provides several potential avenues for study. Using direct numerical simulation, quantities like the turbulence kinetic energy, dissipation, and Reynolds stress could be measured and analyzed throughout the geometry. Measurement of the droplet size/velocity distribution and liquid film thickness can provide important information for the improvement of multiphase CFD or system-level closure models. The separator system also generates many small droplets and bubbles, which make it a great test bed for studying new coalescence models in interface capturing methods [35]. The study of these topics is left for future work.

Author Contributions

Conceptualization, I.A.B.; Methodology, T.E.G.; Software, T.E.G.; Formal Analysis, T.E.G. and I.A.B.; Investigation, T.E.G.; Resources, I.A.B.; Writing—Original Draft, T.E.G.; Writing—Review and Editing, I.A.B.; Visualization, T.E.G.; Supervision, I.A.B.; Project Administration, I.A.B.; Funding Acquisition, I.A.B. All authors have read and agreed to the published version of the manuscript.

Funding

This work received funding from GE Hitachi Nuclear Energy through the Consortium of Nuclear Power (CNP) managed by North Carolina State University.

Data Availability Statement

The datasets presented in this article are not readily available due to the size (multiple TBs). Additionally, the binary format of the data requires specific software plugins to analyze in a tool such as ParaView. Requests to access the datasets should be directed to tegrubbs@ncsu.edu. The main code repository for PHASTA can be found on github at: https://github.com/PHASTA/phasta (accessed on 29 September 2025).

Acknowledgments

The authors would like to thank John Zino, Scott Bowman, and Charlie Heck for their technical feedback provided throughout this work. This research used resources of the Argonne Leadership Computing Facility, a U.S. Department of Energy (DOE) Office of Science user facility at Argonne National Laboratory and is based on research supported by the U.S. DOE Office of Science-Advanced Scientific Computing Research Program, under Contract No. DE-AC02-06CH11357. This research also used resources of the National Energy Research Scientific Computing Center, which is supported by the Office of Science of the U.S. Department of Energy under Contract No. DE-AC02-05CH11231. Mesh Construction performed using the Simmodeler tool by Simmetrix, Inc, Clifton Park, NY, USA.

Conflicts of Interest

The authors declare no conflicts of interest.

References

  1. Lahey, R.T.; Moody, F.J. The Thermal-Hydraulics of a Boiling Water Nuclear Reactor; American Nuclear Society: Washington, DC, USA, 1993. [Google Scholar]
  2. Kataoka, H.; Shinkai, Y.; Hosokawa, S.; Tomiyama, A. Swirling Annular Flow in a Steam Separator. J. Eng. Gas Turbines Power 2009, 131, 032904. [Google Scholar] [CrossRef]
  3. Katono, K.; Ishida, N.; Sumikawa, T.; Yasuda, K. Air–water downscaled experiments and three-dimensional two-phase flow simulations of improved steam separator for boiling water reactor. Nucl. Eng. Des. 2014, 278, 465–471. [Google Scholar] [CrossRef]
  4. Funahashi, H.; Hayashi, K.; Hosokawa, S.; Tomiyama, A. Study on two-phase swirling flows in a gas–liquid separator with three pick-off rings. Nucl. Eng. Des. 2016, 308, 205–213. [Google Scholar] [CrossRef]
  5. Funahashi, H.; Vierow Kirkland, K.; Hayashi, K.; Hosokawa, S.; Tomiyama, A. Interfacial and wall friction factors of swirling annular flow in a vertical pipe. Nucl. Eng. Des. 2018, 330, 97–105. [Google Scholar] [CrossRef]
  6. Matsubayashi, T.; Katono, K.; Hayashi, K.; Tomiyama, A. Effects of swirler shape on swirling annular flow in a gas–liquid separator. Nucl. Eng. Des. 2012, 249, 63–70. [Google Scholar] [CrossRef]
  7. Carson, W.R.; Williams, H.K. Method of Reducing Carry-Over and Reducing Pressure Drop Through Steam Separators; Combustion Engineering, Inc.: Chattanooga, TN, USA, 1980; EPRI-NP-1607, 6711746. [Google Scholar] [CrossRef]
  8. Kataoka, H.; Shinkai, Y.; Tomiyama, A. Pressure Drop in Two-Phase Swirling Flow in a Steam Separator. J. Power Energy Syst. 2009, 3, 382–392. [Google Scholar] [CrossRef]
  9. Mochizuki, H.; Hirao, Y. Development of Steam Separator Performance Analysis Code and Its Validation, (III): Validation of Code for Carryover. J. Nucl. Sci. Technol. 1994, 31, 782–795. [Google Scholar] [CrossRef]
  10. Fang, J.; Bolotnov, I.A. Bubble tracking analysis of PWR two-phase flow simulations based on the level set method. Nucl. Eng. Des. 2017, 323, 68–77. [Google Scholar] [CrossRef]
  11. Fang, J.; Cambareri, J.J.; Rasquin, M.; Gouws, A.; Balakrishnan, R.; Jansen, K.E.; Bolotnov, I.A. Interface Tracking Investigation of Geometric Effects on the Bubbly Flow in PWR Subchannels. Nucl. Sci. Eng. 2019, 193, 46–62. [Google Scholar] [CrossRef]
  12. Popov, E.L.; Mecham, N.J.; Bolotnov, I.A. Direct Numerical Simulation of Involute Channel Turbulence. J. Fluids Eng. 2024, 146, 081301. [Google Scholar] [CrossRef]
  13. Iskhakova, A.; Kondo, Y.; Tanimoto, K.; Dinh, N.T.; Bolotnov, I.A. Interface Capturing Flow Boiling Simulations in a Compact Heat Exchanger. ASME J. Heat Mass Transf. 2023, 145, 041605. [Google Scholar] [CrossRef]
  14. Fang, J.; Purser, M.K.; Smith, C.; Balakrishnan, R.; Bolotnov, I.A.; Jansen, K.E. Annular Flow Simulation Supported by Iterative In-Memory Mesh Adaptation. Nucl. Sci. Eng. 2020, 194, 676–689. [Google Scholar] [CrossRef]
  15. Rodriguez, J.M. Numerical Simulation of Two-Phase Annular Flow; Rensselaer Polytechnic Institute: Troy, NY, USA, 2009. [Google Scholar]
  16. Sussman, M.; Smereka, P.; Osher, S. A Level Set Approach for Computing Solutions to Incompressible Two-Phase Flow. J. Comput. Phys. 1994, 114, 146–159. [Google Scholar] [CrossRef]
  17. Nagrath, S. Adaptive Stabilized Finite Element Analysis of Multi-Phase Flows Using Level Set Approach; Rensselaer Polytechnic Institute: Troy, NY, USA, 2004. [Google Scholar]
  18. Whiting, C.H. Stabilized Finite Element Methods for Fluid Dynamics Using a Hierarchical Basis; Rensselaer Polytechnic Institute: Troy, NY, USA, 1999. [Google Scholar]
  19. Whiting, C.H.; Jansen, K.E. A stabilized finite element method for the incompressible Navier-Stokes equations using a hierarchical basis. Int. J. Numer. Methods Fluids 2001, 35, 93–116. [Google Scholar] [CrossRef]
  20. Brackbill, J.U.; Kothe, D.B.; Zemach, C. A continuum method for modeling surface tension. J. Comput. Phys. 1992, 100, 335–354. [Google Scholar] [CrossRef]
  21. Jansen, K.E.; Whiting, C.H.; Hulbert, G.M. A generalized-α method for integrating the filtered Navier–Stokes equations with a stabilized finite element method. Comput. Methods Appl. Mech. Eng. 2000, 190, 305–319. [Google Scholar] [CrossRef]
  22. Funahashi, H.; Hayashi, K.; Hosokawa, S.; Tomiyama, A. Improvement of separator performance with modified pick-off ring and swirler. Nucl. Eng. Des. 2017, 322, 360–367. [Google Scholar] [CrossRef]
  23. Povolny, A.; Katono, K.; Heck, C.; Zhang, Z. BWRX-300 SMR Chimney Evaluations (2): Strategy for Qualifying TRACG Evaluations of Chimney Void Fractions. In Proceedings of the 20th International Topical Meeting on Nuclear Reactor Thermal Hydraulics (NURETH-20), Washington, DC, USA, 20–25 August 2023; American Nuclear Society: Washington, DC, USA, 2023; pp. 5824–5837. [Google Scholar] [CrossRef]
  24. Grubbs, T.; Faizee, I.; Bolotnov, I.A. Interface Resolved Simulation of Two-Phase Flow within a Steam Separator Geometry. In Proceedings of the NUTHOS-14, Vancouver, BC, Canada, 25–28 August 2024. [Google Scholar]
  25. Moser, R.D.; Kim, J.; Mansour, N.N. Direct numerical simulation of turbulent channel flow up to Reτ=5200. Phys. Fluids 1999, 11, 943–945. [Google Scholar] [CrossRef]
  26. Wallis, G.B. Annular Two-Phase Flow—Part 2: Additional Effects. J. Basic Eng. 1970, 92, 73–81. [Google Scholar] [CrossRef]
  27. Tornberg, A.-K.; Engquist, B. A finite element based level-set method for multiphase flow applications. Comput. Vis. Sci. 2000, 3, 93–101. [Google Scholar] [CrossRef]
  28. Russo, G.; Smereka, P. A Remark on Computing Distance Functions. J. Comput. Phys. 2000, 163, 51–67. [Google Scholar] [CrossRef]
  29. Ibanez, D.A.; Seol, E.S.; Smith, C.W.; Shephard, M.S. PUMI: Parallel Unstructured Mesh Infrastructure. ACM Trans. Math. Softw. 2016, 42, 17. [Google Scholar] [CrossRef]
  30. Ahrens, J.; Geveci, B.; Law, C. ParaView: An End-User Tool for Large-Data Visualization. In Visualization Handbook; Elsevier: Amsterdam, The Netherlands, 2005; pp. 717–731. [Google Scholar] [CrossRef]
  31. Celik, I.B.; Ghia, U.; Roache, P.J.; Freitas, C.J. Procedure for Estimation and Reporting of Uncertainty Due to Discretization in CFD Applications. J. Fluids Eng. 2008, 130, 078001. [Google Scholar] [CrossRef]
  32. Grubbs, T.; Bolotnov, I.A. Steam Flow Simulation through the Swirler Section of a Steam Separator. In Proceedings of the ANS Advances in Thermal Hydraulics, Orlando, FL, USA, 17–21 November 2024. [Google Scholar]
  33. Grubbs, T.; Bolotnov, I.A. Interface Resolved Simulation of Two-Phase Flow within a 360 Steam Separator Geometry. In Proceedings of the the American Physical Society—Gallery of Fluid Motion, Salt Lake City, UT, USA, 24–26 November 2024. [Google Scholar] [CrossRef]
  34. Olsson, E.; Kreiss, G. A conservative level set method for two phase flow. J. Comput. Phys. 2005, 210, 225–246. [Google Scholar] [CrossRef]
  35. Talley, M.; Zimmer, M.; Bolotnov, I. Coalescence Prevention Algorithm for Level Set Method. J. Fluids Eng. 2017, 139, 081301. [Google Scholar] [CrossRef]
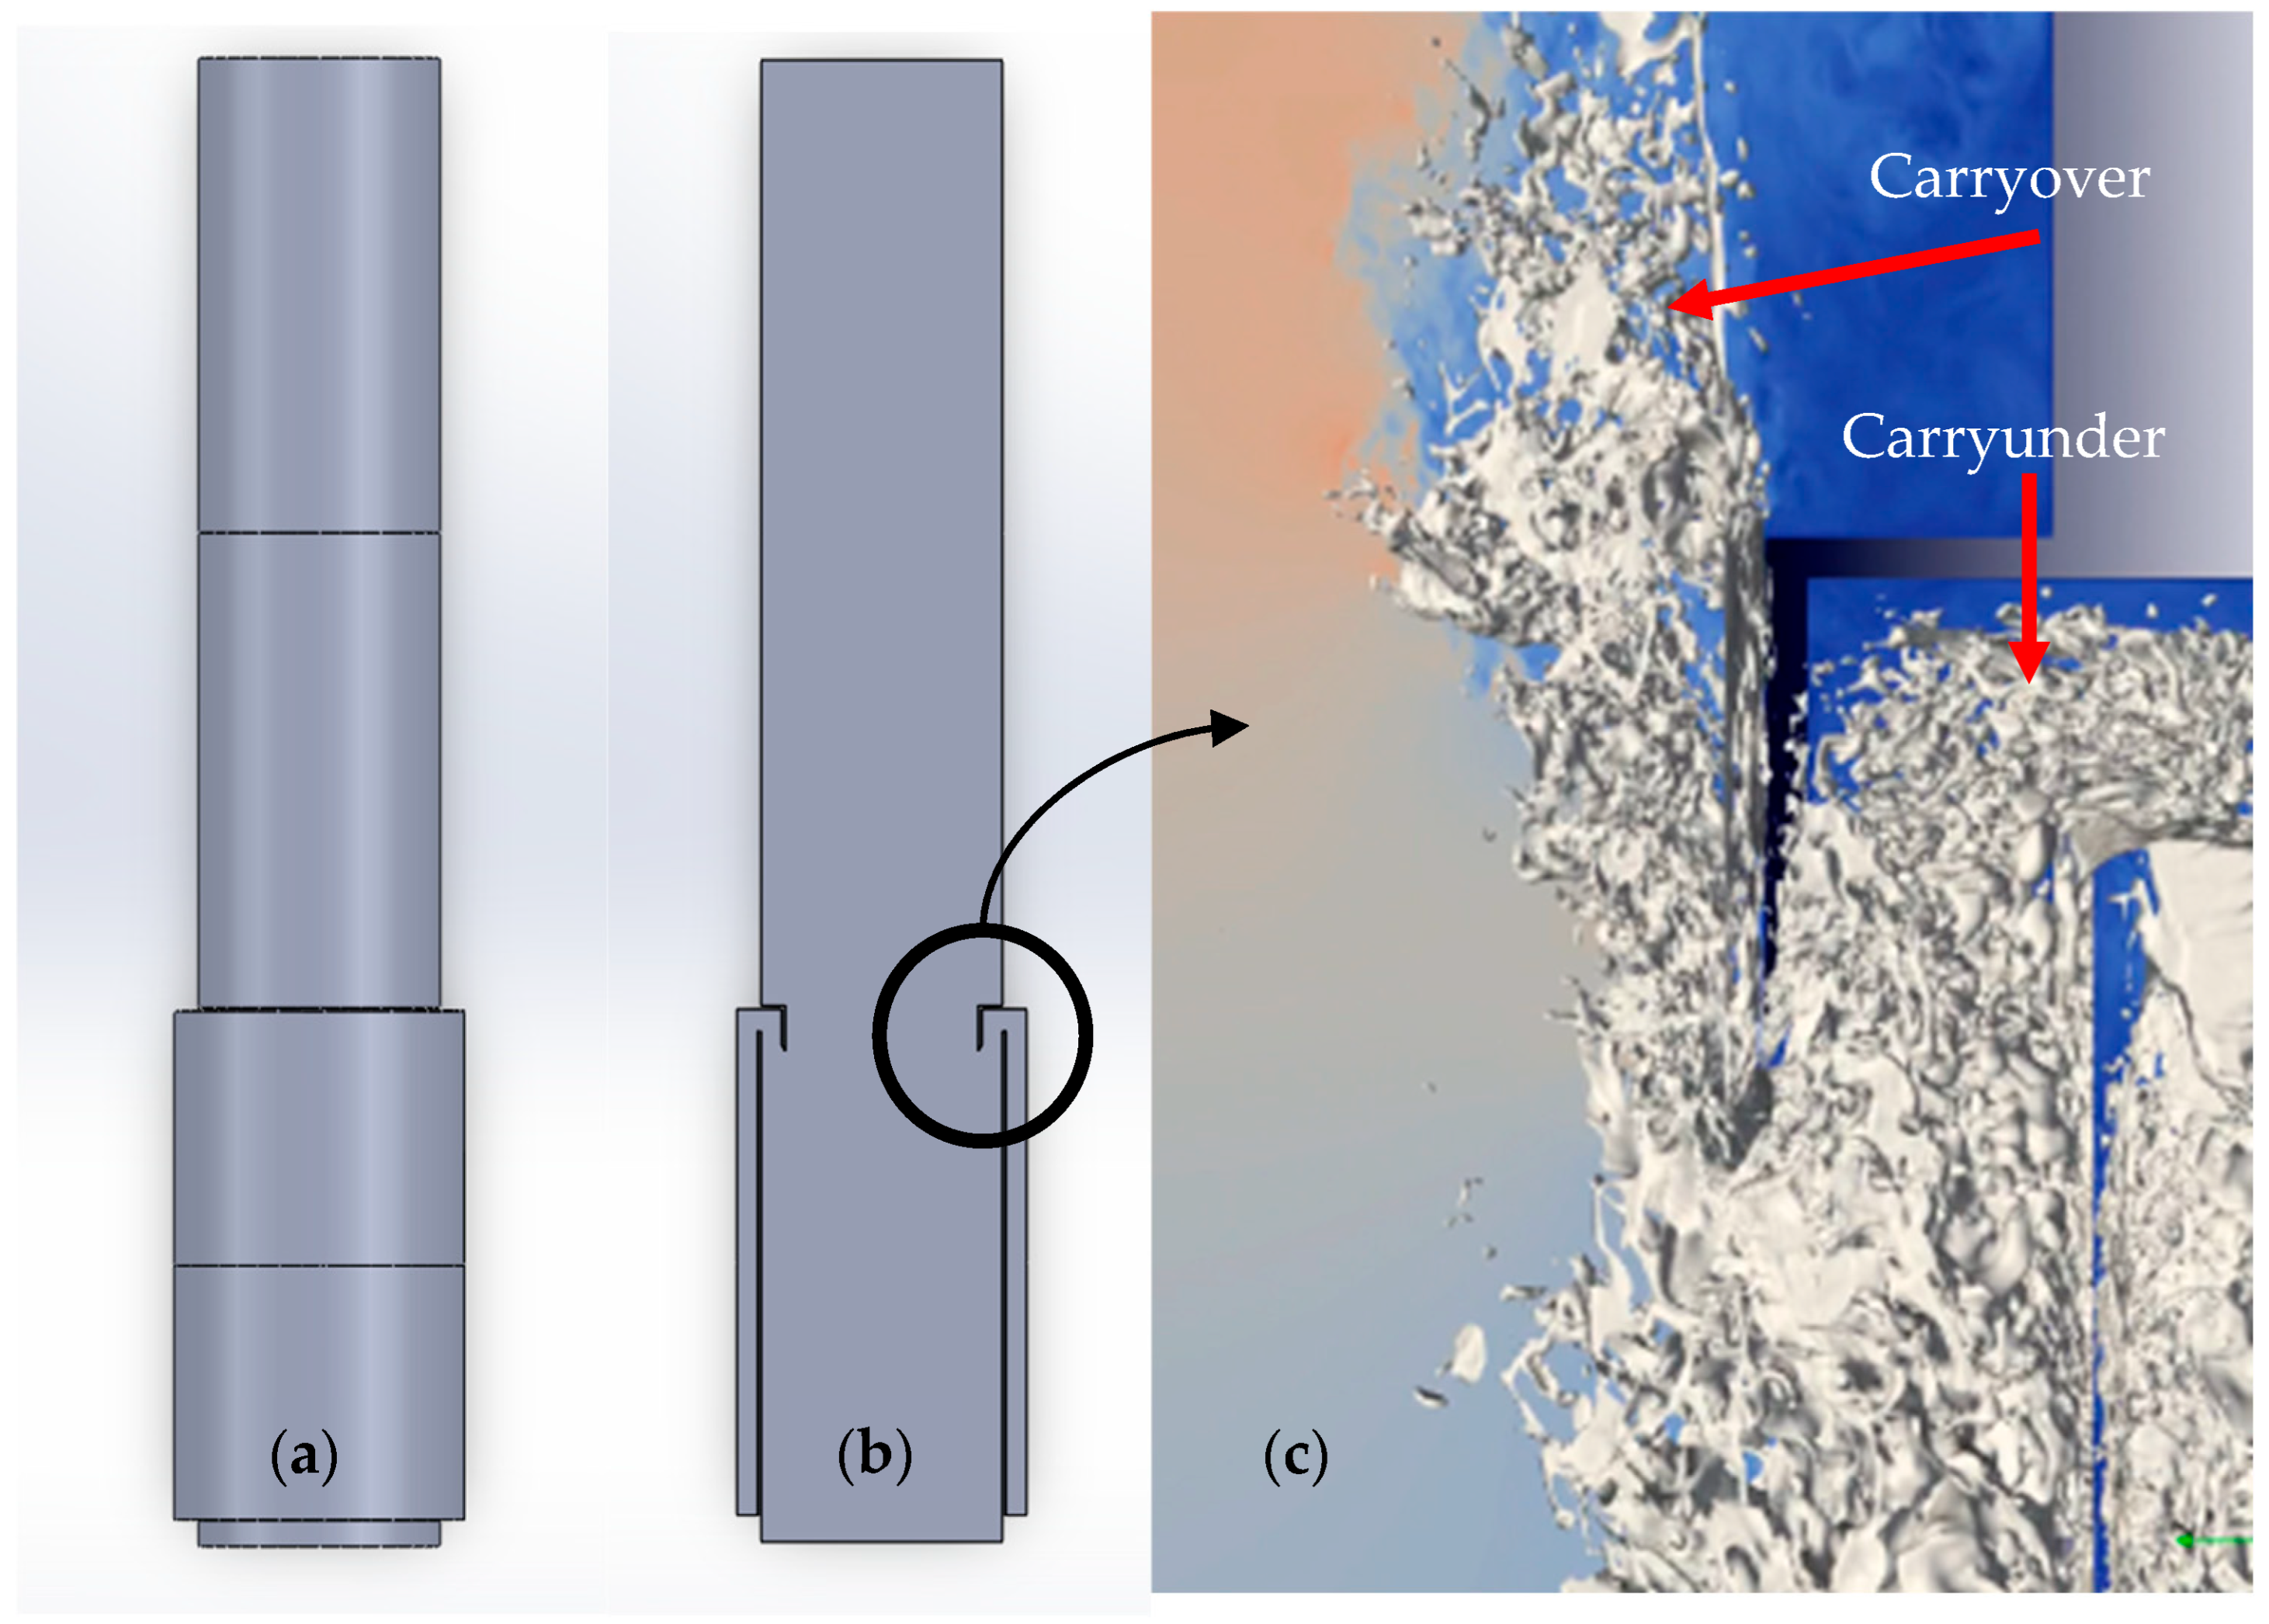
Figure 1. (a) External view of steam separator. (b) Cutaway view showing pickoff rings. (c) Demonstration of Carryover/Carryunder inside of separator. The gray material in (c) indicates the steam-water interface. In the main channel, which is mostly steam, this indicates the presence of liquid droplets. In the pickoff ring, which is mostly liquid, this indicates the presence of steam bubbles.
Jne 06 00042 g001
Figure 4. Representative mesh structure for simplified geometry: (a) shows the entire mesh, (b) shows the enhanced refinement around the pickoff ring entrance. For the example shown here, the finest element size is 0.6 mm, which is the coarsest mesh presented in the study. Reproduced from [24].
Jne 06 00042 g004
Figure 5. Inlet velocity profile used in simplified geometry. Highlighted regions indicate location and thickness of liquid film. Reproduced from [24].
Jne 06 00042 g005
Figure 6. Three-dimensional visualization of flow in (a) Coarse, (b) Intermediate, and (c) Fine mesh. Reproduced from [24].
Jne 06 00042 g006
Figure 7. Velocity field beyond pickoff ring in finest mesh case. Small under-resolved droplets can also be seen just before they disappear.
Jne 06 00042 g007
Figure 8. (Left) Example of low carryover period. (Right) Example of high carryover generated by a disturbance wave.
Jne 06 00042 g008
Figure 9. Slices used to calculate quantities of interest. Gray fog is the steam-water interface rendered with some transparency to visualize the separator geometry around the measurement planes. Reproduced from [24].
Jne 06 00042 g009
Figure 10. Average QOIs measured using the procedure described in the text. Error bars are created from the range (min and max values) of the random samples. Circles indicate the mean values. Reproduced from [24].
Jne 06 00042 g010
Figure 11. Swirler model and simulated geometry. Reproduced from [32].
Jne 06 00042 g011
Figure 12. Mesh design in swirler simulation. Reproduced from [32].
Jne 06 00042 g012
Figure 13. Snapshot of instantaneous velocity field in swirler simulation. Reproduced from [32].
Jne 06 00042 g013
Figure 14. Streamwise and circumferential velocity profiles averaged over about 0.14 s of simulated time. Velocity units are in m/s. Reproduced from [32].
Jne 06 00042 g014
Figure 15. Mesh design for 360 ° model geometry. Lower image shows close-up view of pickoff ring area.
Jne 06 00042 g015
Figure 16. Velocity profiles used to approximate the swirling profile. “Gas” and “Liquid” refer to the streamwise velocity components of the two phases.
Jne 06 00042 g016
Figure 17. Snapshot of 360 ° model simulation. Here, the camera is directed downward towards the bottom of the separator. A cross-sectional slice shows the velocity field near the pickoff ring. The gray interface shows the presence of many small-scale droplets and structures that are formed in the liquid film and pickoff ring. Full video published in [33].
Jne 06 00042 g017
Figure 18. Alternate views of 360 ° simulation using different slices to show velocity field. Interface is shown in gray, with some transparency to see the velocity field behind it. Left: Streamwise slice. Right: Cross-sectional slice at pickoff ring. Full video published in [33].
Jne 06 00042 g018
Figure 19. Instantaneous quantities measured in the 360 ° case. “Downstream” here refers to the pickoff ring entrance location.
Jne 06 00042 g019
Figure 20. Demonstration of high-speed steam core created by swirling annular flow. Interface shown in plane as a white line. (Left) Streamwise velocity field. (Right) Pressure field.
Jne 06 00042 g020
Figure 21. Void fraction measured over time at the POR by measuring phasic area on a cross-sectional slice.
Jne 06 00042 g021
Figure 22. Carryover and carryunder data from Section 3.1, with new data from swirling geometry overlaid.
Jne 06 00042 g022
Table 1. Fluid and flow parameters for simplified geometry tests.
Water Density (kg/m3)736.65
Steam Density (kg/m3)37.5
Water Viscosity (Pa s)2.27 × 10⁻³
Steam Viscosity (Pa s)4.85 × 10⁻⁴
Surface Tension Coefficient (N/m)0.02
Inlet Superficial Gas Velocity (m/s)6.45
Inlet Superficial Liquid Velocity (m/s)0.55
Inlet Flow Quality (%)37.2
Inlet Void Fraction0.795
Table 2. Summary of different meshes used in simplified geometry.
NameSmallest Element SizeElement CountSimulated TimeElements per CoreCore Hours Used
Coarse0.6 mm25 million0.94 s30520.126 million
Intermediate0.3 mm200 million0.91 s61032.45 million
Fine0.15 mm1.6 billion0.24 s24,4146.44 million
Table 3. GCI calculations for simplified model geometry.
QuantityOrder of ConvergenceGCI
Void Fraction5.400.01%
Film Thickness5.780.02%
Carryover0.8529.42%
Carryunder4.610.4%
Table 4. Relevant parameters for swirler simulation.
Steam Density (kg/m3)37.5
Steam Viscosity (Pa s)1.94 × 10⁻⁵
Inlet Velocity (m/s)3.75
Inlet Volumetric flow rate (m3/s)0.145
Mesh size (millions of elements)5.43
Bulk   Δ y + 90
Table 5. Fluid and flow parameters for 360 ° geometry tests.
Water Density (kg/m3)736.65
Steam Density (kg/m3)37.5
Water Viscosity (Pa s)9.06 × 10⁻⁵
Steam Viscosity (Pa s)1.94 × 10⁻⁵
Surface Tension Coefficient (N/m)0.02
Inlet Superficial Gas Velocity (m/s)3.975
Inlet Superficial Liquid Velocity (m/s)0.46
Inlet Flow Quality (%)30.5
Inlet Void Fraction/Film Thickness0.84/9 mm
Table 6. Change in carryunder/carryover when swirl is present. The result from the finest mesh is used for the “No swirl” result.
CaseCarryunder (%)Carryover (%)
No swirl4.5414.3
With swirl1.0221.0
Disclaimer/Publisher’s Note: The statements, opinions and data contained in all publications are solely those of the individual author(s) and contributor(s) and not of MDPI and/or the editor(s). MDPI and/or the editor(s) disclaim responsibility for any injury to people or property resulting from any ideas, methods, instructions or products referred to in the content.