1. Introduction
Radioactive waste management requires the ability to quickly and accurately detect the presence and quantity of special nuclear material (SNM) [
1,
2]. Modern waste production and management has “robust, traceable, necessary, and sufficient” characterization processes in place to fulfill this requirement [
2]. However, historical or legacy waste (produced before modern management standards were in place) can have incomplete histories and even unknown processes of origin; for example, an unlabeled waste drum in storage [
2]. This lack of knowledge necessitates additional verification of the drum’s content, including its chemical and radiological compositions [
2]. This verification can be both time-consuming and cost-inefficient. The most accurate verification methods, such as destructive assay (DA), require dedicated facilities and have turnarounds ranging from half a day to two weeks, whereas less time-intensive but higher-uncertainty nondestructive assay (NDA) methods can provide results within 15 min to 1 h [
3]. For this reason, nondestructive assay methods are often chosen as the verification method to reduce operational impact and package disturbance [
3]. Ultimately, the applicability of a DA or NDA technique to a given scenario will depend on the information sought and operational constraints.
Countries producing radioactive waste often develop disposal and storage standards based on both their own national safety policies and international standards [
4]. In this work, we adopted the regulatory policy of the United Kingdom (UK) and its requirement for waste stream classification. The UK has two criteria for the classification of radioactive waste: the activity present and the heat generated from this activity [
5]. Based on these criteria, radioactive waste is separated into four categories: high-level waste (HLW), intermediate-level waste (ILW), low-level waste (LLW), and very-low-level waste (VLLW). These waste categories have different requirements for handling, shielding, cooling, and security that can drastically affect the cost associated with disposal.
The UK framework is interesting because it presents the challenge of distinguishing between low-level waste (LLW) and intermediate-level waste (ILW). ILW is defined as radioactive waste exceeding 4 gigabecquerels per tonne (GBq/t) of alpha activity or 12 GBq/t of beta-gamma activity, but not producing sufficient heat to influence the design of storage or disposal facilities [
5]. In the United States, the analog classification would be transuranic (TRU) waste, which is defined as waste containing more than 100 nanocuries (3700 Bq) of long-lived (half-lives greater than 20 years) alpha-emitting transuranic isotopes per gram (i.e., 3.7 GBq/t) [
6]. Similarly, the International Atomic Energy Agency (IAEA) provides general guidance on defining this LLW/ILW threshold, providing a limit for long-lived alpha emitters of 400 Bq/g on average and up to 4000 Bq/g (i.e., 4.0 GBq/t) for individual packages [
7]. Because waste classification drives design and regulatory decisions, falsely categorizing waste can come with significant financial, regulatory, and security costs [
4], such as mischaracterizing legacy plutonium-contaminated waste. Furthermore, material controls and accountability (MC&A)—an assurance program for preventing the misuse, theft, or diversion of nuclear material—is an integral part of the operation and security of nuclear facilities [
8]. For facilities managing large quantities of waste, their MC&A efforts can reach bottlenecks if the assay techniques require long measurement times that throttle throughput.
The uranium and plutonium in SNM are low-activity gamma emitters. Furthermore, their gamma rays can be easily shielded by the waste matrix or the liner of the drum itself. In the presence of other radioisotopes (137Cs, 152Eu, etc.), the gamma-ray background that they produce can easily overwhelm the gamma-ray signature of Pu and U. For this reason, it is of further interest to study U and Pu in waste packages by leveraging the neutron signal.
Current neutron-based nondestructive waste assay methods for SNM generally consist of passive or active detection systems. With passive systems, such as the High Level Neutron Coincidence Counter [
9] and Inventory Sample Neutron Coincidence Counter [
10], relying on spontaneous fission neutrons and active systems, such as the Active Well Coincidence Counter [
1,
11] and fast neutron portal monitor [
12], relying on induced fission neutrons. The more recent Epi-Thermal Multiplicity Counter [
13,
14] and Fieldable Nuclear Materials Identification System (FNMIS) [
15] are capable of both passive and active detection. The downside of each is largely due to their inability to verify larger waste containers as they are intended for small sample analysis or—in the case of portal monitors and FNMIS—not intended for waste analysis.
In recent years, active interrogation using pulsed neutron generators has been in development [
16,
17,
18,
19]. The Differential Die-Away (DDA) technique stands out as a prominent method for neutron active interrogation [
20]. This technique utilizes a neutron generator (typically produced by the deuterium-tritium (D-T) fusion reaction) to induce fission in fissile materials like
235U and
239Pu [
20] and is generally performed with moderated
3He or BF
3 neutron detectors [
21]. However, moderation and the high-energy 14.1 MeV neutrons from the D-T generator impede the capability of neutron spectroscopy by introducing background over the fission energy range. Adding a low-background neutron signal attributed to fission may improve both the accuracy and speed of interrogation measurements by using a 2.45 MeV deuterium-deuterium (D-D) neutron generator [
22]. In contrast, a D-T generator would (after some scattering) create a background signal that overlaps with the induced fission neutron spectrum. Additionally, the active background from the interrogating neutron generator in fast neutron detectors decays away almost instantaneously when compared to thermal detection systems (
3He or BF
3) [
23].
For these reasons, there has been significant interest in using neutron detectors with fast neutron spectroscopic capabilities, such as liquid scintillators [
24,
25,
26] or
4He detectors [
22,
27,
28]. Many detectors have neutron spectroscopic capabilities and could be used for this application. Liquid scintillators have nanosecond timing resolution and can detect and distinguish between neutrons and gamma-rays with digital pulse-shape discrimination. Comparing liquid scintillators and
4He detectors [
29], both technologies can perform neutron spectroscopy, but
4He detectors are distinguished by their excellent gamma-ray discrimination capabilities. Their high gamma-ray rejection rate removes the need for pulse shape discrimination [
30,
31,
32]. For radioactive waste with a potentially significant gamma-ray source term, the
4He detectors stand out for active interrogation with energy discrimination analysis (EDA), which detects induced fission neutrons above the D-D generator energy. This EDA relies on the capability of
4He to preserve incident neutron energy information through a linear scintillation light response [
31] and isolate the fission neutron signal above the energy of the D-D generator, namely 2.45 MeV. This is because this ability could enable the implementation of safeguards and MC&A in the nuclear fuel cycle where the gamma-ray background is prohibitively high, such as for small quantities of spent nuclear fuel and reprocessed
233U.
In this paper, we characterize the combination of a DDA measurement and an EDA measurement of SNM, utilizing a neutron signature above 2.45 MeV. We characterize a
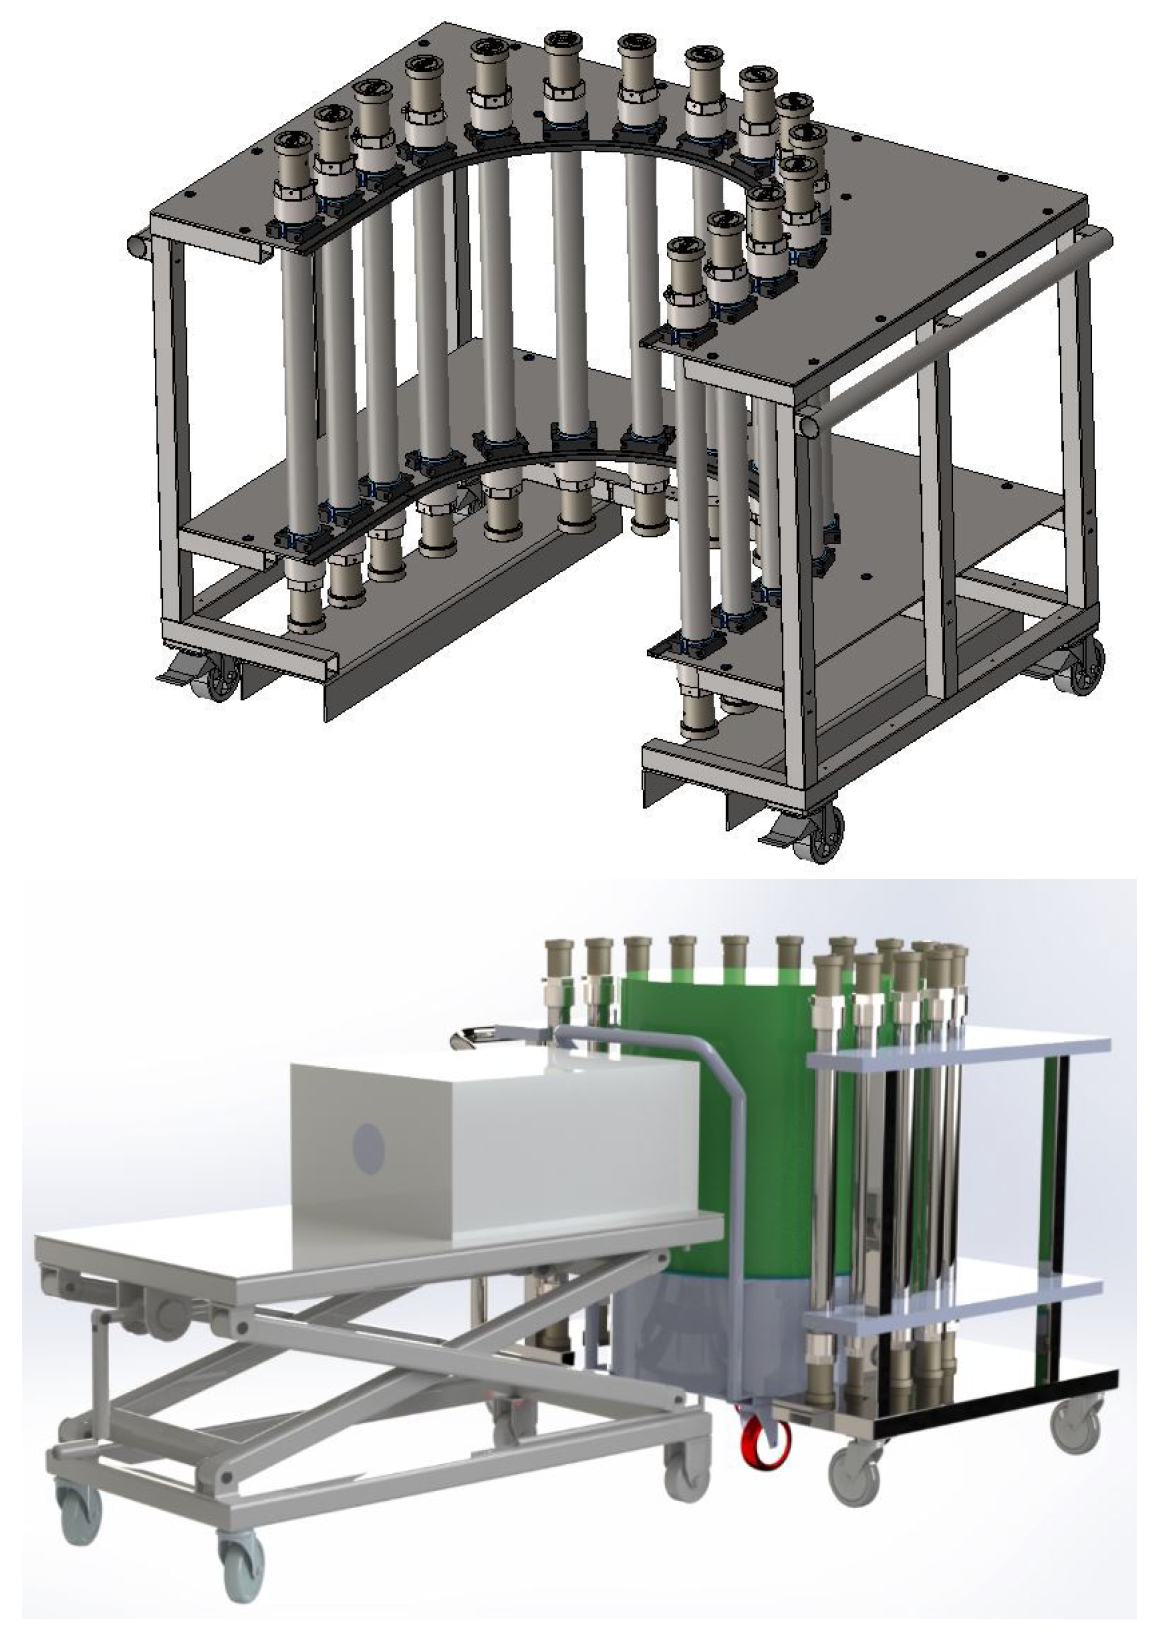
4He based fast-neutron detection system, which is presented in
Figure 1. Specifically, we assess its ability to detect the presence of Pu with active interrogation measurements, utilizing fast-neutron Differential Die-Away and energy discrimination signatures. The study was conducted using MCNP
® version 6.30 [
33], and a variety of waste compositions in a 200 L drum were analyzed. These MCNP simulations modeled a D-D pulsed neutron source and an array of
4He detectors. This study built MCNP models to explore the possibility of combining EDA and DDA signals to lead to a faster waste categorization time compared to the traditional DDA approach without neutron spectroscopy.
2. Materials and Methods
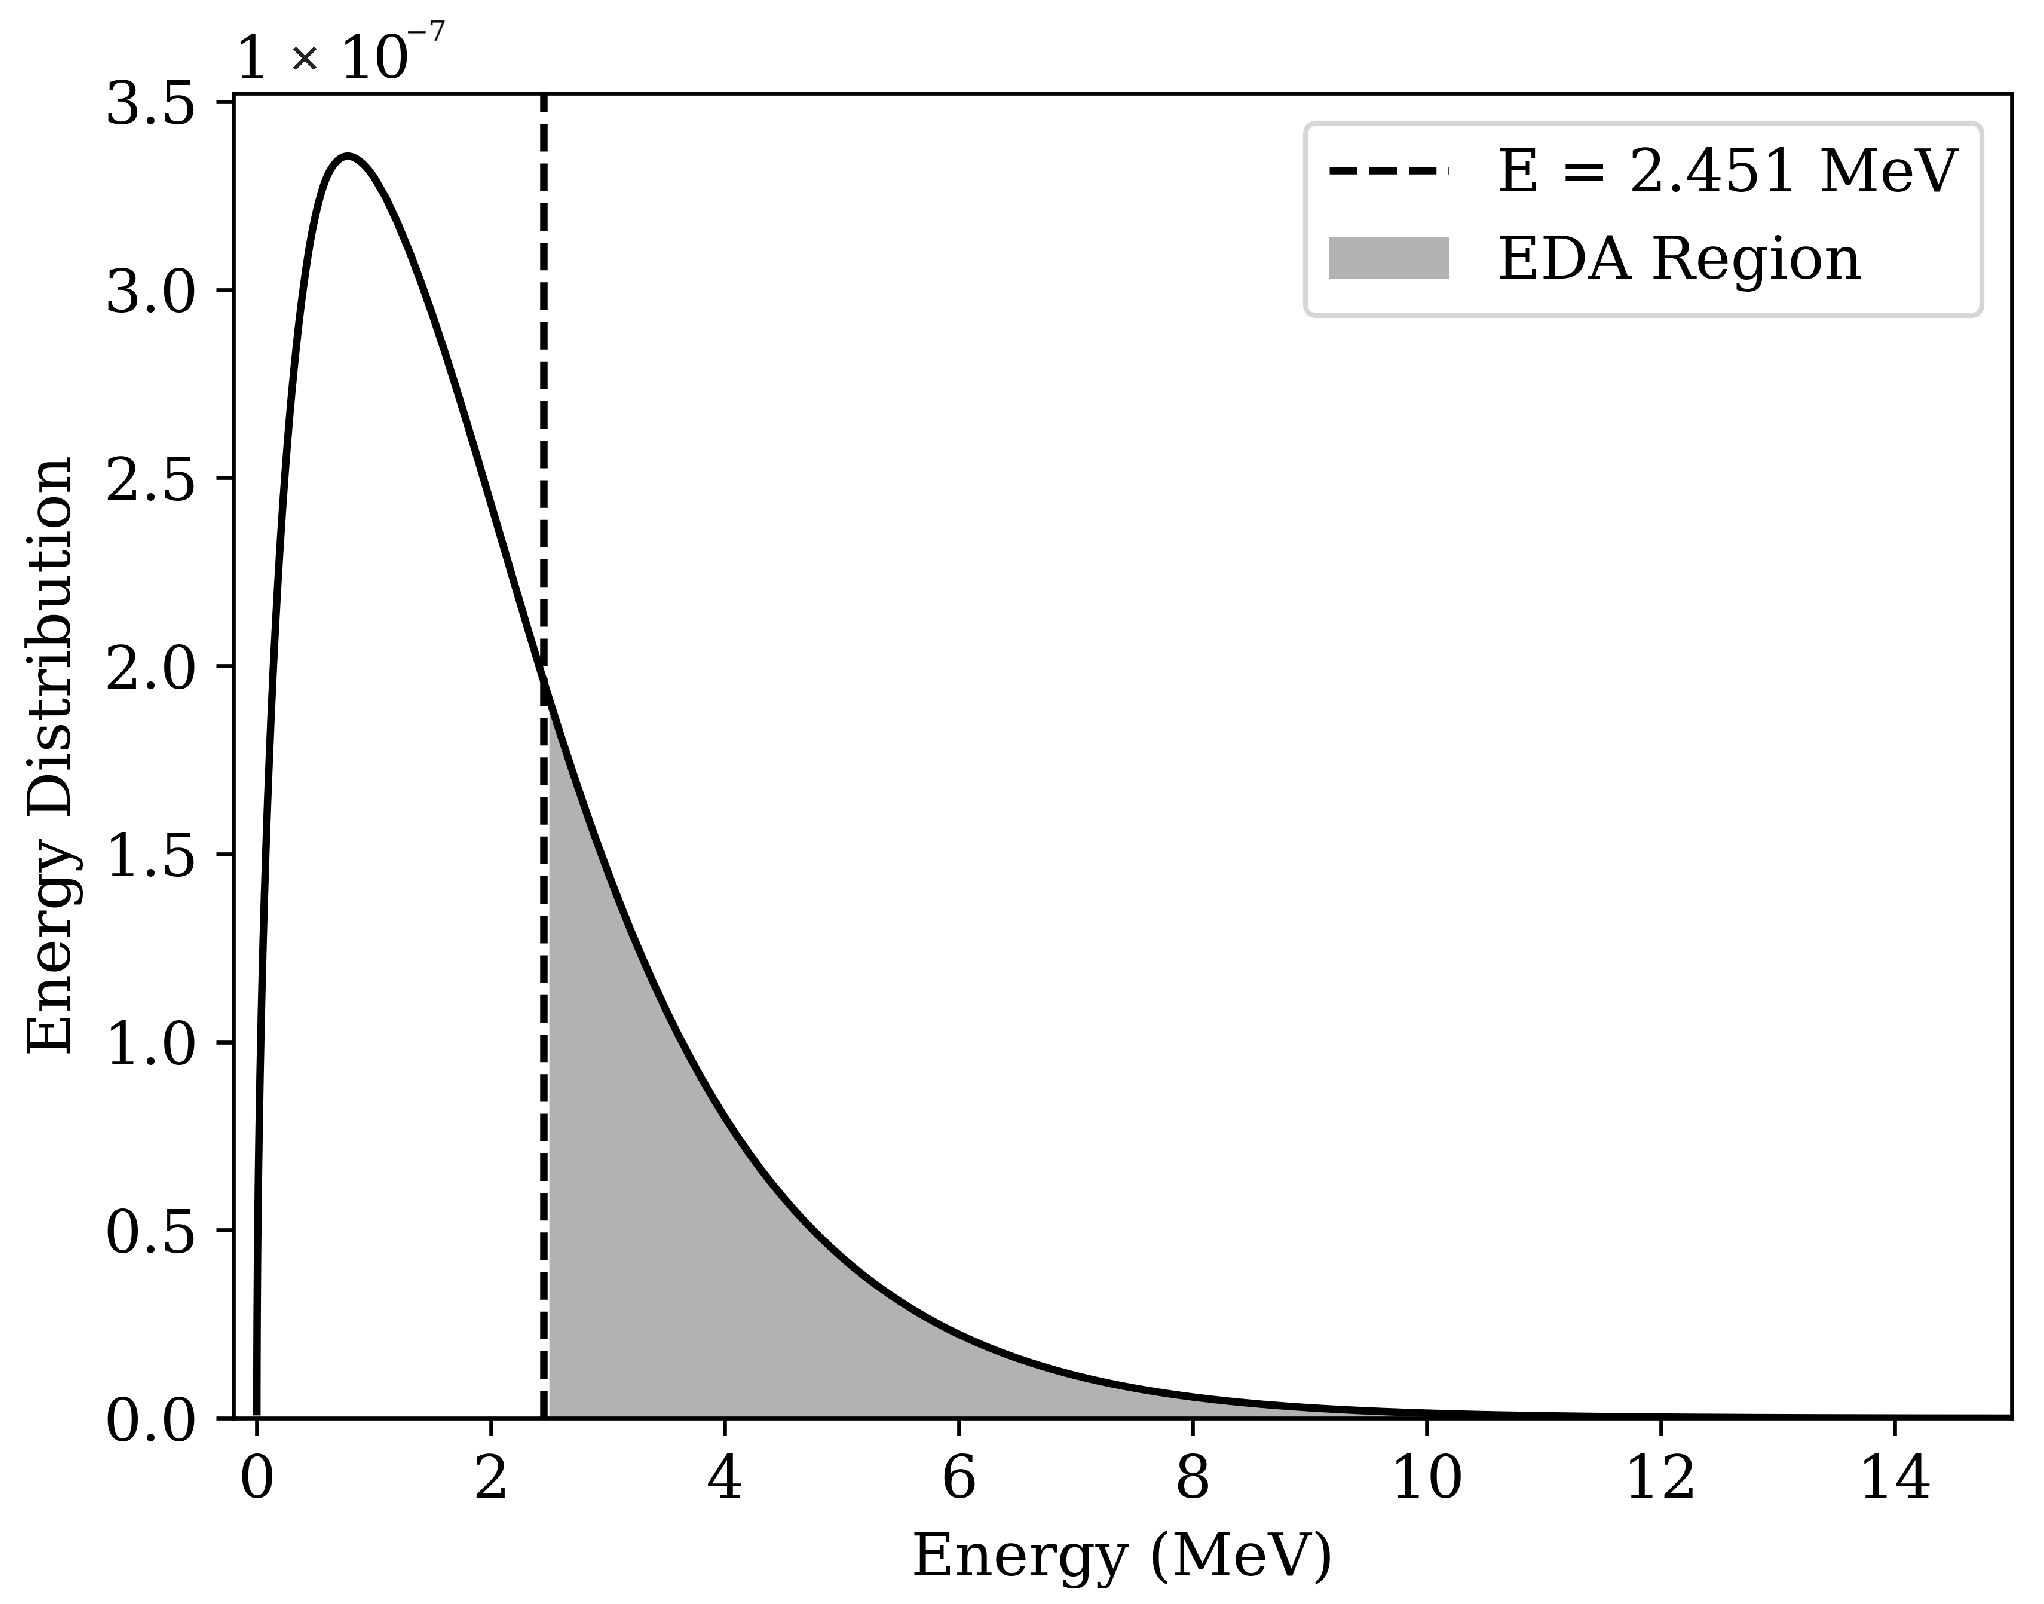
The proposed assay method utilizes a D-D neutron generator to pulse neutrons into a waste container for the observation of the resulting induced fission events. An active interrogation setup should ideally detect neutrons as efficiently as possible and discriminate between fission neutrons and neutrons from the interrogating source. The investigated technology leverages both the DDA temporal signal and the energy-dependent signal via EDA. The goal of EDA is to identify the 26% of fission neutrons shaded in
Figure 2, which exceed the energy of neutrons emitted by D-D generators and consequently correspond to fission alone [
22].
These two signals have complementary signatures because EDA is sensitive to fission neutrons above 2.45 MeV at all times, while DDA is sensitive to fission neutrons after the pulse at all energies. This application is reflected in
Figure 3, which presents the DDA and EDA signals in a hypothetical system containing fissile material. The left of the figure shows the DDA signal when no fissile material is present, and the right shows the signal when there is fissile material. The figure highlights how a traditional temporal DDA signal can be further broken down into DDA and EDA signals, but that the EDA signal only makes up a fraction of all detected neutrons.
An interrogated waste drum produces signals that include background neutrons directly from the generator
that have a maximum neutron energy of ∼2.45 MeV. It generates an EDA signal
of induced-fission neutrons, having some energy greater than 2.45 MeV, and a DDA signal
. The
term is described by
, Equation (
1), and is a function of the energy-dependent neutron flux from the neutron generator, scattering in the drum and environment, geometric detector efficiency
, and energy-dependent intrinsic efficiency of the detector
to neutron energies less than 2.45 MeV. A background signal
was added as a catch-all measure for both the ambient neutron flux profile at the measurement location and other neutron sources possibly present in the waste, such as
reactions or spontaneous fission from transuranics.
The EDA and DDA signals (
and
) are parameterized with Equations (
3) and (
4), respectively.
minimizes the effects of the generator background by discriminating neutrons with energies greater than 2.45 MeV. Importantly, energy discrimination means that
includes fission neutron information during and after the neutron pulse. In contrast, the DDA signal uses neutron events after the neutron pulse ends where the
term becomes negligible. The DDA source is additionally described by the energy-dependent macroscopic fission cross-section
, the energy-dependent fission neutron spectrum
, and the characteristic die-away time
of the generator, moderator, drum, and waste system. It is integrated from the time the pulse turns off
to the end of the pulse cycle
.
2.1. Performance Assessment
This work investigated the ability of the system to classify ILW containing fissile radionuclides. The UK Nuclear Decommissioning Authority [
35] suggests a 95% confidence interval for solid radioactive waste characterization. This confidence interval corresponds to a 2
increase in the EDA and DDA neutron signals and was used to specify a positive detection threshold above background. Equation (
5) shows the measurement time optimization, which provides the optimal time condition in Equation (
6), where
t is the fixed total count time and
, where
is the background count measurement time and
is the signal plus background measurement time [
36].
B is the background count rate and
S is the signal count rate. Here,
B is found from an independent measurement without fissile material present, using the same waste drum, neutron generator, and detector configuration. The total (
T) is found with a second measurement with both background and source present (
). Following these measurements,
S can be found by subtracting
B from
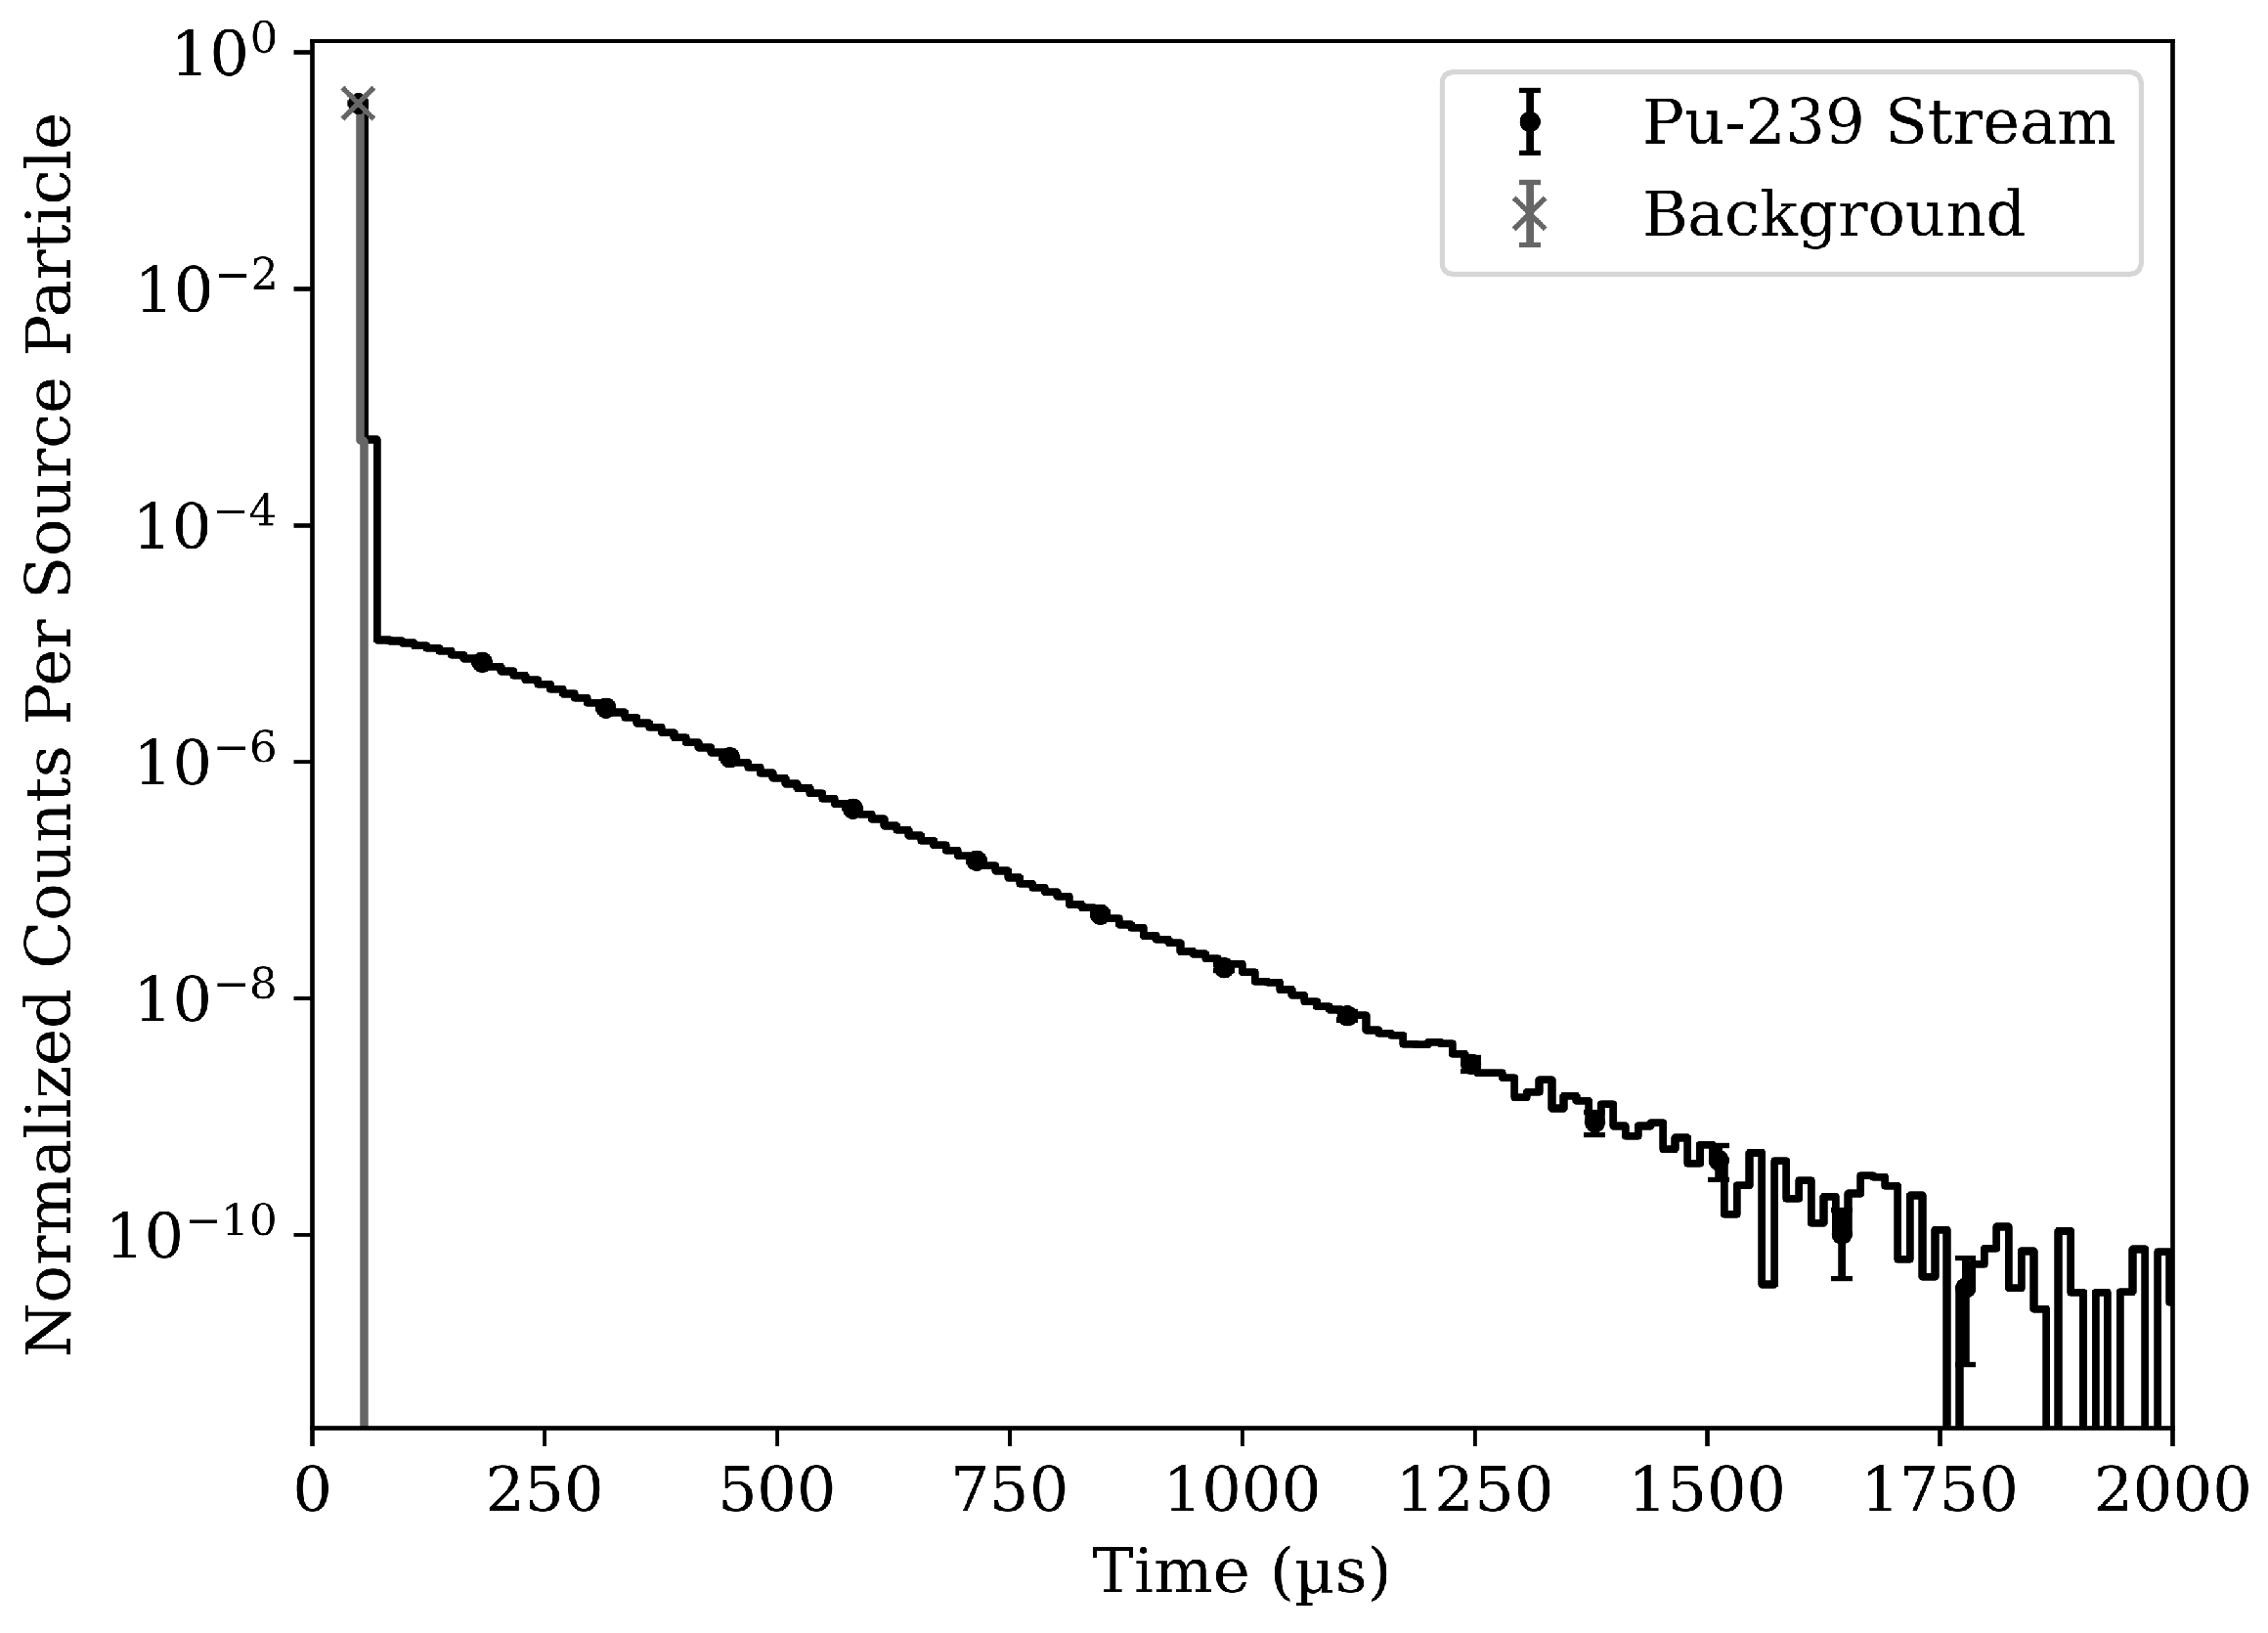
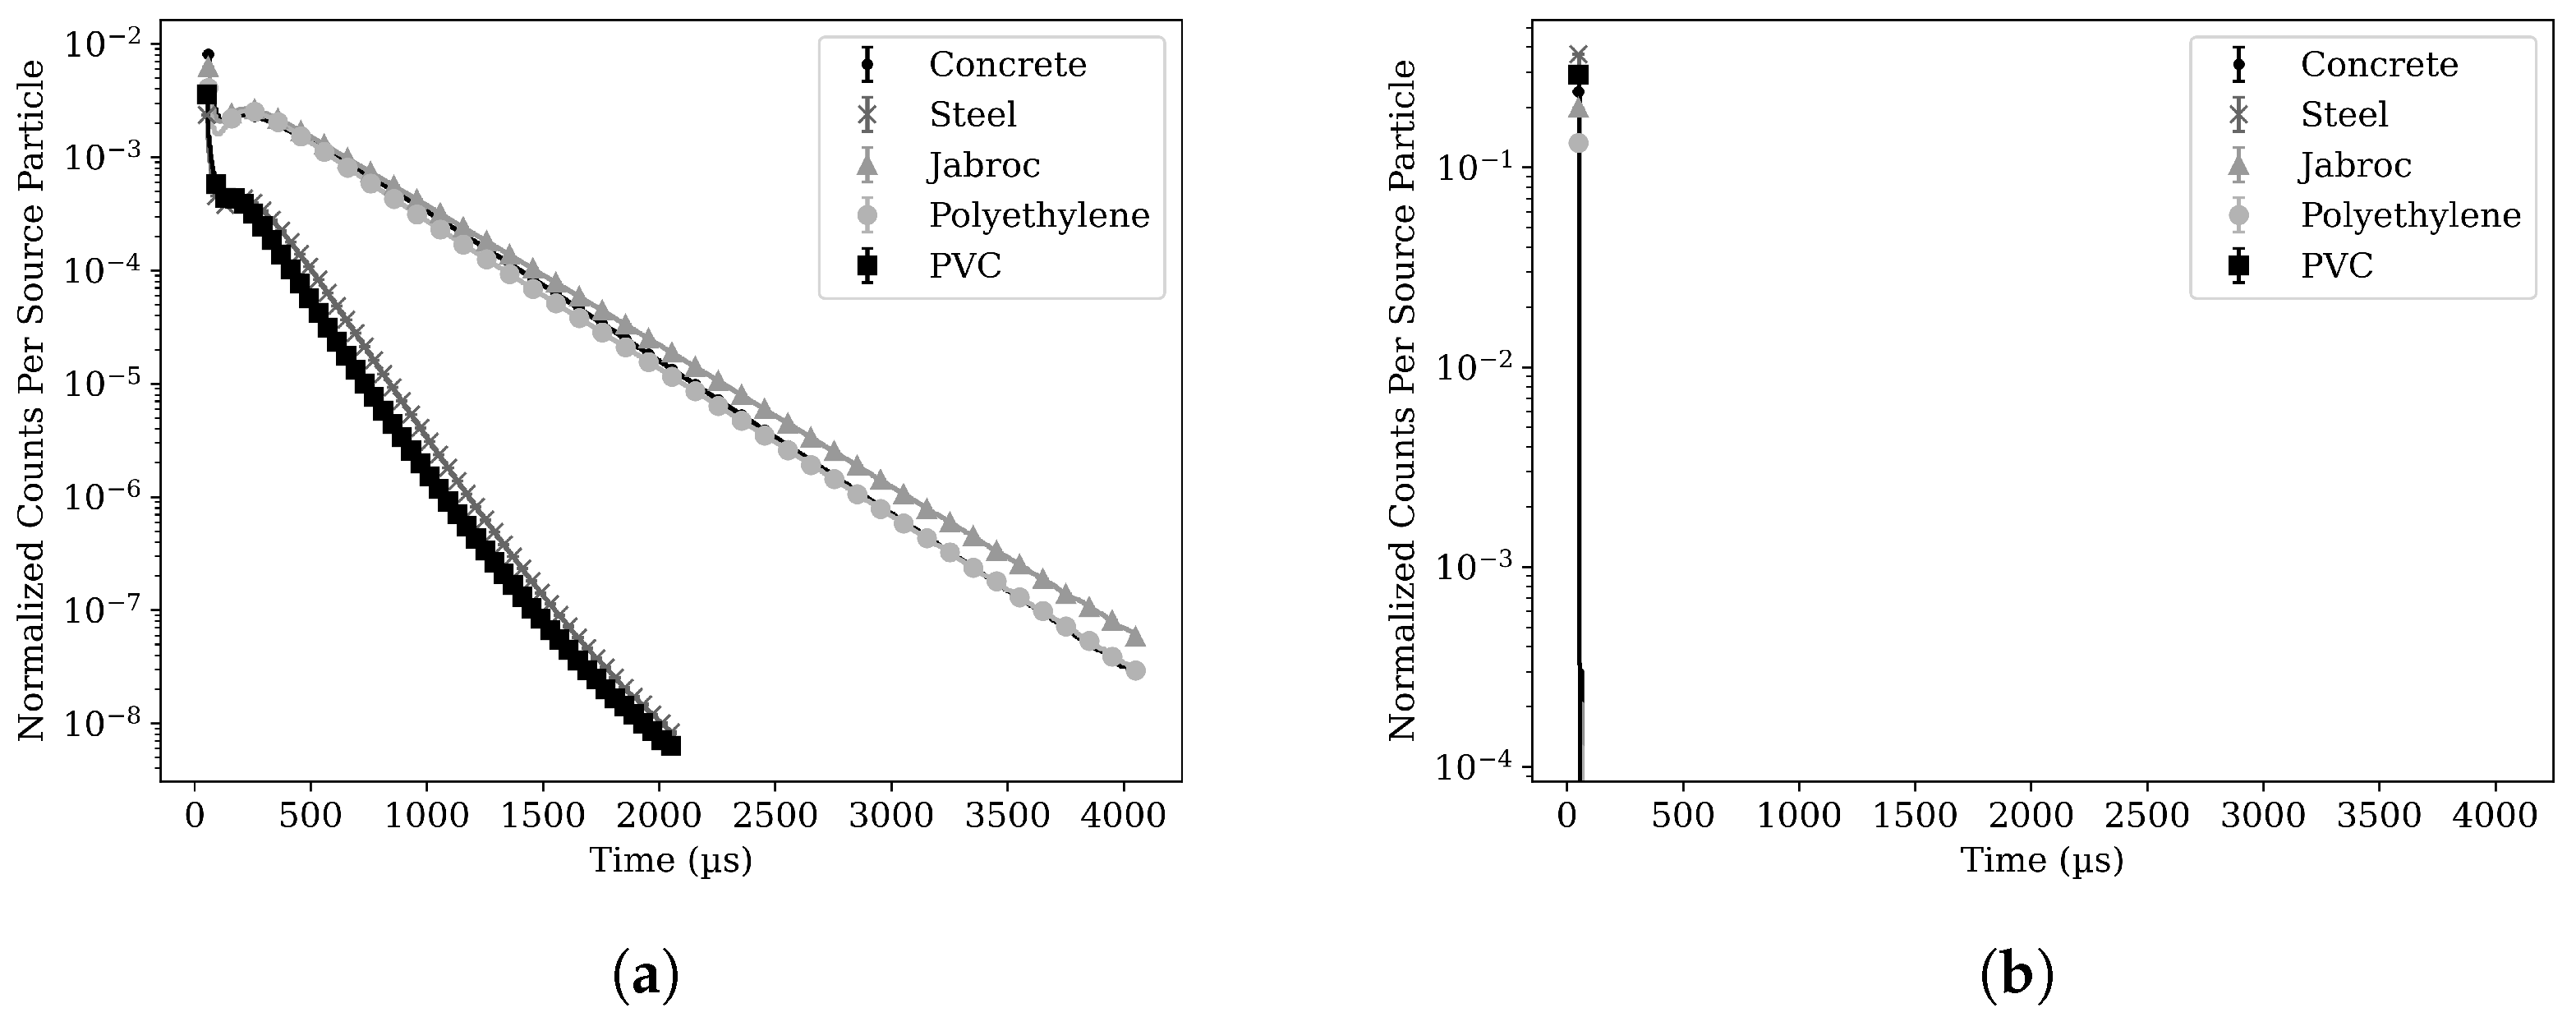
T. An example of the neutron DDA signal in steel can be seen in
Figure 4, which compares the source signal curves to the background signal curve.
The uncertainty in the two measurements is estimated assuming a Poisson process (e.g.,
for
N counts), which is then propagated to the uncertainty in
S. The optimal division of time for a counting experiment is described by Equation (
6). This optimization has the figure of merit (FOM) described by Equation (
7), which depends on the inverse of the total time (
t) needed to determine
S within a given statistical accuracy [
36]. The following detection time calculations use this FOM to determine the measurement time needed to reach the chosen detection confidence [
36]. The detection time will depend on the waste target threshold (LLW, ILW, or HLW), the strength of the neutron generator, the detection efficiency, and the background strength. With both a background and source measurement, Equation (
7) describes the total time needed to determine
S with a given accuracy [
36], where
.
For the EDA and DDA analysis, the signal and background terms are split into EDA and DDA components. The DDA background, , is the integrated neutron count rate after the end of the generator pulse when fissile material is not present (). The DDA signal, , is the integrated neutron count rate after the end of the neutron pulse but with fissile material present (and after subtraction of the background). The EDA background, , is the integrated neutron count rate with energy greater than 2.45 MeV produced during and after the neutron pulse for a measurement without fissile material present (). Finally, the EDA signal, is the count rate of all neutrons above 2.45 MeV with fissile material present during and after the neutron pulse.
The EDA and DDA signals are Poisson counting processes, with the EDA signal being only partially correlated with the DDA signal as EDA events are a subset of DDA after the start time of the latter. We will ignore this correlation here. Therefore, Equation (
8) gives the combined detection time, where
t is the total count time. The total signals
and
are defined as the sum of the respective signal (
S) and background (
B) components:
.
Each of these terms is used to assess how the detection system performs for different waste streams. In this study, the background and composition were defined for the edge of ILW or 4 GBq per ton of alpha emitters [
5]. The measurement time to detect ILW was then determined. The goal was to determine if the EDA signal can lower the detection time threshold compared to the classic DDA signal. There remains room for future research into how to classify waste exactly as LLW or ILW using interrogation.
2.2. Detection System and Modeling
The proposed detection system targets a standard 55-gallon or 200-L drum by surrounding the drum with an array of 15 Arktis S-670
4He fast neutron detectors [
37]. This system uses a Thermo Scientific MP320 D-D fusion neutron generator [
38] or similar technology to produce quasi-monoenergetic neutrons with a sharp energy distribution centered around 2.45 MeV [
39,
40] to interrogate the drums. The D atom, when accelerated in the generator, brings its kinetic energy into the D-D reaction, creating energies higher than 2.451 MeV, which would affect the threshold for EDA. This effect was ignored in this study, but we believe it could be accommodated in a straightforward manner by experimentally setting the threshold in situ for a given beam current and voltage.
A 30 cm by 60 cm by 60 cm block of high-density polyethylene (HDPE) moderator surrounds the neutron generator with a 1 cm sheet placed between the generator and drum. The HDPE was added after design studies showed that it significantly reduced the room-return background signal and provided neutron reflection and moderation into the drum. The HDPE enhances the fission signal in the drum by increasing thermal fission, with the drawback of extending the generator decay time slightly. The 1 cm of HDPE provided neutron moderation that increased the induced fission signal by roughly 50 % (see
Section 2.4).
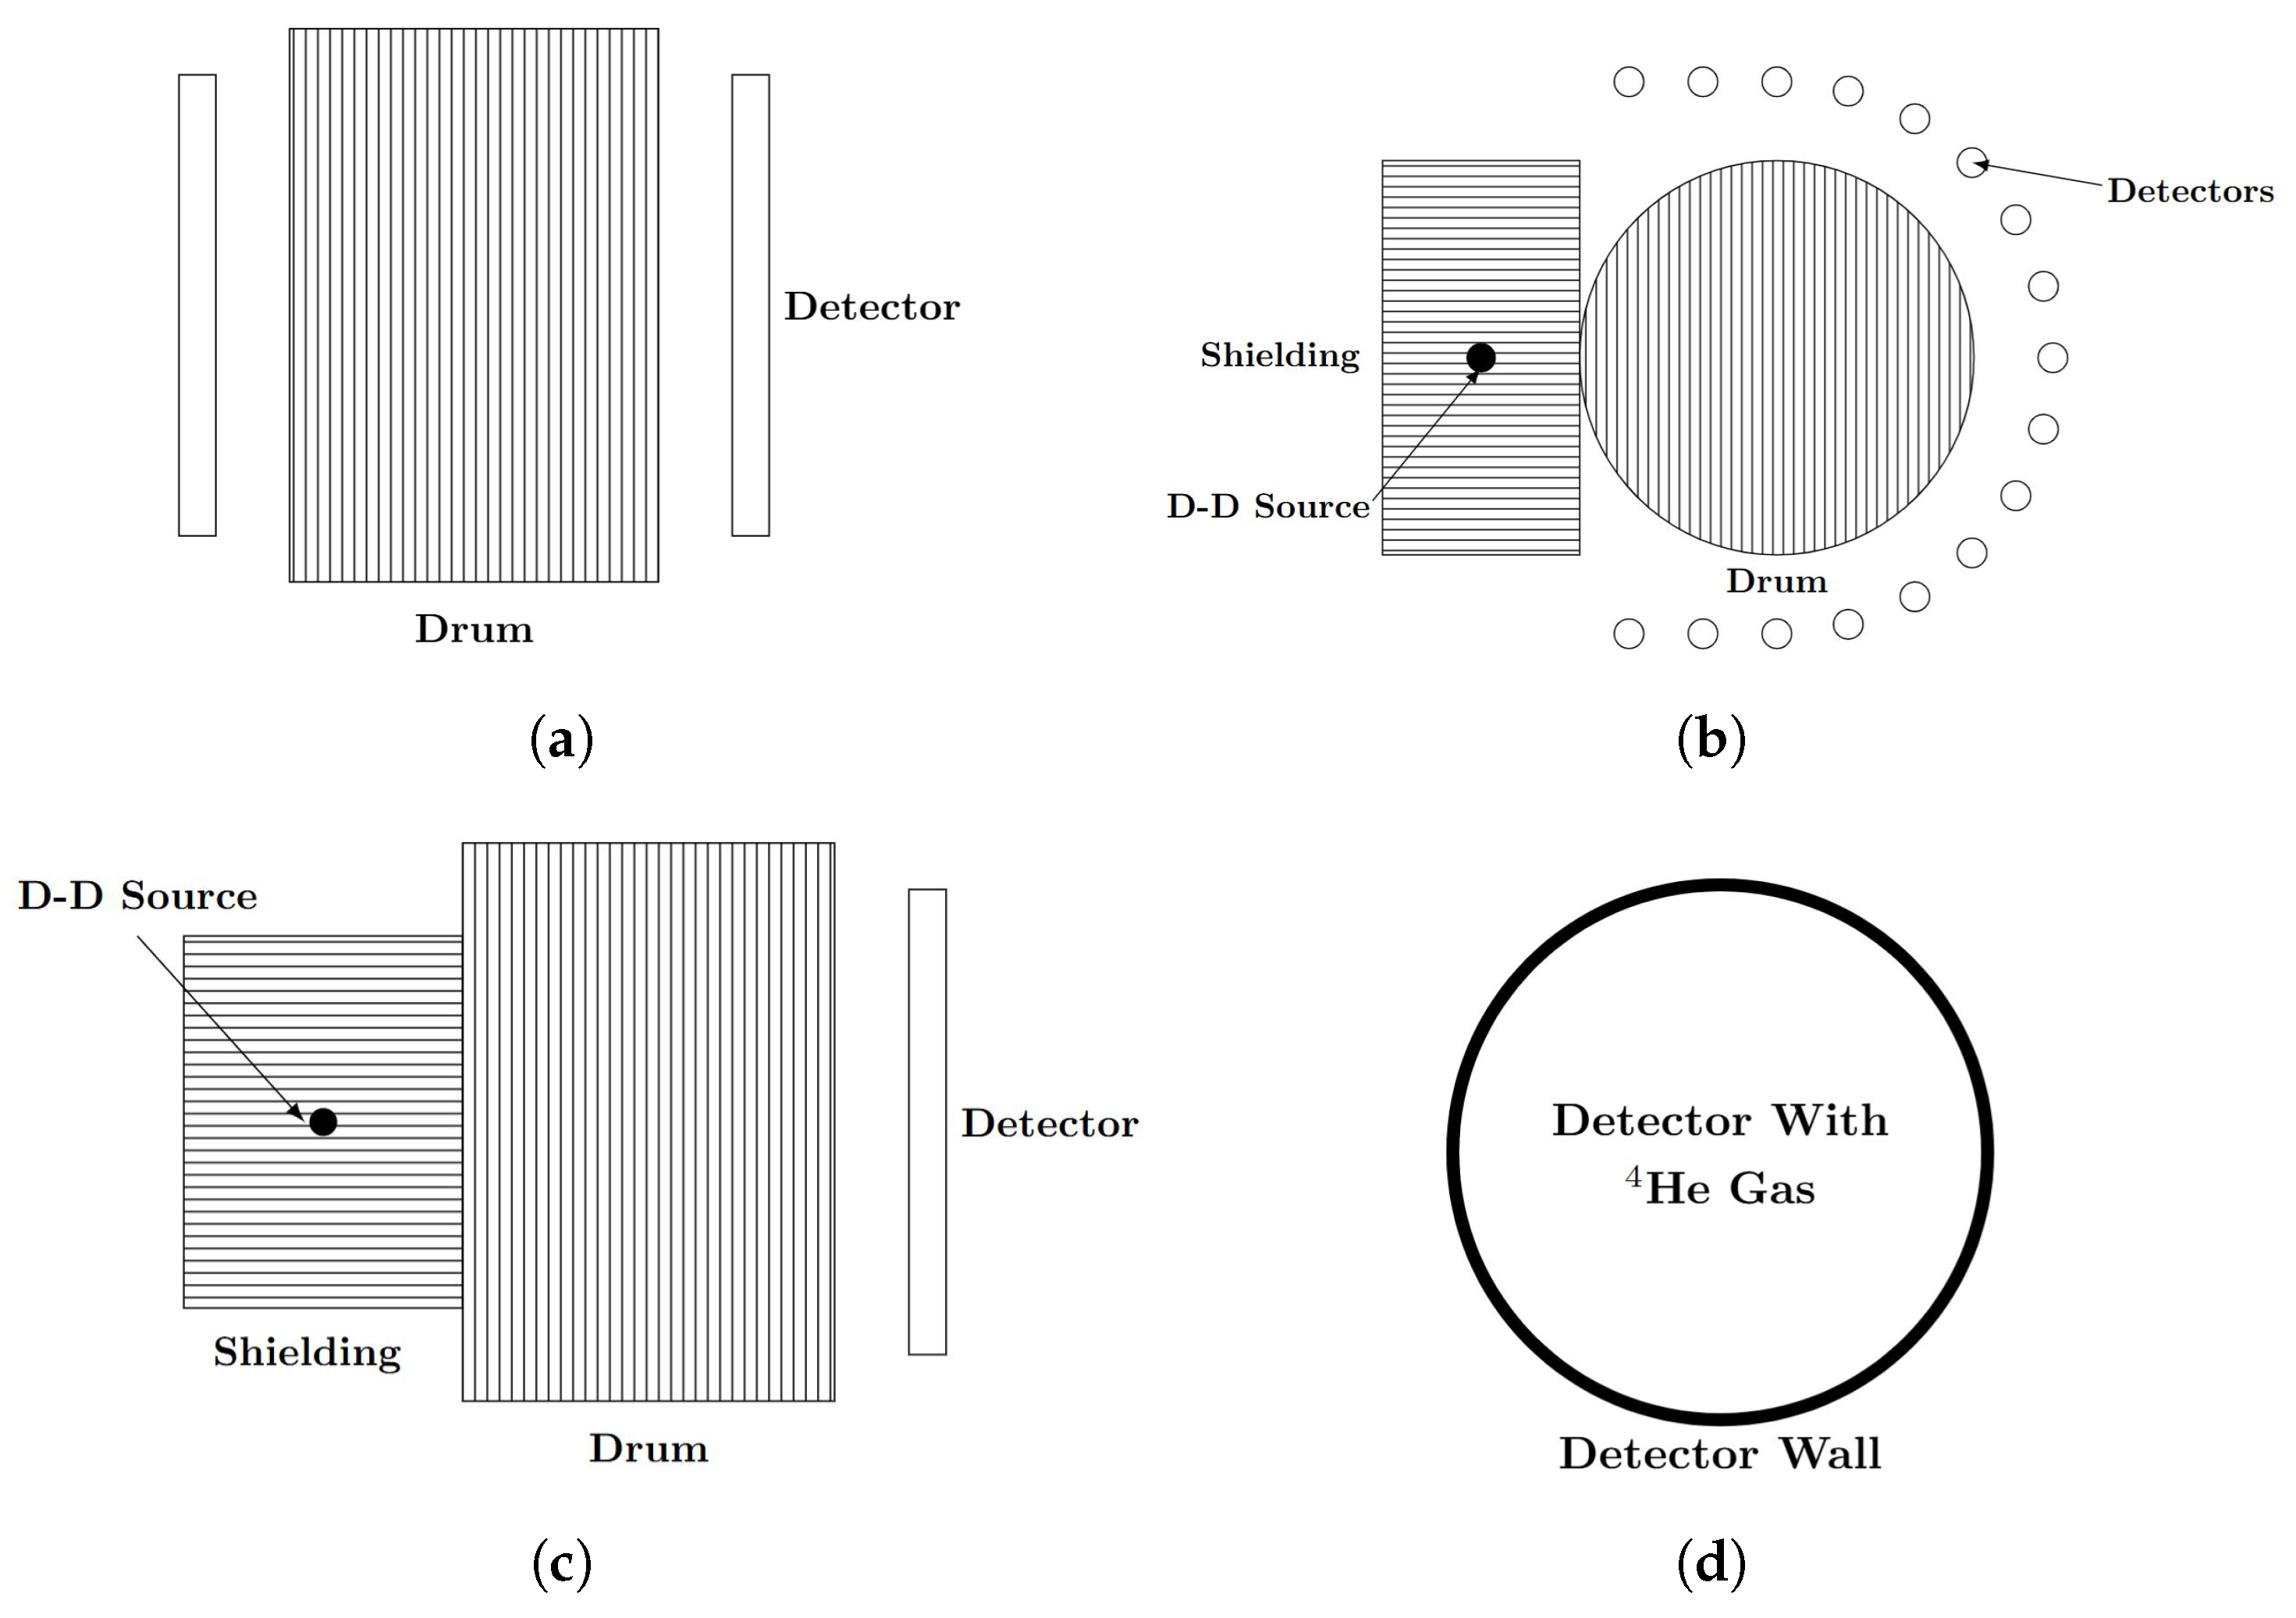
Figure 5 presents the simplified model of the detection system.
The simulated neutron generator operates with a 50 μs pulse width and 2.45 MeV neutrons. To simplify the model, only a single pulse was simulated rather than many pulses with a given frequency. This MCNP model uses an isotropic point source to maintain model simplicity and estimate the neutron flux that would be seen by a neutron generator. It is worth noting that the actual angular distribution of a D-D generator is distributed in both energy and angle with a much more complex flux profile [
39]. To more accurately compare with physical experimental results, a higher-fidelity model of the generator can be used; however, the point source should be sufficient to compare the induced EDA and DDA signals. The effect of the flux profile would likely tend toward a forward-distributed yield and increase the flux in the drum compared to this model [
39].
The signal and background are constructed by using F4 tallies in MCNP, which provide the neutron flux averaged over a cell (detector) [
33], with energy bins of 0.00–0.10 MeV, 0.10–2.45 MeV, and 2.45–14.00 MeV. For the EDA signal, the bin from 2.45 MeV to 14 MeV provides the EDA source signal during and after the pulse for any neutron in the detector above 2.45 MeV. The DDA signal is constructed by binning an F4 tally at 0.1 MeV and 14 MeV. This provides a net neutron signal between 0.1 MeV and 14 MeV, which covers any fast neutron counts following the pulse. The model has 300 time-bin increments between
= 54 μs and
= 4050 μs, which were chosen by observing the decay of the generator and the die-away with fissile material. The simulated count rates are constructed from the flux by Equations (
9) and (
10) where
is the generator strength in neutrons per second,
is the total volume of the detectors, and
is the normalized flux from the F4 tally.
Arktis reports that the model S-670
4He detectors have an average intrinsic detection efficiency of 3.1% [
41] over the
252Cf spectrum. The intrinsic detection efficiency for the EDA signal was estimated to be 2.86% according to a weighted average of a linear fit of the efficiencies reported by Tancioni et al. [
42], weighted by the thermal
239Pu energy spectrum [
34] over the energy range of 2.45–14 MeV.
Previous work has determined that 12% of neutrons with energy above 2.45 MeV scattered on
4He will deposit at least 1.6 MeV of their energy in the detector [
22]. Thus, the MCNP simulation was post-processed with these factors to create an EDA efficiency of 0.343% for neutrons greater than 2.45 MeV, which comes from the intrinsic efficiency and full deposition probability. The DDA signal efficiency was treated as an intrinsic value of 3.1% for neutrons above 0.1 MeV. These efficiencies result in the DDA signal largely driving the detection time of the system, with the hypothesis that adding the EDA signal can drive down the measurement time.
2.3. Waste Containers and Compositions
The detection system is optimized for detecting plutonium waste streams in a 200 L waste drum with an inner diameter of 60.60 cm and an outer diameter of 60.86 cm. The drum has an inner height of 86.0 cm and outer height of 86.26 cm, with a 0.3 mm high-density polyethylene (HDPE) lining and a 1 mm steel structure. The drum was then filled with one of five materials: HDPE, polyvinylchloride (PVC), Jabroc (wood), concrete, and 316 stainless steel (SS316). These five materials were chosen to generally represent materials that may be encountered in a nuclear facility and to have varying neutronic properties that may impact the detection system’s performance. The drum’s filling material was then homogenized with the waste stream and modeled as a “conditioned” density. The drum mass was calculated with the drum volume and given conditioned density in
Table 1.
The MCNP material compositions were created using the PNNL 2021 Materials Compendium [
43] for HDPE, PVC, and SS316. The compositions for the concrete and Jabroc were internally chosen from industry research. The materials were then “contaminated” with one of three waste streams: a pure
239Pu waste and two streams representative of nuclear waste, which are presented in
Table 2 and are roughly representative of reprocessed plutonium waste streams from MAGNOX and Advanced Gas-cooled Reactors [
44].
The potential waste-bearing system may contain only small amounts of fissile material, making MCNP models of said systems computationally expensive to achieve strong statistical accuracy. To extrapolate the simulated induced neutron responses from HLW to LLW, a suite of MCNP simulations with only the drum, collimator, source, and no detectors were conducted. These simulations had a uniform distribution of eight masses over the interval from the LLW limit to 10 times the HLW limit for each material and waste stream. The dataset was then used to understand the effect of mass changes on multiplication and subsequent neutron signal in the materials. In MCNP, the net multiplication is defined as unity plus the gain in neutrons from fission plus the gain from nonfission multiplicative reactions [
33]. Demonstrating this relationship is linear with mass implies the neutron signal is also linearly changed with mass.
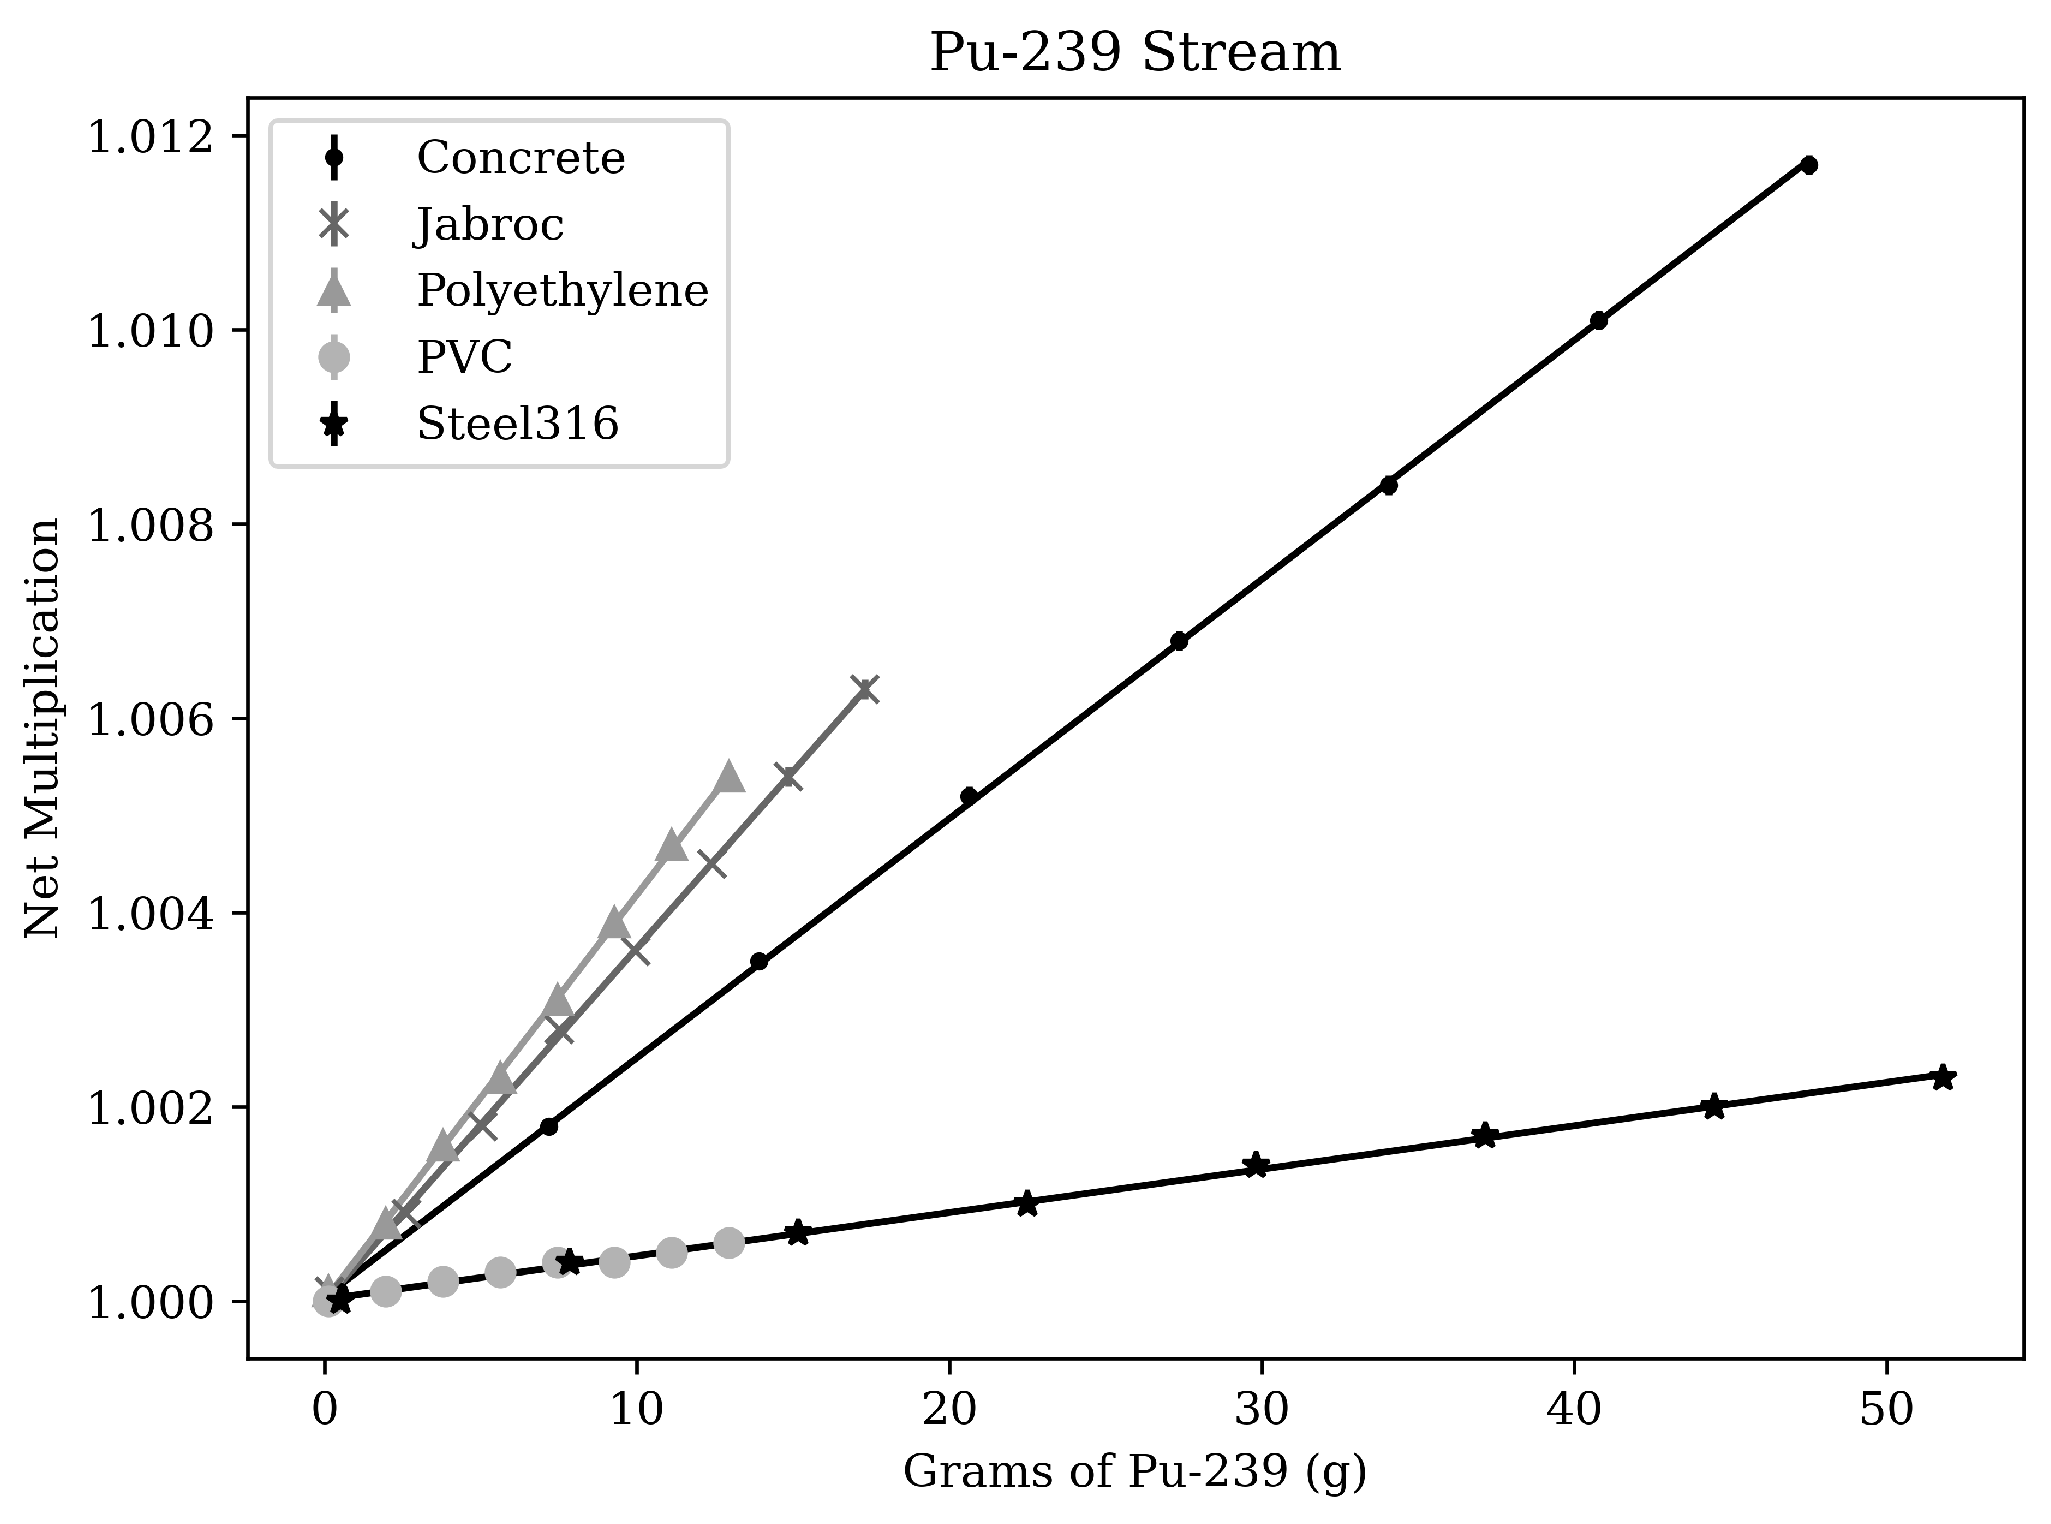
Figure 6 shows how the net multiplication of the system changes when the D-D source interrogates
239Pu waste with different filler materials. The data show a linear trend in the multiplication of the source neutrons from significant masses of several grams down to fractions of a gram. Linear curves were fit to these data to allow for extrapolation of the signal multiplication to low masses. It is worth noting that the largest multiplication increase is less than about 1% change over the entire mass distribution.
2.4. Fissile Signal Response Optimization
At the outset of the study, it was thought that the DDA and EDA signals might be amplified by moderating the D-D source before the neutrons interact with the drum or by modulating the pulse width of the generator. The objective was to find the optimal degree of moderation and pulse width that minimizes the measurement time of various waste. We performed an optimization study by changing the pulse width from 20 μs to 160 μs and by varying the HDPE moderator thickness between the generator and the waste drum from 0 to 60 mm at a fixed pulse of 50 μs. This study sought to simultaneously maximize both the DDA and EDA signals from the system.
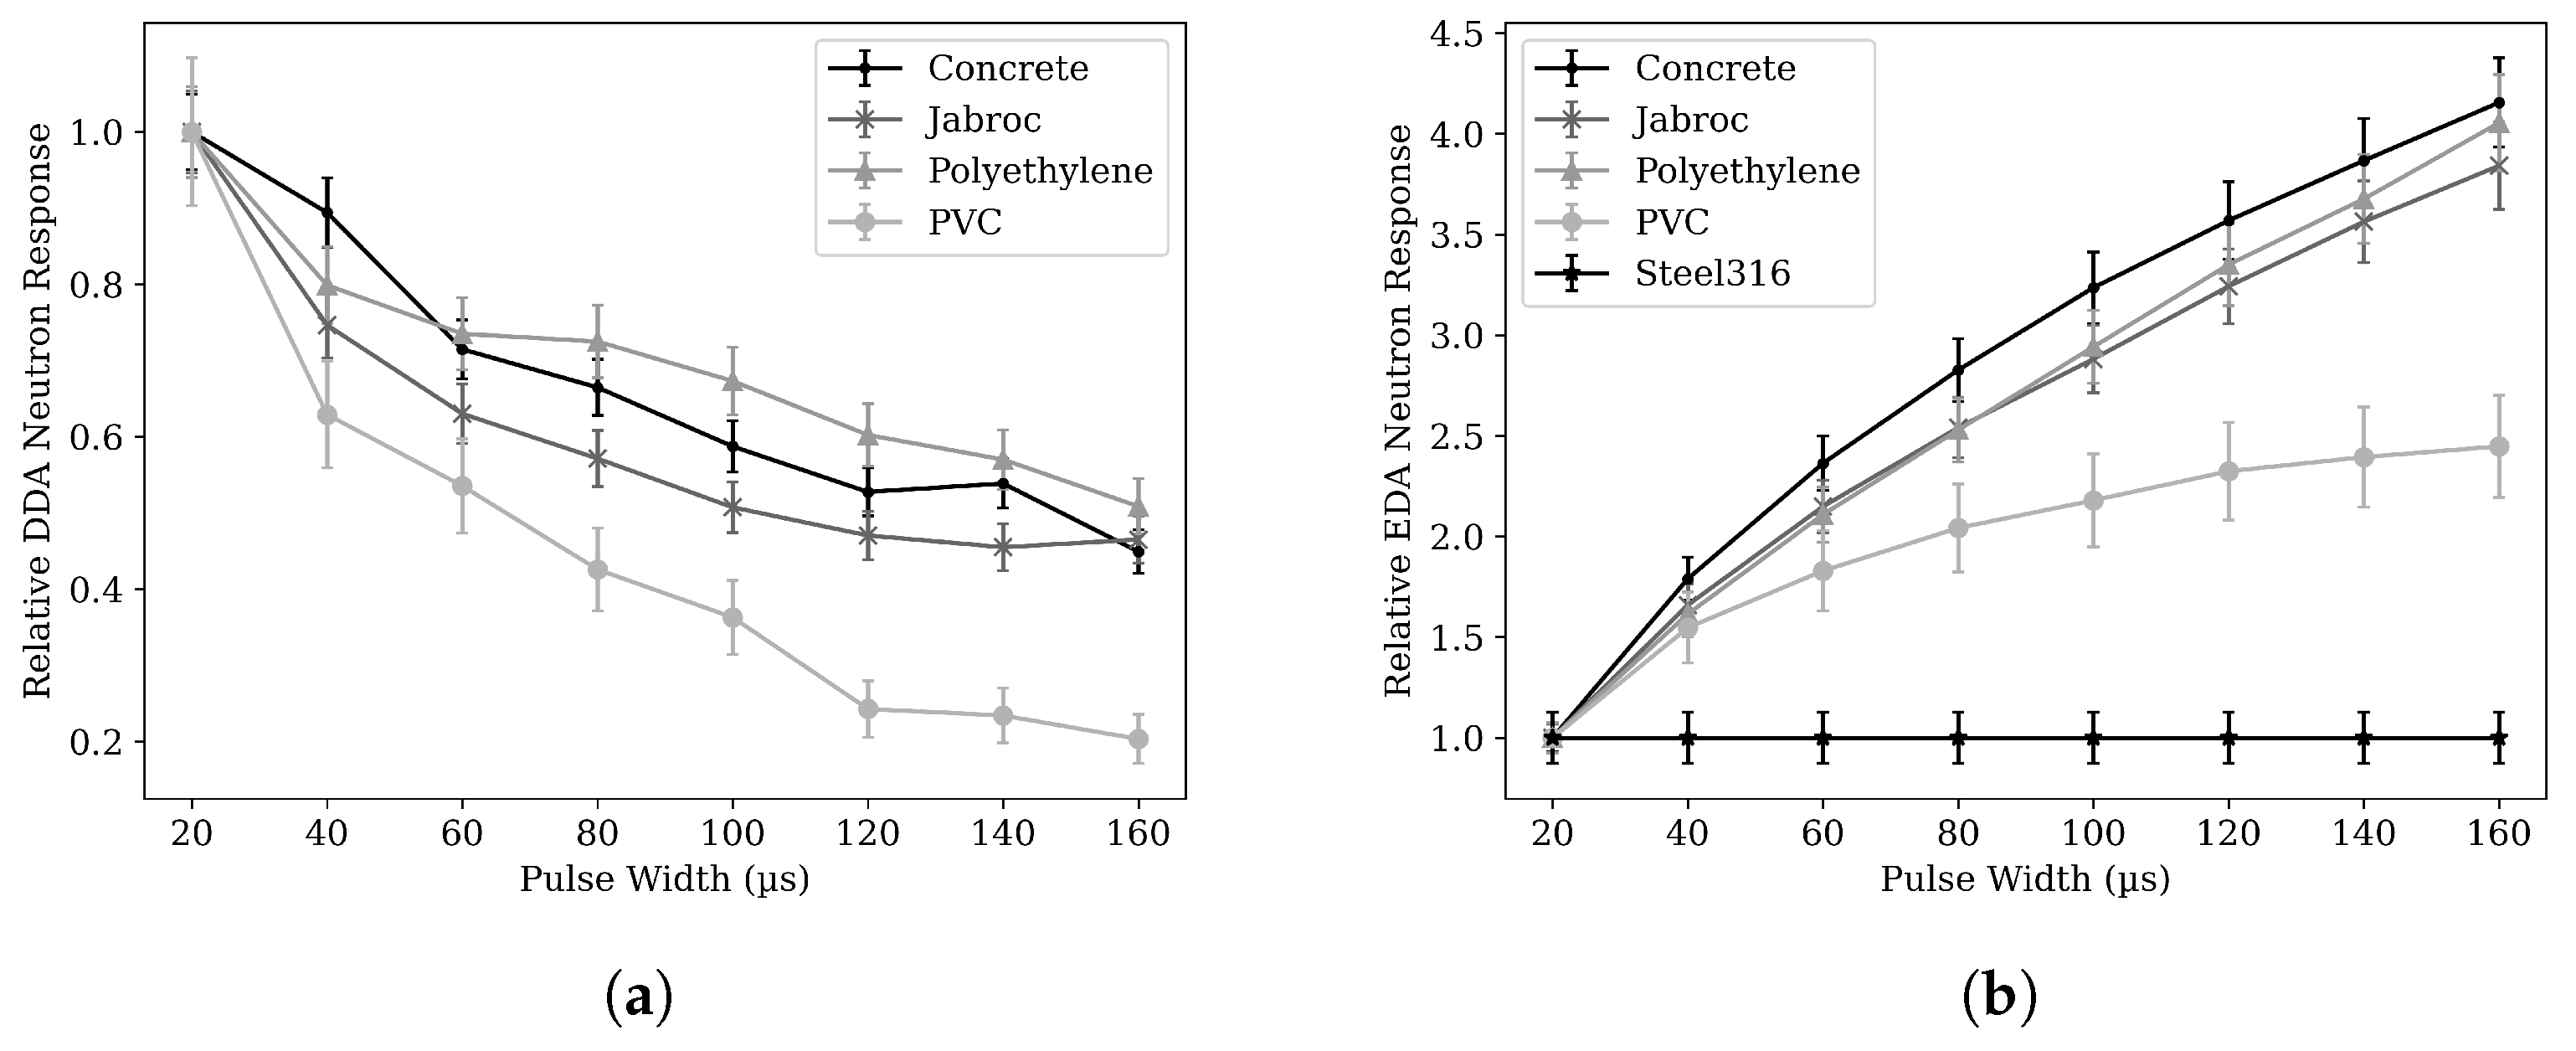
Figure 7 shows the effect of changing the pulse width on both the DDA and EDA signals. Increasing the pulse width increased the EDA signal while simultaneously decreasing the DDA signal. The EDA signal increased because the largest fission signals were seen while the generator was on, which corresponds to an increase in the EDA signal when the DDA cannot yet take a measurement. To preserve the DDA signal, a pulse width of 40–60 μs minimized the DDA signal loss while nearly doubling the EDA signal.
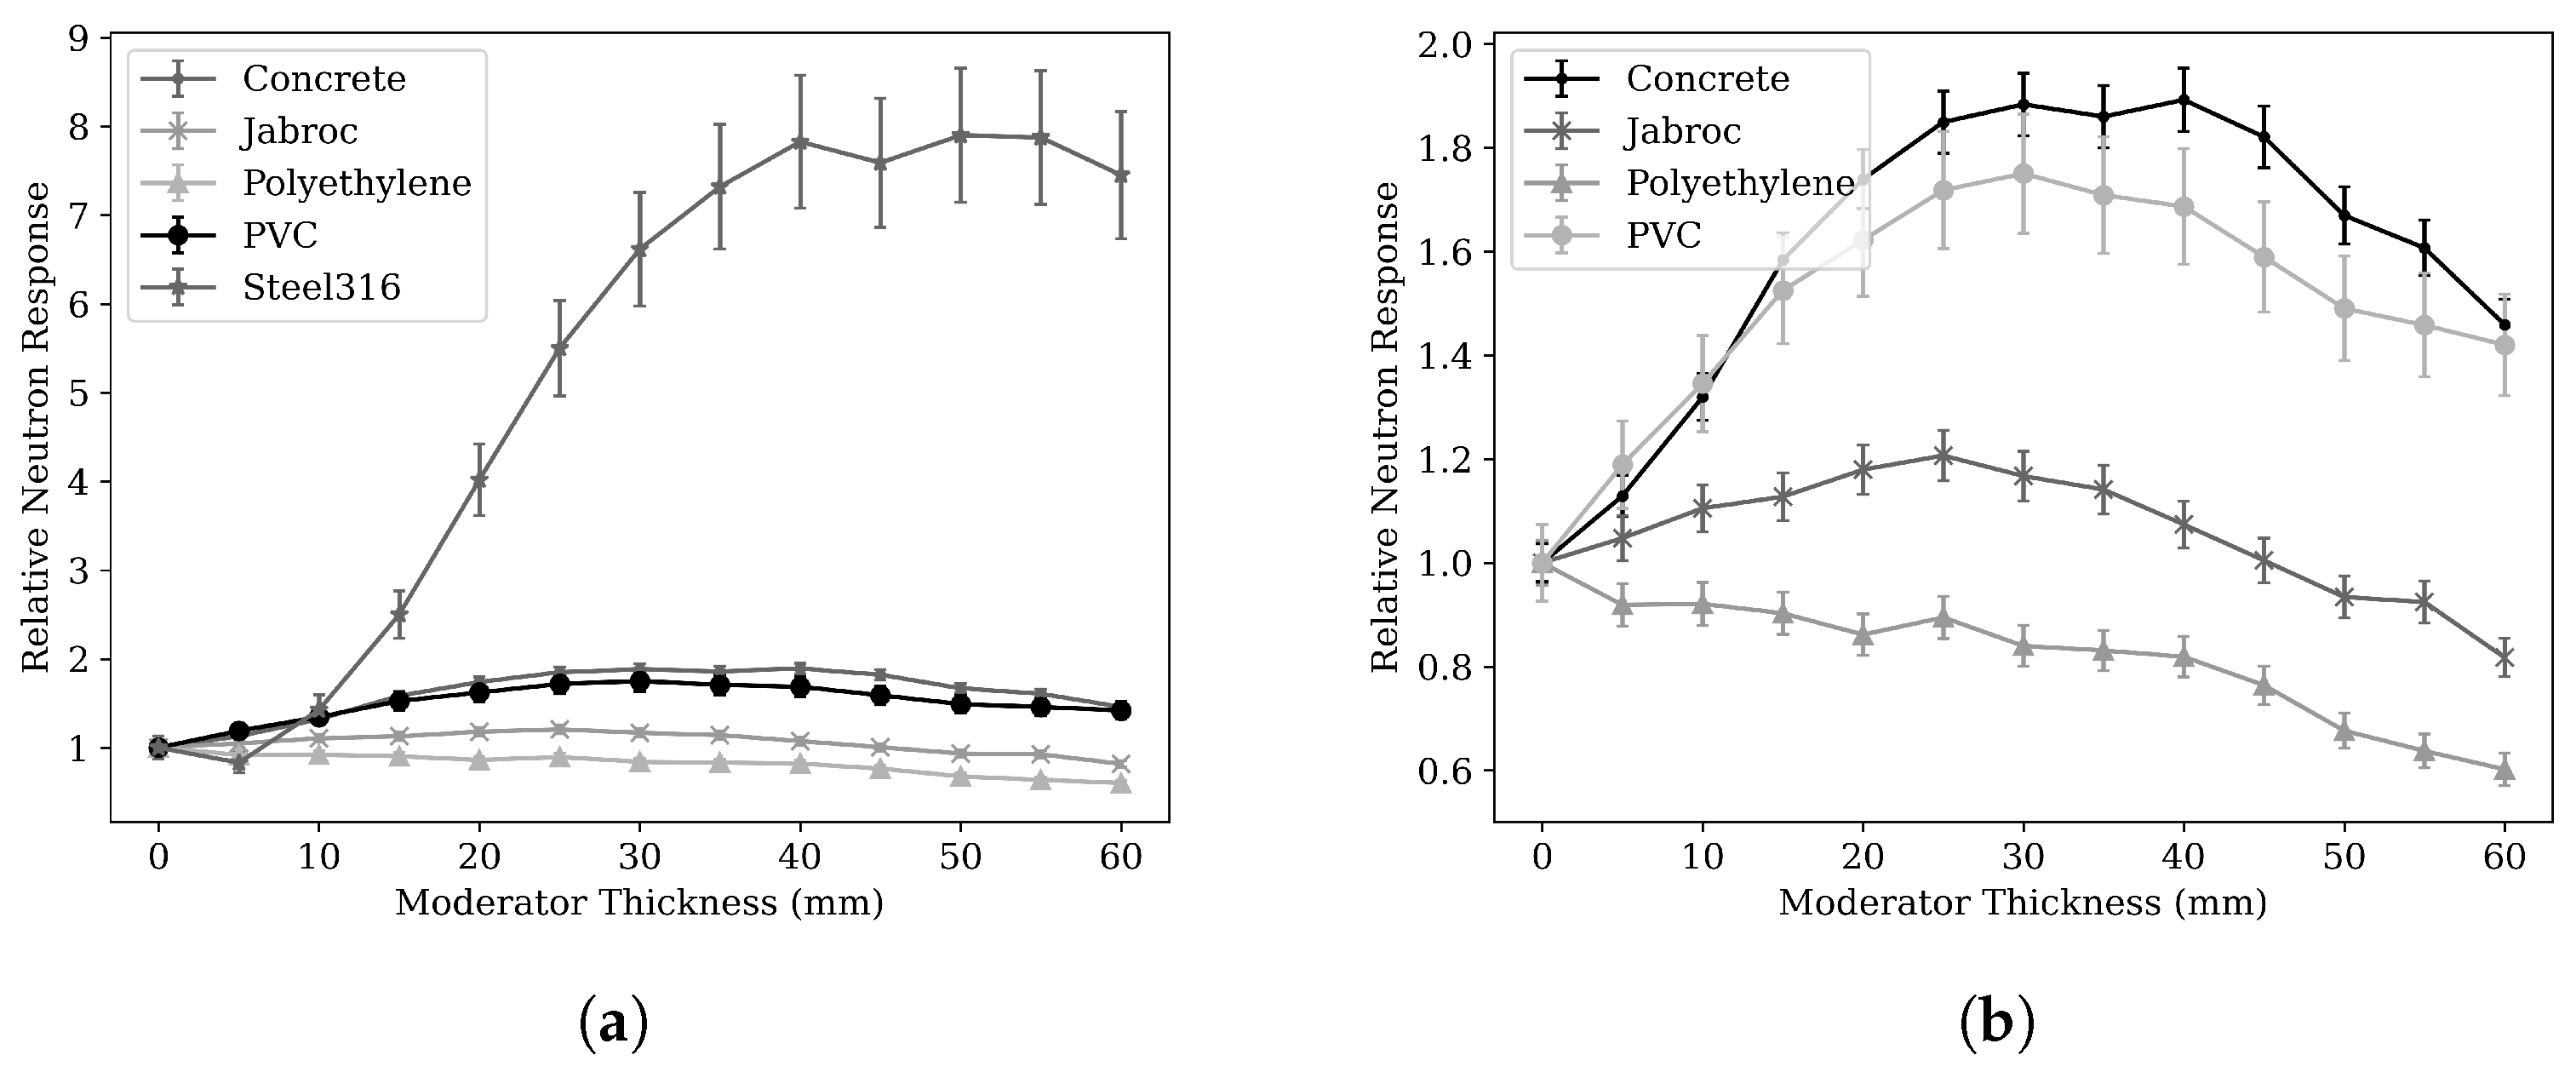
Figure 8 shows the effect of the HDPE on the combined DDA and EDA signals. Based on the data presented in
Figure 7 and
Figure 8, we observed that a pulse width of 40–60 μs and a HDPE moderator thickness of 20–30 mm created an optimal signal response in every waste-filler material except HDPE.
However, based on
Figure 8b, the HDPE was the limiting material of interest in terms of detection time. The neutron moderation in the form of HDPE inside the waste container limits the effect of adding moderation between the neutron generator and waste container. To minimize the detection time in the limiting case, a moderator thickness of 10 mm (and not the 20–30 mm reported above) was chosen for the rest of the design studies. This choice approximately decreases the observed neutron signals in
Figure 8 from the optimized 1.8 times for 20–30 mm to 1.3 times for 10 mm for concrete and PVC, and even more significantly for steel, when compared to the base unmoderated simulation. Materials with low hydrogen density, such as steel, have little moderating power, and adding HDPE thickness improves the detection time of the system by increasing the fission probability. An ad hoc moderation method for individual wastes would optimize the detection approach, but would require knowledge of the drum’s filling material, which may not be available. In summary, subsequent analyses modeled a moderator thickness of 10 mm and a pulse width of 50 μs.
3. Results
To survey the EDA-enhanced
4He technology, every filler material required four MCNP simulations: one simulation with a background composition containing no fissile material and three additional simulations, each containing one of the three waste streams from
Table 2. The signal in the detectors at a LLW composition was estimated by using the linear fit from
Figure 6.
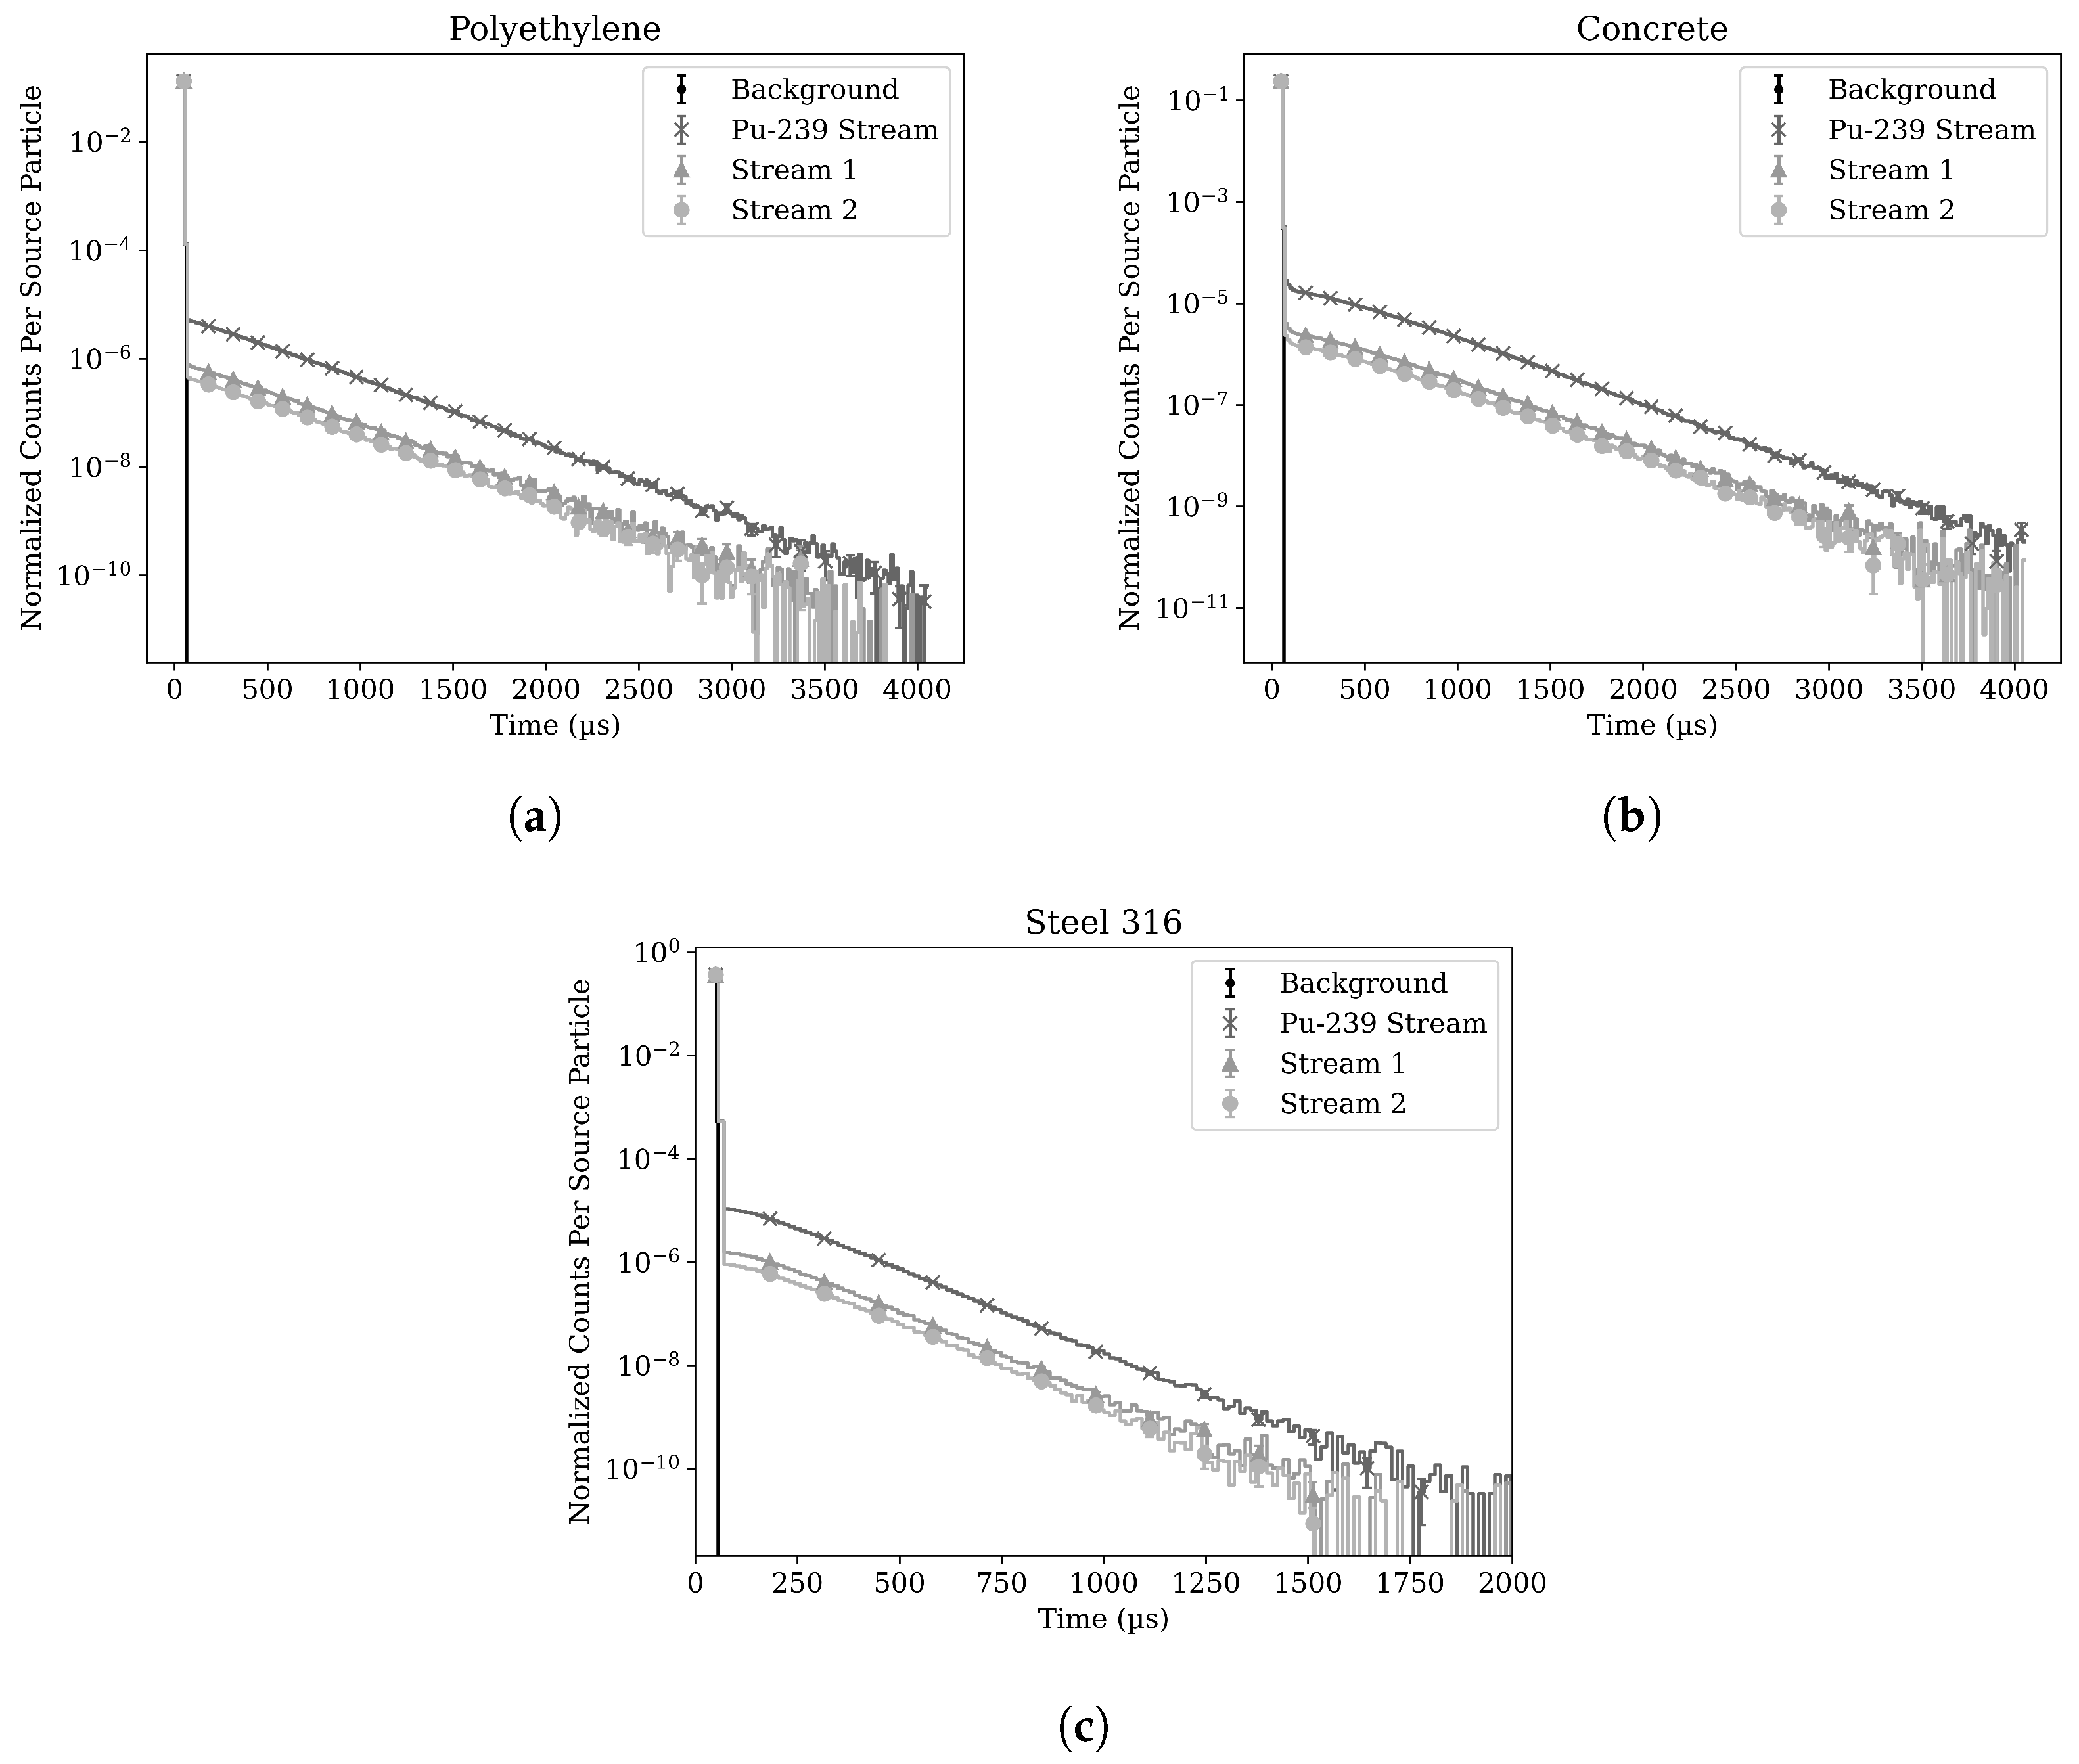
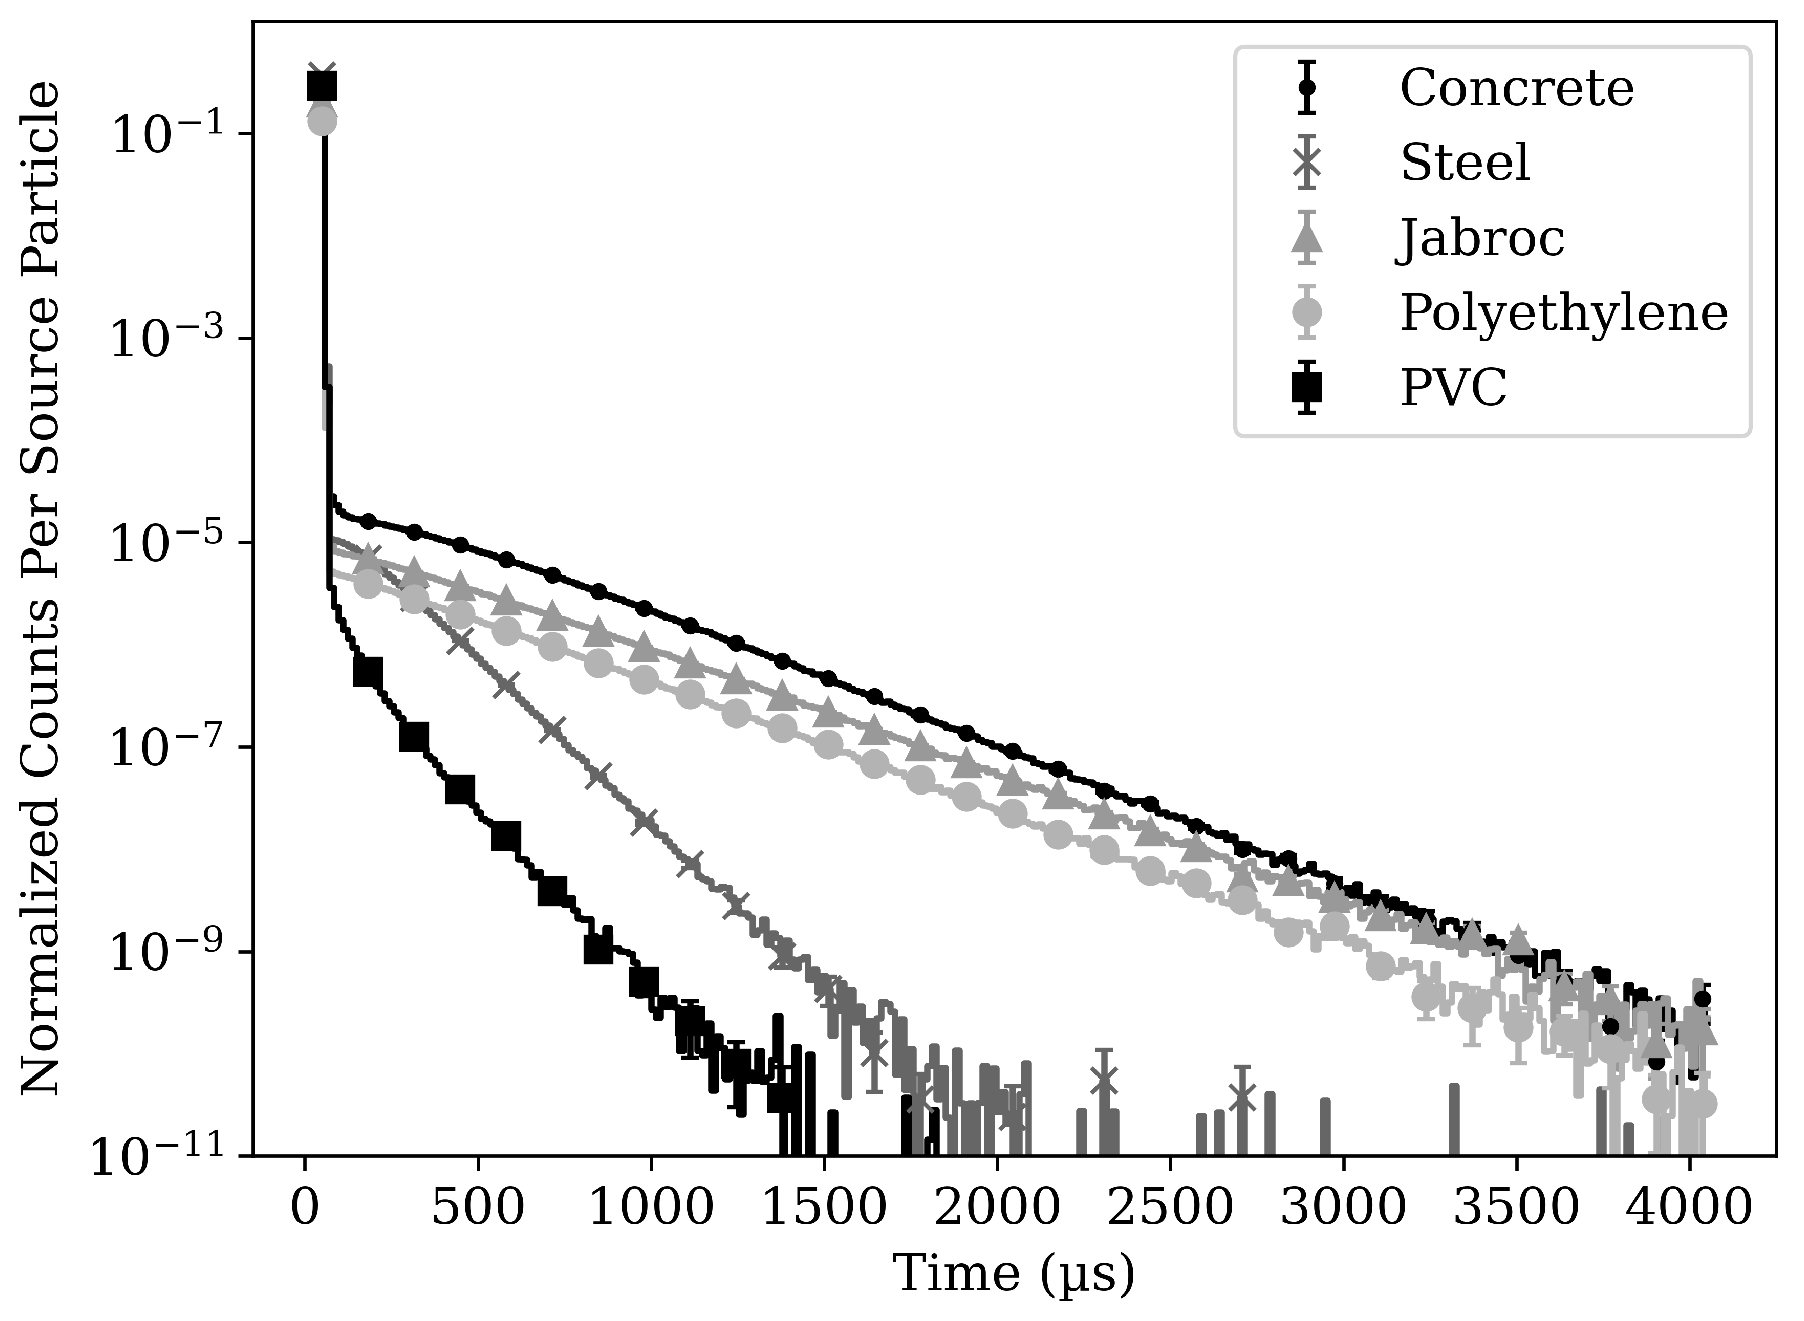
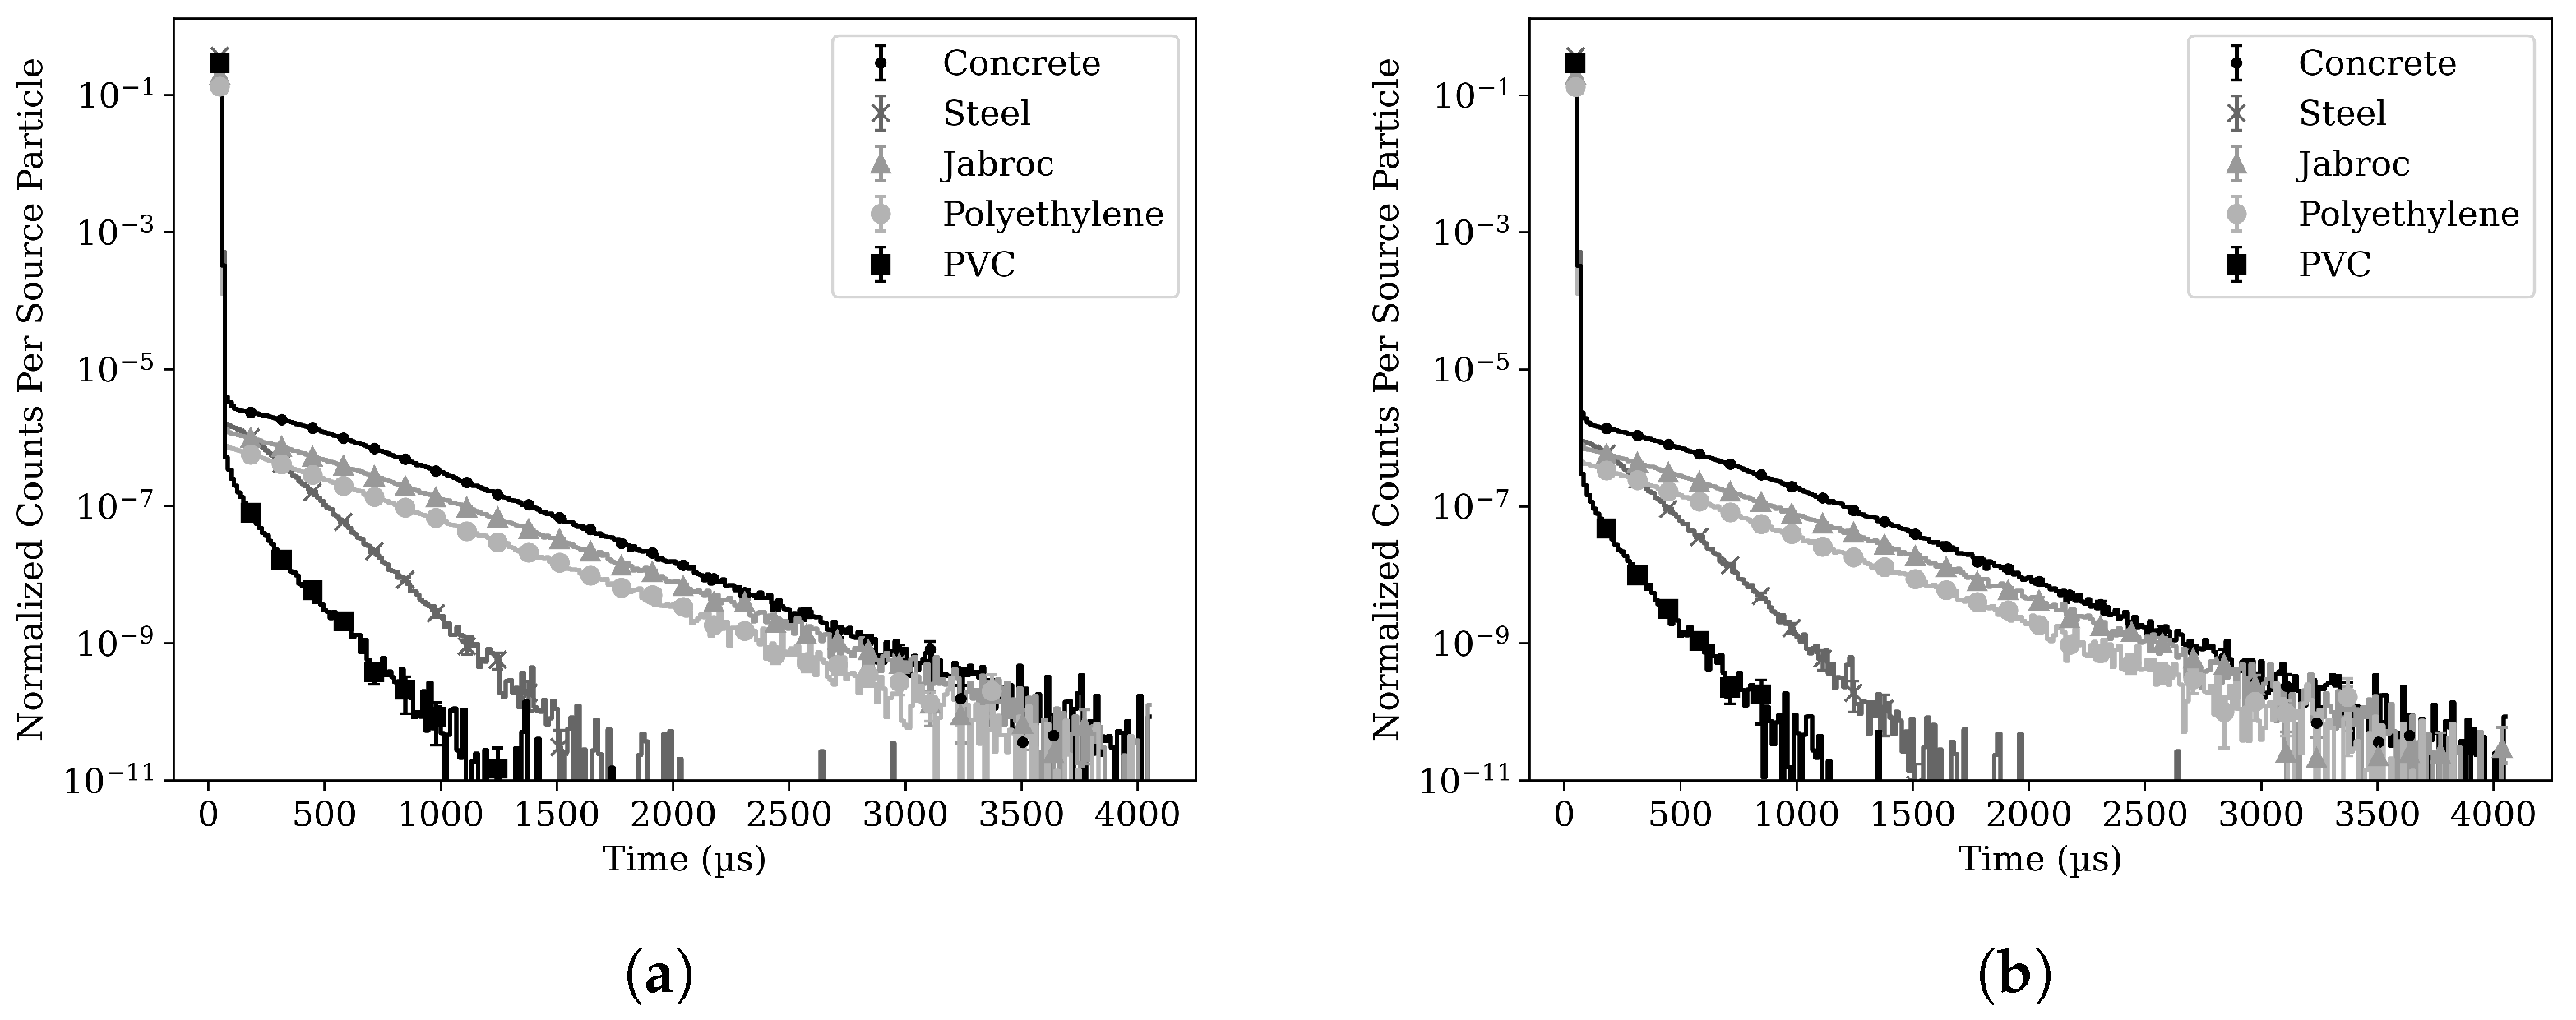
Figure 9a–c provides the die-away simulations for three waste streams, along with the background produced by the generator when no fissile material is present.
Based on Equation (
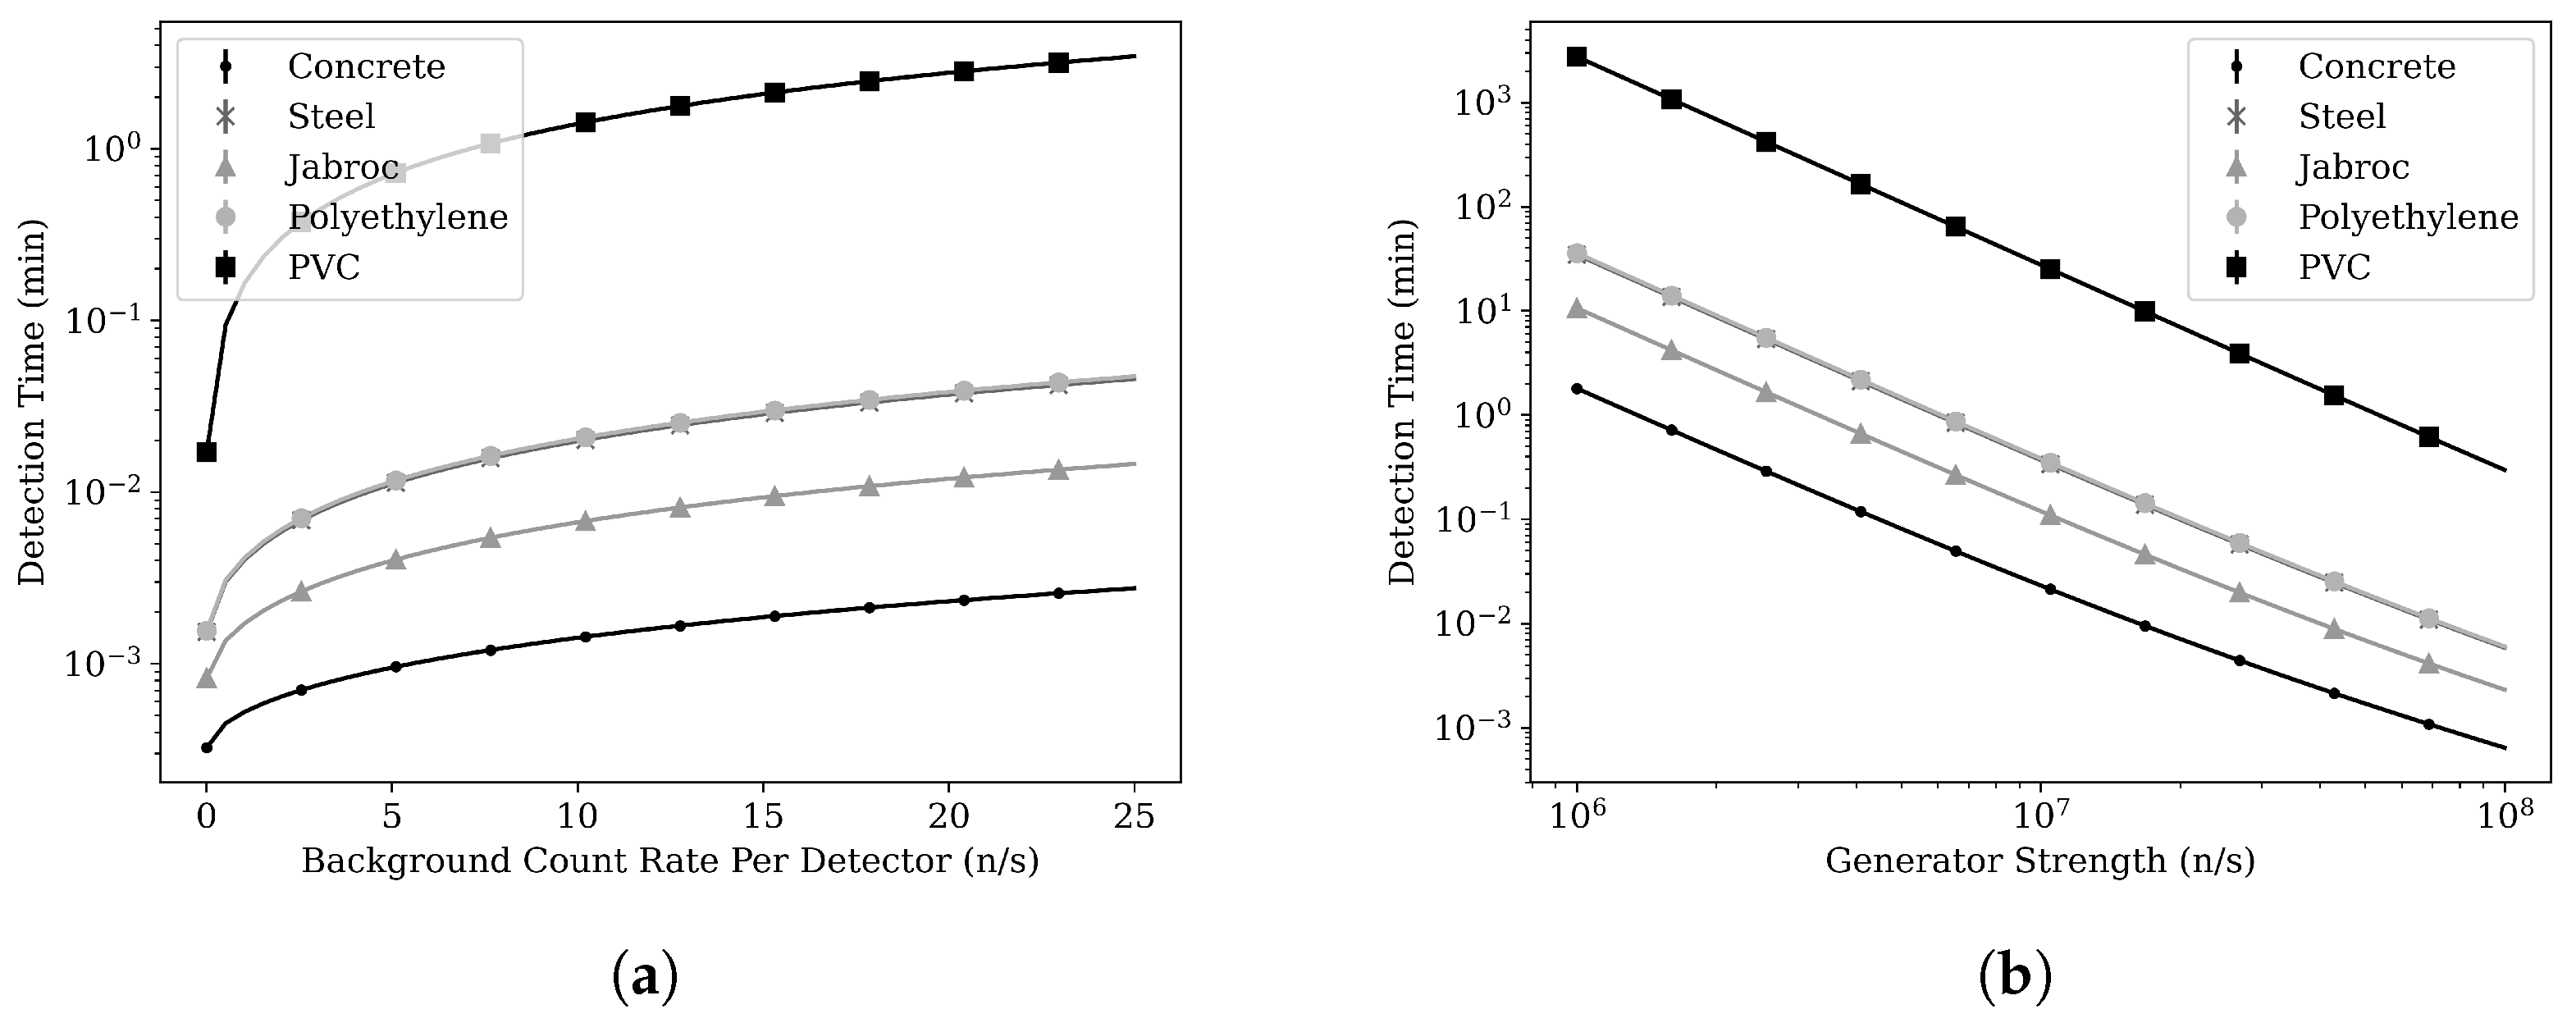
8), the detection time is a function of both neutron generator yield and background strength. The background count rate has a relatively linear relationship with detection time, while the generator yield has an inverse quadratic relationship because the generator yield increases the source term. The effects of both generator yield and background strength can be viewed for all the materials in
Figure 10 which contains a visualization of the trends from Equation (
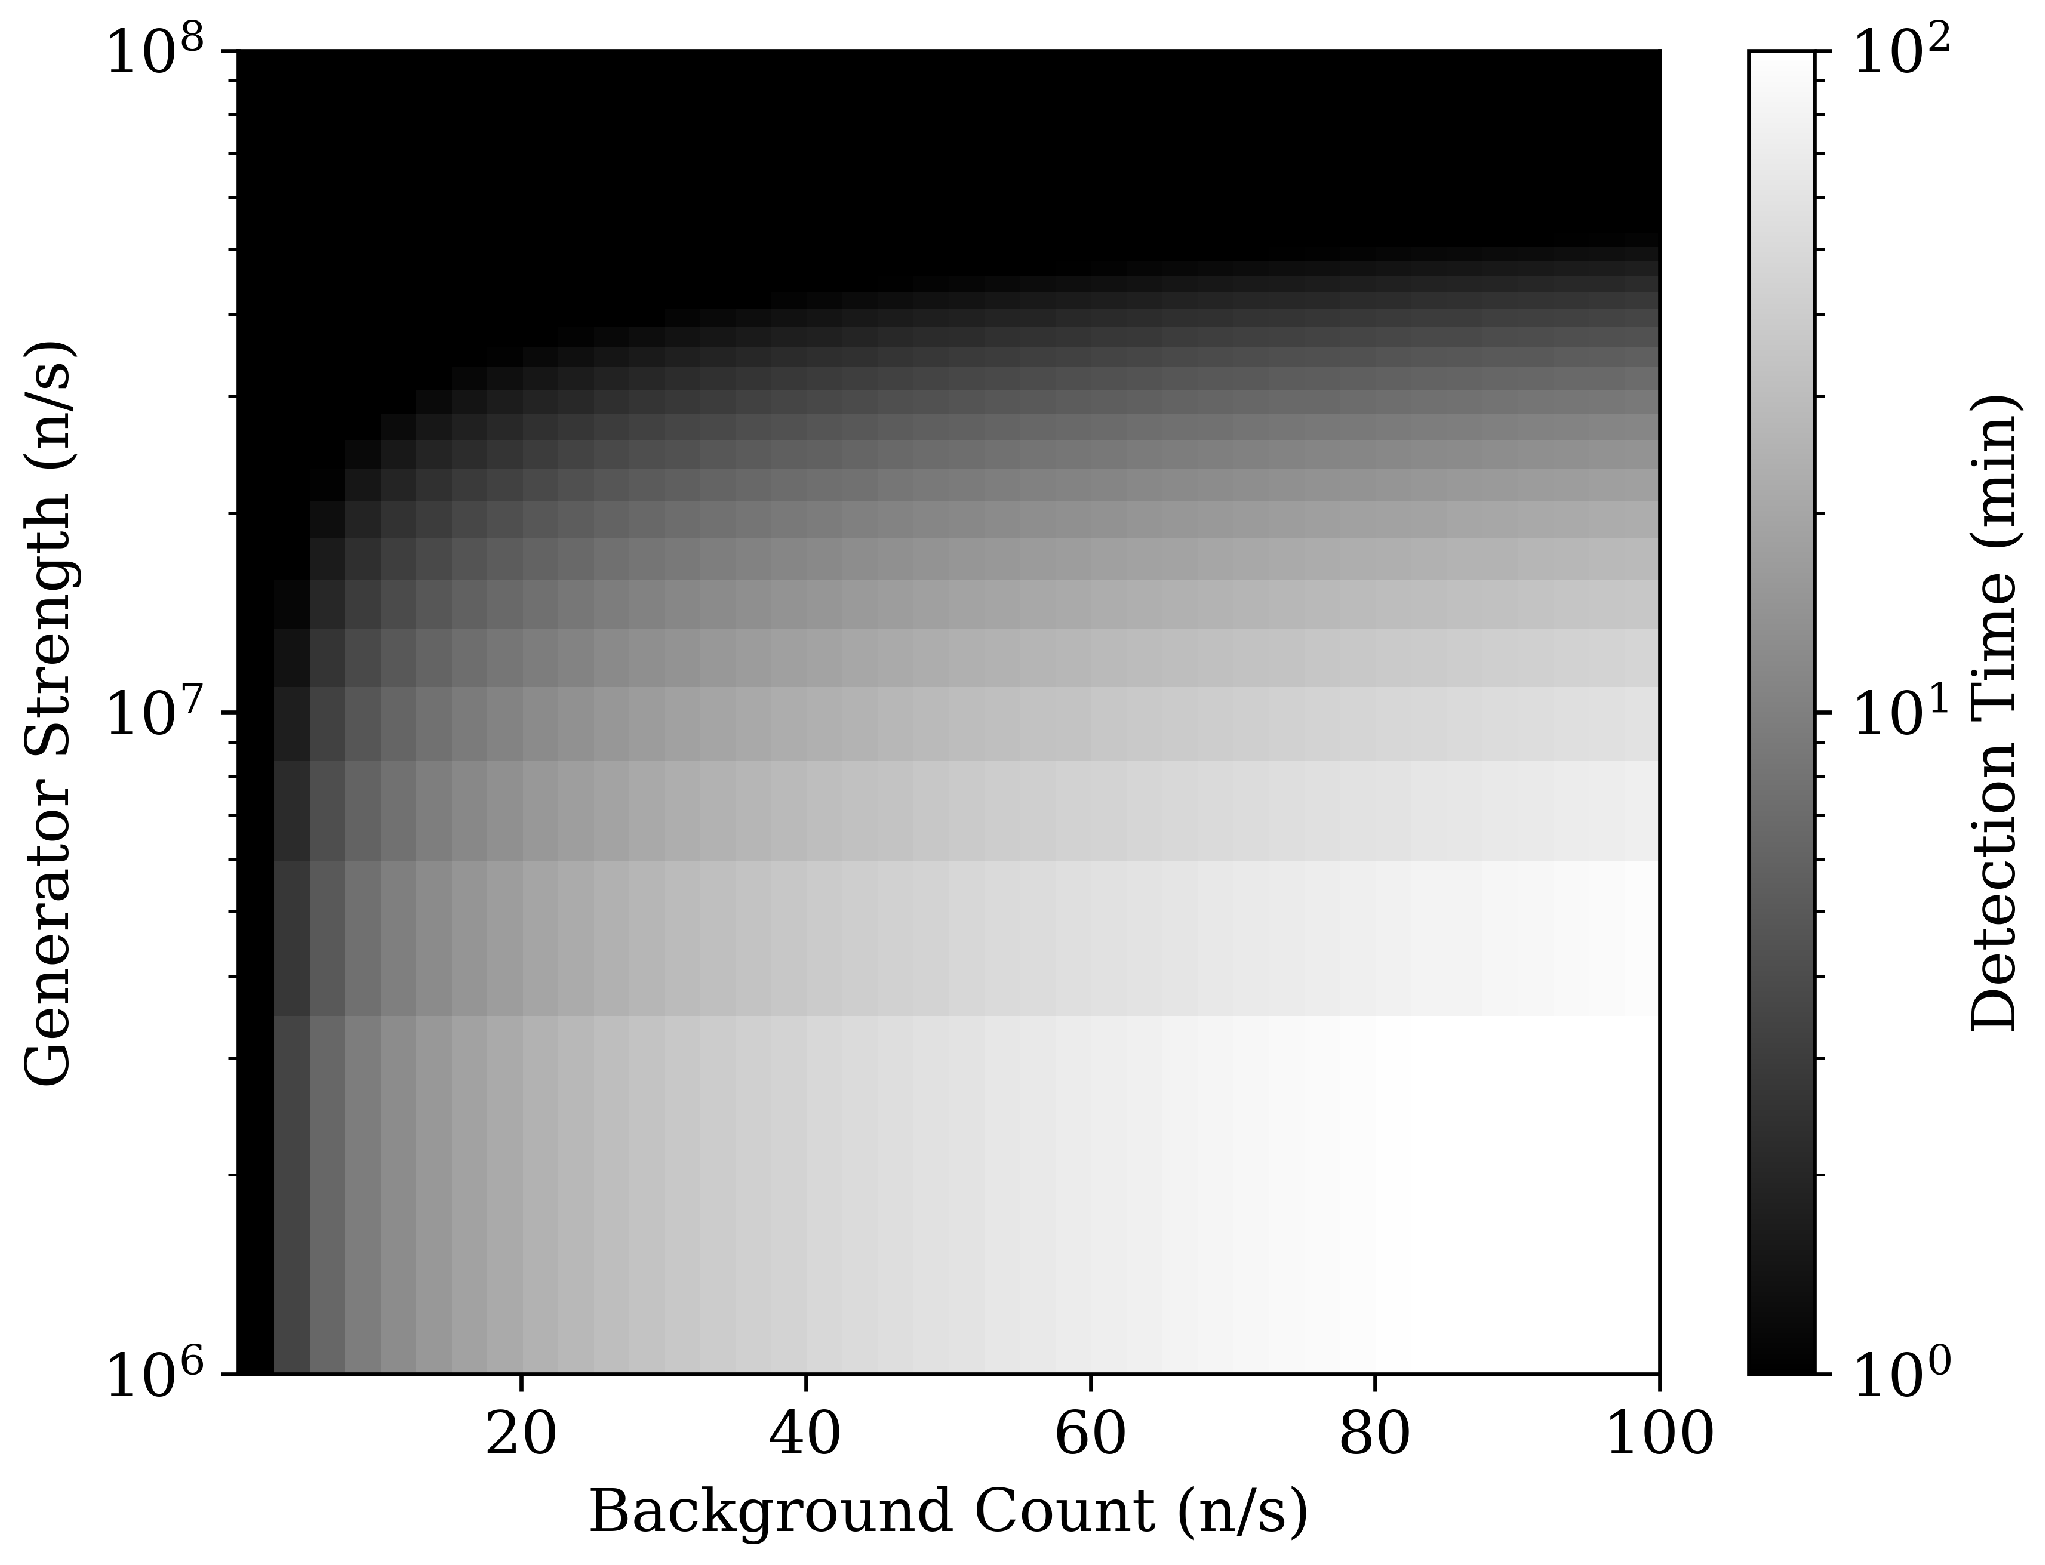
7). The heat map displayed in
Figure 11 shows how those two variables impact the total detection time in Equation (
8). Clearly, low backgrounds require smaller generator strengths, while maximizing the neutron generator yield minimizes detection time. Any in-field use of this approach should maximize the neutron generator yield and minimize background signals, prioritizing a generator yield above
neutrons per second.
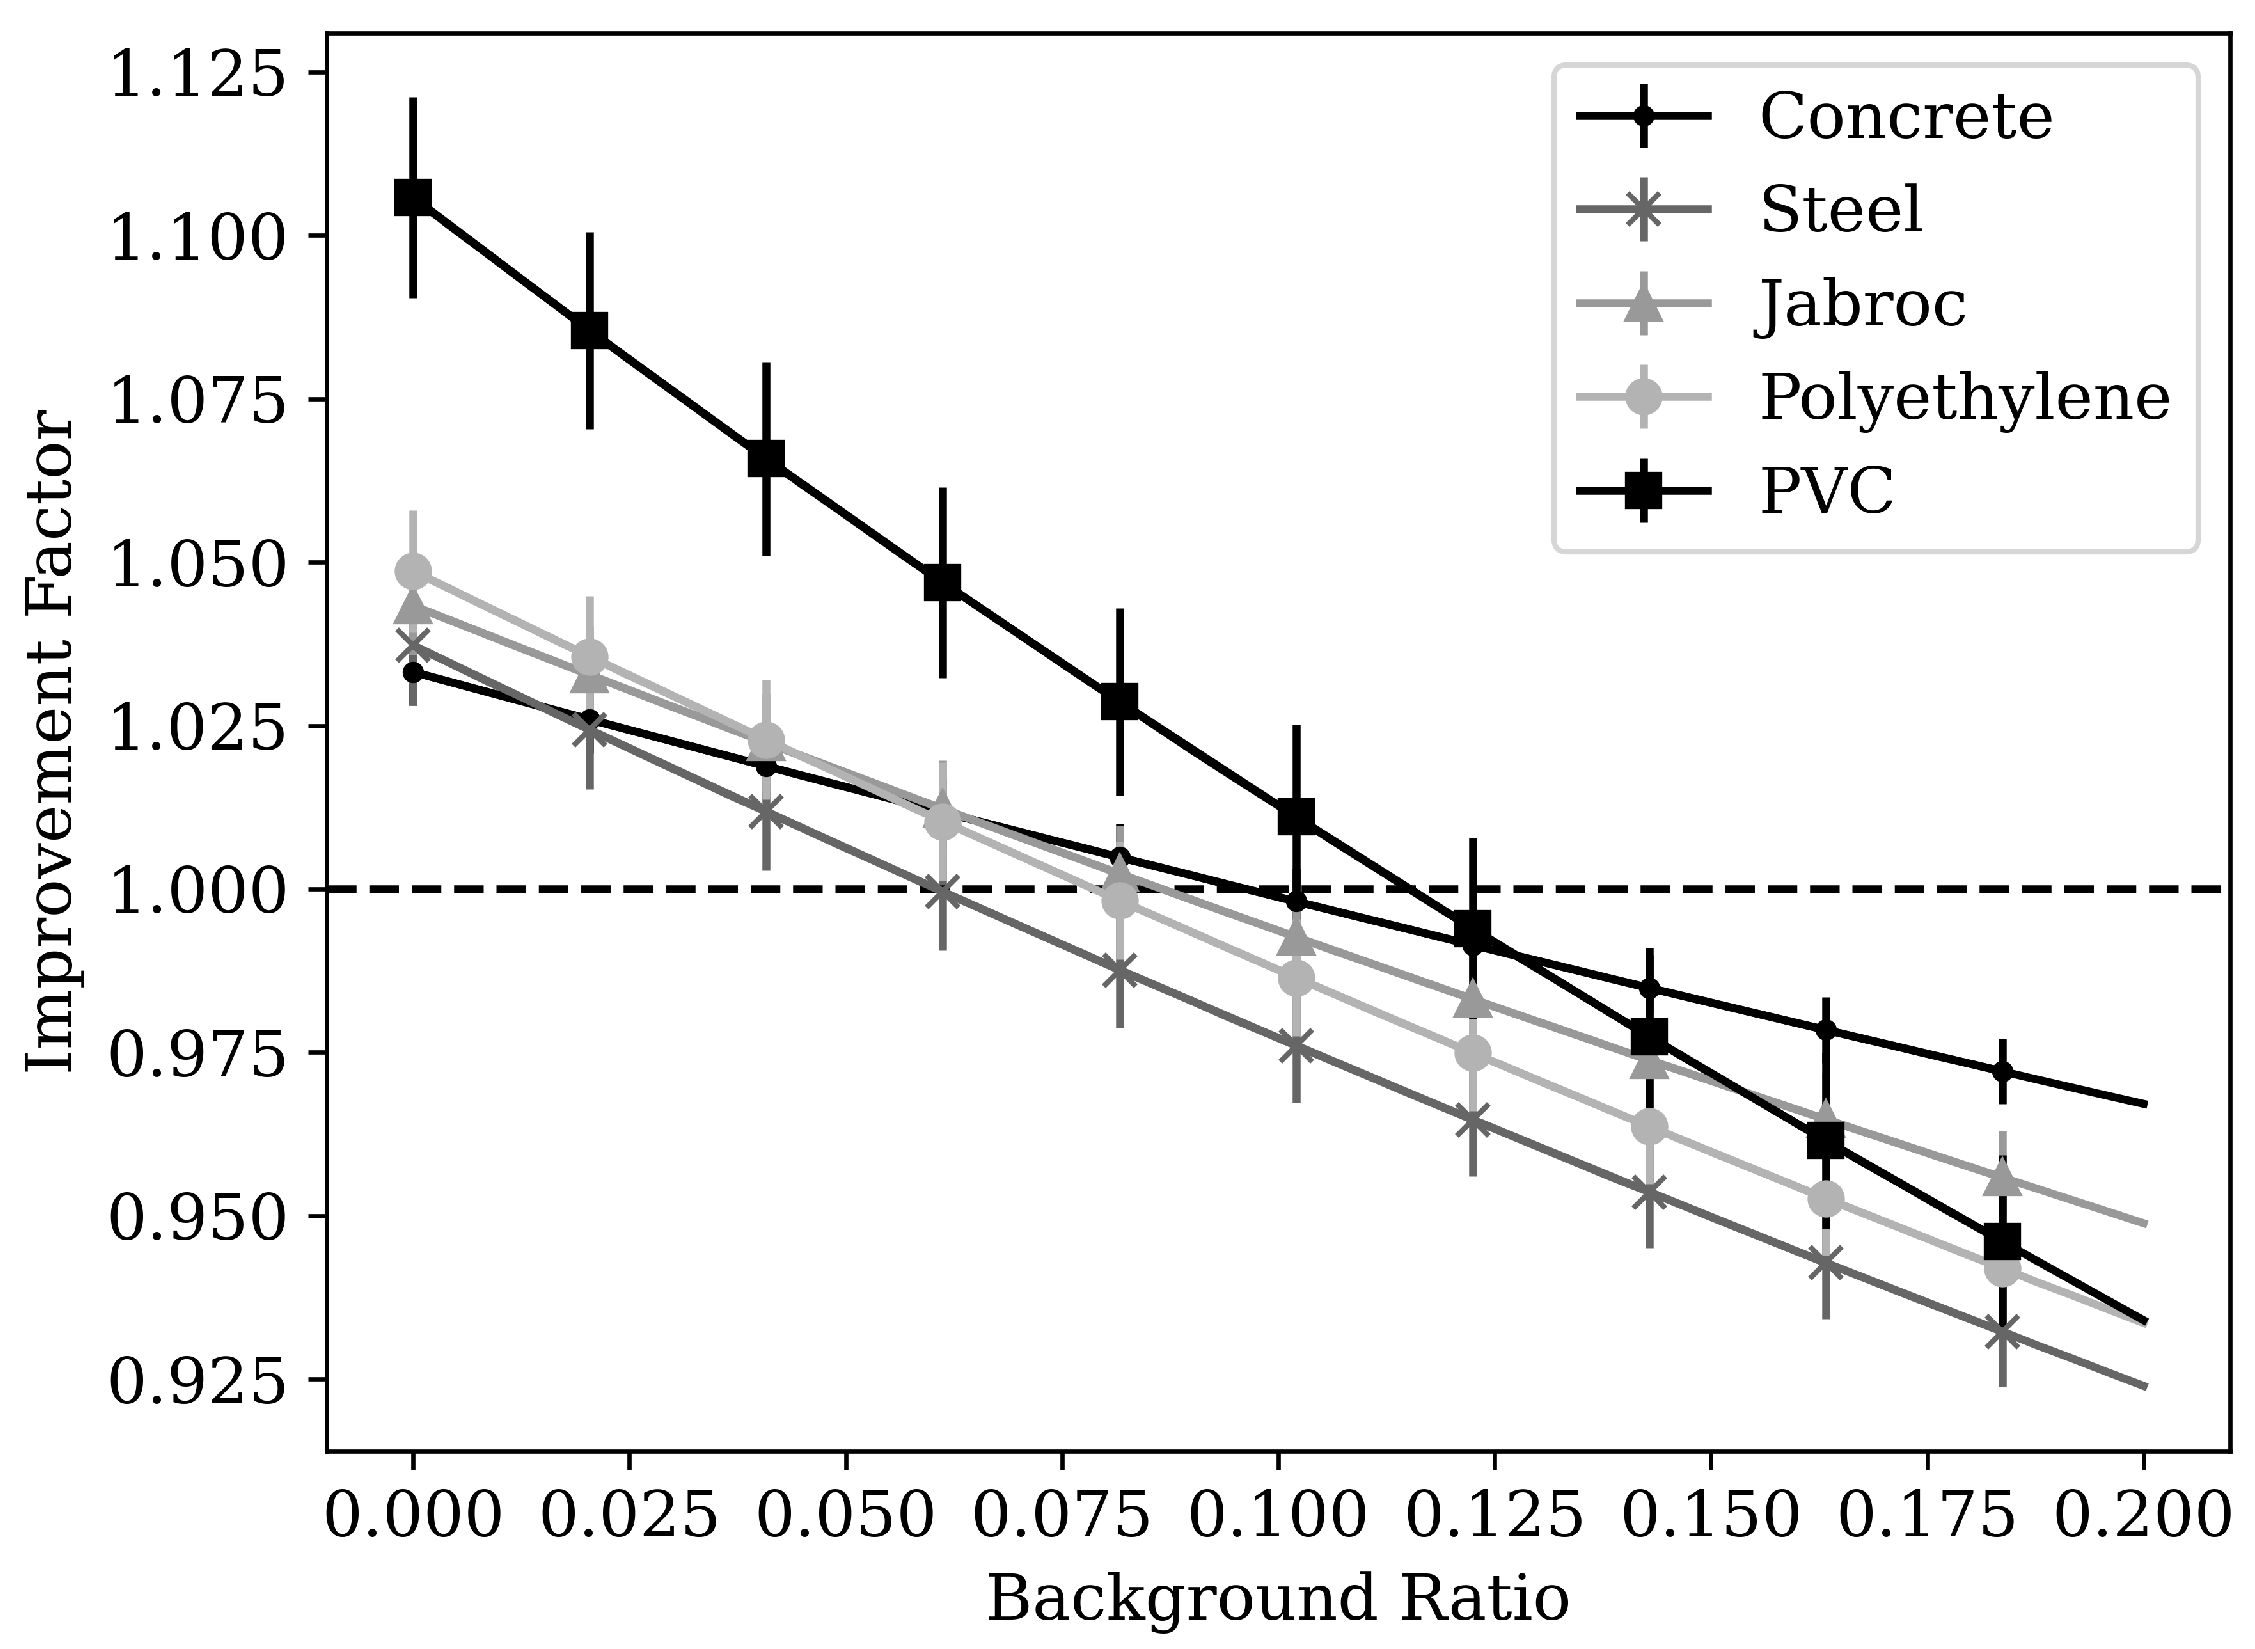
The improved detection time produced by the EDA signal heavily depends on the intensity of the high-energy background when compared over the full DDA energy range. This assumption ultimately determines the improvements provided by the EDA signal. The sensitivity to this background ratio is demonstrated in
Figure 12. This dependency emphasizes the importance of characterizing the neutron spectrum and flux resulting from (
, n) and spontaneous fission reactions, as well as characterizing the location-dependent background signal above the selected EDA threshold.
The threshold masses of
239Pu for the studied ILW streams are displayed in
Table 3.
Table 4,
Table 5 and
Table 6 present the time needed to detect these different ILW streams with a 95% confidence interval and a fixed DDA background of 30.0 counts per second and an EDA background of 0.6 counts per second, which assumes that the background greater than 2.45 MeV is 50 times lower than the background between 0.1–14 MeV.
Table 4,
Table 5 and
Table 6 show the approximated absolute efficiency of the EDA signal originating from the drum. This efficiency was estimated by placing an F1 current tally on the drum’s surface with a 2.45–14 MeV bin and a cosine bin from 0 to 1. This method takes the F1 tally in the outgoing direction, which is the current integrated over the surface of the drum [
33], and compares the signal to the signal from an integrated F4 tally placed on the detectors. This constructs the number of particles leaving the drum and being observed in the detector volumes. It is worth noting that this method does not account for detector cross-talk. Additionally,
Table 4,
Table 5 and
Table 6 show the ILW detection times of these
239Pu masses with the DDA technique, EDA technique, and the combined EDA and DDA technique.
The reduction in detection time achieved by using the EDA+DDA method vs. DDA is quantified by an improvement factor. The improvement factors are relatively independent of the fissile material’s composition, varying little between the waste streams. The total measurement time is highly dependent on the amount of fissile material present, with the pure
239Pu stream having the fastest measurement times. The more complex waste stream with additional fissioning isotopes showed no significant differences from the pure
239Pu stream. The signals scale largely with the reduction in
239Pu mass. The measurement times also vary depending on the composition of the waste, especially with the amount of moderation it provides. The detection system is dependent on the
4He scattering cross-section and represents a fast-neutron detection system. By introducing high-hydrogen-content materials (especially PVC and polyethylene) with moderate power, fast neutrons are removed from the detectable system regime, causing the longest measurement times with active interrogation. This fast signal reduction is linked to the neutron absorption and thermalization caused by hydrogen. Together, this masks the fission multiplication and creates long neutron migration times in the better moderating materials, which can be seen by comparing the DDA backgrounds in
Figure 13. The setup (especially HDPE pre-moderation) was not optimized for steel and concrete, and therefore this waste showed a reduced improvement relative to the other materials.
The addition of EDA analysis resulted in the largest improvement factors for the Jabroc, HDPE, and PVC waste streams, which have the largest degree of optimized neutron moderation, as shown in
Table 7. When the fission neutron signature created by the SNM is masked by the long migration times in the hydrogenous filling material (as they diffuse before leaking), it takes longer to positively identify the SNM with DDA only. The addition of EDA creates a unique unmasked signature from fission neutrons that helps reduce the assay times by 3–9%. The simulated model was not optimized directly for the steel and concrete compositions and does not have optimized EDA signals in the reported detection times, potentially limiting the observed improvement. The DDA measurement times are much faster inherently for both the concrete and Jabroc seen in
Table 4, due to the much stronger signal strengths in
Figure 14. Similar trends are seen in waste streams 1 and 2 in
Figure 15.
The importance of the neutron moderation may be amplified by the homogeneous nature of the waste stream, where the SNM and filler material are evenly distributed throughout the 200 L drum. This material distribution was chosen because ILW is often sludge or liquid wastes, and LLW is evenly distributed low-density materials like gloves, paper, or clothing. This hypothesis can be confirmed through future simulation studies that model heterogeneous waste mixtures. Another potential complicating factor may be from (
,n) and spontaneous fission neutron production in the waste mixture, which could produce a neutron background above 2.45 MeV in the EDA signature region. The neutron production rate in
239Pu oxide changes based on both composition and geometry. However, the tabulated literature estimates an approximate value of ∼65–150 neutrons per second per gram [
45], which corresponds to an expected production of less than 30–75 neutrons per second for the masses analyzed in this study. When considering the effects of geometry, distance, and efficiencies, the background parameters used should be reasonable to conservative estimates of potential background situations. The importance of these background neutrons can be further investigated. To fully contextualize the benefits of this technique, its improvement in detection time should be further evaluated against conventional systems utilizing D-T generators and
3He or BF
3 detectors. Additionally, the improvements to additional application spaces for nuclear nonproliferation [
19], as well as verification of spent nuclear fuel and high-level waste [
46,
47], can be explored in future work.
