Abstract
Hydrogen generation and the correct simulation of severe accidents have been of utmost importance since the Fukushima Dai-ichi accident. QUENCH experiments are quite useful for validating mathematical models implemented in system codes for early-phase severe accidents, where hydrogen generation, fuel rod temperature, and their deterioration during these conditions are of vital importance. This paper presents a new system code, TLANESY, designed for the simulation of thermal–hydraulic systems with two-phase flow (mainly water) and with application in the analysis of severe accidents during the early phase. The computational implementation consists of fast-running numerical methods and their validation with experimental data from the QUENCH-01 experiment. The results showed an error with respect to the total hydrogen generation of approximately 0.6%. A stand-alone sensitivity analysis was also performed with some parameters related to the cladding, where it was shown that variation in the thermal conductivity by 15% can alter the total hydrogen generation by up to 5%, indicating that impurities in this material can have a significant impact on this Figure of Merit.
1. Introduction
The earthquake and tsunami that struck Japan on 11 March 2011 caused significant damage to the Fukushima Dai-ichi nuclear power plant, including the failure of the cooling system in units 1, 2, and 3 [1,2]. Without the cooling system, removing heat from the boiling water reactor (BWR) core, the fuel rods overheated, causing fuel melting, zirconium cladding oxidation, and hydrogen production [2,3,4], which occurs when temperatures exceed 1300 K [5]. The accumulation of hydrogen inside the containment buildings led to explosions and significant damage to the plant, which in turn allowed the release of radioactive material into the environment, causing a serious environmental and health crisis.
A similar process appears to have occurred at Three Mile Island, USA, on 28 March 1979, when the cooling system was lost, resulting in a partial meltdown of one of the pressurized water reactors (PWRs) and a hydrogen explosion [6,7]. Analysis of this accident and the results of comprehensive experiments inside and outside the pile showed that before the water could cool the fuel pins, further oxidation of the Zircaloy cladding occurred, leading to a sharp rise in temperature and hydrogen production [8,9].
In general, a severe transient accident begins with the failure of the reactor core cooling system, which causes gradual boiling of the coolant and temperature rise as a result of the inability to remove heat [10]. Water injection to cool the core of a light water reactor (LWR) is one of the main measures implemented to end a severe transient accident [5,9,11]; however, the increased steam generation, due to the temperature increase and the water injection, favors the production of hydrogen; therefore, this is considered the worst case scenario with respect to hydrogen production [8]. Additionally, the reaction by which hydrogen is produced is exothermic, and its rate depends exponentially on temperature [12]. Hydrogen production is a concern for reactor safety because there is only a short time before detonation limits are reached, which represents a threat to the integrity of the pressure vessel and reactor containment, which could result in the release of radioactive material into the environment [5], and it can also induce operator errors in recovery actions [8].
Since hydrogen management measures both inside and outside the vessel require demonstration that hydrogen release rates do not exceed safety critical values, severe transient accident simulation codes that provide an accurate description of hydrogen generation and thermal–hydraulic responses under extreme conditions are crucial [5]. A comprehensive experimental database is needed for the development and improvement of the mathematical models that underlie the simulators [8]. However, until the QUENCH program, experimental and analytical data were not available to support the development and validation of quench models to describe the early phase progression of severe accidents in light water reactors.
The QUENCH program is a successor to the CORA program, which aimed to investigate the interactions of materials under the conditions of a hypothetical severe nuclear accident. CORA experiments demonstrated that rapid cooling of a reactor core can lead to rapid temperature increases and high hydrogen production rates [13]; however, due to limitations in its gas analysis systems, the mechanisms of this temperature increase and the mechanisms of hydrogen production were not clear. Thus, the QUENCH program was launched in the late 1990s, with a special emphasis on creating a reliable experimental database to quantitatively determine the hydrogen source term generated during the interaction of water or steam with superheated fuel elements during flooding of the exposed core of a light water reactor [9,14].
To date, the QUENCH program has conducted 20 experiments; the first experiments (QUENCH-01 and QUENCH-02) were carried out in February and July 1998, respectively. The QUENCH experiments consist of electrical heating of high-temperature fuel bundle simulators and their subsequent cooling with water or steam. The experiments consist of four test stages: (1) heating stage, (2) pre-oxidation stage, (3) transient stage, and (4) cooling stage [15].
Many researchers have made efforts to simulate QUENCH experiments using specialized codes (e.g., [16,17,18,19]). Recently, some researchers have even developed reduced mathematical models to accurately describe QUENCH experiments (e.g., [20,21]).
This work uses and presents the TLANESY (ThermaL–hydrAulic and heat traNsfEr SYstem) code that the authors have developed during the study of multiple energy systems, for example, solar collectors [22,23], solar reactors [24], and, of course, QUENCH experiment analysis [20,21]. The mathematical model implemented in the TLANESY code was tested and validated in previous work with data from the QUENCH-05 [20] and QUENCH-06 [21] experiments, with acceptable results for temperatures at different heights, hydrogen generation, and, qualitatively, ZrO2 thickness.
Some of the main advantages of the TLANESY code, with respect to other codes, are (i) the capability of selecting internal variables for sensitivity analysis (of variable uncertainty); (ii) the possibility of making modification in the source; (iii) the TLANESY code is implemented entirely in an open programming language; (iv) the bibliographic information of the mathematical model is open; (v) the execution of the TLANESY code requires few computational resources and is therefore fast; (vi) support for a larger number of nodes (up to 78 radial nodes and 78 axial nodes); and the input file requires less information than other codes. The vision of the TLANESY code is to be a reliable, fast-running simulator for the early-phase analysis of severe accidents.
The objective of this work is to perform a stand-alone sensitivity analysis of the QUENCH-01 experiment from Karlsruhe Institute of Technology, Karlsruhe, Germany, by varying the thermal conductivity, density, heat capacity, and cladding thickness, taking the total hydrogen generation as the benchmark.
The work is organized as follows: a brief description of the QUENCH-01 experiment is presented; then, the mathematical model and its implementation in the TLANESY code are presented. The following sections show the validation of the TLANESY code using data from the QUENCH-01 experiment and the results of the stand-alone sensitivity analysis. Finally, the results are discussed and the conclusions of the work are presented.
2. Description of Experimental QUENCH Facility
The main component of the QUENCH-01 experiment is the central array, composed of 21 cylindrical simulation rods; of these, 20 are electrically heated; the remaining rod is unheated and is located in the center of the array, as shown in Figure 1. The heated rods are grouped into two sections: the first includes eight inner rods, while the second consists of the 12 outer rods. The array has four rods placed at the corners of the test area (instrumentation tubes). The four corner rods (instrumentation tubes) consist of three solid Zircaloy rods with a diameter of 6 mm and a Zircaloy tube for gas injection. All the simulation rods are held in position with the aid of five grid spacers.
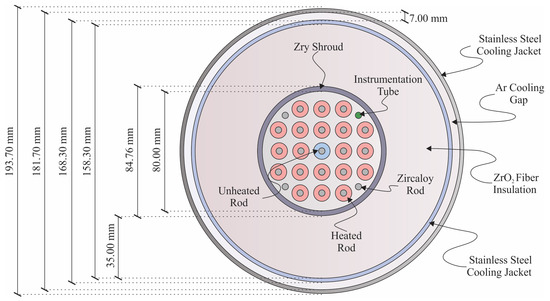
Figure 1.
Central array of the QUENCH-01 experiment.
The central array is surrounded by a 2.38 mm thick Zircaloy jacket, which has a 35 mm thick ZrO2 fiber insulation and is sealed on the outside by a stainless steel ring, which is cooled by a countercurrent argon flow, see Figure 1 [25].
The heated rods have a 10.75 mm external diameter and 0.725 mm thick Zircaloy cladding; which is filled with argon at an approximate pressure of 2.2 bar, which is above the system pressure; these bars have 6 mm diameter tungsten heaters in their central part that are surrounded by 9.15 mm external diameter zirconium oxide (ZrO2) pellets, see Figure 2a. The unheated rod is filled with 2.5 mm diameter zirconium oxide (ZrO2) pellets, as shown in Figure 2b.

Figure 2.
Composition of the simulation cylindrical rods (a) heated and (b) unheated, located in the center of the array.
The cylindrical simulation rods are approximately 2500 mm long, and the 20 rods are heated over a length of 1024 mm (see Figure 3). The heater is axially positioned in the center and connected to molybdenum and copper electrodes at its ends. The copper electrodes are connected to the DC power supply via sliding contacts made of the same material [25].
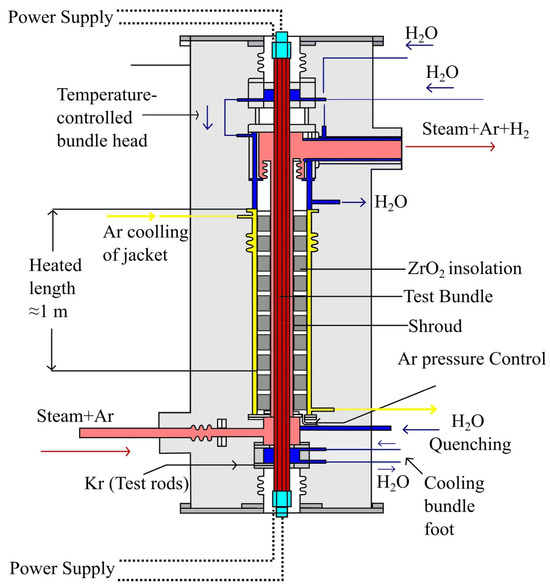
Figure 3.
Axial view of the heated simulation rods.
The QUENCH-01 test consisted of six stages (see Figure 4) [25]:
- (1)
- Heating: In this stage, approximately 5.5 kW were supplied until the system reached approximately 1030 K. In total, 4.5 g/s of steam and 3 g/s of argon were injected.
- (2)
- Helium Injection: Helium was injected to determine the hydrogen transport delay time to the mass spectrometer and the Caldos system, which is a gas sampling and analysis unit used in the QUENCH facility to monitor hydrogen concentration during transient experiments [25].
- (3)
- Second heating period: Approximately 13 kW were supplied for 900 s until the system reached approximately 1400 K. During this stage, 3 g/s of steam and 3 g/s of argon were injected.
- (4)
- Pre-oxidation: This stage lasted approximately 8160 s. Approximately 12 kW were supplied, reaching a temperature of approximately 1600 K to achieve the required oxide layer thickness of 300 µm at a height of 900 mm.
- (5)
- Transiently, heat was supplied at 20 kW for approximately 500 s. The temperature was raised at a rate of 0.5 K/s. During this stage, a cooling water flow of 100 g/s and an argon flow of 3 g/s were injected. During this stage, the maximum temperature in the cladding was reached (~1800 K).
- (6)
- During the quench, the heat supply was reduced to 4 kW for 80 s (to represent the remaining heat), and a cooling water flow of 50 g/s and argon were injected at 3 g/s. The experiment was terminated by removing the heat supply and cutting off the cooling water and the argon flow.
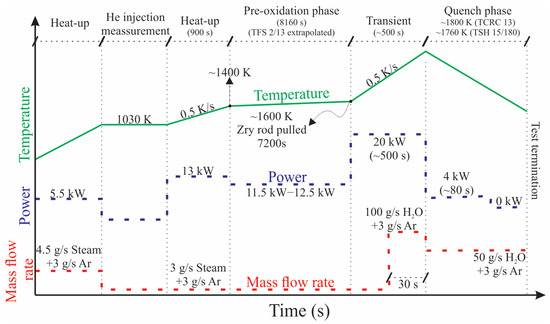
Figure 4.
Stages of the QUENCH-01 experiment.
3. Mathematical Model
The TLANESY code solves the transport equations for two-phase flow in a homogeneous, transient, and one-dimensional manner, which is shown below [22,26].
Energy transport
Momentum transport
Continuity equations
Steam phase
Liquid phase
where ρm is the density of the liquid-steam mixture, ρs is the saturated steam density, ρl is the saturated liquid density, hm is the specific enthalpy of the mixture, Gm is the mass flux of the mixture, t is the time variable, z is the axial component, V is the volume, q is the heat flux from the walls to the fluid, S is the heat transfer surface area, p is the pressure, f is the friction coefficient, Dh is the hydraulic diameter, g is the gravity, θ is the inclination angle, α is the void fraction, x is the steam quality, Γs is the steam mass generation rate per unit volume, and Γl is the liquid mass generation rate per unit volume. Some limitations of this model, for homogeneous two-phase flow, should be taken into account, such as the temperature for steam and liquid being the same during the phase-change, and the phase velocities being the same; however, the model can predict an acceptable scenario by applying adequate correlations that facilitate its implementation [26].
The heat flux is calculated using the following expression:
where hcon is the convective heat transfer coefficient, Tw is the wall temperature where the fluid is in contact, and Tm is the temperature of the liquid-steam mixture. The calculation of the convective heat transfer coefficient is based on the work of [21].
The heat transfer model is taken from [22], and is given by
where T is the temperature of the material, Cp is the heat capacity, ρ is the density, and qv is the volumetric power generation.
The numerical solution of the presented models can be read in detail in [22], where the radiation heat transfer mechanism and its solution method implemented in the TLANESY code are described.
To consider hydrogen generation, the code has implemented the parabolic model, whose expression is shown below [27].
where K is the oxidation kinetic coefficient and w is the amount of oxygen gained per unit area. From the above, the coefficient is given by
where a is the pre-exponential coefficient, Q is the activation energy, and R is the ideal gas constant. Both the pre-exponential coefficient and the activation energy strongly depend on the correlation used and the temperature range of application. In this work, the correlation of Leistikow et al. [28] is used for the temperature range 1073–1773 K, and the Baker and Just correlation [29] is used for the range 1773–2023 K. The numerical implementation is based on the work [20]. It is important to mention that the code cannot simulate the cross flow between rods, at least in this current version.
The code is implemented in the C++ language, version 2020. In Figure 5, the flow chart is shown.
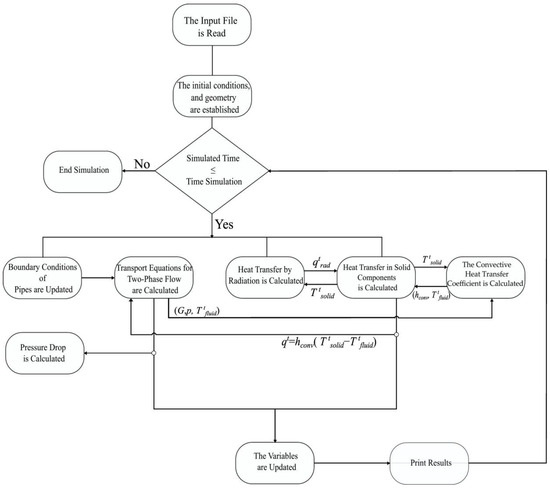
Figure 5.
Flow chart of TLANESY code.
4. Parameters in the Input File
There are some input parameters for each component or pipe, as well as general and material parameters that describe each of the component properties. To describe these parameters within the program, information cards are used to declare the property to be set, followed by the assigned value. In the following subsections, a brief description of the input file is added.
4.1. General Parameters
Table 1 shows the general parameters used at the beginning of the input; they are responsible for establishing the general characteristics during the simulation, such as total simulation time, time steps, and result-reporting time.

Table 1.
General parameters in the input file.
4.2. Solid Components
Table 2 presents the input parameters for a solid component, that is, its geometric and physical characteristics.

Table 2.
Input parameters for solid components.
4.3. Thermal Radiation
Table 3 shows the input parameters related to thermal radiation that apply to the analyzed components.

Table 3.
Parameters related to thermal radiation.
4.4. Boundary Condition of Pipes
Table 4 shows the input parameters related to the boundary conditions applied in pipes.

Table 4.
Boundary condition of pipes.
4.5. Pipes
Table 5 shows the input parameters related to the pipe conditions.

Table 5.
Input parameters for pipe components.
4.6. Materials
To add materials, they are identified by a number, and their thermal characteristics are added in the form of a table, establishing thermal conductivity, density, and heat capacity at constant pressure as a function of temperature. Each value is interpolated between each row of the table.
5. Simulation Model in TLANESY
The experimental simulation considered 19 axial nodes and four regions in the assembly. The axially nodalized system is shown in Figure 6a. This figure represents the separation of the axial volumes by means of dotted lines at different positions, and the different materials are also shown in different colors. According to Figure 6a, the simulation has five components: the first is the unheated rod corresponding to region 1, denoted as UR; components FR1 and FR2 represent the heated rods in regions 2 and 3, respectively; the CR component represents the corner rods associated with region 4; and finally, the shroud is the component at the periphery of the system. Figure 6b shows the configuration of the radial regions and the components that comprise each region.
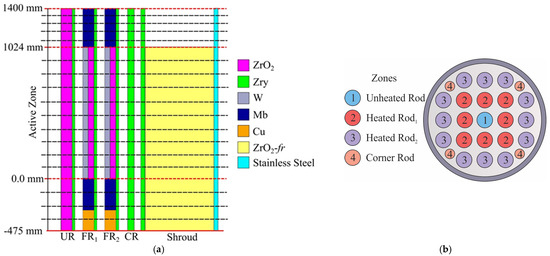
Figure 6.
Model configuration in TLANESY code (a) axial nodalization and (b) assembly zones.
Table 6 shows the time steps for each stage of the test, based on Figure 4, which shows the corresponding stages. The time steps are set in the input for the duration of each test. Unlike the experimental test, which has six stages, only the final four stages were simulated in the code, as shown in the table; therefore, the simulation begins from the second heat-up phase.

Table 6.
Time step for the simulation at different stages.
6. Results
In the simulation and the experiment, several elements are important, such as the ability to correctly predict the cladding temperature at different heights, as well as the hydrogen generation rate, a parameter of utmost importance for safety during nuclear accidents. With the simulation performed with the TLANESY code, these parameters are compared to demonstrate the predictive power of the model. Figure 7 shows the simulation of the experiment, showing the temperature field of the components at different times, t = 1506.05 s, t = 9269.05 s, t = 9680.93 s, and t = 9800.33 s, where the heating, pre-oxidation, beginning of quenching, and ending of quenching processes are represented, respectively. In Figure 7, the components are named as UR, FR1, FR2, CR, Sh, alluding to the unheated rod, heated rod in zone 1, heated rod in zone 2, corner rod, and shroud components, respectively.
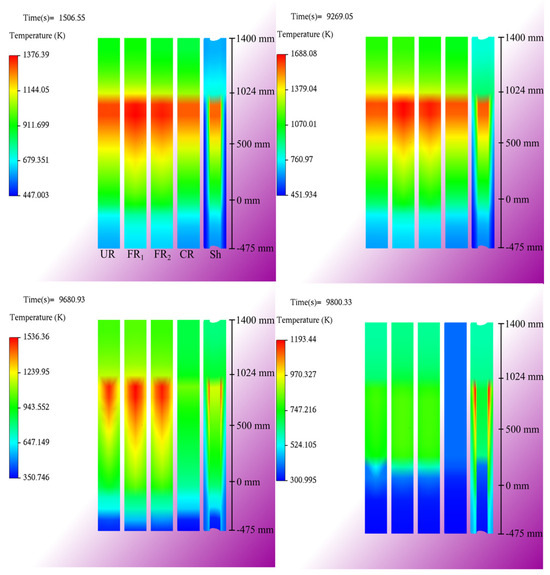
Figure 7.
Temperature field of the components for key times in the simulation.
Figure 8a presents a comparison of the cladding temperature at a height of 950 mm, both experimentally and from the simulation. The simulation shows an acceptable fit during the time interval of 0–9800 s; however, during the quenching process, the code predicts an accelerated cooling compared to the experimental data. This is attributed to the fact that the code still considers film boiling throughout this process, since the wall temperature is well above the minimum wall temperature. It is understandable that empirical models for simulating two-phase flow are closely linked to experiments and validation ranges, so it is expected that the simulation under these conditions will have some discrepancies.
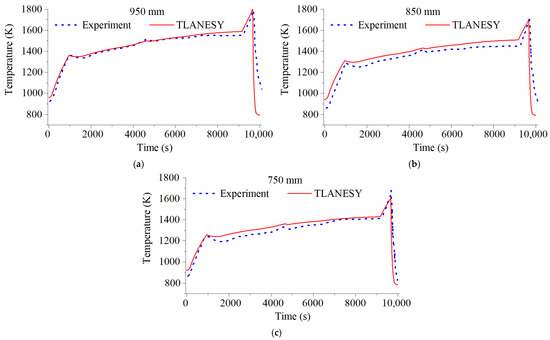
Figure 8.
Comparison of cladding temperature and simulation at different axial levels: (a) 950 mm, (b) 850 mm, and (c) 750 mm height.
Figure 8b shows the temperature comparison behavior at a height of 850 mm. This figure shows that the code responds to the experimentally predicted trend, which strengthens the implemented model. There is an overestimation of the temperature during the simulation, with a relative error of approximately 5% with respect to the experimental data. Likewise, Figure 8c shows the temperature comparison at a height of 750 mm, exhibiting behavior similar to Figure 8a,b. However, in this figure, the temperature behavior exhibits a trend that is more faithful to the experimental data.
Hydrogen generation is an important factor in these experiments, which became relevant after the Fukushima Dai-ichi accident, since the generated hydrogen—and its subsequent detonation—was responsible for the release of radioactive material into the environment. In this sense, the code predicted favorable results. In Figure 9a, the generation rate fits acceptably with the generation predicted by the experiment; only at the time of the quenching process, the generation peak could not be correctly reproduced, since this event only occurs for a few seconds. The code showed good results in this regard throughout the simulation. The integral of hydrogen generated is shown in Figure 9b, giving results similar to those established in the experiment, where the code predicts 37.8 g, while the simulation reported a value of 38.0 g at the end of the experiment, being a difference of only 0.2 g (0.52% relative error), quite acceptable for this type of experiments given the complexity of the phenomena.

Figure 9.
Comparison of (a) hydrogen generation rate and (b) integral hydrogen generation.
7. Sensitivity Analysis on Thermophysical Parameters
The thermophysical parameters of the cladding have a certain degree of relevance in terms of transients, since the calculation determined for these parameters has a degree of associated margin of error that interferes with the accuracy of the result depending on the Figure of Merit (FoM) selected.In this work, hydrogen generation is considered as the Figure of Merit, depending on the thermophysical parameters of the cladding, such as density, heat capacity at constant pressure, and thermal conductivity. In turn, there is uncertainty in the manufacturing of this component; therefore, the thickness of this component can affect the progression of hydrogen generation. Therefore, a stand-alone simulation was performed in this work to determine the impact of these variables during the simulation and, in turn, identify the most relevant variable, comparing these results with those obtained experimentally. Table 6 presents the variables and their degree of uncertainty, according to the authors’ judgment.
In the authors’ opinion, a variation of ±5% and ±2% in cladding density and thickness, respectively, due to small imperfections during the manufacturing process and/or measurement errors, is considered. Additionally, the density may suffer small variations due to temperature. Previous studies [16] have investigated the influence of the thermal properties of ZrO2, considering a deviation of 20% as they are temperature dependent; in this study, a deviation of ±10% is considered for the heat capacity of cladding due to small temperature variations in this material. The ±15% for thermal conductivity accounts for potential variation due to impurities or irradiation damage, which can significantly alter heat transfer characteristics, as noted in [22].
Figure 10 presents the results of the sensitivity analysis of hydrogen generation from the simulation using a stand-alone simulation based on the uncertainty variations in Table 7. In the figure, it can be observed that the variations related to the thermal capacity (Figure 10b), the density (Figure 10c), and the cladding thickness (Figure 10d) do not considerably affect the generation of hydrogen in the uncertainty band where it applies. However, thermal conductivity is one of the parameters in which a significant variation is observable compared to the other parameters. Figure 10a indicates that as thermal conductivity increases, the amount of hydrogen generation decreases. This is associated with the fact that, by having better thermal conduction of the cladding, the heat removal by the surrounding fluid is more efficient; therefore, the cladding temperature decreases, and the oxidation rate decreases as well. On the other hand, when thermal conductivity decreases, the heat from heating the fuel rod does not allow the correct distribution of heat in the cladding, and in turn, the transfer of heat to the fluid, increasing the temperature and thus the amount of hydrogen. This is the result of a feedback effect between the oxidation kinetics and the cladding temperature, since as the temperature increases, the oxidation kinetics coefficient shown in Equation (8) increases too, increasing the hydrogen generation about 5% at the end of the simulation; therefore, impurities that can alter the thermal conductivity of the cladding, and thus, the progression of a severe accident in the early phase.
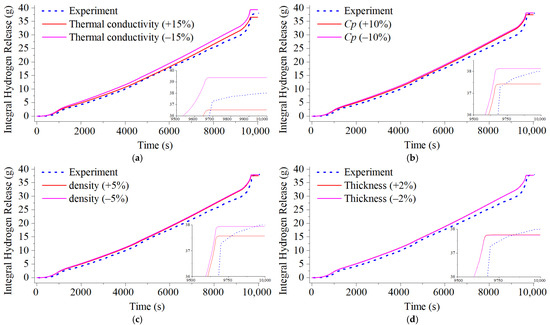
Figure 10.
Stand-alone sensitivity analysis of hydrogen generation by varying cladding parameters: (a) thermal conductivity; (b) thermal capacity; (c) density; (d) cladding thickness.

Table 7.
Uncertainty associated with different thermophysical parameters of the cladding.
Other analyses performed are regarding the boundary conditions, in this case, the mass flow into the bundle and the fluid inlet temperature. Figure 11 illustrates the sensitivity analysis of these parameters, where the mass flow varied by approximately ±2% and the inlet temperature had a variation of about ±5%. In both cases, it is possible to observe that these boundary conditions had a greater impact on the FoM, in comparison to the previous analysis. The uncertainty related to the measurement instrument implies a significant importance during the experiment, and some values can be modified due to slight deviations, as it is shown here. In Figure 11a, the maximum error at the end of the simulation was around 7.42%, while the maximum error according to Figure 11b was 8.22%.

Figure 11.
Stand-alone sensitivity analysis of hydrogen generation by varying cladding parameters: (a) mass flow; (b) temperature.
8. Conclusions
TLANESY, a new thermal–hydraulics system code with capabilities to model early-phase severe accidents, is under development and in the process of verification and validation. In this work, a validation exercise using the well-known QUENCH facility has been performed. The results obtained with the TLANESY code show very good agreement in comparison with the experimental data obtained from the QUENCH-01 experiment. The capability of TLANESY to reproduce hydrogen generation, a key phenomenon in the study of severe accidents, is demonstrated as satisfactory. Such good results on hydrogen generation are also supported by a very good agreement between calculations and experimental data for the cladding temperature during the transient. Furthermore, a sensitivity exercise was also presented to assess the effect of some thermophysical parameters of the cladding on the hydrogen generation. It was found that among all the parameters studied, thermal conductivity is the one in which a significant variation is observable compared to the other parameters. Specifically, when thermal conductivity decreases, the heat from heating the fuel rod does not allow the correct distribution of heat in the cladding, and in turn, the transfer of heat to the fluid, increasing the hydrogen generation by about 5% at the end of the simulation in this case study. Nonetheless, the boundary conditions had a considerable impact on the prediction of the hydrogen production, mass flow, and fluid inlet temperature, even with a small deviation on both parameters, ±2% and ±5% for mass flow and fluid inlet temperature, respectively. Therefore, the uncertainty related to the measurement should be taken into account. As a conclusion, changes in the thermal conductivity of the cladding, due to impurities, for example, are important to be considered to simulate correctly the progression of an early phase severe accident. The continuation of the efforts to verify and validate the new code TLANESY will be carried out as future work.
Author Contributions
Conceptualization, H.S.-M. and S.Q.-G.; methodology, H.S.-M. and N.C.-P.; software, H.S.-M.; validation, H.S.-M. and N.C.-P.; formal analysis, H.S.-M. and A.M.G.T.; investigation, H.S.-M., S.Q.-G. and R.I.C.R.; resources, H.S.-M. and A.M.G.T.; data curation, H.S.-M., S.Q.-G. and N.C.-P.; writing—original draft preparation, H.S.-M., S.Q.-G. and R.I.C.R.; writing—review and editing, A.M.G.T. and H.S.-M.; visualization, H.S.-M. and S.Q.-G.; supervision, A.M.G.T.; project administration, H.S.-M. All authors have read and agreed to the published version of the manuscript.
Funding
This research received no external funding.
Data Availability Statement
The data presented in this study are available upon request from the corresponding author due to ongoing research. Access to the data is restricted to ensure the integrity and confidentiality of the continuing investigations. Researchers interested in collaborating or seeking further information are encouraged to contact the corresponding author, who will evaluate requests on a case-by-case basis in accordance with our data sharing policies and ethical considerations.
Acknowledgments
Ricardo-I Cázares-Ramírez (CVU 387444) acknowledges the financial support of SECIHTI, provided through the postdoctoral fellowship EPM2023.
Conflicts of Interest
The authors declare no conflicts of interest.
References
- Hirose, K.; Povinec, P.P. Ten years of investigations of Fukushima radionuclides in the environment: A review on process studies in environmental compartments. J. Environ. Radioact. 2022, 251–252, 106929. [Google Scholar] [CrossRef] [PubMed]
- Pellegrini, M.; Herranz, L.; Sonnenkalb, M.; Lind, T.; Maruyama, Y.; Gauntt, R.; Bixler, N.; Morreale, A.; Dolganov, K.; Sevon, T.; et al. Main Findings, Remaining Uncertainties and Lessons Learned from the OECD/NEA BSAF Project. Nucl. Technol. 2020, 206, 1449–1463. [Google Scholar] [CrossRef]
- Zinkle, S.J.; Terrani, K.A.; Gehin, J.C.; Ott, L.J.; Snead, L.L. Accident tolerant fuels for LWRs: A perspective. J. Nucl. Mater. 2014, 448, 374–379. [Google Scholar] [CrossRef]
- Terrani, K.A.; Zinkle, S.J.; Snead, L.L. Advanced oxidation-resistant iron-based alloys for LWR fuel cladding. J. Nucl. Mater. 2014, 448, 420–435. [Google Scholar] [CrossRef]
- Hofmann, P.; Miassoedov, A.; Steinbock, L.; Steinbrück, M.; Berdyshev, A.V.; Boldyrev, A.V.; Palagin, A.V.; Shestak, V.E.; Veshchunov, M.S. Quench Behavior of Zircaloy Fuel Rod Cladding Tubes. Small-Scale Experiments and Modeling of the Quench Phenomena; FZKA 6208 NV-COBE(98)-D018; Institut für Materialforschung: Aalen, Germany, 1999. [Google Scholar] [CrossRef]
- Dobashi, R. Fire and explosion disasters occurred due to the Great East Japan Earthquake (March 11, 2011). J. Loss Prev. Process Ind. 2014, 31, 121–126. [Google Scholar] [CrossRef]
- Skillman, G.R.; Rempe, J.L. The Three Mile Island Unit 2 Accident. In Encyclopedia of Nuclear Energy; Elsevier: Amsterdam, The Netherlands, 2021; pp. 17–29. [Google Scholar] [CrossRef]
- Hofmann, P. Current knowledge on core degradation phenomena, a review. J. Nucl. Mater. 1999, 270, 194–211. [Google Scholar] [CrossRef]
- Sepold, L.; Hofmann, P.; Leiling, W.; Miassoedov, A.; Piel, D.; Schmidt, L.; Steinbrück, M. Reflooding experiments with LWR-type fuel rod simulators in the QUENCH facility. Nucl. Eng. Des. 2001, 204, 205–220. [Google Scholar] [CrossRef]
- Fujisawa, N.; Liu, S.; Yamagata, T. Numerical study on ignition and failure mechanisms of hydrogen explosion accident in Fukushima Daiichi Unit 1. Eng. Fail. Anal. 2021, 124, 105388. [Google Scholar] [CrossRef]
- Sehgal, B.R. Stabilization and termination of severe accidents in LWRs. Nucl. Eng. Des. 2006, 236, 1941–1952. [Google Scholar] [CrossRef]
- Steinbrück, M.; Birchley, J.; Goryachev, A.V.; Grosse, M.; Haste, T.J.; Hozer, Z.; Kisselev, A.E.; Nalivaev, V.I.; Semishkin, V.P.; Sepold, L.; et al. Status of studies on high-temperature oxidation and quench behaviour of Zircaloy-4 and E110 cladding alloys. In Proceedings of the 3rd European Review Meeting on Severe Accident Research, ERMSAR-2008, Nesseber, Bulgaria, 23–25 September 2008; pp. 1–26. [Google Scholar]
- Hagen, S.; Hofmann, P.; Noack, V.; Sepold, L.; Schanz, G.; Schumacher, G. Impact of Absorber Rod Material on Bundle Degradation Seen in CORA Experiments; Forschungszentrum Karlsruhe GmbH Technik und Umwelt: Karlsruhe, Germany, 1996. [Google Scholar] [CrossRef]
- Steinbrück, M.; Große, M.; Sepold, L.; Stuckert, J. Synopsis and outcome of the QUENCH experimental program. Nucl. Eng. Des. 2010, 240, 1714–1727. [Google Scholar] [CrossRef]
- Sepold, L.; Hering, W.; Schanz, G.; Scholtyssek, W.; Steinbrück, M.; Stuckert, J. Severe fuel damage experiments performed in the QUENCH facility with 21-rod bundles of LWR-type. Nucl. Eng. Des. 2007, 237, 2157–2164. [Google Scholar] [CrossRef]
- Kaliatka, T.; Kaliatka, A.; Vileiniskis, V. Application of Best Estimate Approach for Modelling of QUENCH-03 and QUENCH-06 Experiments. Nucl. Eng. Technol. 2016, 48, 419–433. [Google Scholar] [CrossRef]
- Sánchez-Mora, H.; Pericas, R.; Mustafa, R.; Vázquez-Rodríguez, R. Comparison of the QUENCH-06 experiment between ASYST and RELAP/SCDAPSIM 3.4. Nucl. Eng. Des. 2024, 428, 113517. [Google Scholar] [CrossRef]
- Fernandez-Moguel, L.; Bals, C.; Beuzet, E.; Bratfisch, C.; Coindreau, O.; Hózer, Z.; Stuckert, J.; Vasiliev, A.; Vryashkova, P. SARNET2 benchmark on air ingress experiments QUENCH-10, -16. Ann. Nucl. Energy 2014, 74, 12–23. [Google Scholar] [CrossRef]
- Konstantinov, V.S.; Parshin, N.Y.; Dragunov, Y.G.; Shchekoldin, V.V.; Kiselev, A.E.; Vinogradova, T.B. PARAMETR-M facility capabilities for severe accident code verification. Nucl. Eng. Des. 2007, 237, 1759–1764. [Google Scholar] [CrossRef]
- Sánchez-Mora, H.; Vázquez-Rodríguez, R.; Espinosa-Martínez, É.-G.; Cázares-Ramírez, R.I.; Quezada-García, S. Hydrogen generation analysis of the QUENCH-05 experiment. Nucl. Eng. Des. 2023, 414, 112528. [Google Scholar] [CrossRef]
- Sánchez-Mora, H.; Ortiz-Villafuerte, J.; Gómez-Torres, A.M.; Queral, C.; Quezada-García, S. Mathematical model of the QUENCH-06 experiment with sensitivity and uncertainty analysis in hydrogen generation. Int. J. Heat Mass Transf. 2023, 200, 123553. [Google Scholar] [CrossRef]
- Sánchez–Mora, H.; Escobedo–Izquierdo, M.A.; Jaramillo–Mora, A.; Pericas, R.; Quezada–García, S. Heat transfer model for the trapezoidal cavity receiver of linear Fresnel reflector–type collectors. Sol. Energy 2025, 286, 113156. [Google Scholar] [CrossRef]
- Sánchez-Mora, H.; Quezada-García, S.; Polo-Labarrios, M.A.; Cázares-Ramírez, R.I.; Torres-Aldaco, A. Dynamic mathematical heat transfer model for two-phase flow in solar collectors. Case Stud. Therm. Eng. 2022, 40, 102594. [Google Scholar] [CrossRef]
- Sánchez-Mora, H.; Santamaria-Padilla, A.; Romero-Paredes, H.; Villafán-Vidales, H.I. Validation of a mathematical model for the simulation of a multitubular and multitask solar reactor. Appl. Therm. Eng. 2024, 248, 123166. [Google Scholar] [CrossRef]
- Hofmann, P.; Hering, W.; Homann, C.; Leiling, W.; Miassoedov, A.; Piel, D.; Schmidt, L.; Sepold, L.; Steinbrück, M. QUENCH-01. Experimental and Calculational Results; Forschungszentrum Karlsruhe GmbH: Karlsruhe, Germany, 1998. [Google Scholar] [CrossRef]
- Todreas, N.E.; Kazimi, M.S. Nuclear Systems I: Thermal Hydraulic Fundamentals; Corporation, H.P., Ed.; Hemisphere Publishing Corporation: Washington, DC, USA, 1990. [Google Scholar]
- Khanna, A.S. 5—High Temperature Oxidation, Handbook of Environmental Degradation of Materials, 2nd ed.; William Andrew Publishing: Norwich, NY, USA, 2012; pp. 127–194. [Google Scholar] [CrossRef]
- Leistikow, S.; Schanz, G.; Berg, H.V.; Aly, A.E. Comprehensive Presentation of Extended Zircaloy-4 Steam Oxidation Results (600–1600 °C). In Proceedings of the OECD-NEA-CSNI/IAEA Specialists’ Meeting on Water Reactor Fuel Safety and Fission Product Release in Off-Normal and Accident Conditions, Risø National Laboratory, Roskilde, Denmark, 16–20 May 1983. [Google Scholar]
- Baker, L.; Just, L.C. Studies of metal-water reactions at high temperatures III. In Experimental and Theoretical Studies of the Zirconium-Water Reaction; ANL-6548; Office of Scientific and Technical Information (OSTI): Oak Ridge, TN, USA, 1962. [Google Scholar]
Disclaimer/Publisher’s Note: The statements, opinions and data contained in all publications are solely those of the individual author(s) and contributor(s) and not of MDPI and/or the editor(s). MDPI and/or the editor(s) disclaim responsibility for any injury to people or property resulting from any ideas, methods, instructions or products referred to in the content. |
© 2025 by the authors. Licensee MDPI, Basel, Switzerland. This article is an open access article distributed under the terms and conditions of the Creative Commons Attribution (CC BY) license (https://creativecommons.org/licenses/by/4.0/).