Article

Optimization of the LIBS Technique in Air, He, and Ar at Atmospheric Pressure for Hydrogen Isotope Detection on Tungsten Coatings

ENEA, Italian National Agency for New Technologies, Energy and Sustainable Economic Development, Frascati Research Center, Via Enrico Fermi, 45, 00044 Frascati, Italy
*
Author to whom correspondence should be addressed.
J. Nucl. Eng. 2025, 6(3), 22; https://doi.org/10.3390/jne6030022
Submission received: 6 May 2025 / Revised: 10 June 2025 / Accepted: 23 June 2025 / Published: 1 July 2025
(This article belongs to the Special Issue Fusion Materials with a Focus on Industrial Scale-Up)

Abstract

In current and future fusion devices, detecting hydrogen isotopes, particularly tritium and deuterium, implanted or redeposited on the surface of Plasma-Facing Components (PFCs) will be increasingly important to ensure safe machine operations. The Laser-Induced Breakdown Spectroscopy (LIBS) technique has proven capable of performing this task directly in situ, without handling or removing PFCs, thus limiting analysis times and increasing the machine’s duty cycle. To increase sensitivity and the ability to discriminate between isotopes, LIBS analysis can be performed under different background gases at atmospheric pressure, such as air, He, and Ar. In this work, we present the results obtained on tungsten coatings enriched with deuterium and/or hydrogen as a deuterium–tritium nuclear fuel simulant, measured with the LIBS technique in air, He, and Ar at atmospheric pressure, and discuss the pros and cons of their use. The results obtained demonstrate that both He and Ar can improve the LIBS signal resolution of the hydrogen isotopes compared to air. However, using Ar has the additional advantage that the same procedure can also be used to detect He implanted in PFCs as a product of fusion reactions without any interference. Finally, the LIBS signal in an Ar atmosphere increases in terms of the signal-to-noise ratio (SNR), enabling the use of less energetic laser pulses to improve performance in depth profiling analyses.

Graphical Abstract

1. Introduction

Monitoring the accumulation of tritium (T) inside a vacuum vessel (VV) is of paramount importance in future fusion devices and crucial for ensuring the safe operation of future tokamaks. Once tritium retention exceeds a critical threshold (e.g., 700 g in ITER) [1], it may be necessary to interrupt plasma operations until the stored tritium can be removed. Tritium retention in the VV occurs through direct implantation into the surfaces of Plasma-Facing Components (PFCs) and the co-deposition of materials that are eroded from the surfaces of PFCs in some areas of the VV and transported to other areas [1,2,3]. Currently, tungsten (W) is a candidate material for ITER PFCs due to its properties, such as a high melting point, high thermal conductivity, low sputtering yield, and low retention rate for hydrogen isotopes, and it has therefore been proposed both as a surface coating for structural materials and as a bulk material for PFCs.
To date, research aimed at quantifying the T content in PFCs has been mainly supported by post mortem analyses [4], once removed from the VV during machine maintenance periods. In the future, however, to reduce these periods and increase the machine duty cycle, access to PFCs should be more limited. This need supports the development of complementary, in situ measurement methods that work without removing PFCs from the VV. Laser-Induced Breakdown Spectroscopy (LIBS) [5] is a candidate technique to solve these issues, attracting increasing interest for its features. LIBS can indeed perform in situ qualitative and quantitative analytical chemistry studies on PFCs [6,7,8], simultaneously revealing all the chemical elements and the possible presence of hydrogen isotopes without any preliminary sample preparation. LIBS typically requires only a few μg of sample for analysis, leaving any PFC substantially intact for any subsequent analysis, and can be applied both in vacuum [9,10] and at atmospheric pressure, both in contact and at several meters from the sample [9]. Finally, LIBS is sensitive to materials with a structure composed of multiple thin overlapping layers, with thicknesses of up to a few hundred nm [9,11], which makes it suitable for performing depth profiling analyses and investigating the fuel retention, erosion, or re-deposition of materials in PFCs.
In this work, we report on the LIBS analysis of fusion-relevant metallic coatings composed of W enriched with D, H, or both to simulate unburned nuclear fuel deposited or implanted on the surfaces of PFCs. The measurements were carried out under a He or Ar flux of 2 L/min to improve the spectral resolution of the Balmer alpha lines (Dα and Hα at 656.1 nm and 656.28 nm, respectively) of the two isotopes. The measurements were compared to similar standard measurements carried out in air. A high depth resolution, down to 500 nm per single laser shot, was obtained, while still maintaining a good SNR for spectral features ascribable to the emitting species. The application of the two background gases, He and Ar, led to the conclusion that He could be a good choice when the discrimination and spectral resolution of the Dα and Hα peaks are a priority in the investigation, whereas Ar is better for increasing the SNR of the whole signal and applying a reduced pulse energy to increase the depth resolution and detect other elements. A semi-quantitative estimation of the D-H contained in the samples was performed by applying the calibration-free (CF) method [12], which does not require any reference or calibration sample.

2. Materials and Methods

A sample simulating co-deposits of W with D and H was produced at the National Institute for Laser, Plasma and Radiation Physics in Romania (NILPRP) by High-Power Impulse Magnetron Sputtering (HiPIMS) [13]. It consists of a molybdenum (Mo) sample with an area of 11 × 15 mm2 and a 1 mm thick metal plate. The sample (W-D sample hereafter) is composed of a 5 μm thick W surface layer, co-deposited with D on a Mo substrate.
The LIBS system is composed of a Montfort M-NANO PIV Nd:YAG double-pulse laser (wavelength: 1064 nm; pulse duration: 8 ns; max repetition rate: 20 Hz; output spot diameter: about 3 mm) capable of delivering two laser pulses, with a maximum energy ~65 mJ each, temporally delayed up to 300 μs [7]. The two pulses were set to overlap (interpulse delay = 0 s) to act as a single pulse and were focused by a plano-convex lens on the target with a 25 mm diameter and f = 100 mm. From the observation of the LIBS craters through an optical microscope, the diameter of the laser spots on the target’s surface was found to be ~350 μm. The LIBS plasma was collected by a 50 mm diameter UVFS plano-convex lens, with f = 150 mm, on an optical path of collection almost collinear to the laser beam, tilted by 10 degrees, to collect light mainly from the central region of the plasma and reduce the influence of the peripheral zones, which are known to have a lower temperature and electron density than the central part [14,15]. The lens directed the LIBS signal towards a 2 mm diameter circular fiber bundle, composed of 17 fibers, N.A. 0.22 with a 245 μm diameter, plus a single fiber, N.A. 0.22 with a 50 μm diameter. The 6 m long bundle was bifurcated at 4 m into two branches: the first contained the 17 fibers embedded in an S.S. ferrule and aligned to create a 4.16 mm long linear bundle, while the second contained the single fiber in an SMA connector.
The two branches were connected to two different spectroscopic systems: the first branch to an ISA Jobin Yvon “TRIAX550” Czerny–Turner monochromator, with a 2400 g/mm grating (λ/Δλ = 50,000) and a resolution of Δλ = 656/50,000~0.013 nm at 656 nm, sufficient to detect the nearby Dα and Hα lines. An Andor “ISTAR” ICCD camera DH534-18 F (1024 × 256 pixels) recorded the LIBS signal, covering a spectral window of up to 12 nm. The second branch was connected to an Echelle “Aryelle 100” spectrometer by LTB, capable of recording the LIBS signal over a broad spectral range (225–760 nm) with a resolution of up to 9000. A second Andor “ISTAR” camera completed the setup. A schematic diagram and picture of the entire system are shown in Figure 1:

3. Results and Discussion

3.1. Detection of D on the W-D Sample

The W-D sample was used to optimize the detection of D in the presence of the interfering H emission from the environment, using two background gases (He and Ar) and comparing the signal with respect to LIBS in air. For each gas, the pulse energy was set to 50 mJ, with a repetition rate of 2 Hz, while the gate width of the ICCD was fixed to 3 μs. The gate delay was optimized in the three cases to obtain the maximum resolution of the two Dα and Hα peaks while still maintaining a good SNR.
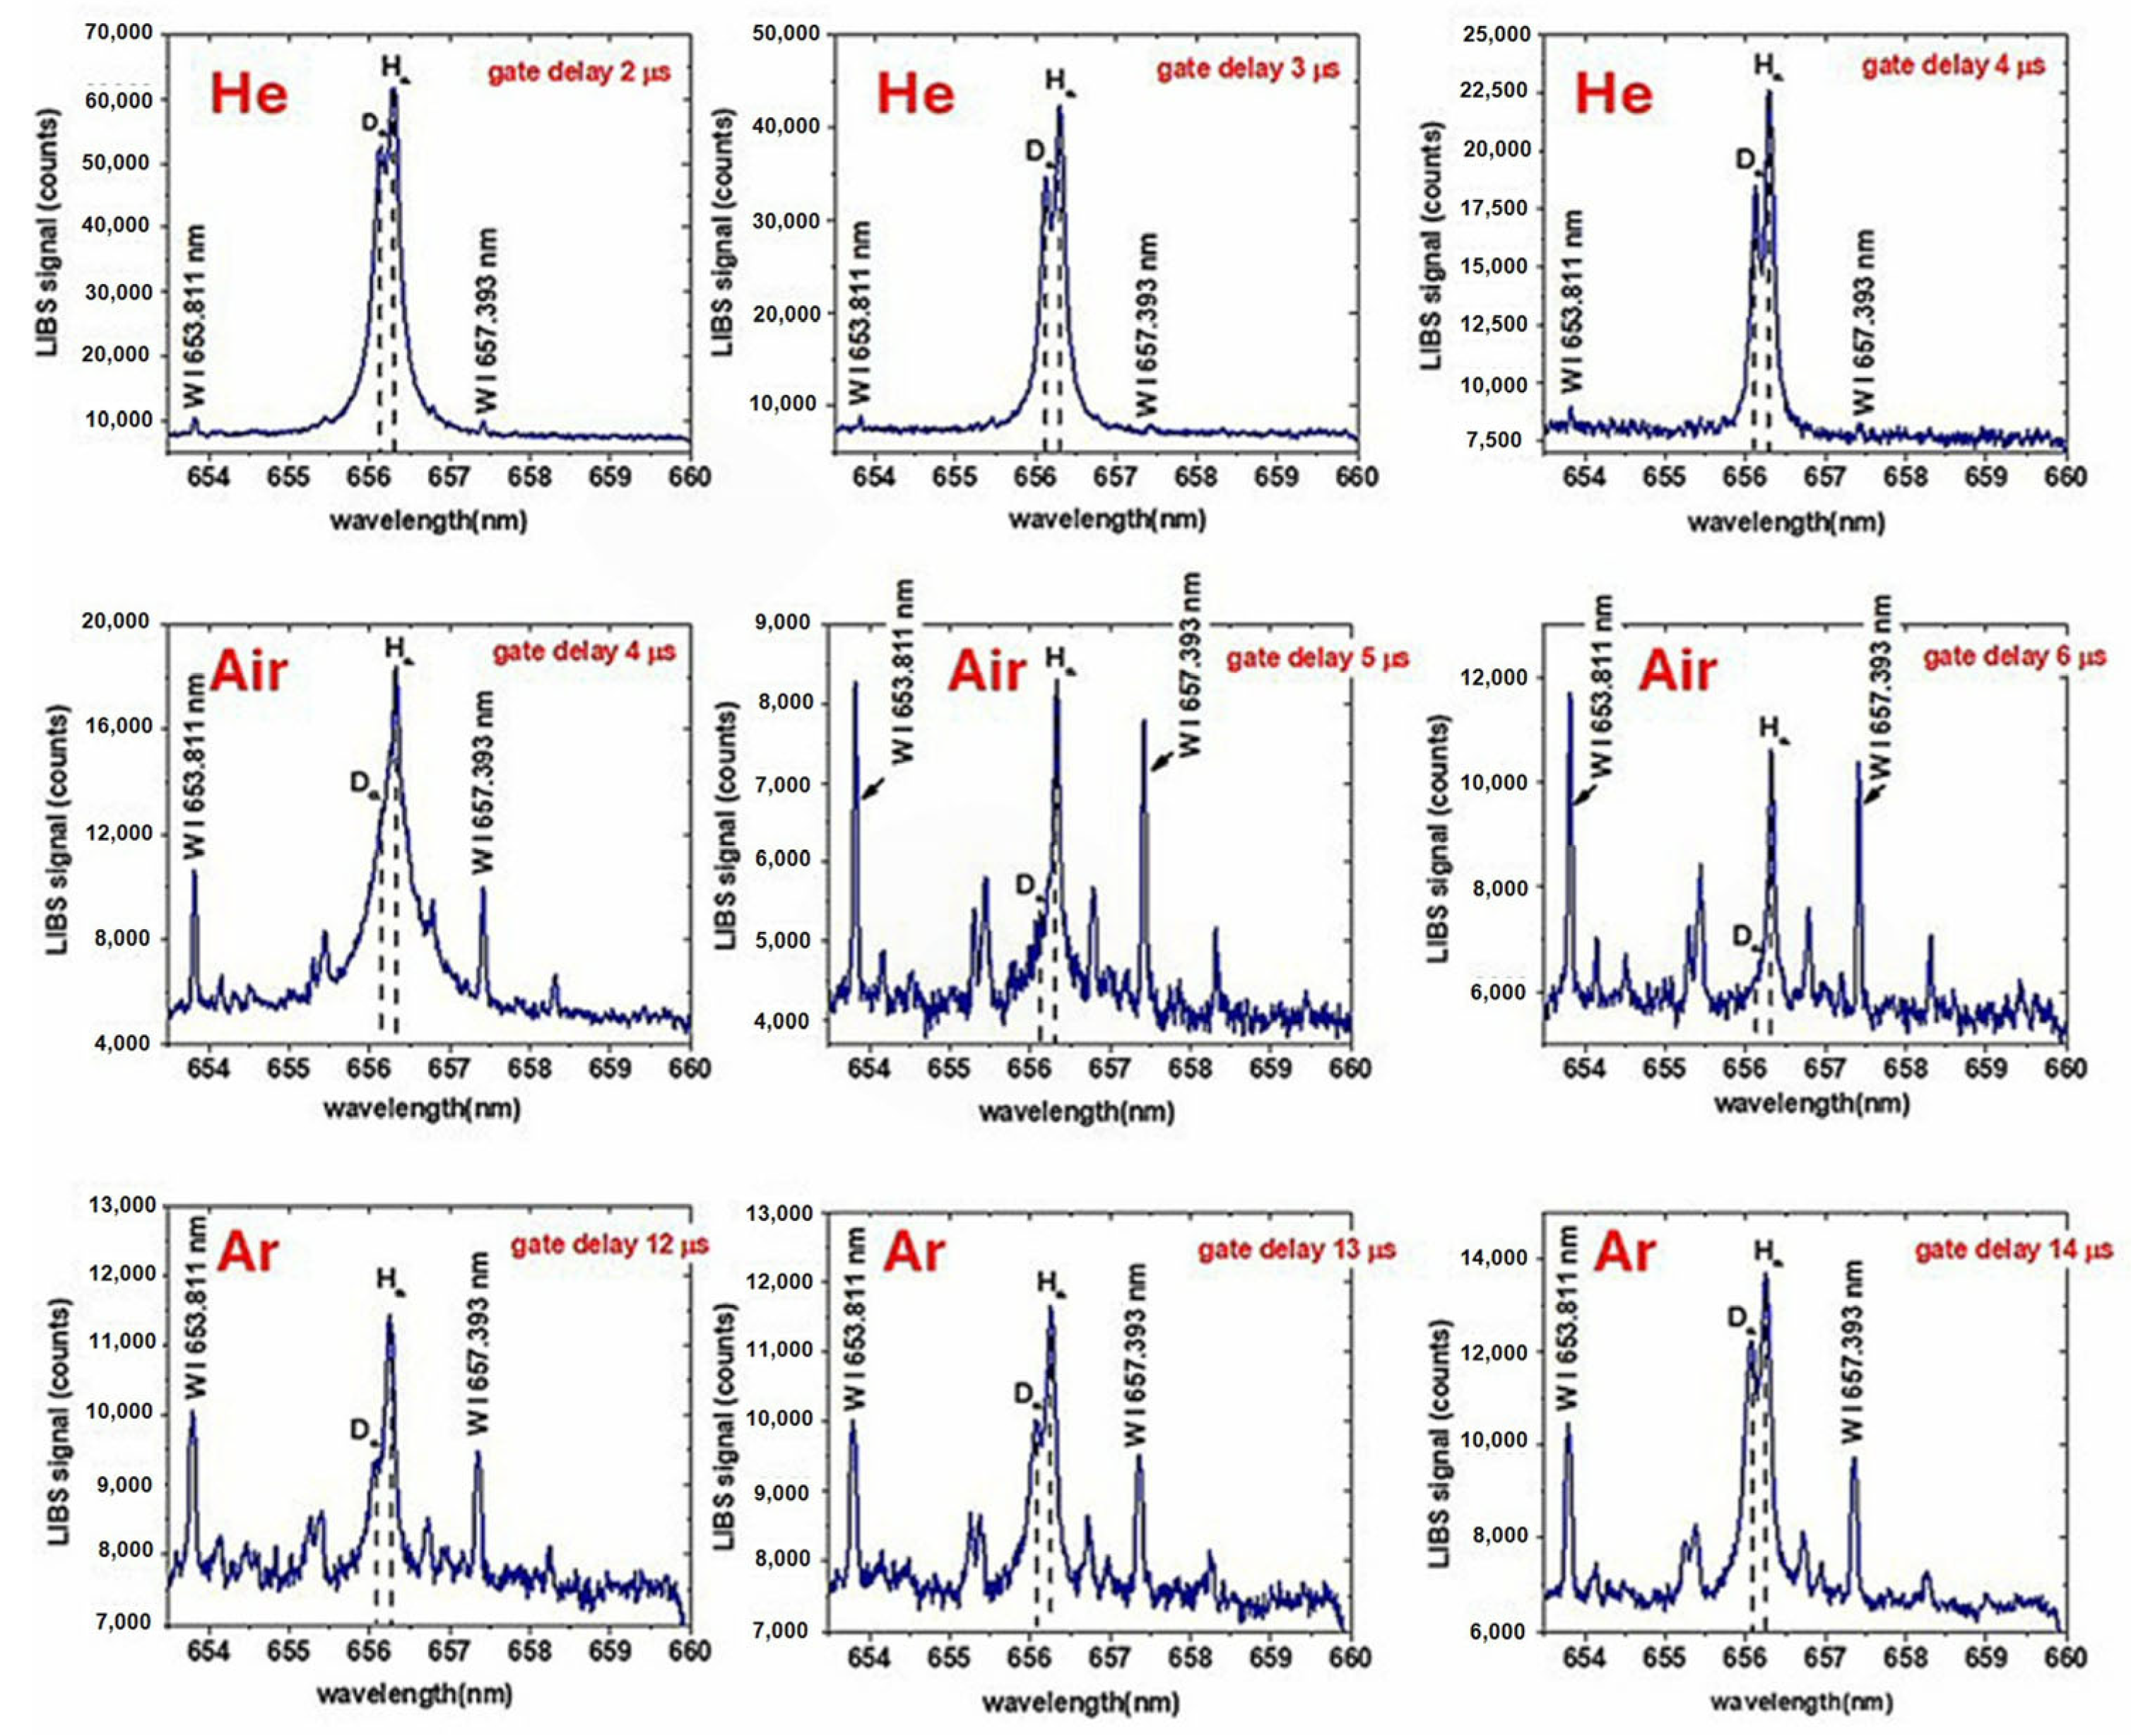
Figure 2 shows an example of the LIBS signal obtained by the Czerny–Turner spectrograph in the case of He (top), air (center), and Ar (bottom) as background gases for three different gate delays.
From Figure 2, it can be observed that using He or Ar as the background gas significantly enhances the spectral resolution of the two Dα and Hα peaks compared to the standard LIBS in air when the delay of the ICCD is appropriately set. In particular, the optimal delay values used for He were 2–4 µs; for air, they were 4–6 µs; and for Ar, they were 12–14 µs. This result is in line with those known from the literature [16,17], according to which the electron temperature (Te) and density (ne) of the LIBS plasmas are inversely proportional to the atomic masses of the background gases [17], and a faster decay of both is observed for He.
It is also observed that the spectral emissions of atomic tungsten at 653.811 nm, 655.28 nm, 655.38 nm, 656.78 nm, 656.97 nm, and 657.18 nm are clearly detectable in the case of Ar and air plasma, while they are poorly detectable in the case of He plasma. This result agrees with previous results in the literature [18,19], the reason being that Te and ne decay more rapidly in He compared to Ar and air because He has a higher thermal conductivity than Ar and air [18,19].
To quantitatively estimate the resolution power, Rs, of the two Dα and Hα peaks in the case of the two gases He and Ar, the ratio between the width of the two peaks and their spectral separation was taken into consideration according to the following formula, which is currently applied in chromatography to evaluate the resolution of two nearby peaks:
R S = 2 · Δ λ w D α + w H α
where Δλ is the spectral separation of the two peaks (0.18 nm), and w and w are the FWHMs of the two peaks, obtained by fitting them with two Gaussian functions.
The two peaks are resolved if Rs ≥ 1. In Table 1 are the values obtained for the six spectra in Figure 1, acquired under He and Ar gas. Starting from these values, we estimated the resolution that would be obtained if tritium were present with the same concentration as deuterium, since the tritium Tα line (centered at 656.045 nm) is expected to have the same linewidth as the Dα line but with a spectral separation of Δλ = 656.1 − 656.045 = 0.055 nm. The theoretical resolution of the Tα and Dα peaks is reported in the last column of Table 1.
In any of the previous cases, the Tα and Dα peaks could not be resolved with the current system, and the discrimination between the two spectral signals should be performed through fitting procedures.
In this respect, a simulation of the LIBS signal in the presence of T was performed by adding to the experimental signal an additional, hypothetical Tα peak with the same FWHM and intensity as the experimental Dα peak, centered at 656.045 nm, which is the central wavelength of the Tα emission. In Figure 3, the results of the simulation (red curve) for the two most favorable cases are reported: He with a gate delay of 5 μs and Ar with a gate delay of 14 μs.
From the simulated spectra, the presence of an additional contribution at shorter wavelengths is evident in both cases in Figure 3 from the shape and width of the semi-theoretical signal, although the two peaks cannot be clearly resolved, as detailed in Table 1, and a post-acquisition fitting procedure would be necessary to separate the two components.

3.2. Depth Profiling Analysis

The LIBS depth profiling analysis [20] consists of consecutively hitting the sample at the same point with multiple laser pulses and recording the emitted spectrum of each pulse to gather information about the elemental composition with respect to depth. Each laser pulse strips away a thin layer of sample, enabling the subsequent pulse to explore a slightly deeper portion.
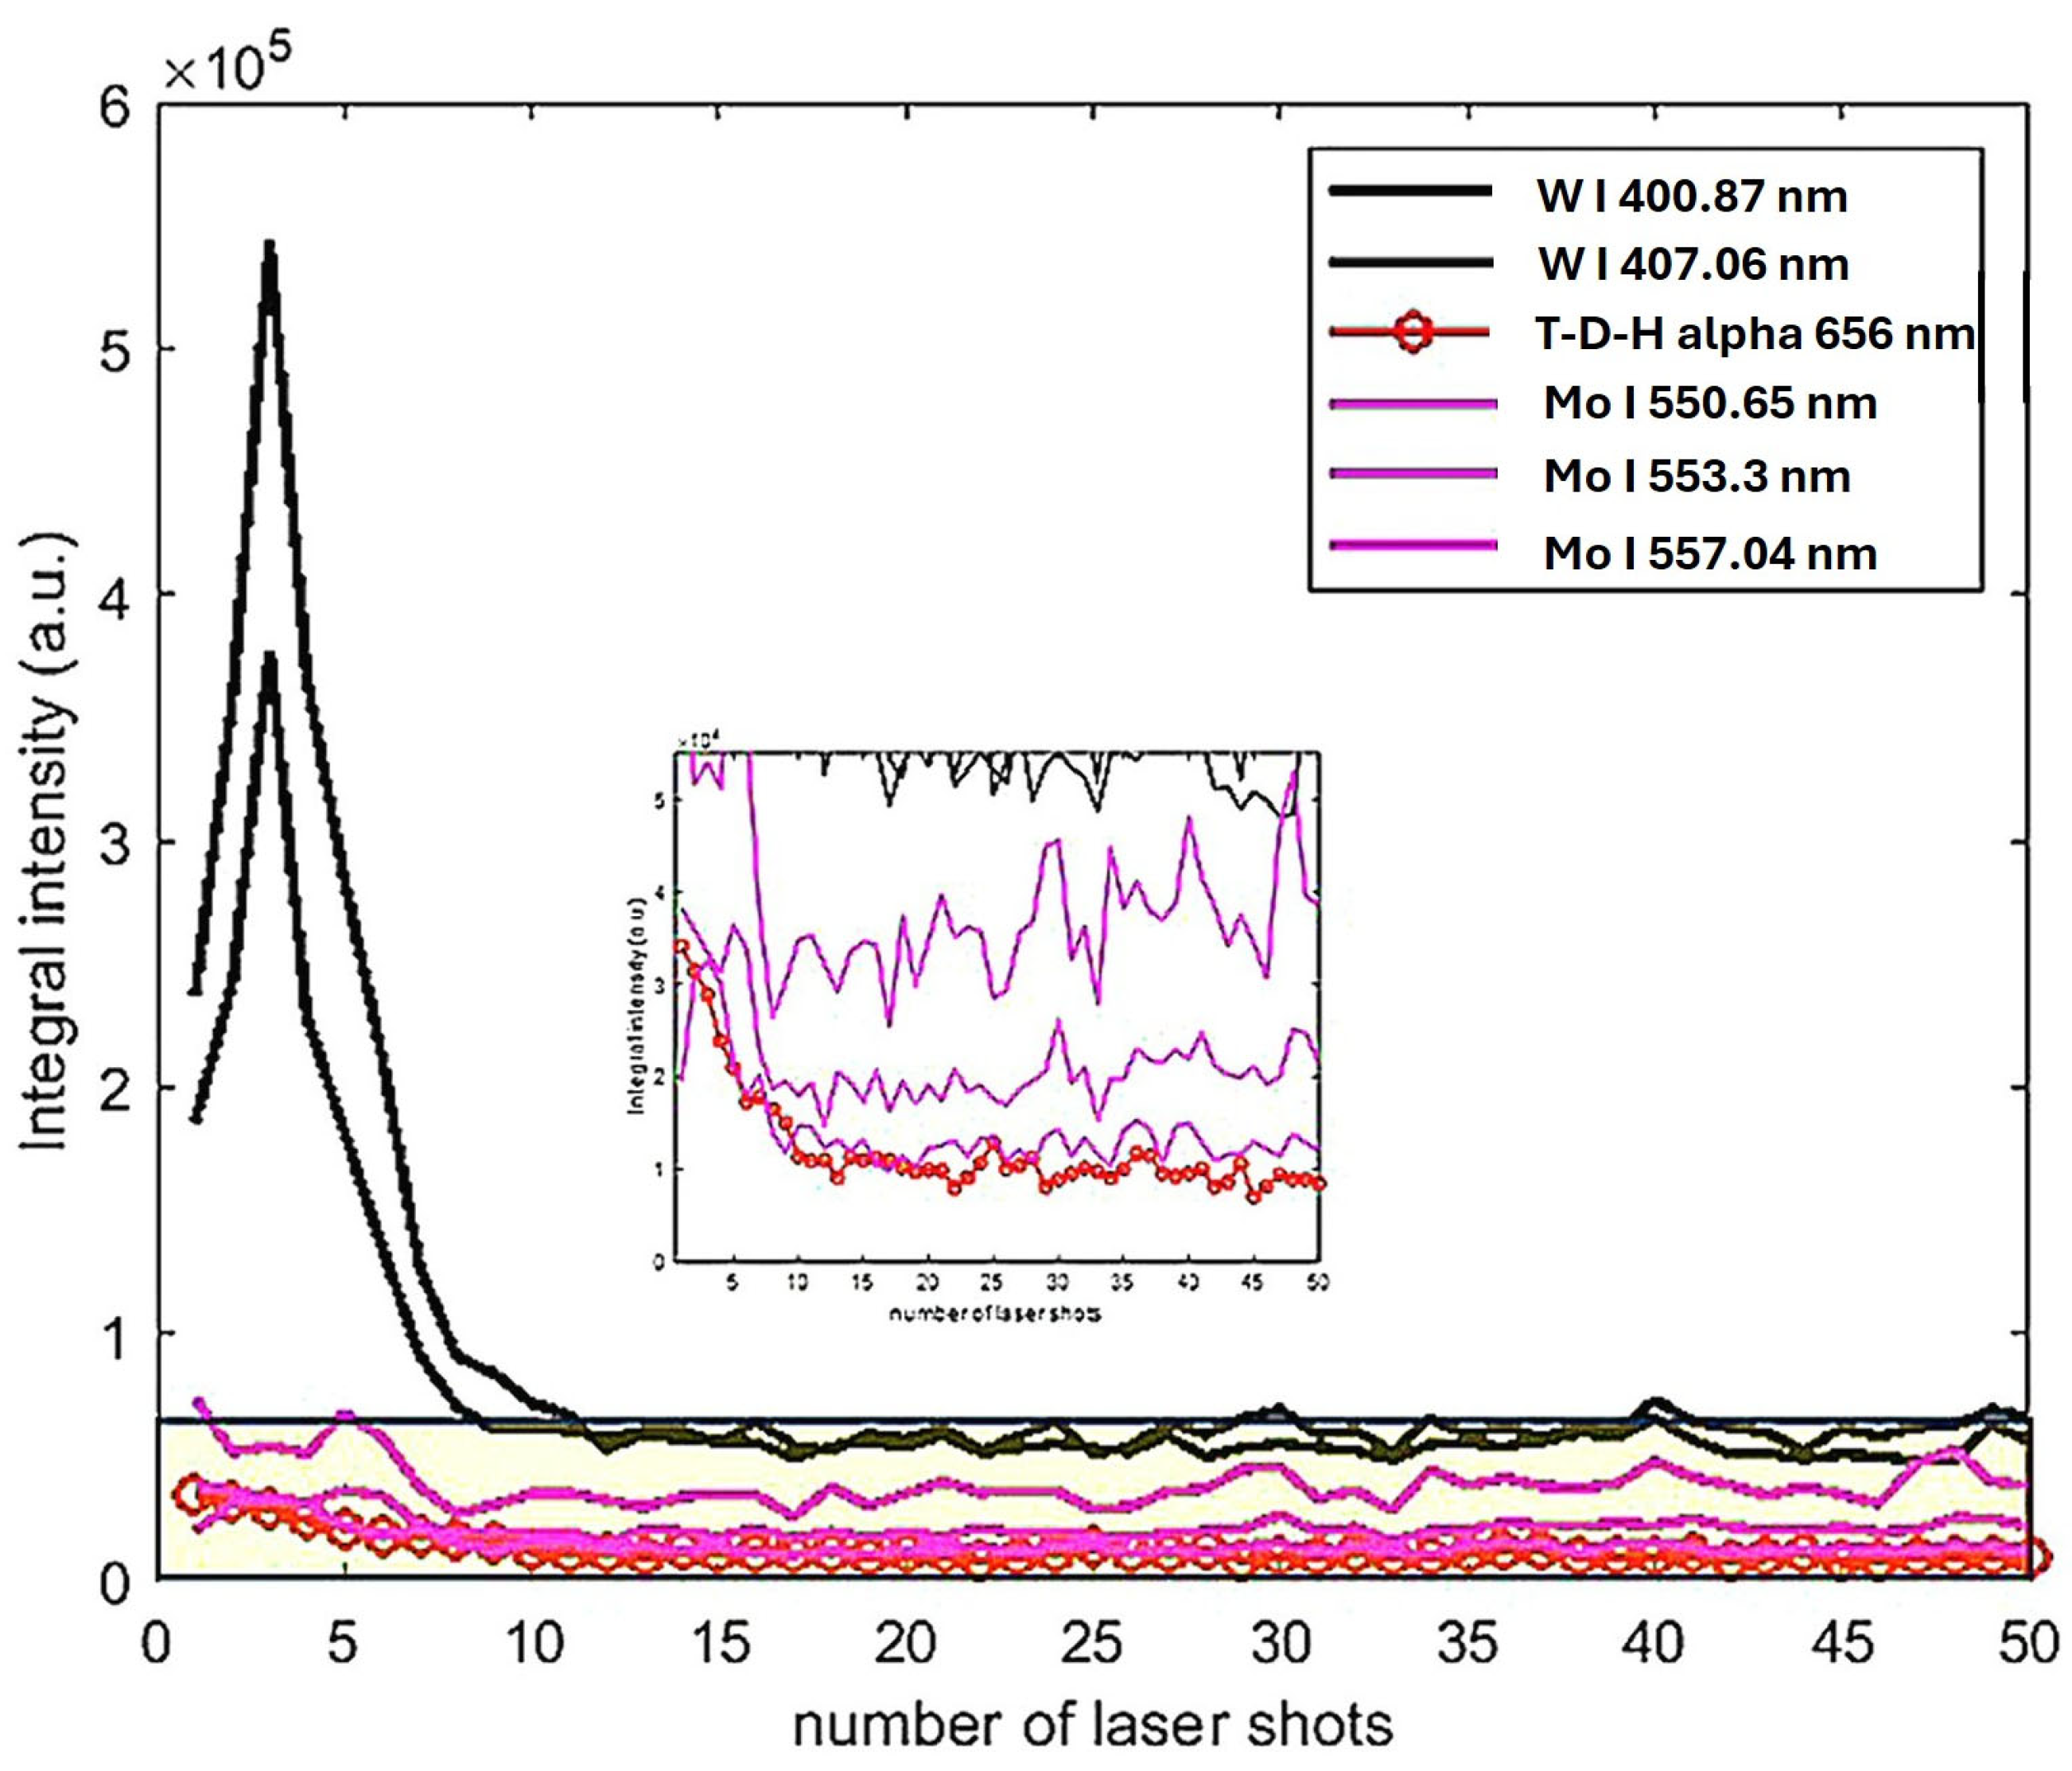
In the case of the present measures, the depth profiling analysis was applied to the W-D sample to estimate the average ablation rate of the superficial W layer, co-deposited with D. For this type of analysis, the spectra acquired with the Echelle “full-range” spectrometer were used. The integral intensity, which was strong and relatively free of interference from the emission lines of W and Mo (W I at 400.87 nm and 407.44 nm and Mo I at 550.65 nm, 553.3 nm, and 557.04 nm, respectively), was calculated over a spectral range of 0.35 nm, centered around the peak wavelength and the (T)-D-H band (hereafter called T-D-H alpha), in the spectral window 656.0–656.3 nm. The integral intensities were monitored and reported as a function of the applied laser shots, as shown in Figure 4. A clear trend for the two W I lines and the T-D-H alpha band was observed, showing a higher integral intensity in the first 10 shots, then dropping sharply in the subsequent shots, demonstrating that the co-deposited W-D layer is present only on the surface of the sample.
Assuming the nominal thickness of the superficial layer (5 μm), the average ablation rate of the W layer was estimated to be ≈500 nm/shot.
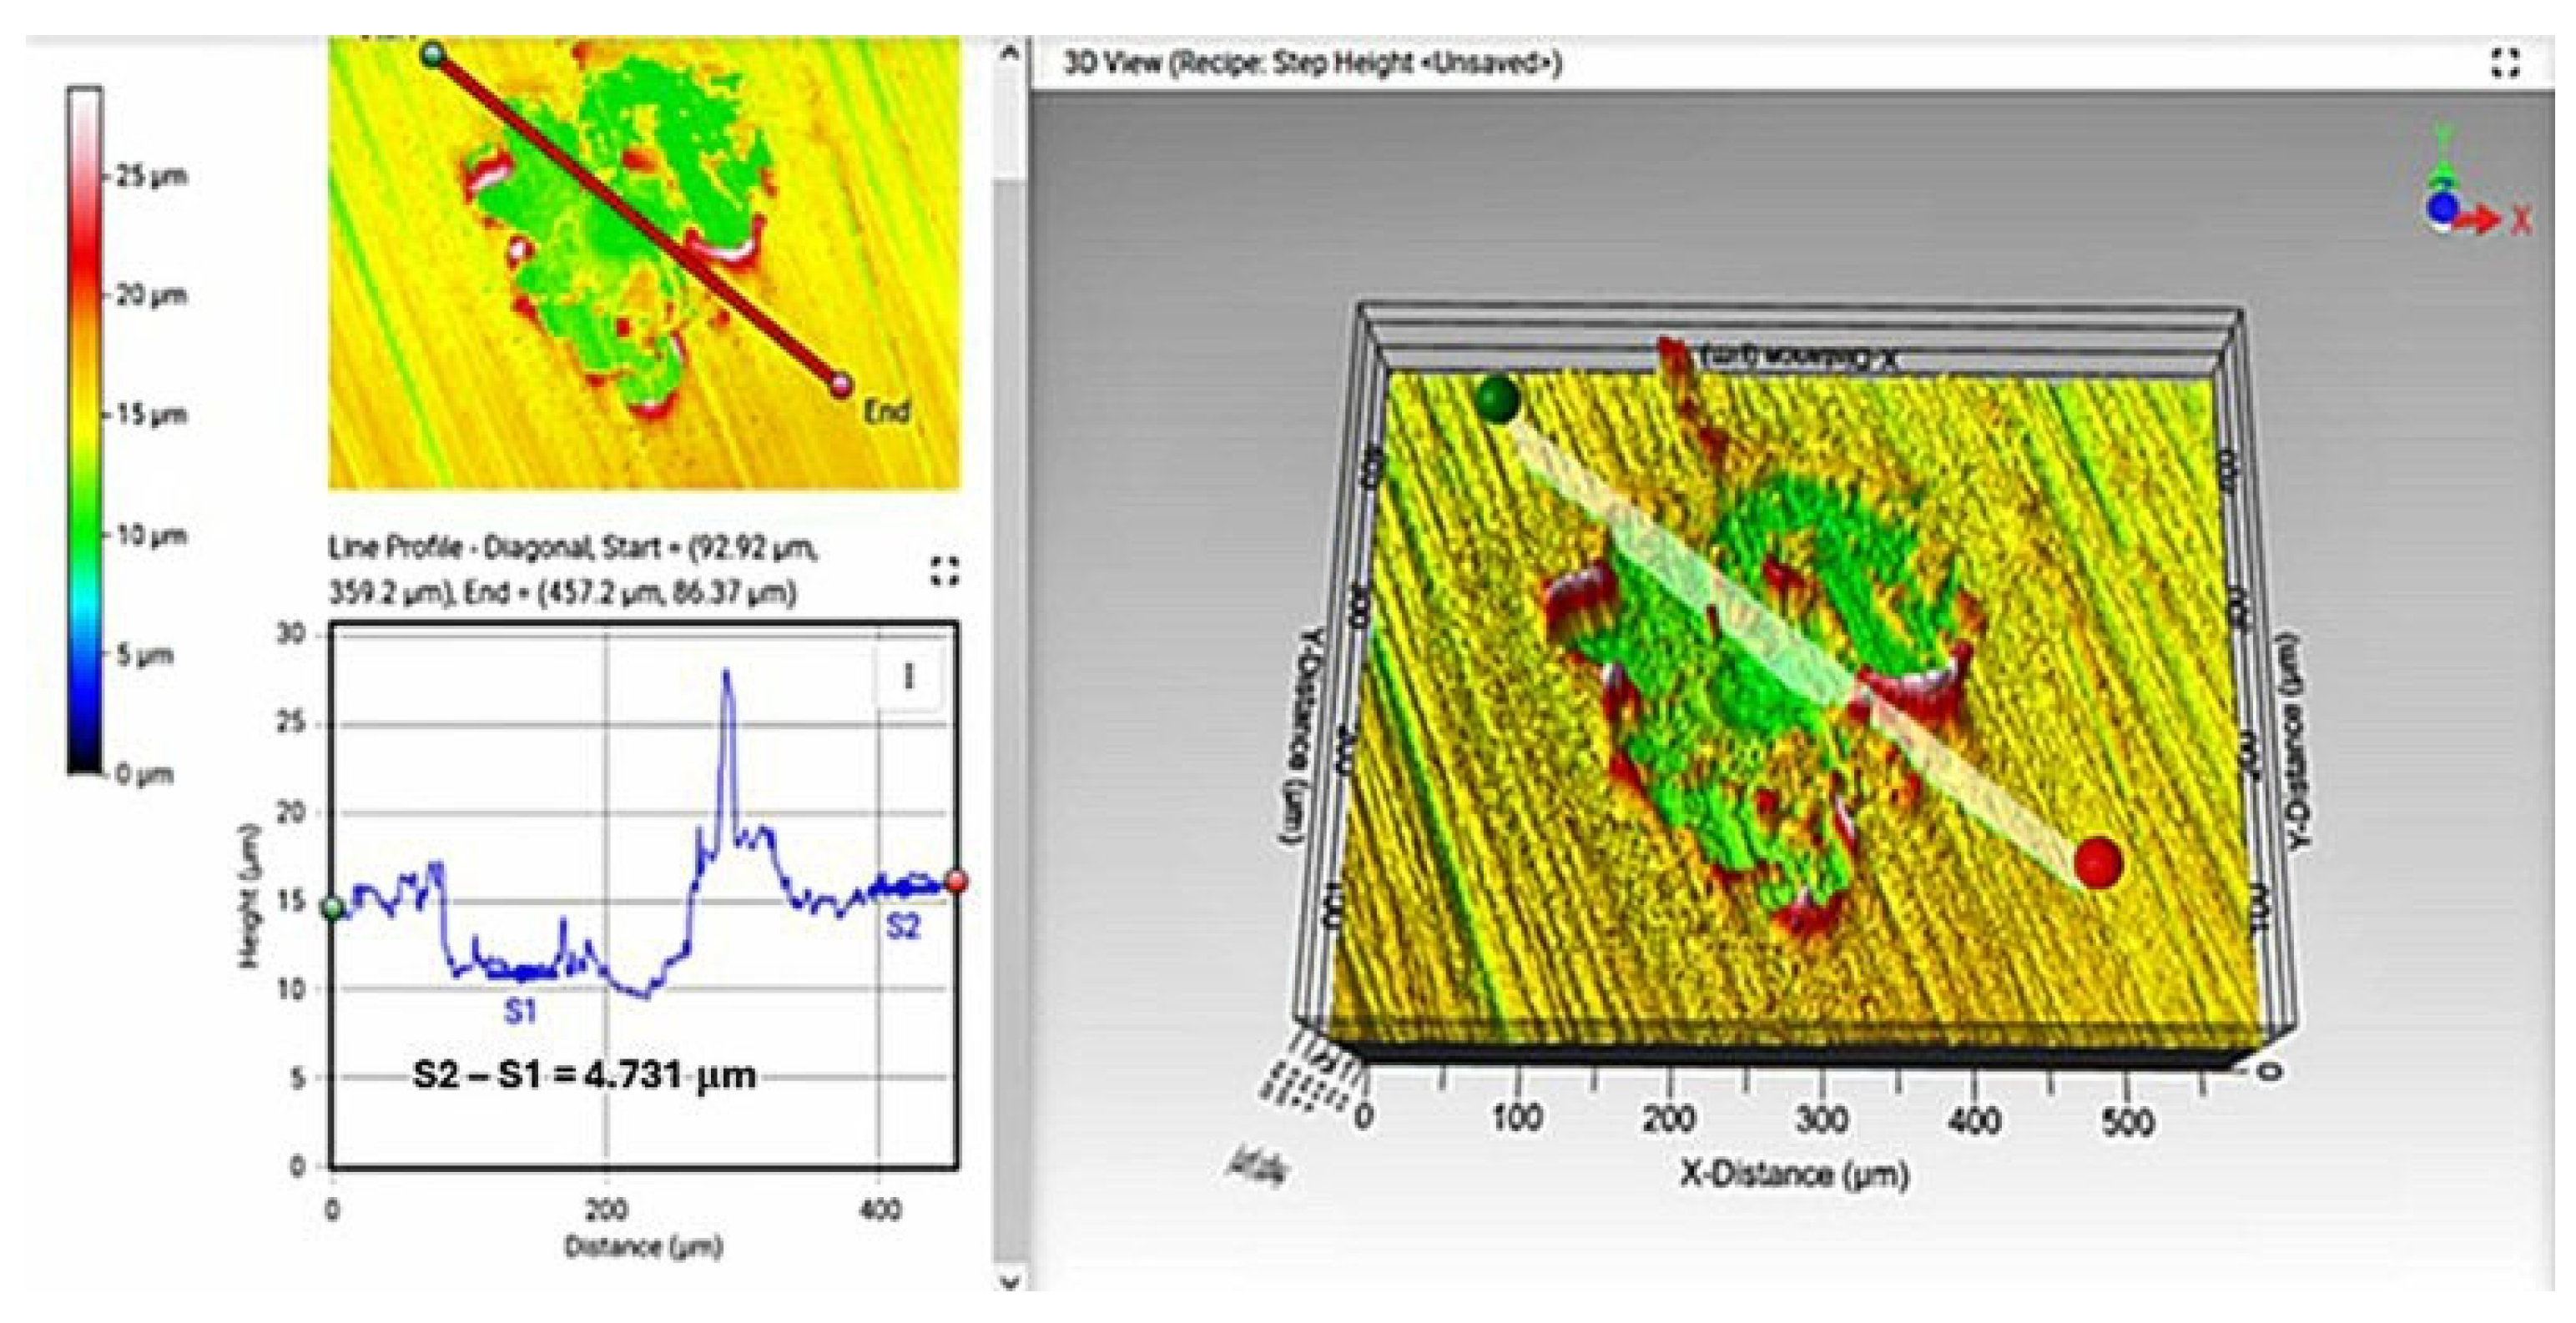
This result was also confirmed by the analysis through the non-contact optical profilometry of the laser crater obtained after applying 10 consecutive laser shots, as shown in Figure 5.
A z-scan, normal to the surface, was performed by the optical profilometer over an area of 550 × 550 μm2, a vertical range of 30 μm, and a step of 10 nm to obtain the 3D reconstruction of the crater of Figure 5. The average depth of the crater was measured to be ≈4.73 μm, in line with the result obtained by observing the trend of the emission intensity of the W and D + H lines.

3.3. Calibration-Free Analysis

The CF technique is a methodology used for a quantitative estimation of the chemical species present in an LIBS spectrum by using the experimental line intensities. CF was applied to the LIBS spectrum obtained in Ar as a background gas with a gate width of 3 μs and a gate delay of 14 μs. The reason for applying CF to this spectrum is that well-resolved Dα − Hα emission lines were detected, as well as W I emission lines at 653.811 nm and 657.393 nm; therefore, the quantitative estimation of D and H with respect to W is feasible.
In CF analysis [15,21,22], there is no need for referenced samples or calibration curves, but the laser-induced plasma is required to be optically thin [19,20] and in local thermodynamic equilibrium (LTE) [22]. In these conditions, the line integral intensities of the emission lines are related to the concentration of the species through the following expression:
I k i = C s A k i g k e ( E k / k B T ) U s ( T )
where CS is the species (atomic or ionic) concentration, Aki is the transition probability for the specific emission line, gk is the k-level degeneracy, kB is the Boltzmann constant, T is the plasma temperature, and US(T) the partition function of the species. To be applied, the CF analysis requires knowledge of Te and ne, which can be obtained from the experimental spectra through the Boltzmann plot [23,24,25] of the emission lines present in the spectra (T) and from the Stark broadening [26,27] of well resolved lines for which the Stark parameter is known [28] (ne). The criterion for determining whether the LIBS plasma is optically thin is obtained from the intensity ratio of two lines of a particular element in the same charge state (ionic or atomic), which, according to Equation (2), is [29]
I k i 1 I k i 2 = A k i 1 g k 1 A k i 2 g k 2 e ( E k 1 E k 2 ) k B T
where the constants are the same as those described in Equation (2) for the two emission lines (labeled 1 and 2).
If the two emission lines either have the same or as close as possible upper levels, the contribution of the exponential factor in Equation (3) is minimized and can be neglected. Therefore, the theoretical value of the intensity ratio of the two lines depends only on the spectroscopic parameters of the transitions and on the experimental intensity of the lines.
The optical thinness of the LIBS plasma was checked by applying Equation (3) to the intensity ratio of the two W I emission lines at 653.811 nm and 657.393 nm, whose spectroscopic parameters were retrieved from the NIST database [30]. These parameters, together with the theoretical and the experimental intensity ratios, are reported in Table 2:
From this table, it can be observed that the theoretical and experimental intensity ratios of the two lines are comparable, and the plasma can be considered optically thin.
To evaluate the LTE of the LIBS plasma, it is necessary to apply the so-called McWhirther criterion [31], which is a necessary but insufficient condition that can be expressed as follows:
n e c m 3 > 1.6 · 10 12 T 1 / 2 ( Δ E k i ) 3
where T (eV) is the plasma temperature and ΔEki (eV) is the maximum energy difference between the upper and lower energy levels. In the case of the sample under analysis made of W and H(D), we have ΔEki (eV) = 2.49 eV for W I, ΔEki (eV) = 4.71 eV for W II, and ΔEki (eV) = 10.2 eV for H(D). The plasma temperature T was retrieved from the extended Boltzmann plot [12,16,22] of the sequence of the 50 LIBS spectra applied to the same point and was found to be 8900 ± 400 K, whereas the electron density was evaluated through the evaluation of the Stark broadening of the three W I lines at 426.9 nm, 429.4 nm, and 430.2 nm [32] and was found to be 4.08 ± 2 × 10¹⁶ (cm−3). Checking the McWhirther criterion for W and H, the condition is fulfilled.
In addition to the above criteria, the condition for the validity of LTE was also verified by calculating the diffusion length, δ (cm), through the following relation [22]:
δ 1.4 × 10 12 k T 3 4 n e   Δ E M A g ¯ 1 2 e Δ E k T
and the atomic emission spectral line of W I at 251.814 nm was used to calculate δ, giving δ ≈ 0.05 mm. The characteristic variation length in the plasma, “d”, which can be taken as the plasma diameter (≈2–3 mm), is much larger than 10δ (i.e., 10δ < d), which ensures the second condition of LTE.
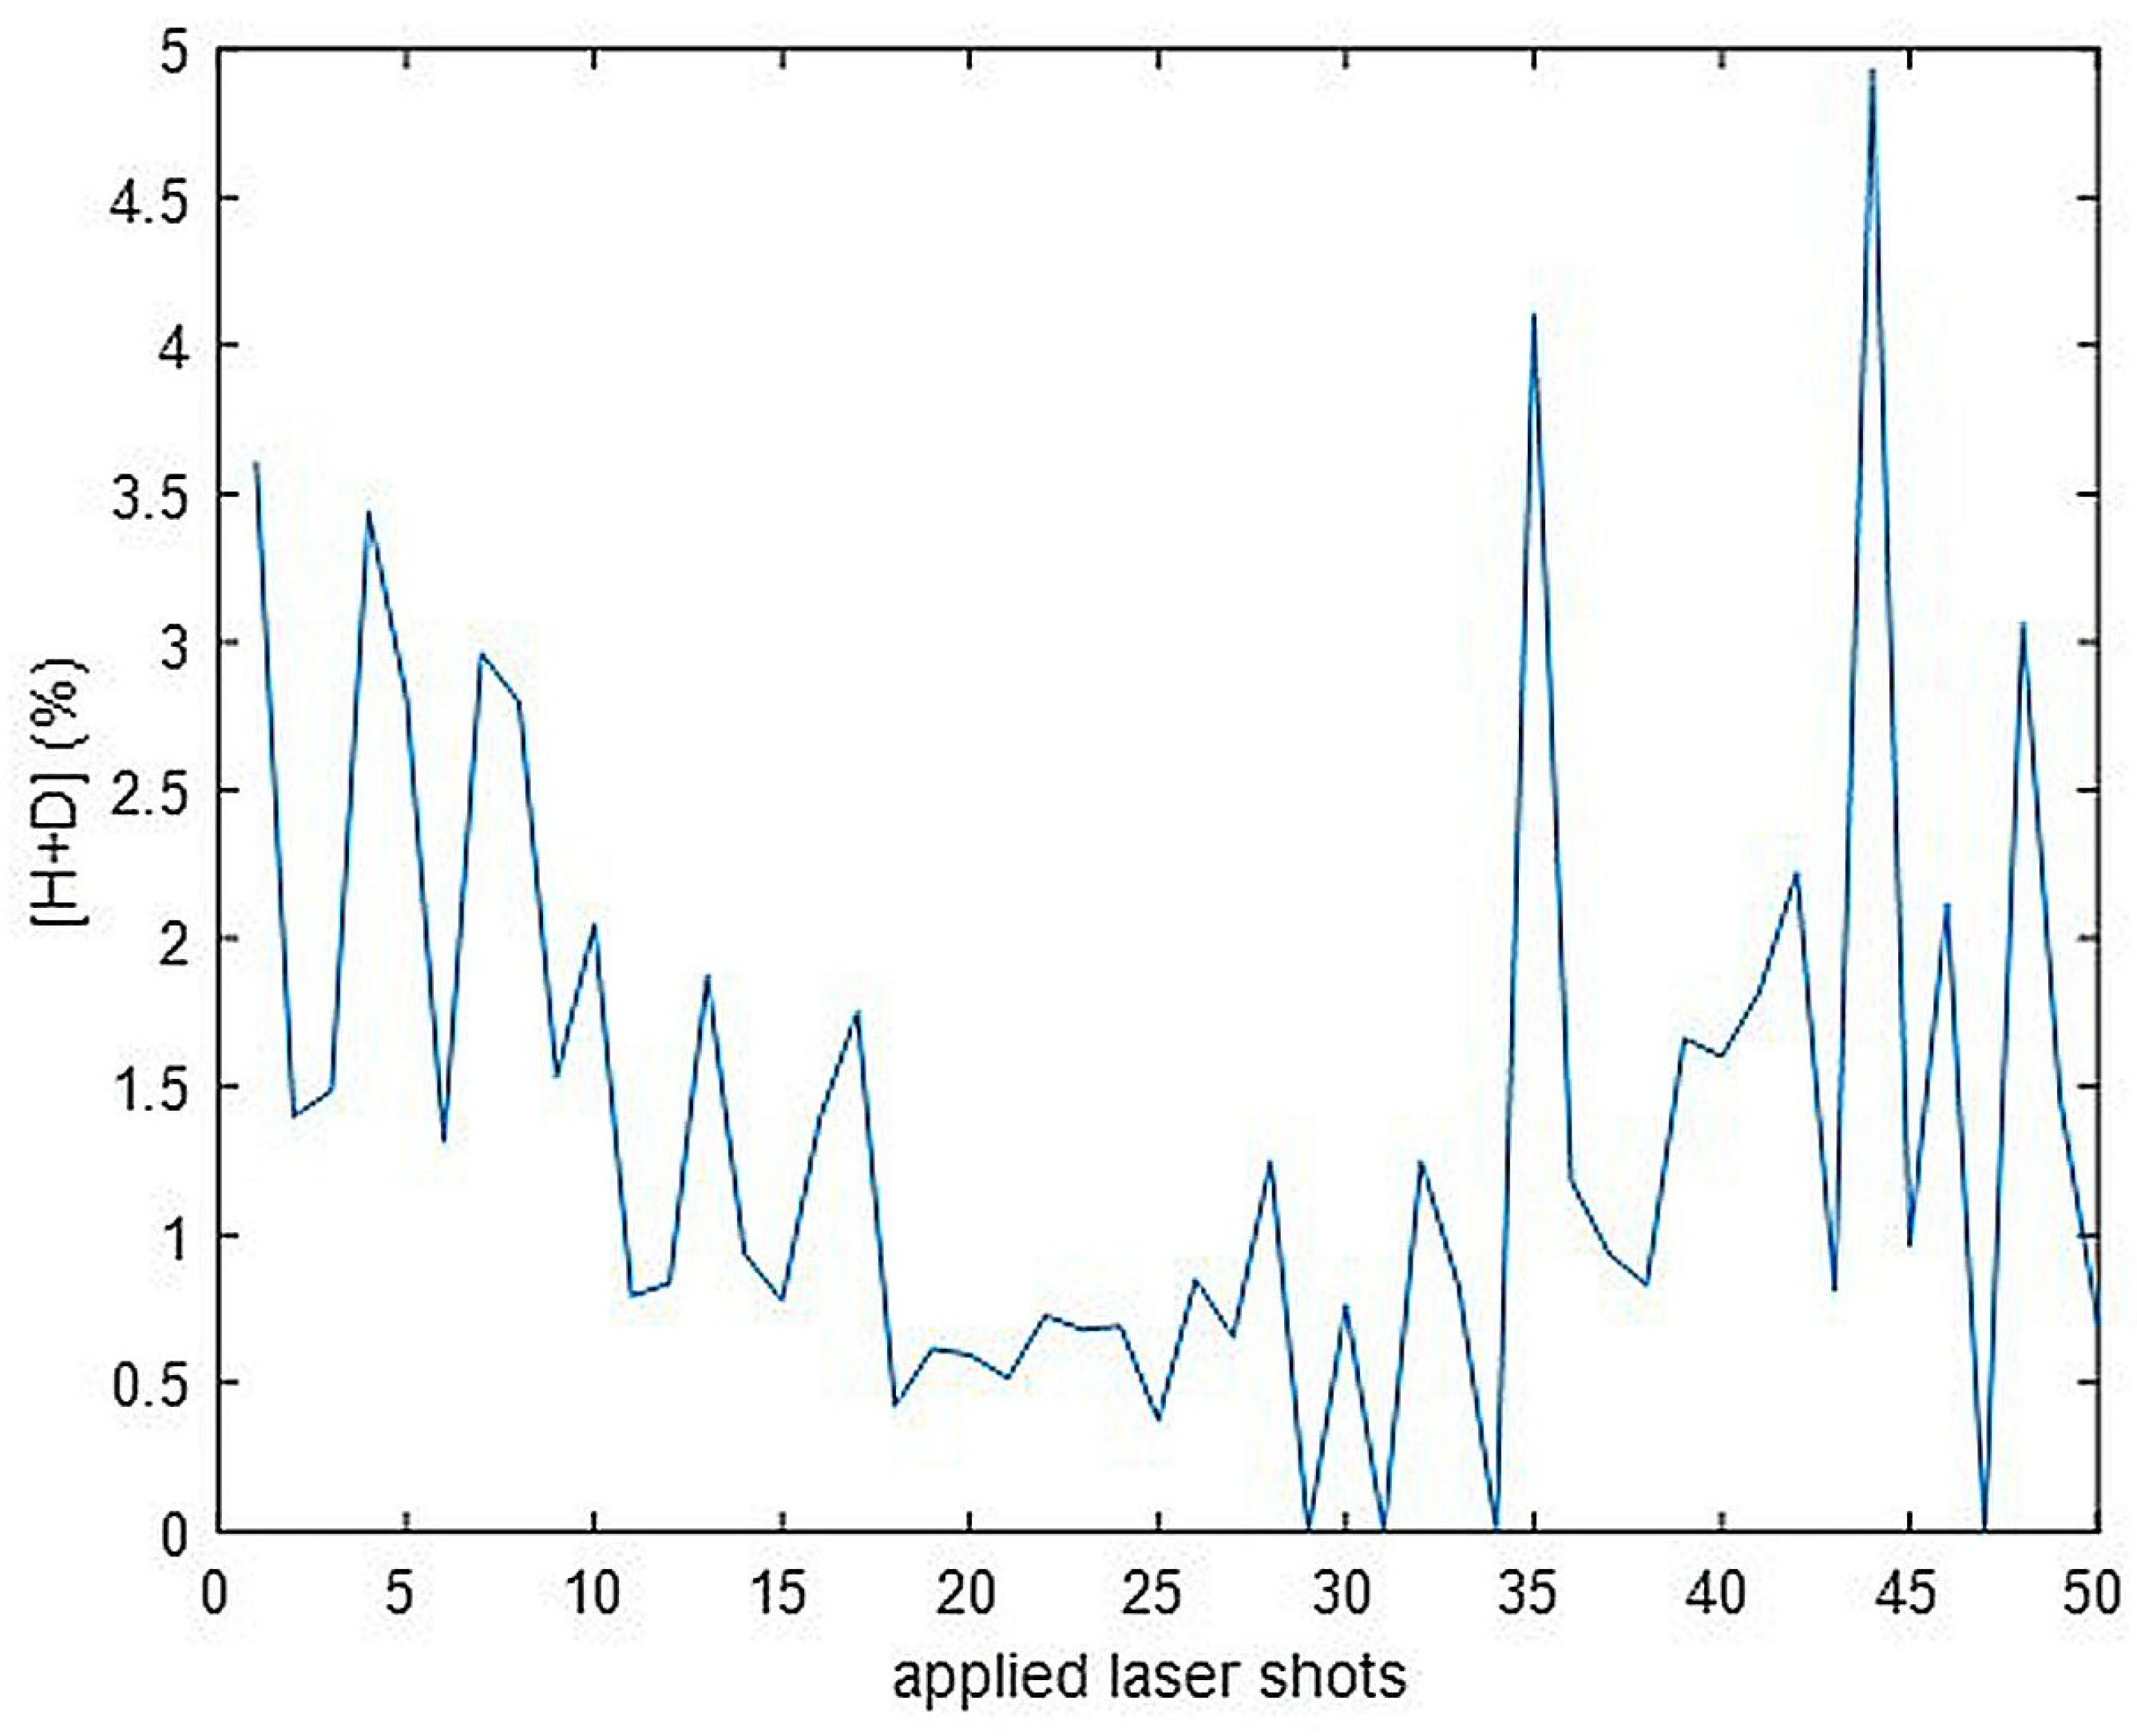
With both conditions satisfied (plasma optically thin and in LTE), the CF can be applied to estimate the relative concentration of H + D ([H + D]) with respect to W for all 50 spectra of the depth profiling analysis. The obtained values for [H + D] span from 0.5 ± 0.5% to 3.5 ± 0.5%, due to uncertainties in the values of T and ne, and are reported in Figure 6 as a function of the applied laser shots.
Looking at the trend of [H + D] values, it is observed that the surface layer appears enriched in hydrogen isotopes, decreasing until the 10th–15th shot, which is consistent with the qualitative results shown in Figure 4, where the H + D signal is above the level of noise within the first 15 shots. It is also observed that, after the 35th shot, the [H + D] values become noisier, with large variations. This is probably due to the complete ablation of the residual W layer at the edges of the crater (lateral ablation) and the consequent decrease in the W signal in the LIBS spectra, whereas the H + D signal remains constant in comparison to a background level because of the constant fraction of environmental hydrogen ionized nearby the plasma plume.

4. Conclusions

In this work, we presented the results of the application of the LIBS technique to a deuterated tungsten sample, simulating the surface of a PFC of a real tokamak after an experimental campaign with fusion fuel. The measurements were performed in He and Ar flows and in air to compare the possibility of resolving the spectral lines of hydrogen isotopes, which is of great interest for the application of the technique in the fusion field. The use of He and Ar as background gases allows for the separation of the Hα and Dα emission lines of hydrogen and deuterium with higher resolution than traditional LIBS in air, as soon as the acquisition parameters have been optimized. The simulation of the presence of tritium in the spectrum, with its Tα spectral emission, having an intensity comparable to the Dα emission of deuterium, allows us to conclude that the simultaneous presence of the two isotopes requires a system with a higher resolution for them to be clearly detected, and a post-measurement fitting procedure may be necessary to resolve the two lines. The depth profiling measurements highlighted an average ablation rate of about 500 nm per laser shot. Measurements in an Ar atmosphere also allowed us to observe the emission lines of W, which represents a material considered for PFCs in next-generation fusion devices, with a better signal-to-noise ratio compared to that in He atmosphere and comparable spectral resolution. Furthermore, measurements in Ar do not introduce an interfering signal if the analysis aims to reveal the He embedded into PFCs because of fusion reactions. Finally, the application of the CF technique allowed for a semi-quantitative estimation of the hydrogen isotopes co-deposited on the surface layer of the sample.

Author Contributions

Conceptualization, S.A.; methodology, S.A., M.P. and L.B.; validation, L.B.; investigation, S.A. and L.B.; data curation, S.A.; writing—original draft preparation, S.A.; writing—review and editing, S.A. and L.B. All authors have read and agreed to the published version of the manuscript.

Funding

This work was carried out within the framework of the EURO-fusion Consortium, funded by the European Union via the Euratom Research and Training Programme (Grant Agreement No 101052200—EUROfusion). The views and opinions expressed are, however, those of the author(s) only and do not necessarily reflect those of the European Union or the European Commission. Neither the European Union nor the European Commission can be held responsible for them.

Data Availability Statement

Data are available upon request.

Acknowledgments

The authors wish to acknowledge Eduard Grigore for the sample production Violeta Lazic and Francesco Colao for the design and settings of the LIBS system.

Conflicts of Interest

The authors declare no conflicts of interest.

References

  1. Roth, J.; Tsitrone, E.; Loarer, T.; Philipps, V.; Brezinsek, S.; Loarte, A.; Counsell, G.F.; Doerner, R.P.; Schmid, K.; Ogorodnikova, O.V.; et al. Tritium inventory in ITER plasma-facing materials and tritium removal procedures. Plasma Phys. Control Fusion 2008, 50, 103001. [Google Scholar] [CrossRef]
  2. Pitts, R.A.; Loarte, A.; Wauters, T.; Dubrov, M.; Gribov, Y.; Köchl, F.; Pshenov, A.; Zhang, Y.; Artola, J.; Bonnin, X.; et al. Plasma-wall interaction impact of the ITER re-baseline. Nucl. Mater. Energy 2025, 42, 101854. [Google Scholar] [CrossRef]
  3. Schmid, K.; Wauters, T. Full W ITER: Assessment of expected W erosion and implications of boronization on fuel retention. Nucl. Mater. Energy 2024, 41, 101789. [Google Scholar] [CrossRef]
  4. Widdowson, A.; Coad, J.P.; Zayachuk, Y.; Jepu, I.; Alves, E.; Catarino, N.; Corregidor, V.; Mayer, M.; Krat, S.; Likonen, J.; et al. Evaluation of tritium retention in plasma facing components during JET tritium operations. Phys. Scr. 2021, 96, 124075. [Google Scholar] [CrossRef]
  5. Radziemski, L.J.; Cremers, D.A. Handbook of Laser-Induced Breakdown Spectroscopy; John Wiley: New York, NY, USA, 2006; ISBN 0-470-09299-8. [Google Scholar]
  6. van der Meiden, H.J.; Almaviva, S.; Butikova, J.; Dwivedi, V.; Gasior, P.; Gromelski, W.; Hakola, A.; Jiang, X.; Jõgi, I.; Karhunen, J.; et al. Monitoring of tritium and impurities in the first wall of fusion devices using a LIBS based diagnostic. Nucl. Fusion 2021, 61, 125001. [Google Scholar] [CrossRef]
  7. Almaviva, S.; Caneve, L.; Colao, F.; Lazic, V.; Maddaluno, G.; Mosetti, P.; Palucci, A.; Reale, A.; Gasior, P.; Gromelski, W.; et al. LIBS measurements inside the FTU vacuum vessel by using a robotic arm. Fusion Eng. Des. 2021, 169, 112638. [Google Scholar] [CrossRef]
  8. Hu, Z.; Bai, X.; Wu, H.; Hai, R.; Ding, F.; Imran, M.; Li, C.; Ding, H.; Luo, G.-N. Quantitative analysis of impurities deposited on the Plasma-Facing Components of EAST tokamak using a portable LIBS device. Nucl. Mater. Energy 2024, 41, 101785. [Google Scholar] [CrossRef]
  9. Maddaluno, G.; Almaviva, S.; Caneve, L.; Colao, F.; Lazic, V.; Laguardia, L.; Gasior, P.; Kubkowska, M. Detection by LIBS of the deuterium retained in the FTU toroidal limiter. Nucl. Mater. Energy 2019, 18, 208–211. [Google Scholar] [CrossRef]
  10. Jõgi, I.; Paris, P.; Ristkok, J.; Roldán, A.M.; Bhat, P.G.; Veis, P.; Karhunen, J.; Almaviva, S.; Gromelski, W.; Dinca, P.; et al. Laser-induced breakdown spectroscopy for helium detection in beryllium coatings. Nucl. Mater. Energy 2024, 39, 101677. [Google Scholar] [CrossRef]
  11. Liu, S.; Li, C.; Wu, H.; Li, L.; Liu, J.; Wu, D.; Hai, R.; Ding, H. Experimental and model study of LIBS depth profile for multilayer deposition materials. Spectrochim. Acta B 2023, 209, 106783. [Google Scholar] [CrossRef]
  12. Ciucci, A.; Corsi, M.; Palleschi, V.; Rastelli, S.; Salvetti, A.; Tognoni, E. New Procedure for Quantitative Elemental Analysis by Laser-Induced Plasma Spectroscopy. Appl. Spectrosc. 1999, 53, 960–964. [Google Scholar] [CrossRef]
  13. Matějíček, J.; Dejarnac, R.; Ruset, C.; Grigore, E.; Cvrček, L.; Walter, J.; Perry, F. Development of tungsten coatings on Inconel superalloy for COMPASS upgrade plasma-facing components. Nucl. Mater. Energy 2025, 42, 101844. [Google Scholar] [CrossRef]
  14. Kim, Y.C.; Jang, S.H.; Oh, S.J.; Lee, H.C.; Chung, C.W. Two-dimensional-spatial distribution measurement of electron temperature and plasma density in low temperature plasmas. Rev. Sci. Instrum. 2013, 84, 053505. [Google Scholar] [CrossRef] [PubMed]
  15. Corsi, M.; Cristoforetti, G.; Giuffrida, M.; Hidalgo, M.; Legnaioli, S.; Palleschi, V.; Salvetti, A.; Tognoni, E.; Vallebona, C. Three-dimensional analysis of laser induced plasmas in single and double pulse configuration. Spectrochim. Acta B 2004, 59, 723–735. [Google Scholar] [CrossRef]
  16. Aguilera, J.A.; Aragon, C. A comparison of the temperatures and electron densities of laser-produced plasmas obtained in air, argon, and helium at atmospheric pressure. Appl. Phys. A 1999, 69, S475–S478. [Google Scholar] [CrossRef]
  17. Nazar, F.; Shazia, B.; Khaliq, M. Effect of ambient gas conditions on laser-induced copper plasma and surface morphology. Phys. Scr. 2012, 85, 015702. [Google Scholar] [CrossRef]
  18. Vors, E.; Gallou, C.; Salmon, L. Laser-induced breakdown spectroscopy of carbon in helium and nitrogen at high pressure. Spectrochim. Acta B 2008, 63, 1198–1204. [Google Scholar] [CrossRef]
  19. Lee, Y.-I.; Song, K.; Cha, H.-K.; Lee, J.-M.; Park, M.-C.; Lee, G.-H.; Sneddon, J. Influence of atmosphere and irradiation wavelength on copper plasma emission induced by excimer and Q-switched Nd:YAG laser ablation. Appl. Spectrosc. 1997, 51, 959–964. [Google Scholar] [CrossRef]
  20. Królicka, A.; Maj, A.; Łój, G. Application of Laser-Induced Breakdown Spectroscopy for Depth Profiling of Multilayer and Graded Materials. Materials 2023, 16, 6641. [Google Scholar] [CrossRef]
  21. Abbass, Q.; Ahmed, N.; Ahmed, R.; Baig, M.A. A Comparative Study of Calibration Free Methods for the Elemental Analysis by Laser Induced Breakdown Spectroscopy. Plasma Chem. Plasma Process. 2016, 36, 1287–1299. [Google Scholar] [CrossRef]
  22. Cristoforetti, G.; De Giacomo, A.; Dell, M.; Legnaioli, S.; Tognoni, E.; Palleschi, V.; Omenetto, N. Local Thermodynamic Equilibrium in Laser-Induced Breakdown Spectroscopy: Beyond the McWhirter criterion. Spectrochim. Acta B 2010, 65, 86–95. [Google Scholar] [CrossRef]
  23. Völker, T.; Gornushkin, I.B. Extension of the Boltzmann plot method for multiplet emission lines. J. Quant. Spectrosc. Radiat. Transf. 2023, 310, 108742. [Google Scholar] [CrossRef]
  24. Zhang, N.; Ou, T.; Wang, M.; Lin, Z.; Lv, C.; Qin, Y.; Li, J.; Yang, H.; Zhao, N.; Zhang, Q. A Brief Review of Calibration-Free Laser-Induced Breakdown Spectroscopy. Front. Phys. 2022, 10, 887171. [Google Scholar] [CrossRef]
  25. Aguilera, J.A.; Aragon, C. Multi-element Saha–Boltzmann and Boltzmann plots in laser-induced plasmas. Spectrochim. Acta B 2007, 62, 378–385. [Google Scholar] [CrossRef]
  26. Thouin, J.; Benmouffok, M.; Freton, P.; Gonzalez, J.J. Interpretation of Stark broadening measurements on a spatially integrated plasma spectral line. Eur. Phys. J. Appl. Phys. 2022, 97, 87. [Google Scholar] [CrossRef]
  27. Dimitrijević, M.S. Forty Years of the Applications of Stark Broadening Data Determined with the Modified Semiempirical Method. Data 2020, 5, 73. [Google Scholar] [CrossRef]
  28. Burger, M.; Hermann, J. Stark broadening measurements in plasmas produced by laser ablation of hydrogen containing compounds. Spectrochim. Acta B 2016, 122, 118–126. [Google Scholar] [CrossRef]
  29. Urbina Medina, I.A.; Carneiro, D.D.; Rocha, S.; Farias, E.E.; Bredice, F.O.; Palleschi, V. Branching Ratio Method for Assessing Optically Thin Conditions in Laser-Induced Plasmas. Appl. Spectrosc. 2021, 75, 774–780. [Google Scholar] [CrossRef]
  30. NIST Atomic Spectra Database (ver. 5.12). Available online: https://physics.nist.gov/asd (accessed on 22 April 2025).
  31. Fujimoto, T.; McWhirter, R.W.P. Validity criteria for local thermodynamic equilibrium in plasma spectroscopy. Phys. Rev. A 1990, 42, 6588–6601. [Google Scholar] [CrossRef]
  32. Nishijima, D.; Doerner, R.P. Stark width measurements and Boltzmann plots of W I in nanosecond laser-induced plasmas. J. Phys. D 2015, 48, 325201. [Google Scholar] [CrossRef]
Figure 1. (top) Schematic diagram of the LIBS apparatus. (bottom) A picture of the system with the key elements.
Jne 06 00022 g001
Figure 2. (Top) The LIBS signal in the Balmer alpha region of the spectrum of the W-D sample under He flux at delays of 2, 3, and 4 μs from the laser pulse; (Center) in air at delays of 4, 5, and 6 μs from the laser pulse; and (Bottom) under Ar flux at delays of 12, 13, and 14 μs from the laser pulse. For all the measurements, the laser pulse energy was set to 50 mJ and the ICCD gate width was set to 3 μs.
Jne 06 00022 g002
Figure 3. The simulated Tα + Dα + Hα spectra obtained by adding a Tα emission peak with the same width and height as the Dα peaks with He as a background gas (left) and Ar as a background gas (right). The experimental spectra were obtained with a gate delay of 5 μs (He) and a gate delay of 14 μs (Ar).
Jne 06 00022 g003
Figure 4. The integral intensities of the W I and Mo I lines, together with the band at 656.0–656.3 nm, as a function of the applied laser shots. The inset shows a magnification of the signal in the yellow rectangle, highlighting the signal related to the Mo I lines and the T-D-H band.
Jne 06 00022 g004
Figure 5. The optical profilometry of the LIBS crater measured after 10 laser shots. On the left are the color scale bar, the 2D image of the crater (up), and the depth profile along the line marked by the two red and green spheres (bottom). On the right is the 3D image with the step height between the two reference levels: S1 (average level of the bottom of the crater) and S2 (average level of the surface of the sample).
Jne 06 00022 g005
Figure 6. Relative (atomic) concentration of H + D hydrogen isotopes with respect to W as a function of the applied laser shots.
Jne 06 00022 g006
Table 1. Resolution of the two Dα and Hα peaks according to Formula (1) and theoretical resolution of the two Tα and Dα peaks with the same experimental conditions.
Background GasDelay (μs)Rs (Dα − Hα)Rs_theor (Tα − Dα)
He20.950.275
He31.150.333
He41.520.44
Ar121.120.32
Ar131.150.33
Ar141.310.38
Table 2. Spectroscopic parameters of the two W I emission lines at 653.811 nm and 657.393 nm and the relative theoretical and experimental ratios according to Equation (3).
λ (nm)Aki (10−8 s)gkEk (eV)I1/I2 (Theo.)I1/I2 (Exp.)
653.8112.7 × 10−394.3540.9751.09
657.3939.9 × 10−334.487
Disclaimer/Publisher’s Note: The statements, opinions and data contained in all publications are solely those of the individual author(s) and contributor(s) and not of MDPI and/or the editor(s). MDPI and/or the editor(s) disclaim responsibility for any injury to people or property resulting from any ideas, methods, instructions or products referred to in the content.