Article

Gamma-ray Spectroscopy in Low-Power Nuclear Research Reactors

1
Department of Nuclear Engineering and Radiological Sciences, University of Michigan, Ann Arbor, MI 48105, USA
2
Department of Radiation Safety and Security, Paul Scherrer Institute, 5232 Villigen, Switzerland
3
Laboratory for Reactor Physics and Systems Behavior, Ecole Polytechnique Federale de Lausanne, LRS EPFL, 1015 Lausanne, Switzerland
4
The Ohio State University Nuclear Reactor Laboratory, Columbus, OH 43212, USA
*
Author to whom correspondence should be addressed.
These authors contributed equally to this work.
J. Nucl. Eng. 2024, 5(1), 26-43; https://doi.org/10.3390/jne5010003
Submission received: 26 October 2023 / Revised: 22 December 2023 / Accepted: 15 January 2024 / Published: 26 January 2024

Abstract

:
Gamma-ray spectroscopy is an effective technique for radioactive material characterization, routine inventory verification, nuclear safeguards, health physics, and source search scenarios. Gamma-ray spectrometers typically cannot be operated in the immediate vicinity of nuclear reactors due to their high flux fields and their resulting inability to resolve individual pulses. Low-power reactor facilities offer the possibility to study reactor gamma-ray fields, a domain of experiments hitherto poorly explored. In this work, we present gamma-ray spectroscopy experiments performed with various detectors in two reactors: The EPFL zero-power research reactor CROCUS, and the neutron beam facility at the Ohio State University Research Reactor (OSURR). We employed inorganic scintillators (CeBr3), organic scintillators (trans-stilbene and organic glass), and high-purity germanium semiconductors (HPGe) to cover a range of typical—and new—instruments used in gamma-ray spectroscopy. The aim of this study is to provide a guideline for reactor users regarding detector performance, observed responses, and therefore available information in the reactor photon fields up to 2 MeV. The results indicate several future prospects, such as the online (at criticality) monitoring of fission products (like Xe, I, and La), dual-particle sensitive experiments, and code validation opportunities.

1. Introduction

Gamma rays arising from either nuclear reactions or decay processes can significantly influence the heating [1], dose rates [2,3], and radiation-induced aging of reactor components [4]. Understanding gamma-ray characteristics in and around nuclear reactors is therefore essential to their design and operation.
Historically, in-core gamma-ray experiments have relied on flux measurements through devices like thermoluminescent dosimeters (TLDs) [5], ionization chambers [6], or spectrometers placed in regions with a low radiation flux. This is due to reactors’ high-flux environments that, even when using high-speed electronics, lead to a significant pulse pile-up and the consequential loss of spectroscopic information [7]. For instance, previous measurements with NaI(Tl) scintillators near the Kyoto University Reactor (KUR) lacked the spectral resolution to identify specific radioisotopes [8]. Low-power research reactors, however, offer the potential to mitigate flux levels (and consequently, pile-up effects) to a degree conducive to precise, scintillation-based measurements.
Previous experiments include the online gamma-ray spectroscopy of the heat exchanger and the off-gas line of the molten salt reactor experiment (MSRE) [9]. The authors noted that the spectra could only be obtained after shutdown, as the dose rates at power were too high and led to unusable signals. Follow-up studies using simulations [10] have investigated the safeguard-related information that could be gained from such spectra. Other experiments have focused on irradiated fuel elements that were extracted from a reactor core, e.g., pressurized water reactor (PWR) spent fuel after 4 years of cooling [11], to investigate the long-lived fission products. A recent study used gamma-ray spectroscopy to measure the samples of 235U and 239Pu that were pneumatically transported into the high-flux isotope reactor (HFIR) core for the irradiation of 30 s and then ejected for a high-purity germanium (HPGe) measurement after a 20 s delay [12]. The authors used the spectra to estimate the fission yields in 235U and 239Pu to correct anti-neutrino spectrum predictions, an avenue of research for fundamental neutrino research but also for neutrino-based safeguards detector systems [13]. Another application of gamma spectroscopy is prompt-gamma activation analysis (PGAA) [14,15], usually conducted in nuclear reactor beam facilities or at pulsed neutron sources. For instance, in recent work [16], HPGe was used to non-destructively analyze stainless steel wire samples irradiated at the ISIS spallation source and at the Budapest Neutron Centre reactor. There is therefore interest in the generation of similar data for various applications, and we intend to fill the literature gap of direct reactor photon field measurements with new experiments.
Spectroscopic information from reactor core gamma rays provides information for several other important applications, including the estimation of radiation doses [17], spectral properties [18], and the validation of neutron transport codes [19,20,21] that offer combined neutron/photon transport. Fission product quantification, especially short-lived isotopes, is relevant for emergency preparedness and modeling accident scenarios [22]. Emerging reactor designs, including small modular reactors (SMRs) [23,24] and generation IV reactors [25], demand validated and novel modeling approaches, and refined gamma-ray spectroscopy experiments can help inform and validate these simulated models. This is mostly seen in the demand for benchmark-quality experiments to support international initiatives like the International Reactor Physics Experiments Handbook (IRPhE) [26] or the Shielding Benchmark Experiment Archive and Database (SINBAD) [27]. Finally, recent developments in detector technology, like CsPbBr3 [28] and CdZnTe (CZT) [29], may offer lower-cost tools to measure with similar energy resolution as HpGe detectors. A new wave of high-resolution gamma-ray measurements can therefore benefit from a priori knowledge of what information the photon fields in reactors contain.
This paper presents a comparative analysis of gamma-ray spectra acquired from organic, inorganic, and semiconductor detectors measured in two low-power research reactors: CROCUS and the Ohio State University Research Reactor (OSURR). To identify fission products, we utilize CeBr3 and HPGe detectors. Trans-stilbene organic scintillators are also employed to evaluate the performance of organic and dual-particle sensitive detectors [30]. Lastly, we incorporate an organic glass (OGS) scintillator as a comparative benchmark against trans-stilbene and experimental validation of this novel detector’s properties [31]. Our objective is to demonstrate that spectroscopy can be effectively performed using a variety of detectors, identify a variety of fission products, and potentially facilitate advancements in some or all of the other aforementioned applications. In Section 2, we detail the experimental background and setup for each experiment in CROCUS [32] and the OSURR [33], as well as the methods used to analyze each detector type. In Section 3, we present spectra recorded from the various detector types in each reactor. In Section 4, we discuss the implications of these results and planned future works.

2. Materials and Methods

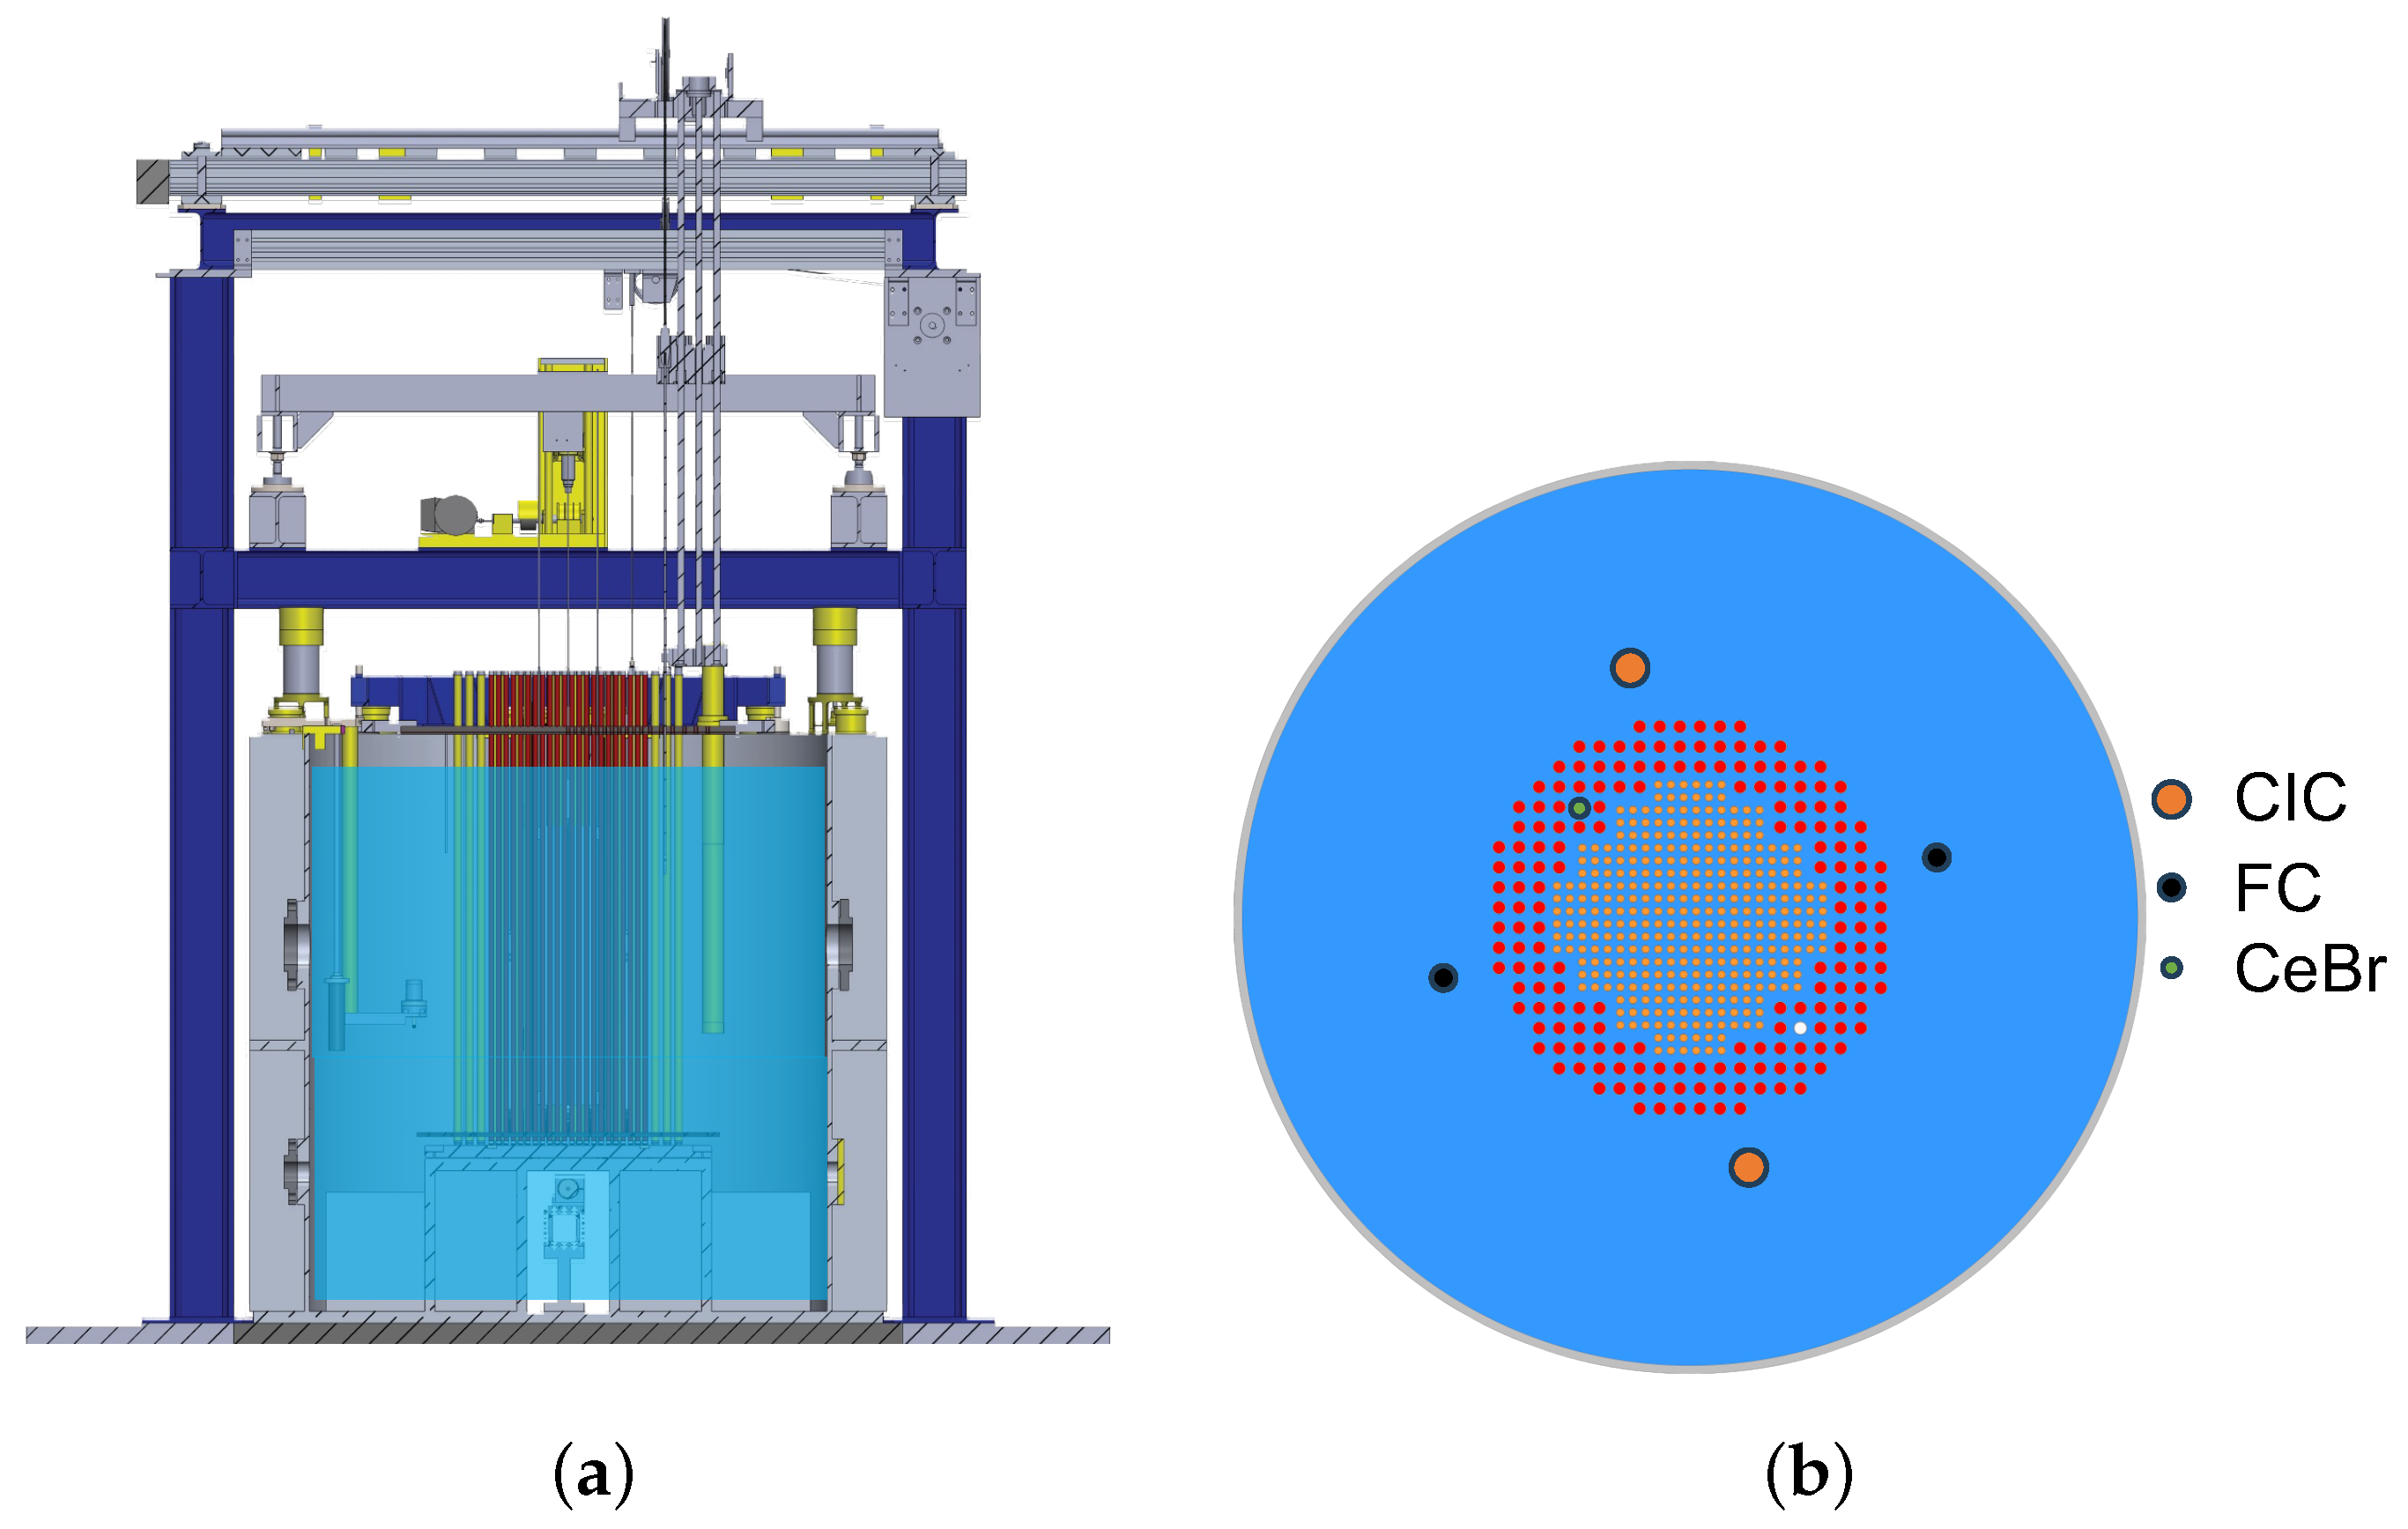
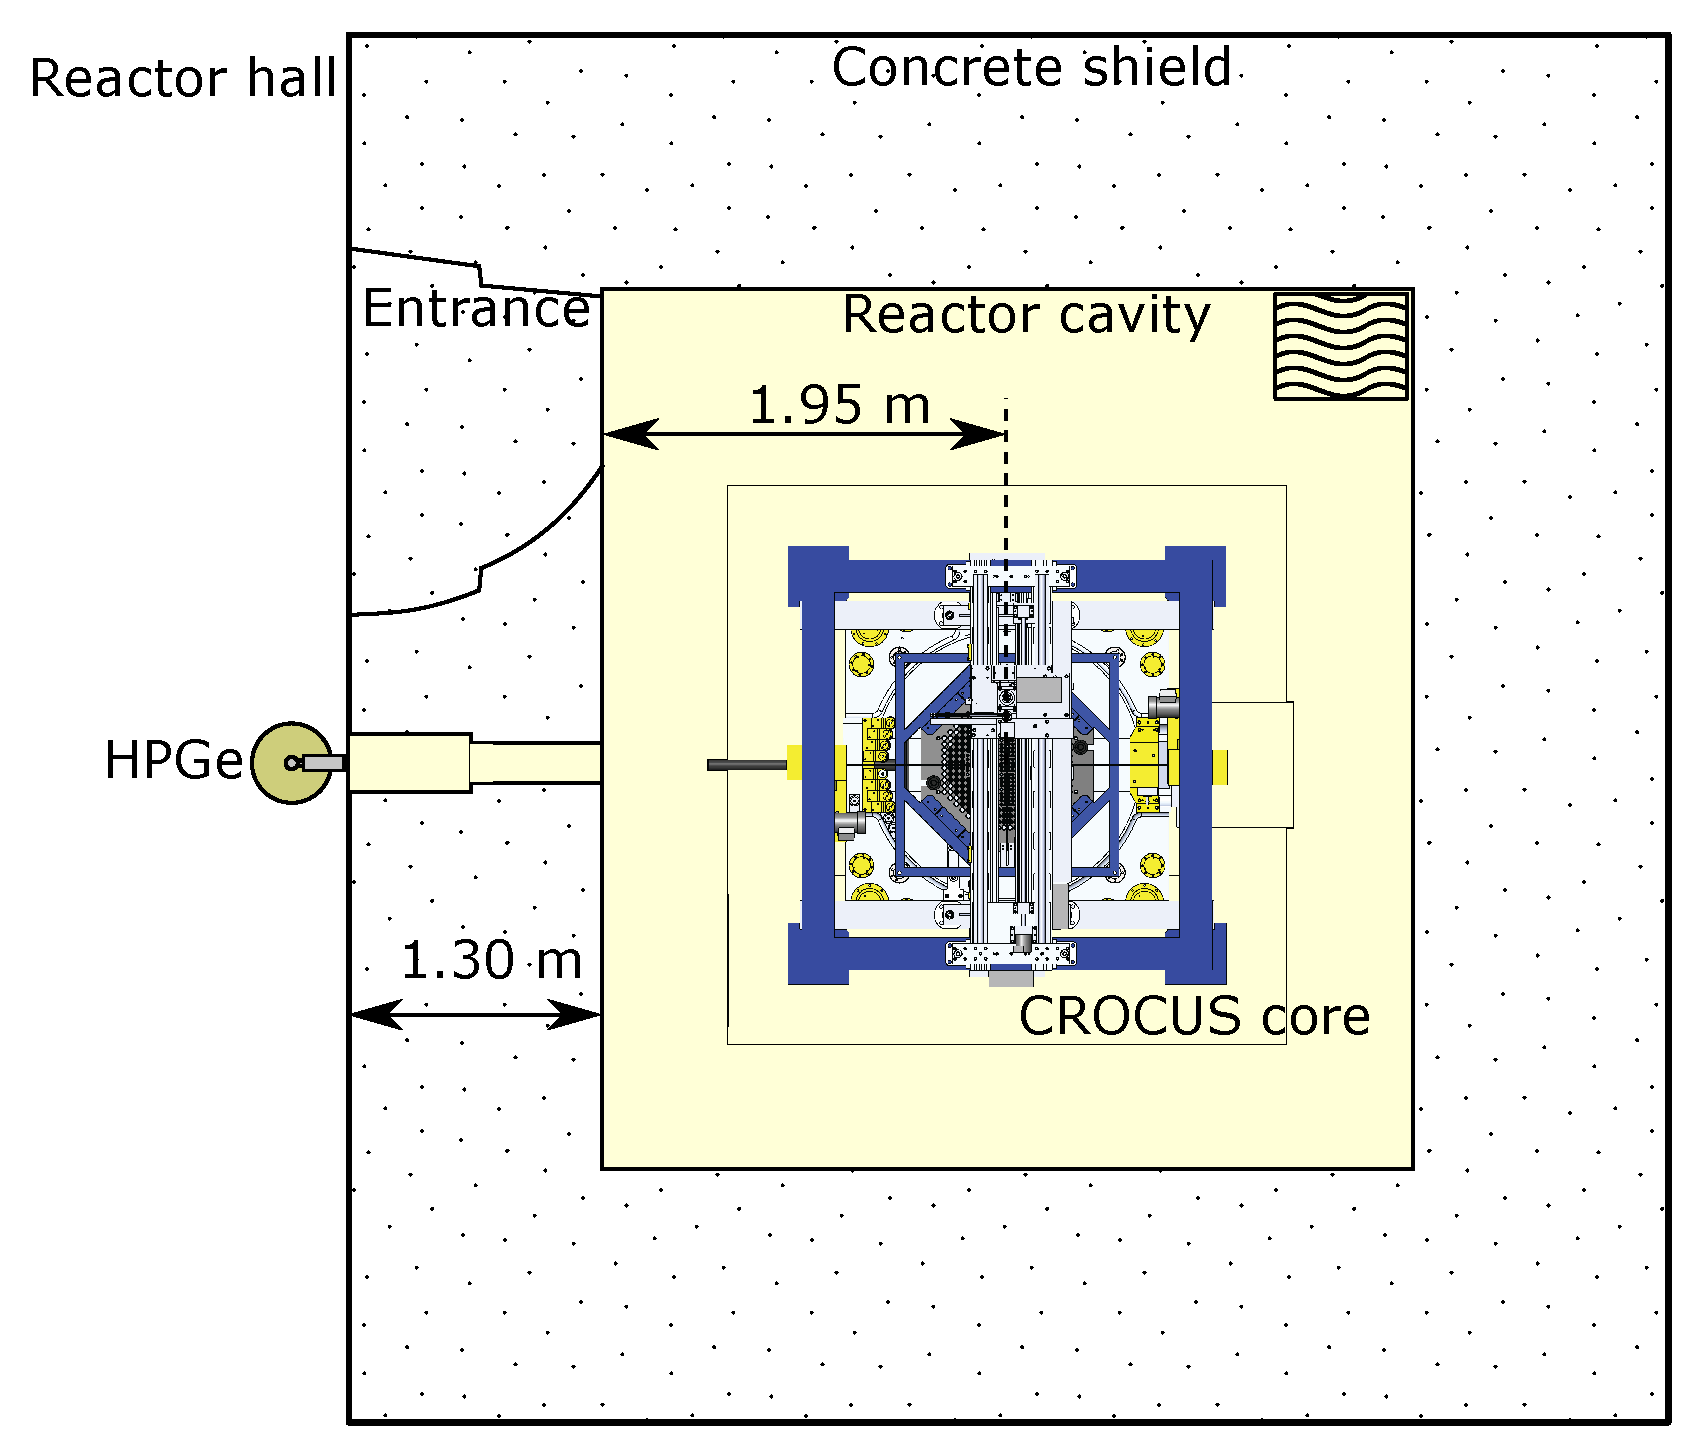
2.1. The CROCUS Reactor
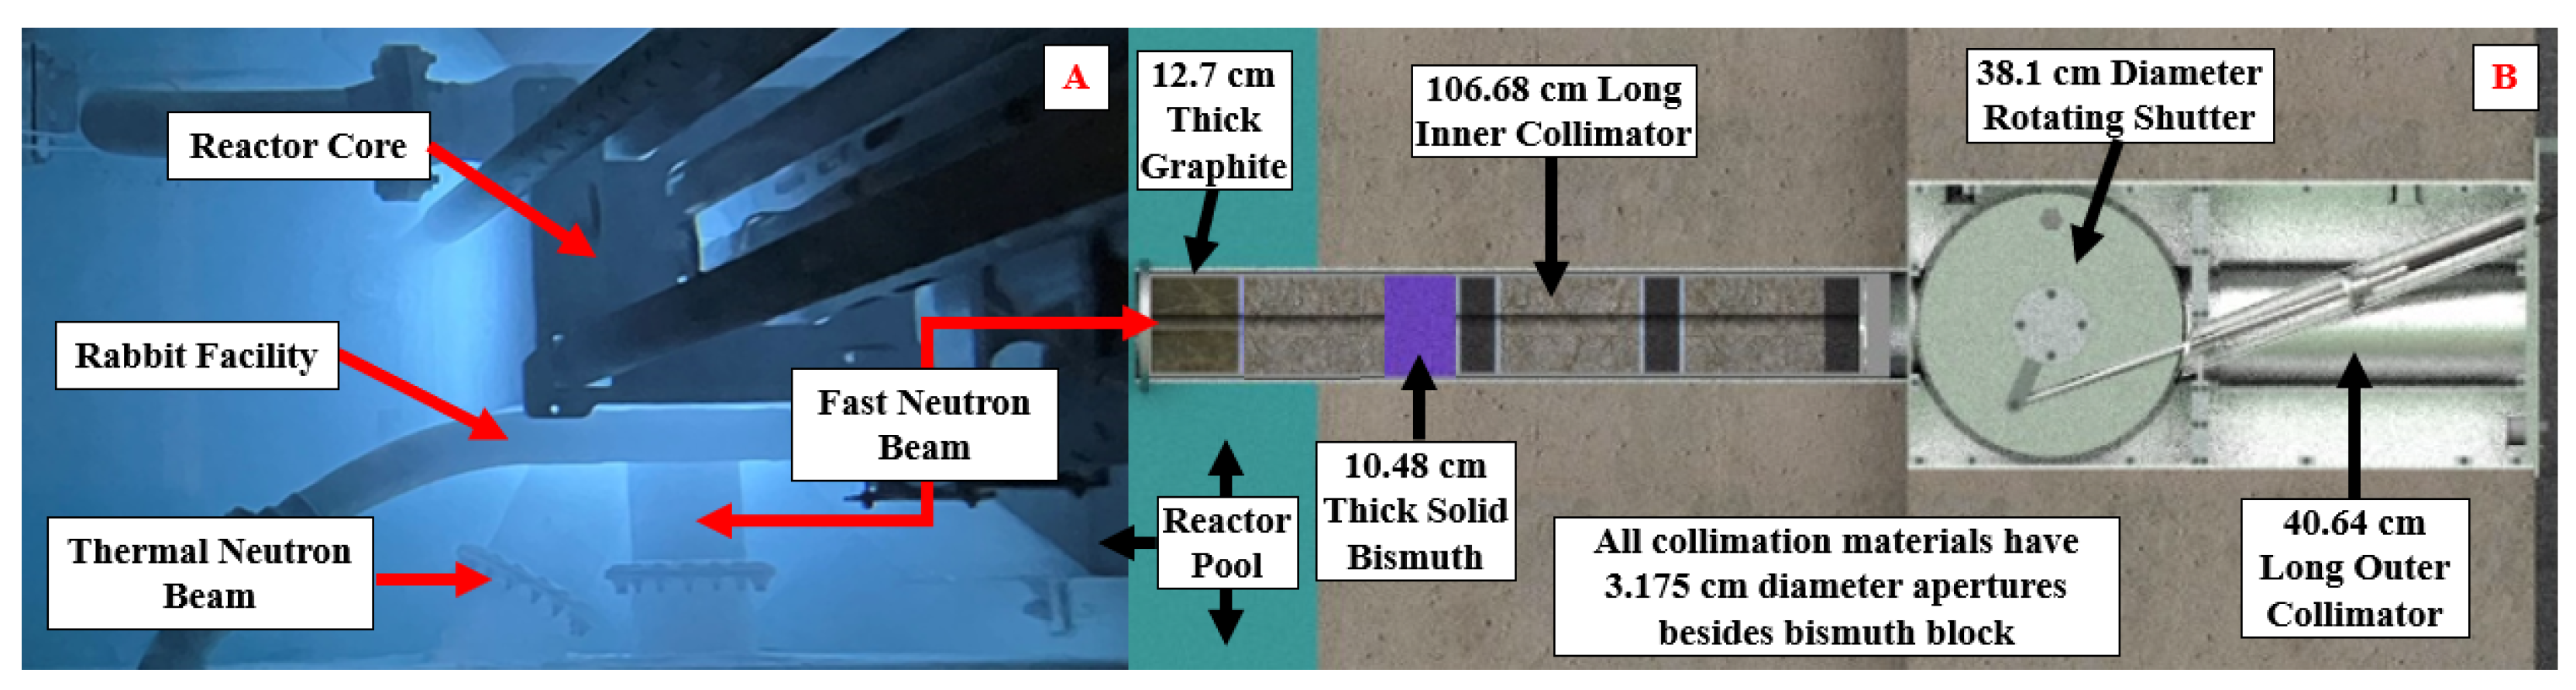
The International Reactor Physics Experiments Handbook (IRPhE) provides a detailed description of the core geometry [34]. The CROCUS reactor, operated by the Laboratory for Reactor Physics and Systems Behaviour (LRS) at the Swiss Federal Institute of Technology Lausanne (EPFL), is a two-zone, uranium-fueled, demineralized light-water-moderated critical assembly. It operates with a maximum power of 100 W (thermal). The core is approximately cylindrical, measuring about 58 cm in diameter and 100 cm in height. The reactor core of CROCUS consists of two types of fuel rods, as illustrated in Figure 1 and Figure 2. The central zone contains 336 UO2 fuel rods (1.8 wt.% enriched, 12.6 mm diameter), arranged in a square lattice with a pitch of 1.8 cm. The peripheral zone is loaded with up to 176 Umet fuel rods (0.9 wt.% enriched, 17 mm diameter), arranged in a square lattice with a pitch of 2.9 cm. All fuel rods are clad with aluminum and held vertically in place by the upper- and lower-grid plates, spaced 100 cm apart. The core is housed in an aluminum water tank with a diameter of 130 cm and a thickness of 1.2 cm. Reactivity is primarily controlled by adjusting the water level with a spillway, with an accuracy of 0.1 mm (equivalent to 0.4 pcm).

2.2. The OSURR

The Ohio State University Research Reactor (OSURR) is a pool-type light-water reactor (LWR) licensed at 500 kW thermal power. The fast neutron beam port is shown in Figure 3 with approximately 1.6 mm between the reactor core wall and collimator entrance for minimal neutron moderation. There is a 106.7 cm long inner collimator which features a 10.5 cm thick solid bismuth shielding block to attenuate reactor gamma rays. A rotating gamma shutter with a diamteter of 38.1 cm filled with lead shot is used to open and close the beam—the lead shot provides approximately 20 cm of shielding in closed position. Following the rotating gamma shutter is a 40.6 cm outer collimator. The total collimation length is 185.4 cm. The collimator has various materials including borated cement, lead, graphite, and aluminum, each with 3.2 cm diameter apertures defining the beam size. The exceptions to this is the 12.7 cm graphite at a beam entrance with a 3.8 cm diameter aperture and the solid bismuth block. The experimental setup for the OSURR experiments is shown in Figure 4. To ensure minimal external light interference, the detectors were securely housed within light-tight containers and set on a modification of a mobile imaging instrument to access the beam exit [35].
The reactor was operated at a power level of 10 W for the larger organic scintillators (1 in OGS and 2 in stilbene, see Section 2.3), as higher powers led to a significant pile-up and unusable pulse shape discrimination (see Section 3.3 on PSD). Conversely, for the smaller organic scintillator cubes, we operated at a higher power level of 1000 W while retaining similar pile-up rates to the larger-detector and lower-power experiments. This is consistent with the ratio of the detector volumes, approximately 200.
Integrated epi-thermal to fast neutron flux (En > 0.5 eV) at beam exit was experimentally determined to be 1.5 × 10⁷ n cm−2 s−1 with a median of 1.6 MeV at 450 kW using multi-foil activation [36] and using spectrum analysis by neutron detectors (SAND) [37] and STAYSL [38] codes for deconvolution. Due to the low neutron activation rate of the foils at low power, the multi-foil activation method is inadequate to measure the fast neutron flux at low power. To confirm the expected linear relationship of flux with power, an imaging experiment was performed using thermal neutron imaging gray values. A LiF:ZnS NDg thermal neutron scintillator and electron-multiplying charge-coupled-device (CCD) camera collected images at various power levels. Using average gray values over multiple images, the linear relationship between the neutron flux at the beam exit and indicated reactor power was confirmed. The extrapolated neutron flux at 10 W from the integrated epi-thermal flux was 3.3 × 10² n cm−2 s−1 (±0.3 × 10² n cm−2 s−1) and at 1000 W, the extrapolated neutron flux was 3.3 × 10⁴ n cm−2 s−1 (±0.3 × 10⁴ n cm−2 s−1). Gamma-ray dose rate was experimentally determined using a Canberra UltraRadiac model MRAD-113 detector. The measured gamma-ray dose rate at 10 W was 1.2 mR hr−1 (±0.1 mR hr−1) and at 1000 W was 51.5 mR hr−1 (±5 mR hr−1). It is worth noting that the gamma-ray dose rate at low power is greatly affected by the reactor operation history.

2.3. Overview of Detectors

2.3.1. Inorganic Scintillator: Cerium Bromide (CeBr3)

CeBr3 detectors were used both in the OSURR and CROCUS. CeBr3 was chosen for its resilience against temperature-induced degradation, vibrations, fast pulse decay, and arbitrary crystal sizes, rendering them ideal candidates for reactor spectroscopy [39]. CeBr3 also provides a higher energy resolution (around 4% at 662 keV [40]) to distinguish photopeaks and other spectral features, compared to the more commonly used NaI(Tl) scintillator [8] (around 6% at 662 keV [41]).
In CROCUS, the detector used was a cylindrical crystal of 16 mm in diameter and 51 mm tall. A Hamamatsu, Bridgewater NJ, USA, Type R12421 photomultiplier tube (PMT) was used for light collection. The CeBr3 was set into the northwest control rod tube (see Figure 1 and Figure 2), and a high voltage (HV) of −610 V was applied to the PMT via Ortec 556 HV units. For the OSURR experiments, a larger 1-inch (25.4 mm) height and 1-inch diameter cylindrical crystal was used and coupled to a Hamamatsu H3178-51 PMT, HV of −600 V provided by a CAEN, Viareggio, Italy, DT1470ET unit. Experimental data in both reactors were obtained using a CAEN DT5730 waveform digitizer with a 500 MHz sample rate. The digitizer was connected to a computer running CoMPASS (CAEN Multi-Parameter Spectroscopy Software) version 2.2.1 for data acquisition and analysis [42].

2.3.2. Semi-Conductor: High-Purity Germanium (HPGe)

An HPGe detector was used as the gamma spectroscopy reference, as HPGe has a considerably superior energy resolution [43,44], making it the best available detector for isotope identification and other spectral analysis. A drawback is that HPGe detectors are sensitive to neutron damage, unlike the other detectors used in this study. For instance, the full width at half-maximum (FWHM) of the measured energy peaks increases by 30% at a fluence above 2 × 10⁸ n cm−2 [45]. To minimize the neutron flux, the HPGe detector was placed in front of the experimental channel of CROCUS (see Figure 5), about 3.3 m from the core center. The channel is a cylindrical hole parallel to the ground at mid-core height on the west side of the concrete shield.
We utilized an ORTEC, Oak ridge TN, USA coaxial high-purity germanium (HPGe) model GEM-15180-P in PopTop configuration. The crystal has a length of 57.2 mm, a diameter of 50 mm, and we used a operational voltage of 3.6 kV. The detector was connected to a Canberra/Mirion Technologies, Ruesselsheim, Germany, DSA 1000 for high-voltage supply, signal amplification, and digitization that is then read out via USB and the Genie2000 Version 3.2 software suite [46].

2.3.3. Organic Scintillator: Trans-Stilbene (C14H12)

To conduct a comparative detector response analysis, we employed trans-stilbene scintillators [47] to test the simultaneous gamma-ray and neutron detection, as CeBr3 scintillators and HPGe semi-conductors cannot directly detect neutrons. This dual-particle sensitivity offers an interesting prospect for reactor monitoring, simulation validation, and possible imaging applications [48,49,50].
We investigated two sizes of the trans-stilbene organic scintillators [47], namely a smaller 6 mm edge cube coupled to a 38.1 mm diameter Hamamatsu H3178-51 PMT what HV, and a larger 2 inch (50.8 mm) diameter and 2 inch (50.8 mm) height cylinder, both acquired from Inrad Optics, Northvale NJ, USA. The stilbene cylinder with a diameter of 50.8 mm was coupled to a PMT of the same diameter. HV of −1200 V was provided by a CAEN, Viareggio, Italy, DT1470ET unit.

2.3.4. Organic Scintillator: Organic Glass Scintillator (OGS)

In 2017, researchers at Sandia National Laboratories developed a new organic glass scintillator (OGS) material capable of the pulse-shape discrimination of gamma-ray and neutron detections [51]. Subsequent studies have characterized this detector material, revealing that OGS exhibits a higher light output and superior time resolution compared to trans-stilbene, the otherwise widely used organic scintillator [52]. We employ OGS to serve as a comparison to trans-stilbene and to enable new experimental opportunities for validating this novel detector type. OGS provides several interesting advantages over stilbene: (1) It is a glass that can be molten and cast with comparatively simple laboratory equipment (e.g., dropping a detector does not result in total loss). This means that the detectors can be cast into arbitrary shapes. (2) The estimated cost compared to stilbene is expected to be an order of magnitude lower, especially once production is brought to scale [53].
In this experiment, two different sizes of OGS were employed: a 6 mm edge cube and a cylindrical OGS with a diameter and height of 1 inch (25.4 mm). To ensure diffuse optical reflection, both scintillators were wrapped with Teflon tape. The 6 mm edge cubes and the 25.4 mm diameter OGS cylinder were connected to Hamamatsu H3178-51 PMTs and the HV of −1200 V was provided by a CAEN DT1470ET unit. Notably, the OGS crystals were cast in-house [54].

2.4. Calibration

2.4.1. Peak Fitting Algorithm (Inorganic Detectors)

It is common practice to fit normal distributions to photopeaks and use a linear fit to approximate the continua underneath them [55,56]. As such, we approximate all photopeaks in the measured spectra with the following equation:
y = A + B x + C e ( x μ ) 2 2 σ 2 ,
where A, B, C, μ , and σ are all fit parameters. μ represents the mean of each Gaussian and σ its standard deviation. x is in the units of our horizontal axis in our spectral histogram; oftentimes, this might be in units of analog-to-digital conversion (ADC) or, after calibration, keV. y is in units of our vertical axis in our spectral histogram; oftentimes, this might be in units of counts or a count rate. Fitting was performed by a trust-region-based nonlinear least-squares regression via the Scipy 1.10.0 [57] and Numpy 1.23.5 [58] Python libraries.

2.4.2. Inorganic Detectors

Using a linear least-squares fitting Section 2.4.1, we calibrated the means (solving for parameter μ in (1)) of each of the photopeaks (ADC) to the corresponding photopeaks in the literature (keV). As seen in Figure 6, we used the 185 keV (235U), 511 keV (annihilation), 662 keV (137Cs), 816 keV (140La), 1001 keV (238U), and 1596 keV (140La) peaks for calibration. These photopeaks were chosen for the certainty in their assignments (see Section 4.1 for more discussion on the peak identification).

2.4.3. Organic Detectors

To calibrate the light output in our organic scintillators, we measured a mono-energetic gamma ray source, 137Cs, which emits a 662 keV gamma-ray, and interpolates for the expected Compton edge location [30], as shown in Figure 7. The Compton edge energy (CE) is calculated as the energy deposited from a single 180 degree Compton scatter [59]. Therefore, a CE energy of 478 keV was used to calibrate the light output of each organic scintillator, under the assumption that a zero energy deposition corresponds to zero light output.
Following the calibration process using the 137Cs source, we employed pulse-shape discrimination (PSD) [30] to classify individual pulses as either induced by gamma rays or by neutrons.

3. Results

3.1. HPGe Spectroscopy

In Figure 8, we present the HPGe spectrum acquired in the CROCUS reactor recorded in a 50,646-s interval immediately after shutdown. We identified 46 emitters from this HPGe spectrum. Each identification is listed in Figure 8 legend and Table 1. For more on how we assigned these photopeaks, see Section 4.1. The spectrum covers a range from 0 to 2 MeV, each photopeak has a FWHM value in the range of 0.7–4.5 keV, and most identified peaks exceeded 104 net counts. Each identified peak and its corresponding energies and half-lives are compiled in Table 1.

3.2. CeBr3 (CROCUS and OSURR)

In Figure 9, we present CeBr3 spectra taken in CROCUS and the OSURR; for reference, we also plotted the HPGe spectrum acquired in CROCUS, to emphasize that peak summing, the phenomenon of low-energy resolution detectors showing multiple nearby photopeaks as one photopeak, affects both CeBr3 spectra. For comparison, each spectrum was normalized by its maximum count value, enabling a more direct comparison. The shape of the OSURR CeBr3 spectrum closely resembled that of our CROCUS CeBr3 spectrum, in the shape and location of both their photopeaks and their continua, except the OSURR spectrum had a higher energy threshold in data collection (due to data throughput limitations), leading to the absence of the first peak at approximately 728 keV.

Acquisition Tests at Criticality

Figure 10 shows two spectra acquired in CROCUS at a 3 mW reactor power, utilizing the CeBr3 and HPGe detectors. Both plots demonstrate substantially higher count and pile-up rates during operation compared to shutdown conditions. In the CeBr3 data, the applied thresholds needed to be set above 2 MeV, resulting in inadequate spectral information for regions where the detector of such a dimension can efficiently resolve photopeaks (<3 MeV). The HPGe spectrum illustrates a substantial loss of spectral information during power operation compared to its shutdown counterpart. This may mostly be due to the pileup (estimated to be >60%) or the relative increase in fission gamma rays that follow an approximately exponential shape in energy [78].

3.3. Organic Detectors (OSURR)

In Figure 11, we compare the OGS, stilbene, and CeBr3 pulse height spectra. We highlight the summed photopeaks with mean values at 965 keV and 1596 keV, accompanied by their corresponding summed CEs at 763 keV and 1376 keV, respectively. The observed CEs align among the different detector types, showing how discernible and consistent gamma-ray spectral information can be observed in the organic scintillators. The unfolding procedures for gamma-ray spectroscopy with organic scintillators are nonetheless much more complex and uncertain compared to peak fitting [79].
In Figure 12, we show the pulse height spectrum for the 1-inch OGS detector measured at OSURR at 10 W reactor power. The gamma-ray pulse integral spectra obtained from the organic scintillators show expected characteristics, revealing a continuous distribution with Compton edges from the summed gamma-ray lines. The neutron-induced pulses follow the expected shape, as most fast neutrons in the reactor spectrum are emitted from neutron-induced fission, approximately following a Watt distribution. The non-trivial CE shapes are indeed found in the gamma-induced pulses.
Figure 13 presents pulse-shape discrimination plots for the 6 mm stilbene cube measured in the OSURR neutron beam at 1 kW reactor power and for the 2-inch stilbene cylinder measured in the OSURR neutron beam at 10 W reactor power. Figure 14 shows the pulse shape discrimination plots for the 6 mm OGS measured in the OSURR neutron beam at a reactor power of 1 kW and for the 1-inch OGS measured in the OSURR neutron beam at 10 W reactor power. Note that the neutron-induced pulses do not correspond to the used calibration and would require a separate analysis based on the quenching function that relates scatter proton energy to light yield [60].
The main observation is that, despite the high detection rate, pulse shape discrimination is possible. As indicated by the color maps that were applied after fitting a discrimination line into the PSD plot, we can distinguish between gamma rays and fast neutrons down to an equivalent light yield of 1 MeVee. The discrimination line was fitted to the minimum of a bimodal Gaussian fit for each energy slice of 20 keVee widths.

4. Discussion

4.1. Peak Identification

To maximize the accuracy of the peak assignments of the HPGe spectrum in Table 1, we used the fit’s root mean squared error (RMSE), which is about 2.2 keV. Only peaks that fell within 3 × RMSE of the literature/database values were assigned. For example, the 511 keV annihilation peak appeared at roughly 510 keV after calibration. This is within 3 RMSE, and it was therefore assigned to annihilation. The ±2 keV difference between the expected and experimental photopeak energies was consistently observed, with a few photopeaks assigned with a calculated energy greater than 1 RMSE off from the expected energy. For statistical certainty, we only considered photopeaks that had net counts >104 [59]. The energy-dependent bias in the peak identification is suspected to arise from the still remaining pileup, leading to a linear drift.
The identification of a specific emitter, such as the 1596 keV 140La line, would imply the existence of that isotope’s other common gamma-ray lines, thus prompting, for example, the assignment of the other peaks of 140La at 329, 487, 816, and 925 keV. We also compared these same-emitter gamma-ray lines to ensure their relative intensities matched with those from the literature, an approximate method of matching their branching ratios. For example, we found that 140La has photopeaks at (in order of intensity) of 1596, 487, 816, 329, and 925 keV, and this matches with the expected relative intensities of 140La from the literature [63].
Photopeaks corresponding to more abundant fission products were also more heavily considered, like those with mass numbers around either 90 or 140 [80]. We also more heavily consider materials that are common in the reactors. This includes the 235U and 238U fuel used in both CROCUS and OSURR. As such, we found 235U lines at 109, 143, 163, 185, 202, and 205 keV, 238U lines at 50 and 1001 keV, and the κ α lines of uranium at 93, 95, and 98 keV present in our spectra. From the aluminum-clad fuel, we also saw the neutron activation line of 27Al at 1779 keV.
Among the identified isotopes are the gaseous Xe, I isotopes, and aerosol Cs isotopes that mostly contribute severe accident calculations and fallout predictions [81], as well as reactor poisoning [82]. This measurement may therefore offer an opportunity for the real-time tracking of the Xe poisoning of the reactor. Another application is that of the fission yield measurements [12,22,83] to improve nuclear data. The short half-life of Al(n, γ ) makes it a major contributor to facility-level dose during operation and immediately after shutdown in reactors with Al structures. Therefore, measuring its specific contribution can aid in dose modeling and reactor shielding design calculations.
In all the experiments presented in this work, the management of pileup and data throughput required the tuning of each experiment on the fly, i.e., the threshold settings were updated each time to allow for a sustainable data rate to the digitizer buffer, whilst preserving as many pulses as possible for analysis (for the count rates that we observed, see Appendix A Table A1). When operating the CROCUS reactor at 3 mW power (Figure 10), the HPGe detector showed pileup rates above 60%. This indicates a very low rate of recoverable pulses with relevant energy information on top of the assumption that automatic pileup rejection worked as intended. This is also despite the relatively low operating power of 3 mW. CROCUS, by design, which can be operated at powers down to around 0.5 mW, yet such low-power experiments are yet to be tested. The lower power might alleviate the pileup concern, and potentially still reveal a line spectrum on top of the gamma rays produced in fission.
In Figure 11, we see that discernible spectral features can be identified when the OSURR is at low power, specifically 10 W, when the detector is significantly separated from the reactor core and has dedicated shielding. Optimizing the CROCUS experimental channel in terms of shielding, measuring at a higher distance, or attempting an HPGe measurement at OSURR are all possible avenues of improvement.
An important observation is also the lack of identification for several photopeaks, which we listed in Appendix A Table A2 for future reference.
Finally, we experimentally presented what information is in principle available in the photon field of a research reactor. Lower cost alternatives to HPGe, whilst still retaining similar energy resolution, such as the emerging CsPbBr3 [28] and CZT [29] detectors, would be interesting to test in the future within these low-power research reactor environments. Exploring the range beyond 2 MeV is relevant to activation analysis, such as a recent experiment to quantitatively measure the activation of oxygen in water in the Joint European Torus (JET) fusion reactor [84].

4.2. Organic Scintillator Detectors in Nuclear Reactors

The feasibility of utilizing organic scintillators in nuclear reactors was established, which to our knowledge has not been attempted before. Through power and threshold adjustments, the simultaneous measurement of gamma-ray and neutron-pulse-height spectra with PSD becomes achievable, even in high-flux environments. This capability can be used for the simultaneous neutron and gamma-ray spectrum unfolding [85] or mixed-field dosimetry [86] applications. The first successful tests of using the data from these organic scintillators for neutron noise measurements in CROCUS is reported in other work [87,88].

4.2.1. Scintillation Crystal Volume

The influence of detector volume on gamma-ray and neutron pulse heights showed a nonlinear relationship (see Figure 13 and Figure 14). Smaller organic detectors exhibited reduced amounts of high-energy-deposit gamma rays (>4 MeVee), while the neutron response remained relatively consistent. This discrepancy is attributed to the interaction between the involved mechanisms. Neutrons scatter on protons and carbon nuclei, leading to nuclear scintillation with short-track lengths in the order of micrometers. Conversely, gamma rays interact via Compton scattering, resulting in electron scintillation with track lengths in the order of millimeters. Consequently, as the detector size approaches the Compton electron track lengths, the chances of the electron leaking from the crystal increases, and a relative decrease in gamma-ray counts is observed. This property may enable the optimization of the detector volume to selectively detect fewer gamma rays, and therefore relatively more neutrons, which holds promise for fast neutron detection applications like imaging [89] and dosimetry around the reactor vessel [90].

4.2.2. Prospects of OGS

We showed the first experimental application of OGS in a reactor radiation field. OGS exhibits an overall comparable performance to stilbene albeit with an inferior PSD performance, i.e., the electron-equivalent energy at which pulses can be discriminated with high confidence is lower with stilbene than it is with organic glass. However, OGS offers the ability to tailor the scintillator shape at a much lower cost. In the event of damage, OGS can be remelted and reconstituted, rendering it a more cost-effective and versatile option. Lastly, all vendors known to the authors have stopped selling stilbene scintillators, thus potentially incentivizing the broader switch to OGS.

5. Conclusions

Gamma-ray measurements in nuclear research reactors are important for radiation protection, core monitoring, detector characterization, and code validation data generation. However, direct spectroscopy measurements in reactor fields remain challenging due to the high detection rates and the resulting pileup. In this work, we expanded upon previous gamma-ray experiments in nuclear reactors by testing the gamma spectroscopy and organic scintillators in two facilities, namely the OSURR and the CROCUS zero-power reactor. We provide a baseline of information with regard to the available information in a reactor’s photon field up to 2 MeV—which we directly present by high-energy resolution measurements via HPGe detector after the reactor shutdown—and the detector spectra of CeBr3 and organic scintillators set into the radiation fields of an operating reactor. Our data encompassed detector responses and pulse shape discrimination performance for both the established organic scintillator trans-stilbene, as well as the first application of organic glass scintillator OGS in the neutron beam of a nuclear reactor.
Future work may include a half-life analysis of the found emitters over time to verify the peak identification. Specifically, HPGe may have applications in the real-time monitoring of isotopes with short half-lives, which can help monitor reactor operation and dose, like in the case of 27Al activation, or accident-relevant isotopes like Xe, Cs, or I. With the emergenc of high-energy resolution detector technologies, such as CsPbBr3 and CZT that do not require cooling and are thus portable, we foresee a much simpler method of obtaining similar information.

Author Contributions

Conceptualization, O.V.P. and F.B.D.; methodology, A.L., F.B.D. and O.V.P.; software, A.L.; validation, F.B.D. and A.L.; formal analysis, O.V.P., F.B.D. and A.L.; resources, S.A.P., L.R.C., A.P., V.P.L. and M.G.B.; investigation, V.L, T.M., O.V.P., M.G.B. and F.B.D.; writing—original draft preparation, O.V.P., A.L. and F.B.D.; writing—review and editing, all authors; visualization, A.L.; supervision, O.V.P.; project administration, S.A.P.; funding acquisition, S.A.P., L.R.C. and A.P. All authors have read and agreed to the published version of the manuscript.

Funding

This work was supported in-part by the Consortium for Monitoring, Technology, and Verification under Department of Energy National Nuclear Security Administration award number DE-NA0003920.

Data Availability Statement

The data presented in this study are available on request from the corresponding author. The data are not publicly available, as the data may contain confidential nuclear facility information. Data requests will be evaluated on a case-by-case basis.

Acknowledgments

We thank J.P. Abegg for their assistance in the logistics of transporting sensitive detector equipment from EPFL to GVA. We thank the staff at OSU Nuclear Reactor Laboratory for their support.

Conflicts of Interest

The funders had no role in the design of the study; in the collection, analyses, or interpretation of data; in the writing of the manuscript; or in the decision to publish the results’.

Appendix A

Table A1. Overview of count rates of detectors in OSURR and CROCUS.
ReactorDetectorPowerCounts/s
(n/ γ )
Counts/W
(n/ γ )
OSURRCeBr3 1 in10 W0/4350/16101
Stilbene 2 in10 W251/56725.1/56.7
OGS 1 in10 W146/30714.6/30.7
CROCUSCeBr3 1.3 cmShutdown0/11475n/a
HPGeShutdown0/1793n/a
Table A2. List of unidentified peaks in the HPGe detector spectrum acquired in the CROCUS reactor. The estimated uncertainty in the energy calibration is ±2.2 keV.
Energy (keV)
3145728111135
3326198741143
4226359181173
43163910841290
656129613711435
738137113831443
742139813981460
750143514991738
776144317381800
182818371922

References

  1. Colombier, A.-C.; Amharrak, H.; Fourmentel, D.; Ravaux, S.; Régnier, D.; Gueton, O.; Hudelot, J.-P.; Lemaire, M. Nuclear data production, calculation and measurement: A global overview of the gamma heating issue. EPJ Web Conf. 2013, 42, 04001. [Google Scholar] [CrossRef]
  2. Ródenas, J. Application of the Monte Carlo method to estimate doses due to neutron activation of different materials in a nuclear reactor. Radiat. Phys. Chem. 2017, 140, 442–446. [Google Scholar] [CrossRef]
  3. Eade, T.; Colling, B.; Naish, J.; Packer, L.; Valentine, A. Shutdown dose rate benchmarking using modern particle transport codes. Nucl. Fusion 2020, 60, 056024. [Google Scholar] [CrossRef]
  4. Zinkle, S.; Was, G. Materials challenges in nuclear energy. Acta Mater. 2013, 61, 735–758. [Google Scholar] [CrossRef]
  5. Amharrak, H.; Di Salvo, J.; Lyoussi, A.; Roche, A.; Masson-Fauchier, M.; Bosq, J.; Carette, M. Analysis and recent advances in gamma heating measurements in MINERVE facility by using TLD and OSLD techniques. In Proceedings of the 2011 2nd International Conference on Advancements in Nuclear Instrumentation, Measurement Methods and their Applications, Ghent, Belgium, 6–9 June 2011; pp. 1–9. [Google Scholar]
  6. Žerovnik, G.; Kaiba, T.; Radulović, V.; Jazbec, A.; Rupnik, S.; Barbot, L.; Fourmentel, D.; Snoj, L. Validation of the neutron and gamma fields in the JSI TRIGA reactor using in-core fission and ionization chambers. Appl. Radiat. Isot. 2015, 96, 27–35. [Google Scholar] [CrossRef] [PubMed]
  7. Anders, O. Experiences with the Ge(Li) detector for high-resolution gamma ray spectrometry and a practical approach to the pulse pileup problem. Nucl. Instrum. Methods 1969, 68, 205–208. [Google Scholar] [CrossRef]
  8. Nakashima, Y.; Minato, S.; Kawano, M.; Tsujimoto, T.; Katsurayama, K. Gamma-ray Energy Spectra Observed around a Nuclear Reactor. J. Radiat. Res. 1971, 12, 138–147. [Google Scholar] [CrossRef]
  9. Houtzeel, A.; Dyer, F. Study of Fission Products in the Molten-Salt Reactor Experiment by Gamma Spectrometry; Technical Report; Oak Ridge National Laboratory (ORNL): Oak Ridge, TN, USA, 1972. [Google Scholar]
  10. Kovacevic, B.; Soares, A.V.; Lintereur, A.T.; Walters, W.J.; Betzler, B.; Dion, M.P.; Evans, L.G.; Johnsen, A.M. Gamma-ray Signatures for Identifying Plutonium Diversion in Molten Salt Reactors. J. Nucl. Mater. Manag. 2023, 50, 17–34. [Google Scholar]
  11. Hellesen, C.; Grape, S.; Jansson, P.; Svärd, S.J.; Lindell, M.Å.; Andersson, P. Nuclear spent fuel parameter determination using multivariate analysis of fission product gamma spectra. Ann. Nucl. Energy 2017, 110, 886–895. [Google Scholar] [CrossRef]
  12. Kim, S.; Martoff, C.J.; Dion, M.; Glasgow, D. Reactor Antineutrino Spectral “Bump”: Cumulative Fission Yields of Irradiated U-235 and Pu-239 Measured by HPGe Gamma-ray Spectroscopy. arXiv 2023, arXiv:2308.05630. [Google Scholar] [CrossRef]
  13. Stewart, C.; Abou-Jaoude, A.; Erickson, A. Employing antineutrino detectors to safeguard future nuclear reactors from diversions. Nat. Commun. 2019, 10, 3527. [Google Scholar] [CrossRef] [PubMed]
  14. Molnar, G. Handbook of Prompt Gamma Activation Analysis: With Neutron Beams; Springer Science & Business Media: Berlin/Heidelberg, Germany, 2004; Volume 1. [Google Scholar]
  15. Lindstrom, R.M.; Révay, Z. Prompt gamma neutron activation analysis (PGAA): Recent developments and applications. J. Radioanal. Nucl. Chem. 2017, 314, 843–858. [Google Scholar] [CrossRef]
  16. Tian, K.V.; Festa, G.; Szentmiklósi, L.; Maróti, B.; Arcidiacono, L.; Laganà, G.; Andreani, C.; Licoccia, S.; Senesi, R.; Cozza, P. Compositional studies of functional orthodontic archwires using prompt-gamma activation analysis at a pulsed neutron source. J. Anal. At. Spectrom. 2017, 32, 1420–1427. [Google Scholar] [CrossRef]
  17. Leppänen, J.; Valtavirta, V.; Rintala, A.; Hovi, V.; Tuominen, R.; Peltonen, J.; Hirvensalo, M.; Dorval, E.; Lauranto, U.; Komu, R. Current Status and On-Going Development of VTT’s Kraken Core Physics Computational Framework. Energies 2022, 15, 876. [Google Scholar] [CrossRef]
  18. Kaltiaisenaho, T. Photon transport physics in Serpent 2 Monte Carlo code. Comput. Phys. Commun. 2020, 252, 107143. [Google Scholar] [CrossRef]
  19. White, M.C. Development and Implementation of Photonuclear Cross-Section Data for Mutually Coupled Neutron-Photon Transport Calculations in the Monte Carlo N-Particle (MCNP) Radiation Transport Code. Ph.D. Thesis, University of Florida, Gainesville, FL, USA, 2000. [Google Scholar] [CrossRef]
  20. Alqahtani, M. On-line measurement and simulation of the in-core gamma energy deposition in the McMaster nuclear reactor. Nucl. Eng. Technol. 2022, 54, 30–35. [Google Scholar] [CrossRef]
  21. Miller, E.C.; Clarke, S.D.; Flaska, M.; Prasad, S.; Pozzi, S.A.; Padovani, E. MCNPX-PoliMi post-processing algorithm for detector response simulations. J. Nucl. Mater. Manag. 2012, 40, 34–41. [Google Scholar]
  22. Kalinowski, M.B.; Pistner, C. Isotopic signature of atmospheric xenon released from light water reactors. J. Environ. Radioact. 2006, 88, 215–235. [Google Scholar] [CrossRef]
  23. Locatelli, G.; Bingham, C.; Mancini, M. Small modular reactors: A comprehensive overview of their economics and strategic aspects. Prog. Nucl. Energy 2014, 73, 75–85. [Google Scholar] [CrossRef]
  24. Cooper, M. Small modular reactors and the future of nuclear power in the United States. Energy Res. Soc. Sci. 2014, 3, 161–177. [Google Scholar] [CrossRef]
  25. Locatelli, G.; Mancini, M.; Todeschini, N. Generation IV nuclear reactors: Current status and future prospects. Energy Policy 2013, 61, 1503–1520. [Google Scholar] [CrossRef]
  26. Bess, J.D.; Ivanova, T.; Hill, I.; Martin, J.F.; Briggs, J.B.; Scott, L.; DeHart, M.D.; Percher, C.; Marshall, B.J.; Blaise, P. Intrinsic value of the international benchmark projects, ICSBEP and IRPhEP, for advanced reactor development. Front. Energy Res. 2023, 11, 1085788. [Google Scholar] [CrossRef]
  27. Kodeli, I.A.; Sartori, E. SINBAD—Radiation shielding benchmark experiments. Ann. Nucl. Energy 2021, 159, 108254. [Google Scholar] [CrossRef]
  28. He, Y.; Petryk, M.; Liu, Z.; Chica, D.G.; Hadar, I.; Leak, C.; Ke, W.; Spanopoulos, I.; Lin, W.; Chung, D.Y.; et al. CsPbBr3 perovskite detectors with 1.4% energy resolution for high-energy γ-rays. Nat. Photonics 2021, 15, 36–42. [Google Scholar] [CrossRef]
  29. Carchon, R.; Moeslinger, M.; Bourva, L.; Bass, C.; Zendel, M. Gamma radiation detectors for safeguards applications. Nucl. Instruments Methods Phys. Res. Sect. A Accel. Spectrometers Detect. Assoc. Equip. 2007, 579, 380–383. [Google Scholar] [CrossRef]
  30. Darby, F.B.; Hua, M.Y.; Pakari, O.V.; Clarke, S.D.; Pozzi, S.A. Multiplicity counting using organic scintillators to distinguish neutron sources: An advanced teaching laboratory. Am. J. Phys. 2023, 91, 936–945. [Google Scholar] [CrossRef]
  31. Warburton, W.K.; Carlson, J.S.; Feng, P.L. Organic glass scintillator (OGS) property comparisons to Stilbene, EJ-276 and BC-404. Nucl. Instruments Methods Phys. Res. Sect. A Accel. Spectrometers Detect. Assoc. Equip. 2021, 1018, 165778. [Google Scholar] [CrossRef]
  32. Lamirand, V.; Laureau, A.; Pakari, O.; Frajtag, P.; Pautz, A. Power calibration methodology at the CROCUS reactor. EPJ Web Conf. 2020, 225, 04022. [Google Scholar] [CrossRef]
  33. Kauffman, A.; White, S.; Herminghuysen, K. OSU Nuclear Reactor Laboratory Website. Available online: https://reactor.osu.edu (accessed on 8 November 2023).
  34. Paratte, J.; Früh, R.; Kasemeyer, U.; Kalugin, M.; Timm, W.; Chawla, R. A benchmark on the calculation of kinetic parameters based on reactivity effect experiments in the CROCUS reactor. Ann. Nucl. Energy 2006, 33, 739–748. [Google Scholar] [CrossRef]
  35. Bisbee, M.G.; Oksuz, I.; VanZile, M.P.; Cherepy, N.J.; Cao, L.R. An automated fast neutron computed tomography instrument with on-line focusing for non-destructive evaluation. Rev. Sci. Instrum. 2022, 93, 113702. [Google Scholar] [CrossRef]
  36. ASTM E261-16(2021); Standard Practice for Determining Neutron Fluence, Fluence Rate, and Spectra by Radioactivation Techniques. ASTM: West Conshohocken, PA, USA, 2021; Volume 12.02, pp. 1–15. [CrossRef]
  37. Jacobs, G.J.; van den Bosch, R.L. Calibration measurements with the multisphere method and neutron spectrum analyses using the SAND-II program. Nucl. Instrum. Methods 1980, 175, 483–489. [Google Scholar] [CrossRef]
  38. Perey, F. Least-Squares Dosimetry Unfolding: The Program STAY’SL; Technical Report; Oak Ridge National Laboratory: Oak Ridge, TN, USA, 1977. [Google Scholar]
  39. Kim, C.; Lee, W.; Melis, A.; Elmughrabi, A.; Lee, K.; Park, C.; Yeom, J.Y. A review of inorganic scintillation crystals for extreme environments. Crystals 2021, 11, 669. [Google Scholar] [CrossRef]
  40. Pakari, O.; Lamirand, V.; Mager, T.; Laureau, A.; Frajtag, P.; Pautz, A. First in-core gamma spectroscopy experiments in a zero power reactor. EPJ Web Conf. 2021, 253, 04022. [Google Scholar] [CrossRef]
  41. Swiderski, L.; Gojska, A.; Grodzicka, M.; Korolczuk, S.; Mianowski, S.; Moszynski, M.; Rzadkiewicz, J.; Sibczynski, P.; Syntfeld-Kazuch, A.; Szawlowski, M.; et al. Scintillators For High-Temperature Plasma Diagnostics. In Proceedings of the 1st EPS Conference on Plasma Diagnostics—PoS(ECPD2015), Rome, Italy, 14–17 April 2016. [Google Scholar] [CrossRef]
  42. Billnert, R.; Oberstedt, S.; Andreotti, E.; Hult, M.; Marissens, G.; Oberstedt, A. New information on the characteristics of 1 in.× 1 in. cerium bromide scintillation detectors. Nucl. Instrum. Methods Phys. Res. Sect. A Accel. Spectrometers Detect. Assoc. Equip. 2011, 647, 94–99. [Google Scholar] [CrossRef]
  43. Peyres, V.; Crespo, T.; Mejuto, M.; García-Toraño, E. Measurement of NORM samples with CeBr3 detectors. Appl. Radiat. Isot. 2017, 126, 307–310. [Google Scholar] [CrossRef] [PubMed]
  44. Perez-Andujar, A.; Pibida, L. Performance of CdTe, HPGe and NaI(Tl) detectors for radioactivity measurements. Appl. Radiat. Isot. 2004, 60, 41–47. [Google Scholar] [CrossRef] [PubMed]
  45. Borrel, V.; Kandel, B.; Albernhe, F.; Frabel, P.; Cordier, B.; Tauzin, G.; Crespin, S.; Coszach, R.; Denis, J.; Leleux, P. Fast neutron-induced damage in INTEGRAL n-type HPGe detectors. Nucl. Instrum. Methods Phys. Res. Sect. A Accel. Spectrometers Detect. Assoc. Equip. 1999, 430, 348–362. [Google Scholar] [CrossRef]
  46. GenieTM Spectroscopy Software Suite, Version 4.0; Mirion Technologies: Atlanta, GA, USA, 2023. Available online: https://www.mirion.com/products/technologies/spectroscopy-scientific-analysis/gamma-spectroscopy/gamma-spectroscopy-software/lab-applications/genie-spectroscopy-software-suite(accessed on 21 December 2023).
  47. Zaitseva, N.; Glenn, A.; Carman, L.; Martinez, H.P.; Hatarik, R.; Klapper, H.; Payne, S. Scintillation properties of solution-grown trans-stilbene single crystals. Nucl. Instrum. Methods Phys. Res. Sect. A Accel. Spectrometers Detect. Assoc. Equip. 2015, 789, 8–15. [Google Scholar] [CrossRef]
  48. Beaumont, J.S.; Mellor, M.P.; Villa, M.; Joyce, M.J. High-intensity power-resolved radiation imaging of an operational nuclear reactor. Nat. Commun. 2015, 6, 8592. [Google Scholar] [CrossRef]
  49. Lopez, R.; Steinberger, W.; Giha, N.; Marleau, P.; Clarke, S.; Pozzi, S. Neutron and gamma imaging using an organic glass scintillator handheld dual particle imager. Nucl. Instrum. Methods Phys. Res. Sect. A Accel. Spectrometers Detect. Assoc. Equip. 2022, 1042, 167407. [Google Scholar] [CrossRef]
  50. Pakari, O.; Lopez, R.; Druckman, I.; Meng, E.; Zhou, E.; Wang, Z.; Clarke, S.D.; Pozzi, S.A. Real-time mixed reality display of dual particle radiation detector data. Sci. Rep. 2023, 13, 362. [Google Scholar] [CrossRef]
  51. Carlson, J.S.; Marleau, P.; Zarkesh, R.A.; Feng, P.L. Taking Advantage of Disorder: Small-Molecule Organic Glasses for Radiation Detection and Particle Discrimination. J. Am. Chem. Soc. 2017, 139, 9621–9626. [Google Scholar] [CrossRef] [PubMed]
  52. Giha, N.P.; Steinberger, W.M.; Nguyen, L.Q.; Carlson, J.S.; Feng, P.L.; Clarke, S.D.; Pozzi, S.A. Organic glass scintillator bars with dual-ended readout. Nucl. Instrum. Methods Phys. Res. Sect. A Accel. Spectrometers Detect. Assoc. Equip. 2021, 1014, 165676. [Google Scholar] [CrossRef]
  53. Blueshift Optics. Organic Glass Scintillator Product. Available online: https://blueshiftoptics.com/org-glass-scintillator (accessed on 21 December 2023).
  54. Clark, L.M.; Maurer, T.E.; Marin, S.; Giha, N.P.; Clarke, S.D.; Pozzi, S.A. Time and Energy Resolution of Organic Glass Scintillators for Radionuclide Monitoring. In Proceedings of the 2021 IEEE Nuclear Science Symposium and Medical Imaging Conference (NSS/MIC), Virtual, 16–23 October 2021; pp. 1–4. [Google Scholar]
  55. Helmer, R.; Heath, R.; Putnam, M.; Gipson, D. Photopeak analysis program for photon energy and intensity determinations: Ge (Li) and NaI (Tl) spectrometers. Nucl. Instrum. Methods 1967, 57, 46–57. [Google Scholar] [CrossRef]
  56. Routti, J.T.; Prussin, S.G. Photopeak method for the computer analysis of gamma-ray spectra from semiconductor detectors. Nucl. Instrum. Methods 1969, 72, 125–142. [Google Scholar] [CrossRef]
  57. Virtanen, P.; Gommers, R.; Oliphant, T.E.; Haberland, M.; Reddy, T.; Cournapeau, D.; Burovski, E.; Peterson, P.; Weckesser, W.; Bright, J.; et al. SciPy 1.0: Fundamental algorithms for scientific computing in Python. Nat. Methods 2020, 17, 261–272. [Google Scholar] [CrossRef] [PubMed]
  58. Harris, C.R.; Millman, K.J.; van der Walt, S.J.; Gommers, R.; Virtanen, P.; Cournapeau, D.; Wieser, E.; Taylor, J.; Berg, S.; Smith, N.J.; et al. Array programming with NumPy. Nature 2020, 585, 357–362. [Google Scholar] [CrossRef] [PubMed]
  59. Knoll, G.F. Radiation Detection and Measurement; Wiley: New York, NY, USA, 1989. Available online: https://nla.gov.au/nla.cat-vn179294 (accessed on 21 December 2023).
  60. Norsworthy, M.A.; Poitrasson-Rivière, A.; Ruch, M.L.; Clarke, S.D.; Pozzi, S.A. Evaluation of neutron light output response functions in EJ-309 organic scintillators. Nucl. Instrum. Methods Phys. Res. Sect. A Accel. Spectrometers Detect. Assoc. Equip. 2017, 842, 20–27. [Google Scholar] [CrossRef]
  61. Clark, D. U235: A Gamma ray Analysis Code for Uranium Isotopic Determination; Technical Report; USDOE: Washington, DC, USA, 1997. [Google Scholar] [CrossRef]
  62. Saraf, B. Energy Levels of Rh 103 from the Decay of Pd 103 and Ru 103. Phys. Rev. 1955, 97, 715. [Google Scholar] [CrossRef]
  63. Firestone, R.B.; Shirley, V.S.; Baglin, C.M.; Chu, S.Y.; Zipkin, J. The 8th Edition of the Table of Isotopes; Wiley: New York, NY, USA, 1997. [Google Scholar]
  64. Lin, C.; Chao, J. Chapter 17—Radiochemistry of Iodine: Relevance to Health and Disease. In Comprehensive Handbook of Iodine; Preedy, V.R., Burrow, G.N., Watson, R., Eds.; Academic Press: San Diego, CA, USA, 2009; pp. 171–182. [Google Scholar] [CrossRef]
  65. Mukhopadhyay, S. MSIPP-NSSTC Course on Gamma ray Spectroscopy—Part IV; Technical Report; USDOE National Nuclear Security Administration (NNSA), Office of Defense Programs (DP): Washington, DC, USA, 2023. [Google Scholar]
  66. Blachot, J. Nuclear Data Sheets for A = 117. Nucl. Data Sheets 2002, 95, 679–836. [Google Scholar] [CrossRef]
  67. Fasching, J.L.; Walters, W.B.; Coryell, C.D. Decay of 284-Day 144Ce, 17.3-min 144Pr, and a New Isomer, 7.2-min 144mPr. Phys. Rev. C 1970, 1, 1126–1131. [Google Scholar] [CrossRef]
  68. Bé, M.M.; Chisté, V.; Dulieu, C.; Kellett, M.; Mougeot, X.; Arinc, A.; Chechev, V.; Kuzmenko, N.; Kibédi, T.; Luca, A.; et al. Table of Radionuclides; Monographie BIPM-5; Bureau International des Poids et Mesures: Saint-Cloud, France, 2016; Volume 8. [Google Scholar]
  69. Henry, E. Nuclear data sheets for A = 135. Nucl. Data Sheets 1975, 14, 191–245. [Google Scholar] [CrossRef]
  70. Adams, J.; Carboneau, M. National Low-Level Waste Management Program Radionuclide Report Series—Volume 2, Niobium-94; Technical Report; Lockheed Idaho Technologies Co.: Idaho Falls, ID, USA, 1995. [Google Scholar]
  71. Boggs, J.V. Gamma-ray Spectra of Fission Products from U235 as a Function of Time after Fission. Ph.D Thesis, The University of Oklahoma, Norman, OK, USA, 1966. [Google Scholar]
  72. Zheltonozhskaya, M.; Zheltonozhsky, V.; Lykova, E.; Chernyaev, A.; Iatsenko, V. Production of Zirconium-89 by photonuclear reactions. Nucl. Instrum. Methods Phys. Res. Sect. B Accel. Spectrometers Detect. Assoc. Equip. 2020, 470, 38–41. [Google Scholar] [CrossRef]
  73. Kaur, R.; Sharma, A.K.; Sooch, S.S.; Trehan, P.N. Level Structure of 140Ce from the Decay of 140La. J. Phys. Soc. Jpn. 1980, 49, 2122–2128. [Google Scholar] [CrossRef]
  74. Yücel, H.; Çetiner, M.; Demirel, H. Use of the 1001 keV peak of 234 mPa daughter of 238U in measurement of uranium concentration by HPGe gamma-ray spectrometry. Nucl. Instrum. Methods Phys. Res. Sect. A Accel. Spectrometers Detect. Assoc. Equip. 1998, 413, 74–82. [Google Scholar] [CrossRef]
  75. IAEA. Database of Prompt Gamma rays from Slow Neutron Capture for Elemental Analysis; Non-serial Publications; International Atomic Energy Agency: Vienna, Austria, 2007. [Google Scholar]
  76. United States Environmental Protection Agency. High Resolution Gamma-ray Spectrometry Analyses for Normal Operations and Radiological Incident Response; United States Environmental Protection Agency: Washington, DC, USA, 2019. [Google Scholar]
  77. Schmidt, H.H.; Hungerford, P.; Daniel, H.; von Egidy, T.; Kerr, S.A.; Brissot, R.; Barreau, G.; Börner, H.G.; Hofmeyr, C.; Lieb, K.P. Levels and gamma energies of 28Al studied by thermal neutron capture. Phys. Rev. C 1982, 25, 2888–2901. [Google Scholar] [CrossRef]
  78. Gatera, A.; Göök, A.; Hambsch, F.J.; Moens, A.; Oberstedt, A.; Oberstedt, S.; Sibbens, G.; Vanleeuw, D.; Vidali, M. Prompt fissionγ-ray characteristics from neutron-induced fission on 239Pu and the time-dependence of prompt-γray emission. EPJ Web Conf. 2018, 169, 00003. [Google Scholar] [CrossRef]
  79. Nattress, J.; Jovanovic, I. Response and calibration of organic scintillators for gamma-ray spectroscopy up to 15-MeV range. Nucl. Instrum. Methods Phys. Res. Sect. A Accel. Spectrometers Detect. Assoc. Equip. 2017, 871, 1–7. [Google Scholar] [CrossRef]
  80. Crouch, E. Fission-product yields from neutron-induced fission. At. Data Nucl. Data Tables 1977, 19, 417–532. [Google Scholar] [CrossRef]
  81. Ranjbar, L.; Farsoni, A.T.; Becker, E.M. 135Xe measurements with a two-element CZT-based radioxenon detector for nuclear explosion monitoring. J. Environ. Radioact. 2017, 169, 221–228. [Google Scholar] [CrossRef]
  82. Stacey, W.M. Nuclear Reactor Physics; John Wiley & Sons: Hoboken, NJ, USA, 2018. [Google Scholar]
  83. Hayes, A.; Jungman, G. Determining reactor flux from xenon-136 and cesium-135 in spent fuel. Nucl. Instrum. Methods Phys. Res. Sect. A Accel. Spectrometers Detect. Assoc. Equip. 2012, 690, 68–74. [Google Scholar] [CrossRef]
  84. Radulović, V.; Rupnik, S.; Naish, J.; Bradnam, S.; Ghani, Z.; Popovichev, S.; Kiptily, V.; Batistoni, P.; Villari, R.; Snoj, L. Preparation of a water activation experiment at JET to support ITER. Fusion Eng. Des. 2021, 169, 112410. [Google Scholar] [CrossRef]
  85. Lawrence, C.C.; Febbraro, M.; Flaska, M.; Pozzi, S.A.; Becchetti, F. Warhead verification as inverse problem: Applications of neutron spectrum unfolding from organic-scintillator measurements. J. Appl. Phys. 2016, 120, 064501. [Google Scholar] [CrossRef]
  86. Beyer, K.A.; Di Fulvio, A.; Stolarczyk, L.; Parol, W.; Mojżeszek, N.; Kopéc, R.; Clarke, S.D.; Pozzi, S.A. Organic Scintillator for Real-Time Neutron Dosimetry. Radiat. Prot. Dosim. 2017, 180, 355–359. [Google Scholar] [CrossRef] [PubMed]
  87. Darby, F.; Pakari, O.; Hua, M.; Lamirand, V.; Clarke, S.; Pautz, A.; Pozzi, S. Investigation of organic scintillators for neutron-gamma noise measurements in a zero power reactor. In Proceedings of the ANIMMA 2023 Conference, Lucca, Italy, 12–16 June 2023. [Google Scholar]
  88. Darby, F.B.; Pakari, O.V.; Hua, M.Y.; Lamirand, V.; Clarke, S.D.; Pautz, A.; Pozzi, S.A. Neutron-gamma noise measurements in a zero-power reactor using organic scintillators. IEEE Trans. Nucl. Sci. 2023. early access. [Google Scholar] [CrossRef]
  89. Poitrasson-Rivière, A.; Hamel, M.C.; Polack, J.K.; Flaska, M.; Clarke, S.D.; Pozzi, S.A. Dual-particle imaging system based on simultaneous detection of photon and neutron collision events. Nucl. Instrum. Methods Phys. Res. Sect. A Accel. Spectrometers Detect. Assoc. Equip. 2014, 760, 40–45. [Google Scholar] [CrossRef]
  90. Weber, H.; Böck, H.; Unfried, E.; Greenwood, L. Neutron dosimetry and damage calculations for the TRIGA Mark-II reactor in Vienna. J. Nucl. Mater. 1986, 137, 236–240. [Google Scholar] [CrossRef]
Figure 1. Schematic of the reactor internals of CROCUS.
Jne 05 00003 g001
Figure 2. The (a) centerline vertical cut through the CROCUS reactor CAD model, showing the reactor internals and a water level corresponding to an operational state; and (b) horizontal slice of the CROCUS reactor vessel at mid-core height. The CeBr3 detector was set into the vacant control rod tube. The operational power monitors are fission chambers (FCs) and compensated ionization chambers (CICs).
Jne 05 00003 g002
Figure 3. (A) Top–down view of OSURR from Pool Top with various irradiation facilities labeled. The fast neutron beam was used in this work; and (B) Centerline vertical cut through of the fast neutron beam collimator CAD model.
Jne 05 00003 g003
Figure 4. Experimental setup at the OSURR: (a) General scheme of the detection setup; (b) Picture of the experimental setup with a view of the open imaging station with a closed fast neutron beam port; and (c) Picture of the placement of the 2 in stilbene detector in front of the (closed) beam port.
Jne 05 00003 g004
Figure 5. Schematic view from above the HPGe placement in front of the experimental channel (concrete shield penetration) in CROCUS.
Jne 05 00003 g005
Figure 6. The calibration of the (a) HPGe spectrum from CROCUS using the 185 keV 235U, 511 keV annihilation, 662 keV 137Cs, 816 keV 140La, 1001 keV 238U, and 1596 keV 140La photopeaks; and (b) the linear regression of the photopeaks’ values (in ADC channels) and their known energies (in keV). For (a), the bin width was 1 ADC. The error bars are too small to appear visible in (b).
Jne 05 00003 g006
Figure 7. Energy calibration of OGS using a 137Cs Source. We identify the local maximum in the spectrum (around 450 keV), find the corresponding counts value (around 600), take 80% of that count value [60], then match that value via interpolation at a higher light output than that of the local maximum. The bin width was 13.1 keV.
Jne 05 00003 g007
Figure 8. Gamma-ray spectrum acquired with an HPGe detector in CROCUS immediately after shutdown (a) from 50 to 537 keV and (b) from 608 to 1779 keV. The corresponding identified photopeak characteristics are listed in Table 1. The bin width is 0.2 keV.
Jne 05 00003 g008
Figure 9. CeBr3 spectra acquired from CROCUS and the OSURR, along with the HPGe spectrum acquired in CROCUS for reference, highlighting the presence of peak summing in both CeBr3 spectra. The red, green and blue colors indicate regions which appear as summed peaks in the CeBr3. To account for varying measurement times and counts, each spectrum was normalized by its maximum count value. The bin width for the CROCUS spectra are both 0.2 keV, and the bin width for the OSURR spectrum is 6.8 keV.
Jne 05 00003 g009
Figure 10. Two spectra recorded in CROCUS using CeBr3 (a) and HPGe (b) detectors, respectively. Both plots show that our detectors receive much greater count rates at power than at shutdown. The bin width for the HPGe spectra are both 0.2 keV, and the bin width for the CeBr3 spectra are both 6.2 keV.
Jne 05 00003 g010
Figure 11. CeBr3 pulse height spectrum (black) versus OGS and stilbene detectors in red and blue, respectively. These measurements were performed at 10 W power in the OSURR. The summed photopeaks at 965 keV and 1596 keV correspond to the summed Compton edges at 763 keV and 1376 keV, respectively. The bin width for the CeBr3, stilbene, and OGS spectra are 6.2 keV, 3.1 keV, and 3.1 keV, respectively.
Jne 05 00003 g011
Figure 12. Pulse height spectra for a 1 in OGS detector measured in the OSURR neutron beam at 10 W reactor power (black). After applying PSD, we find the neutron-induced spectrum (blue) and the gamma-ray-induced spectrum (red). We also include summed CEs inferred from the CeBr3 data.
Jne 05 00003 g012
Figure 13. (left): Pulse shape discrimination plot for the 6 mm stilbene cube measured in the OSURR neutron beam at 1 kW reactor power. (right): Pulse-shape discrimination plot for the 2 in stilbene cylinder measured in the OSURR neutron beam at 10 W reactor power. Pulses are plotted in a 2D histogram based on their tail to total integral ratios and the total light output. The histograms are colored based on the identified particle type (gamma ray or fast neutron).
Jne 05 00003 g013
Figure 14. (left): Pulse shape discrimination plot for the 1 in OGS measured in the OSURR neutron beam at 10 W reactor power. (right): Pulse shape discrimination plot for the 6 mm OGS measured in the OSURR neutron beam at 1 kW reactor power.
Jne 05 00003 g014
Table 1. The photopeak identifications for the HPGe spectrum in Figure 8.
Energy
(keV)
EmitterHalf-Life
(Hours)
ReferencesEnergy
(keV)
EmitterHalf-Life
(Hours)
References
50238U3.94 × 1013[61]610103Ru9.43 × 102[62,63]
93Th k α 1 n/a[61]630132I2.30 × 100[63,64]
95U k α 2 n/a[61]662137Cs2.62 × 105[63,65]
98U k α 1 n/a[61]668132I2.30 × 100[63,64]
109235U6.13 × 1012[61]720117Te1.03 × 100[63,66]
134144Ce6.84 × 103[67]72495Zr1.56 × 103[65,68]
143235U6.13 × 1012[61]75795Zr1.56 × 103[65,68]
163235U6.13 × 1012[61]76695Nb8.40 × 102[63,68]
185235U6.13 × 1012[61,65]773132I2.30 × 100[64]
202235U6.13 × 1012[61]816140La4.00 × 101[63,68]
205235U6.13 × 1012[61,65]847134I8.75 × 10−1[63,64]
221135La1.95 × 101[63,69]87194Nb1.75 × 108[63,70]
270137Xe6.66 × 10−2[71]884134I8.75 × 10−1[63,64]
284131I1.92 × 102[63,65]90989Zr7.84 × 101[63,72]
288135Xe9.10 × 100[69]925140La4.00 × 101[63,73]
329140La4.01 × 101[65,68]955132I2.30 × 100[63,64]
364131I1.92 × 102[65]1001238U3.94 × 1013[74]
487140La4.00 × 101[65,68]1073134I8.75 × 10−1[63,64]
497103Ru9.43 × 102[62,65]1132135I1.92 × 102[63,64]
511Annihilationn/a[75]120591Y1.39 × 103[63,65]
523132I2.30 × 100[64]1260135I6.60 × 100[63,64]
526135mXe6.60 × 100[63,76]1596140La4.00 × 101[63,65]
537140Ba3.07 × 102[65,68]177927Al(n, γ )3.83 × 10⁻²[77]
Disclaimer/Publisher’s Note: The statements, opinions and data contained in all publications are solely those of the individual author(s) and contributor(s) and not of MDPI and/or the editor(s). MDPI and/or the editor(s) disclaim responsibility for any injury to people or property resulting from any ideas, methods, instructions or products referred to in the content.

