Article

Effects of Neutron Flux Distribution and Control Rod Shadowing on Control Rod Calibrations in the Oregon State TRIGA® Reactor

School of Nuclear Science and Engineering, Oregon State University, Corvallis, OR 97331, USA
*
Author to whom correspondence should be addressed.
J. Nucl. Eng. 2024, 5(1), 13-25; https://doi.org/10.3390/jne5010002
Submission received: 2 November 2023 / Revised: 5 December 2023 / Accepted: 19 December 2023 / Published: 3 January 2024

Abstract

:
Control rod calibration experiment results for the Oregon State TRIGA® Reactor (OSTR) immediately following LEU conversion in 2008, and MCNP® 5 predicted rod worths from the 2008 LEU Conversion Safety Analysis Report (CSAR) are discussed. The reactivity worth of the four OSTR control rods is measured using the rod-pull method. Reactor power and period measurements in this method rely on the fission chamber power detector on the north side of the reflector. It is proposed that the location of the fission chamber and the neutron flux distribution in the core may result in an inaccurate reactor period measurement due to the asymmetry of the neutron flux distribution in the OSTR core. The asymmetry of the flux is believed to be more pronounced during super-criticality, resulting in errors in the time-of-power-rise measurements. As a result, control rod calibration experiments may under-predict or over-predict the reactivity worth of certain control rods. A time-independent Monte–Carlo method for the quantification of these effects is presented. Thermal flux maps at the core axial mid-plane are obtained from the model to inform discrepancies between predicted and observed results.

1. Introduction

Oregon State University (OSU) houses a 1.1 MWth Training, Research, Isotope Production General Atomics (TRIGA®) Mk. II reactor built by General Atomics in 1967. The Oregon State University TRIGA® reactor (OSTR) underwent conversion from high-enriched uranium (HEU) to low-enriched uranium (LEU) fuel in 2008 as part of the U.S. Reduced Enrichment for Research and Test Reactors Program (RERTR) [1]. After the reloading of the core was completed and initial criticality was achieved, control rod reactivity worth measurements (i.e., control rod calibrations), were carried out on two core configurations in October 2008 [2]. The procedure for measuring control rod reactivity worth at OSTR is performed at low power (<1 kW) to negate the effects of the strong, prompt negative temperature coefficient of reactivity of the UZrH fuel [3]. At these low power levels, only one power detector, a fission chamber, can be used to measure reactor power. This detector is located on the north side of the reflector. It is believed that the location of the fission chamber, the changes in the neutron flux distribution, and the asymmetry of the neutron flux profile of OSTR between rod pulls, influence the detector response and the resulting measured control rod worth. OSTR has three fuel-followed control rods (the safety, shim, and regulating rods) and one air-followed transient rod. The measured integrated reactivity worth of the shim rod and the regulating rod disagreed with the MCNP® 5 calculated integrated reactivity worth of the shim and regulating rods in 2008 [4]. It is proposed that control rod shadowing in OSTR induces a neutron flux distribution shift that changes the flux incident on the fission chamber and contributes to the disagreement between calculated and measured reactivity worths.
Control rod shadowing effects and the effects of flux distribution shifts on detector responses are generally understood by the research reactor community. Snoj and Barbot presented a thorough analysis of flux distribution shifts in the JSI TRIGA in their 2015 work and how these shifts affect detector responses [5]. Herein we evaluate the effects of these phenomena on the license conditions and reactivity worth of the OSTR control rods under normal and off-normal neutron flux distributions.

2. Materials and Methods

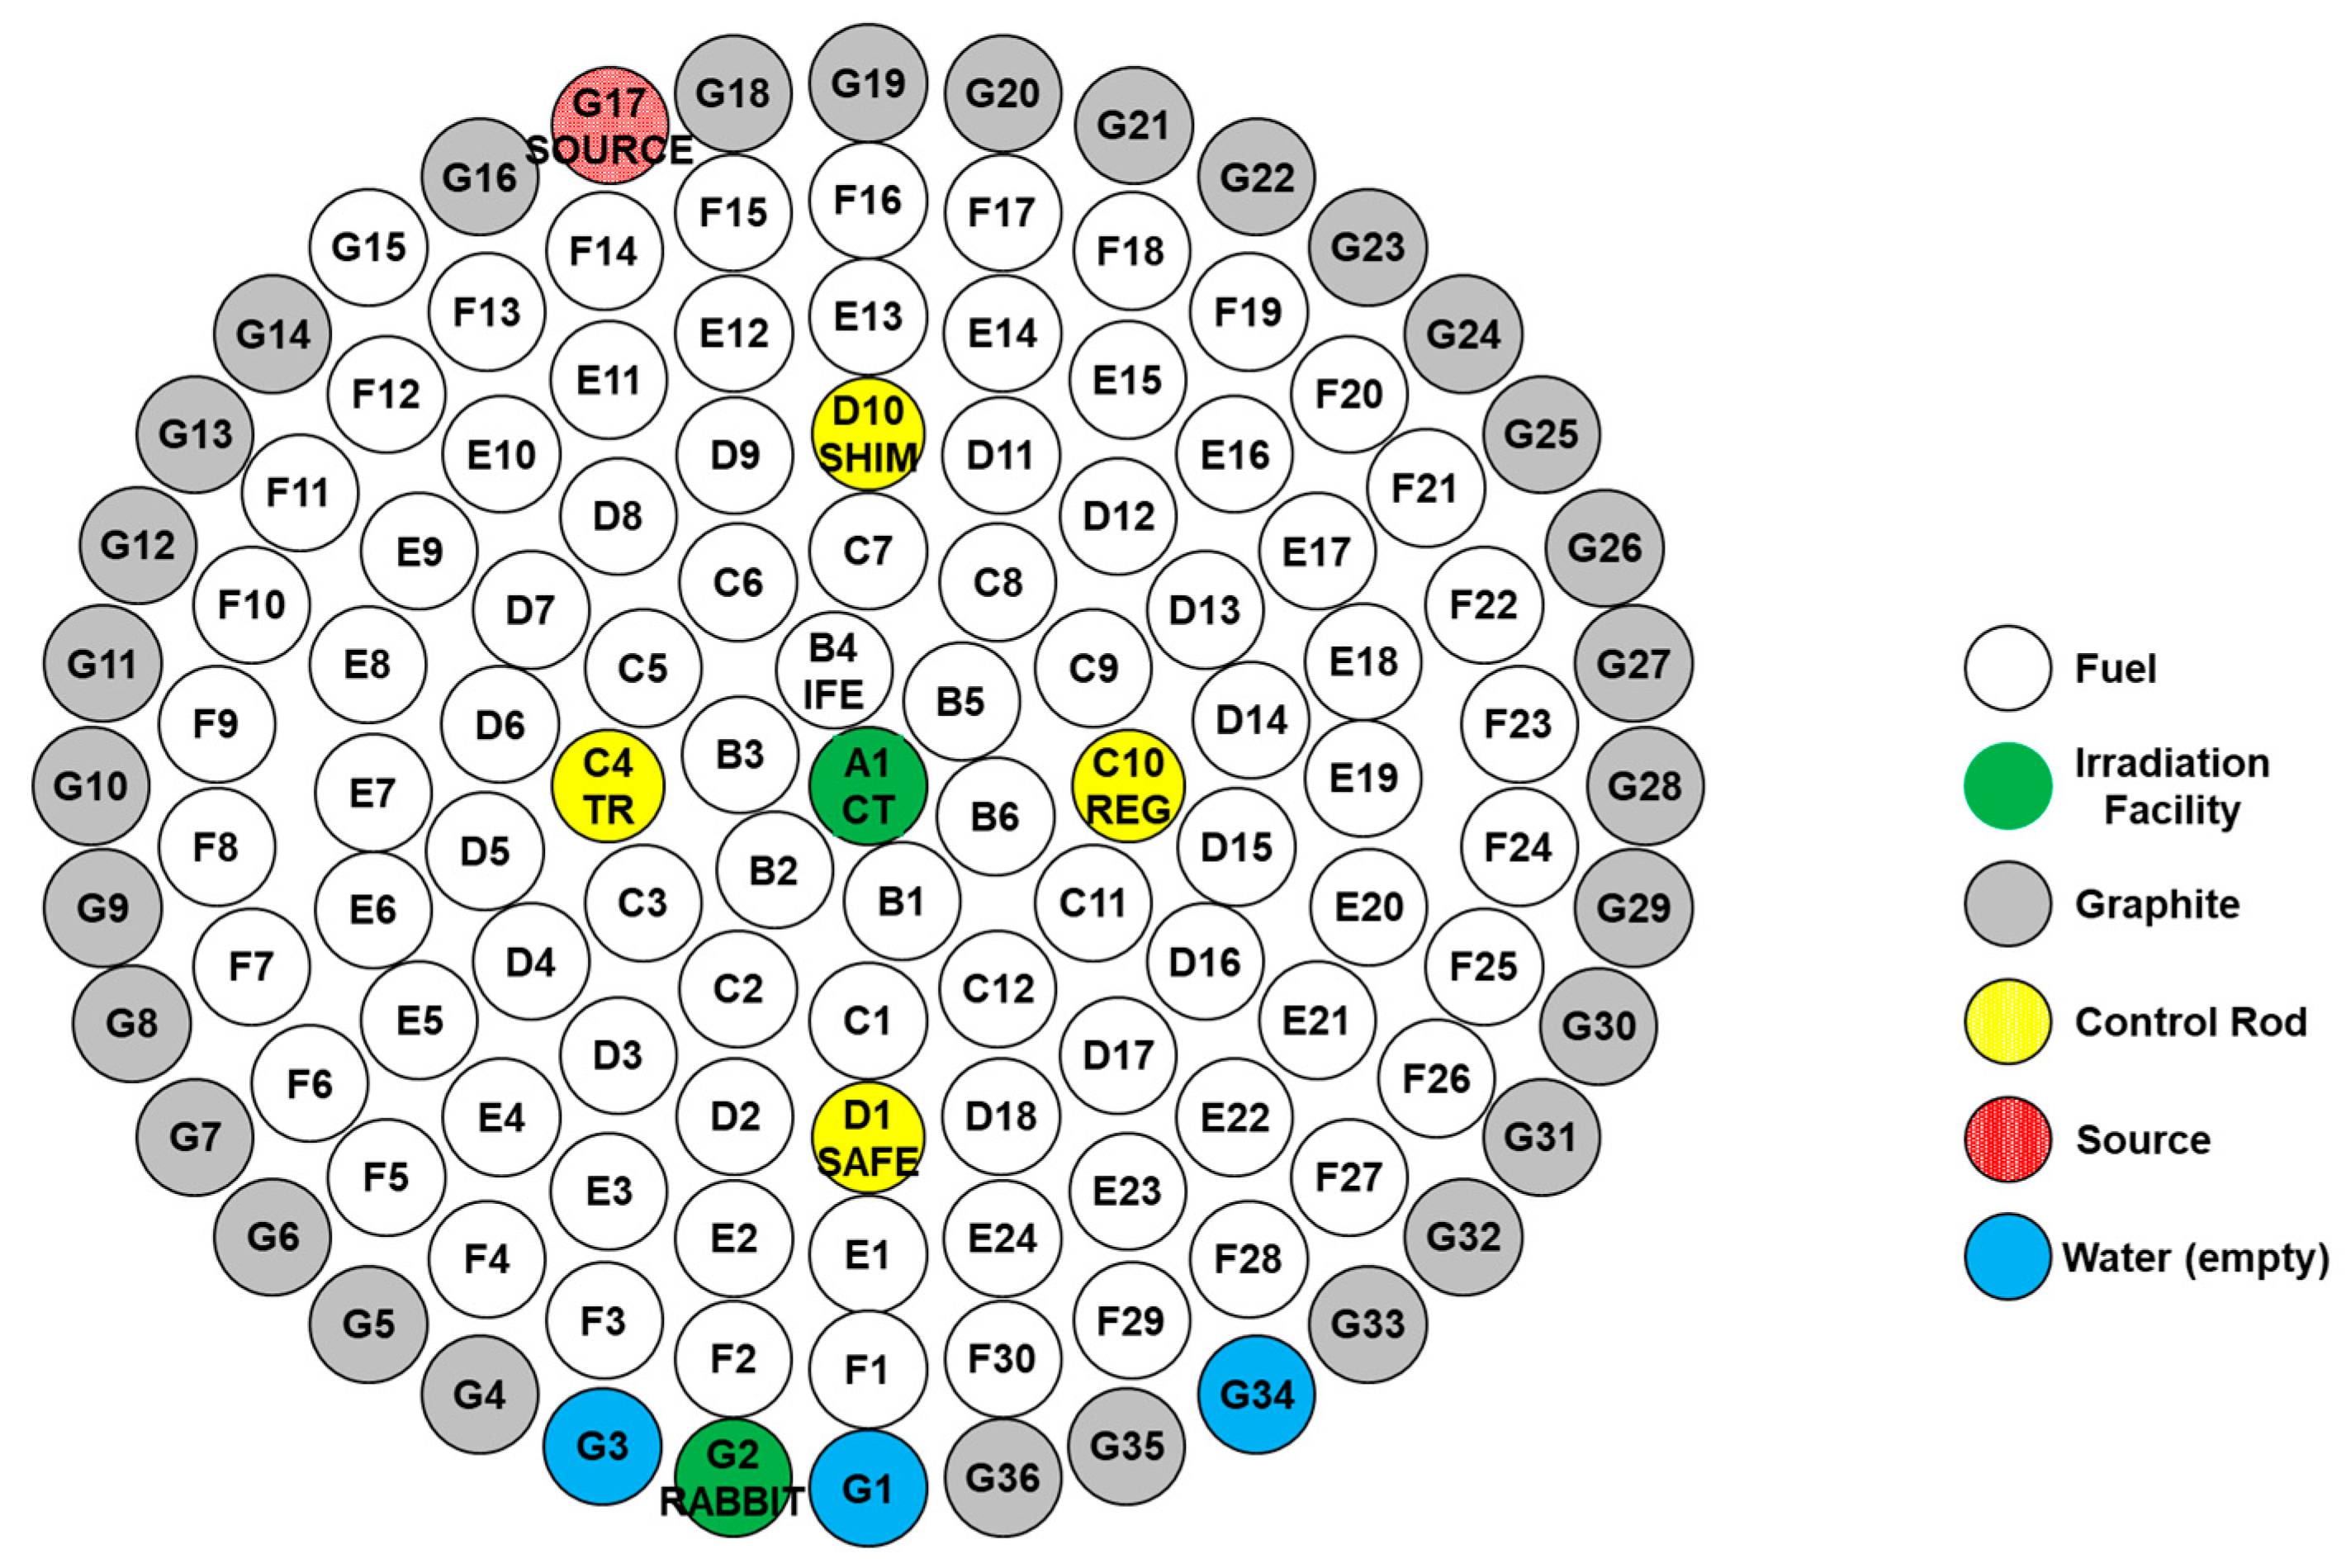
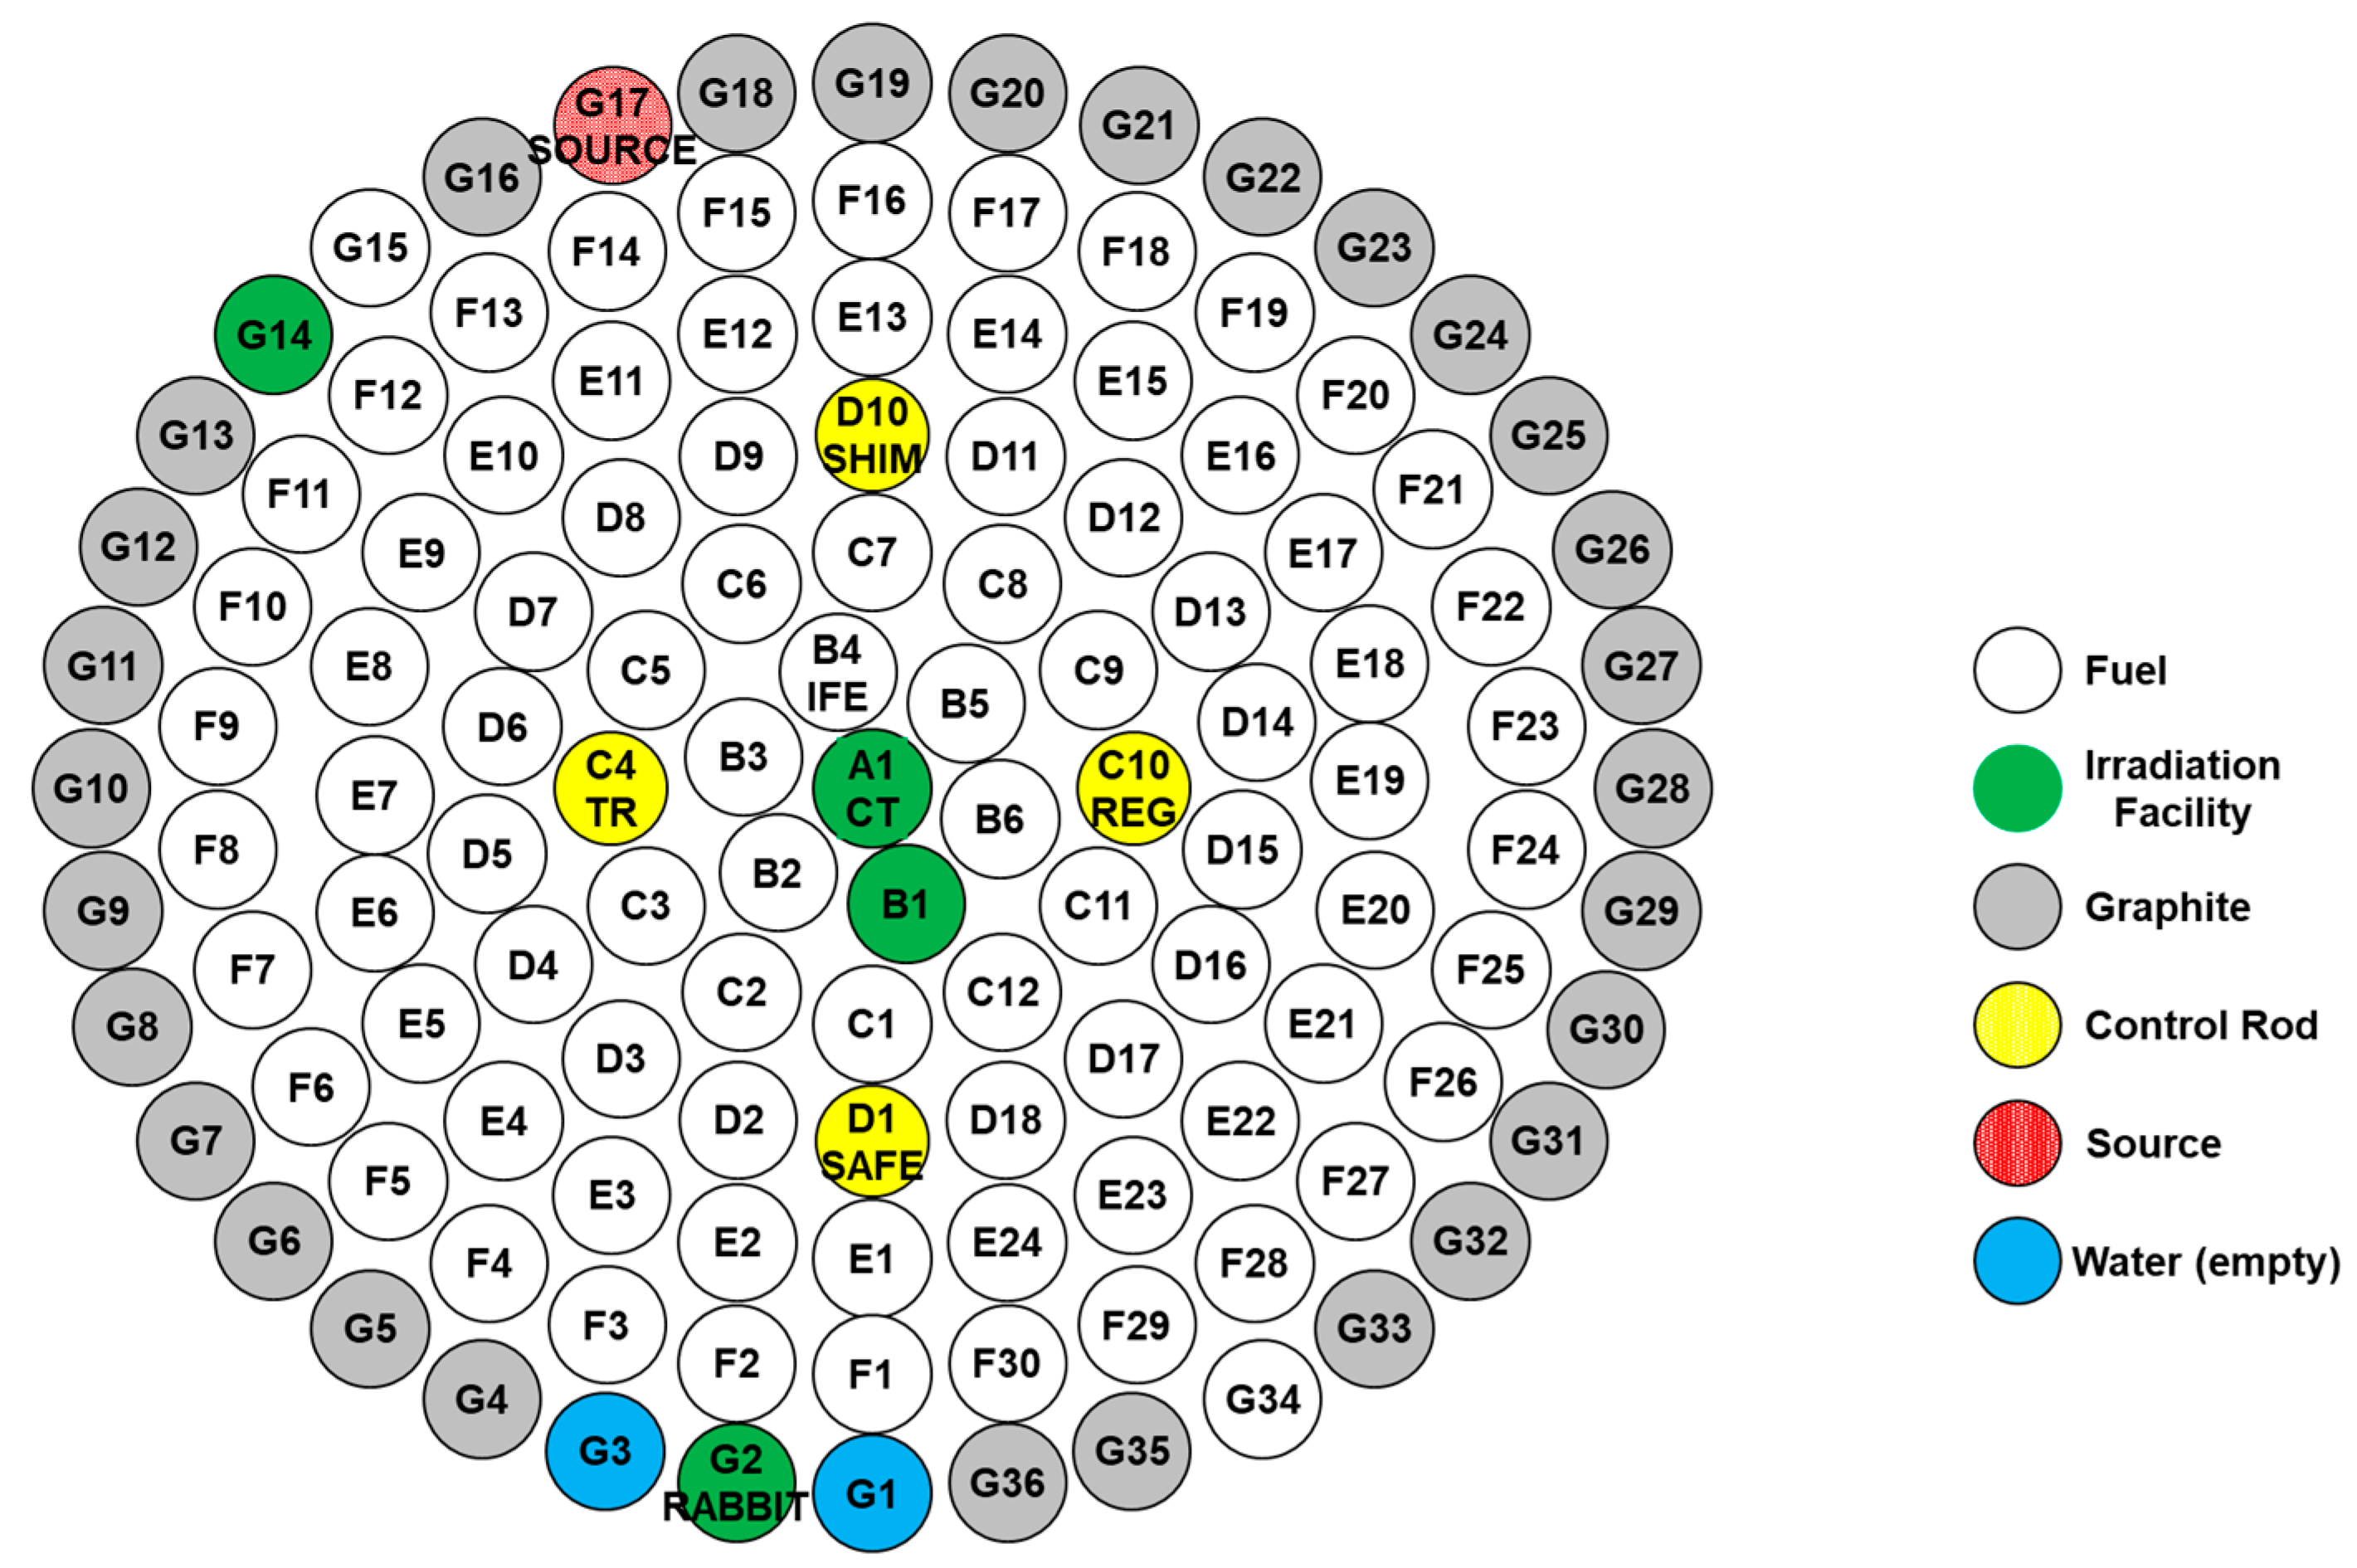
2.1. OSTR Core Configurations Post-LEU Conversion

The core configuration of OSTR as it was at the time of the first control rod calibrations after LEU conversion in 2008 is the configuration of interest in this work. This is because the OSTR MCNP® model was validated in this work against the total control rod-worth data for the fresh LEU fuel. After LEU conversion in 2008, OSTR had three different core configurations known as the normal, cadmium-lined in-core irradiation tube (CLICIT), and in-core irradiation tube (ICIT) configurations. In the CLICIT or ICIT configurations, a fuel element occupying a grid position near the center of the core is removed and replaces a graphite element in a grid position at the core periphery, and either a cadmium-lined or unlined aluminum sample irradiation tube is placed in the grid position near the center of the core [1]. The control rod calibrations following the LEU conversion in 2008 were performed in the normal and CLICIT configurations [2]. Therefore, the MCNP® models used in this work reflect the normal and CLICIT configurations as they were in October of 2008 and are shown below in Figure 1 and Figure 2.

2.2. Control Rod Calibrations at OSTR

Control rod calibrations at OSTR are carried out using the positive period or “rod-pull” method. In the rod-pull method, the reactivity worth of a segment of a control rod is determined by withdrawing the rod being calibrated to induce a power rise. To begin with, the OSTR is initially brought critical by withdrawing three of the control rods to a banked critical height with the rod that is to be measured remaining fully inserted. The reactor power is held constant at a low power level of approximately 10 W [2,3]. A low-power level is required to ensure there are no temperature effects as the OSTR has a strong negative temperature coefficient of reactivity [3,6]. The control rod being measured is then withdrawn some distance to induce a positive reactor period between 6 and 15 s. A timer connected to the control console receives a signal from the linear power channel and measures the time of voltage rise from 2 V to 8 V, which corresponds to a power rise from 200 to 800 W when the linear range switch is in the 1 kW position [3].
These power levels of 200 and 800 W were chosen to ensure the reactor period was as constant as possible. Previous experience over the operating life of OSTR has shown that the reactor period is constant and asymptotic flux rise is achieved before 200 W for a reactor period of approximately 6 s. The reactor operator then manually SCRAMs one of the other three control rods after passing 800 W to bring the reactor subcritical. The initial and final heights of the control rods and the time of power rise from 200 to 800 W in milliseconds are recorded. The control rod being measured is left at its previous height and the reactor is brought back to critical at approximately 10 W by re-banking the other three control rods. This process is repeated until the control rod being measured is completely withdrawn. The reactivity insertion associated with each control rod perturbation can be calculated from the inhour equation where the reactor period term is expressed in terms of the time of power rise from one power to another. The average period during the power rise is calculated from the time of rise, and curves are fitted to the recorded data to determine the differential and integral control rod worths [3]. The reactivity insertion associated with the control rod perturbation can be calculated from the inhour equation using six delayed neutron precursor groups:
ρ β e f f = l * β e f f T + i = 1 6 β i 1 + λ i T  
where ρ is the reactivity insertion, β e f f is the delayed neutron fraction, l * is the prompt neutron lifetime, β i is the delayed neutron fraction and λ i is the decay constant of the of the i t h delayed neutron precursor group, and T is the reactor period. The reactor period is the time for reactor power to increase by a factor of e. The reactor power as a function of time and the reactor period is:
P t = P 0 e t T  
where power at some time t can be expressed as P 2 and initial power as P 1 . Solving for reactor period yields:
T = Δ t ln P 2 P 1  
where Δ t is the time for reactor power to rise from P 1 to P 2 . The reactivity insertion due to a control rod perturbation can then be expressed as:
ρ   $ = l * Δ t ln P 2 P 1 + β e f f i = 1 6 β i 1 + λ i Δ t ln P 2 P 1  
The result is the reactivity insertion can be known from measurable quantities using reactor power detectors and six-group delayed data is taken from Duderstadt and Hamilton [7]. However, this period is measured using only one reactor power detector, the fission chamber, as this is the only detector that indicates low powers. The other two reactor power detectors are uncompensated ion chambers. At powers below 10 kW, the gamma flux incident on the uncompensated ion chambers renders them unusable for measuring reactor power. Additionally, the fission chamber power detector is calibrated using a calorimetric method with the reactor operating steady state at 1 MW. This means that the fission chamber power channel, displaying power as a percent of full power (i.e., 1 MW), is directly proportional to the neutron flux being measured for the given core configuration and control heights used during the calibration process. This dependence upon the neutron flux being measured may result in power readings that are not representative of core-wide power for extreme control rod configurations such as those at the beginning and end of a control rod calibration (where three rods are banked up to a 60% height difference from the rod being calibrated), and during power rises where the rate of power increase is not the same at all locations in the core.

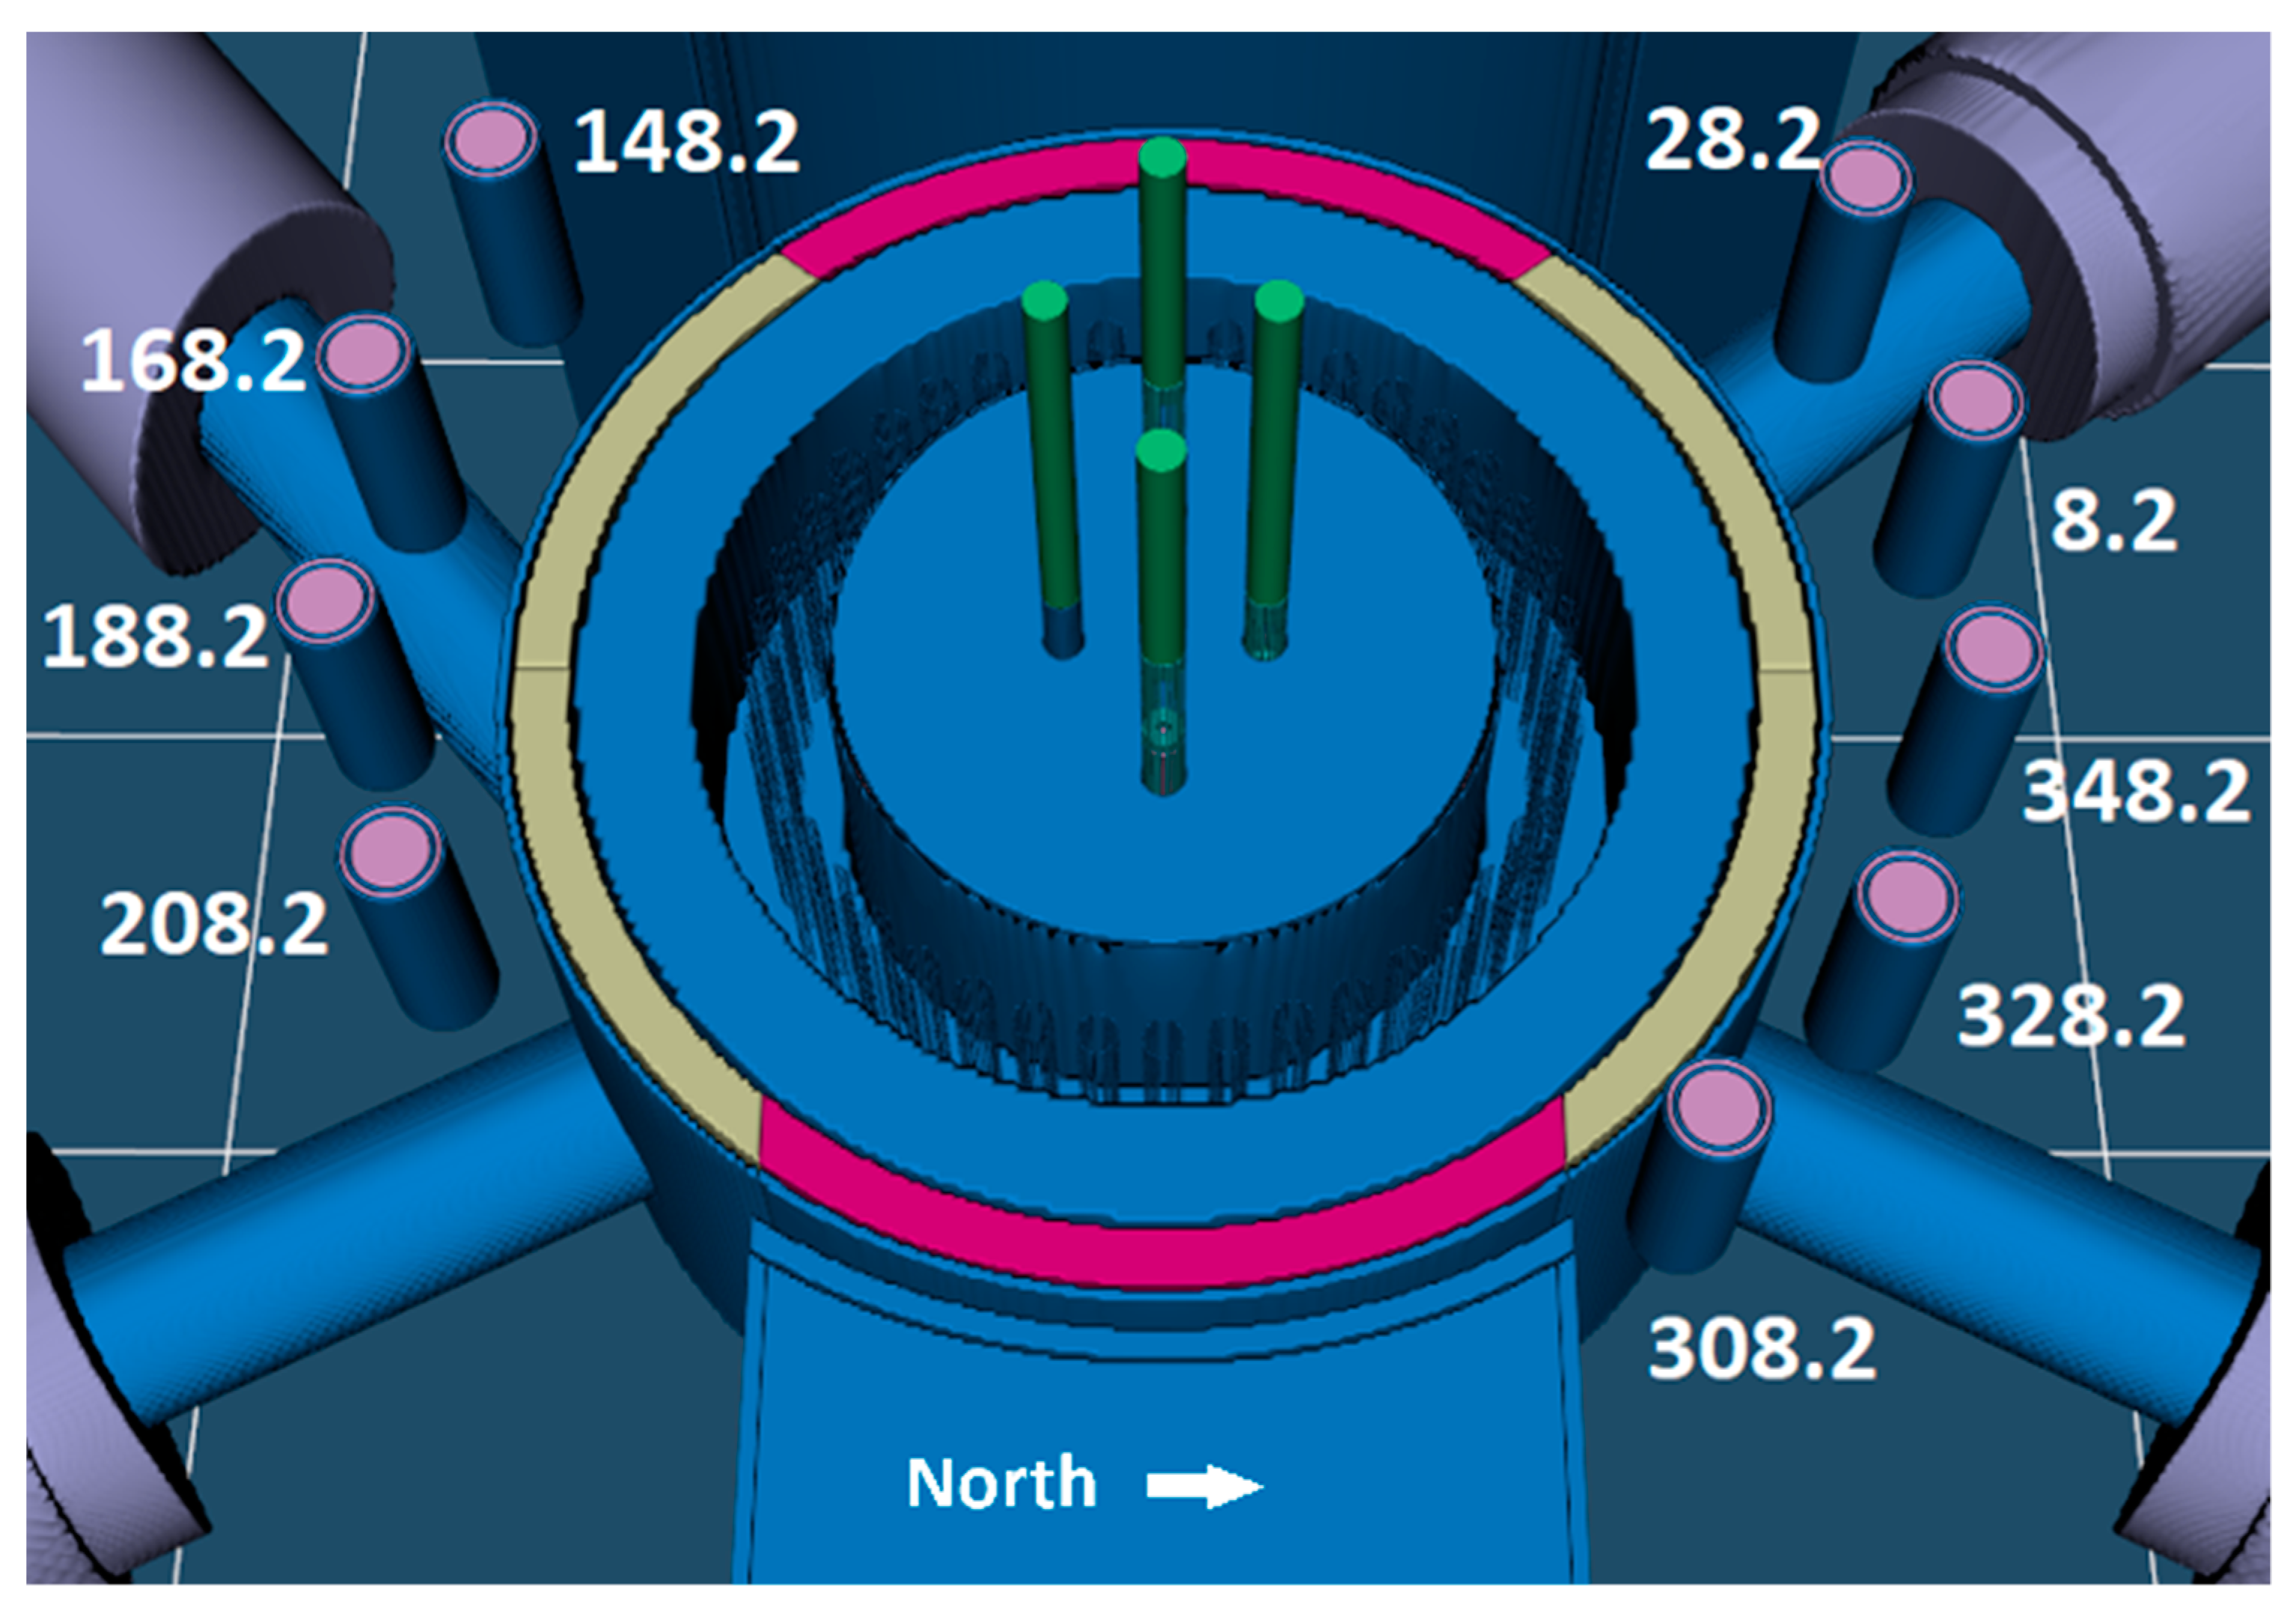
2.3. OSTR Fission Chamber Description

The Reuter–Stokes model number SA-C3-2510-114 fission chamber at OSTR is a cylindrical neutron-sensitive ion chamber that resides in an aluminum housing. The internal sensitive length of the detector consists of a 0.125-inch-thick, 9.25-inch-long aluminum tube substrate that is coated on both its inner and outer surface with UO2 enriched to 93% 235U. There is an argon-filled gap from the inner surface of the housing to the outer surface of the coated substrate and an argon-filled zone within the inner surface of the coated substrate [8]. The quantity of interest for modeling detector response is the fission rate in the UO2 ceramic layers, making the UO2 layers the most important part of the detector to model. The fission rate can easily be tallied in MCNP® and is directly proportional to the ionization rate in the detector at low reactor powers when a pulse height discriminator is used to discriminate between fission fragment ionization events and photon ionization events.

2.4. The OSTR MCNP® Model

An existing MCNP® 6 model of OSTR has been updated and maintained by the facility staff and is the one used in the neutronic analysis in the facility’s final safety analysis report. The model was originally created for an examination of a potential boron neutron capture therapy (BCNT) beam in 1997 but has been updated many times since then [9]. The current model uses ENDF/B-VII.1 Nuclear Data library and includes both geometry and materials improvements made over the years [10]. The model reflects the fresh-fuel CLICIT core configuration as it was post-LEU conversion in 2008. Short-lived neutron poisons such as xenon are not included because control rod calibrations are performed under xenon-free core conditions to negate its effect on core reactivity. The substantive modifications to the OSTR MCNP® model for this work included the addition of nine theoretical fission chambers around the graphite reflector. One chamber was placed at its actual location in the OSTR approximately 348.2° north and eight others were placed at various locations at the same radial distance and height as the actual chamber. The detectors are spaced every 20 degrees except where they would interfere with the thermal or thermalizing columns. A rendering of the fission chamber placement is shown below in Figure 3.

3. Results

3.1. Model Bias Calculations

The MCNP® model of both the normal and CLICIT cores was used to produce models reflecting each critical control rod configuration that the reactor was observed to be critical at before rod pulls were performed during the normal core control rod calibrations of October 2008. A k-code problem was run for each critical configuration to calculate an average model bias or deviation from criticality in the model. This resulted in 26 and 24 keff values to compute the average bias from for the normal and CLICIT cores, respectively. The average calculated model bias for the normal core configuration was −$0.02 ± 0.04, and the average calculated bias for the CLICIT core was $0.07 ± 0.04 where the error is computed from the total variance. Both the normal and CLICIT core model biases are extremely low considering the total observed worth of the 2008 normal and CLICIT cores at the beginning of life were $10.75 and $11.99, respectively [2].

3.2. Measured and Calculated Control Rod Reactivity Worths

The MCNP® model of the normal and CLICIT cores was used to produce models reflecting each supercritical control rod configuration that resulted in a positive reactor period, or rod pulls, that were performed during the control rod calibrations of October 2008. A k-code problem was run for each supercritical configuration to calculate and compare the model-predicted reactivity for each rod pull with the experimental results. The normal and CLICIT core model biases of −$0.02 and $0.07 were subtracted from each calculated reactivity worth of a rod segment. The measured and calculated total integrated reactivity worths for the normal and CLICIT cores are shown below in Table 1.
The total calculated and measured reactivity worths for the CLICIT core agree well but the transient and safety rods tend to be underpredicted and the shim and regulating rods tend to be overpredicted, leading to offsetting errors and may be a result of the cadmium-lined tube being near the transient and safety rods. However, the total calculated and measured reactivity worths for the normal core disagrees by 43 cents with all rods under-predicted. Especially in disagreement are the shim and regulating rods. These two rods were also in disagreement with the MCNP® 5 model of 2008 which prompted an NRC request for additional information (RAI) regarding the accuracy of the control rod calibration process. It was found that the measured control rod reactivity worth has very little uncertainty in this method as it utilizes an electronic timer directly connected to the fission chamber to measure the time it takes power to increase by a factor of four, which is then turned into the period, which is then used to calculated reactivity. The timer has a minimal error (~1%) and the control rod height is measured from 0 to 100% withdrawn with 0.1% resolution.

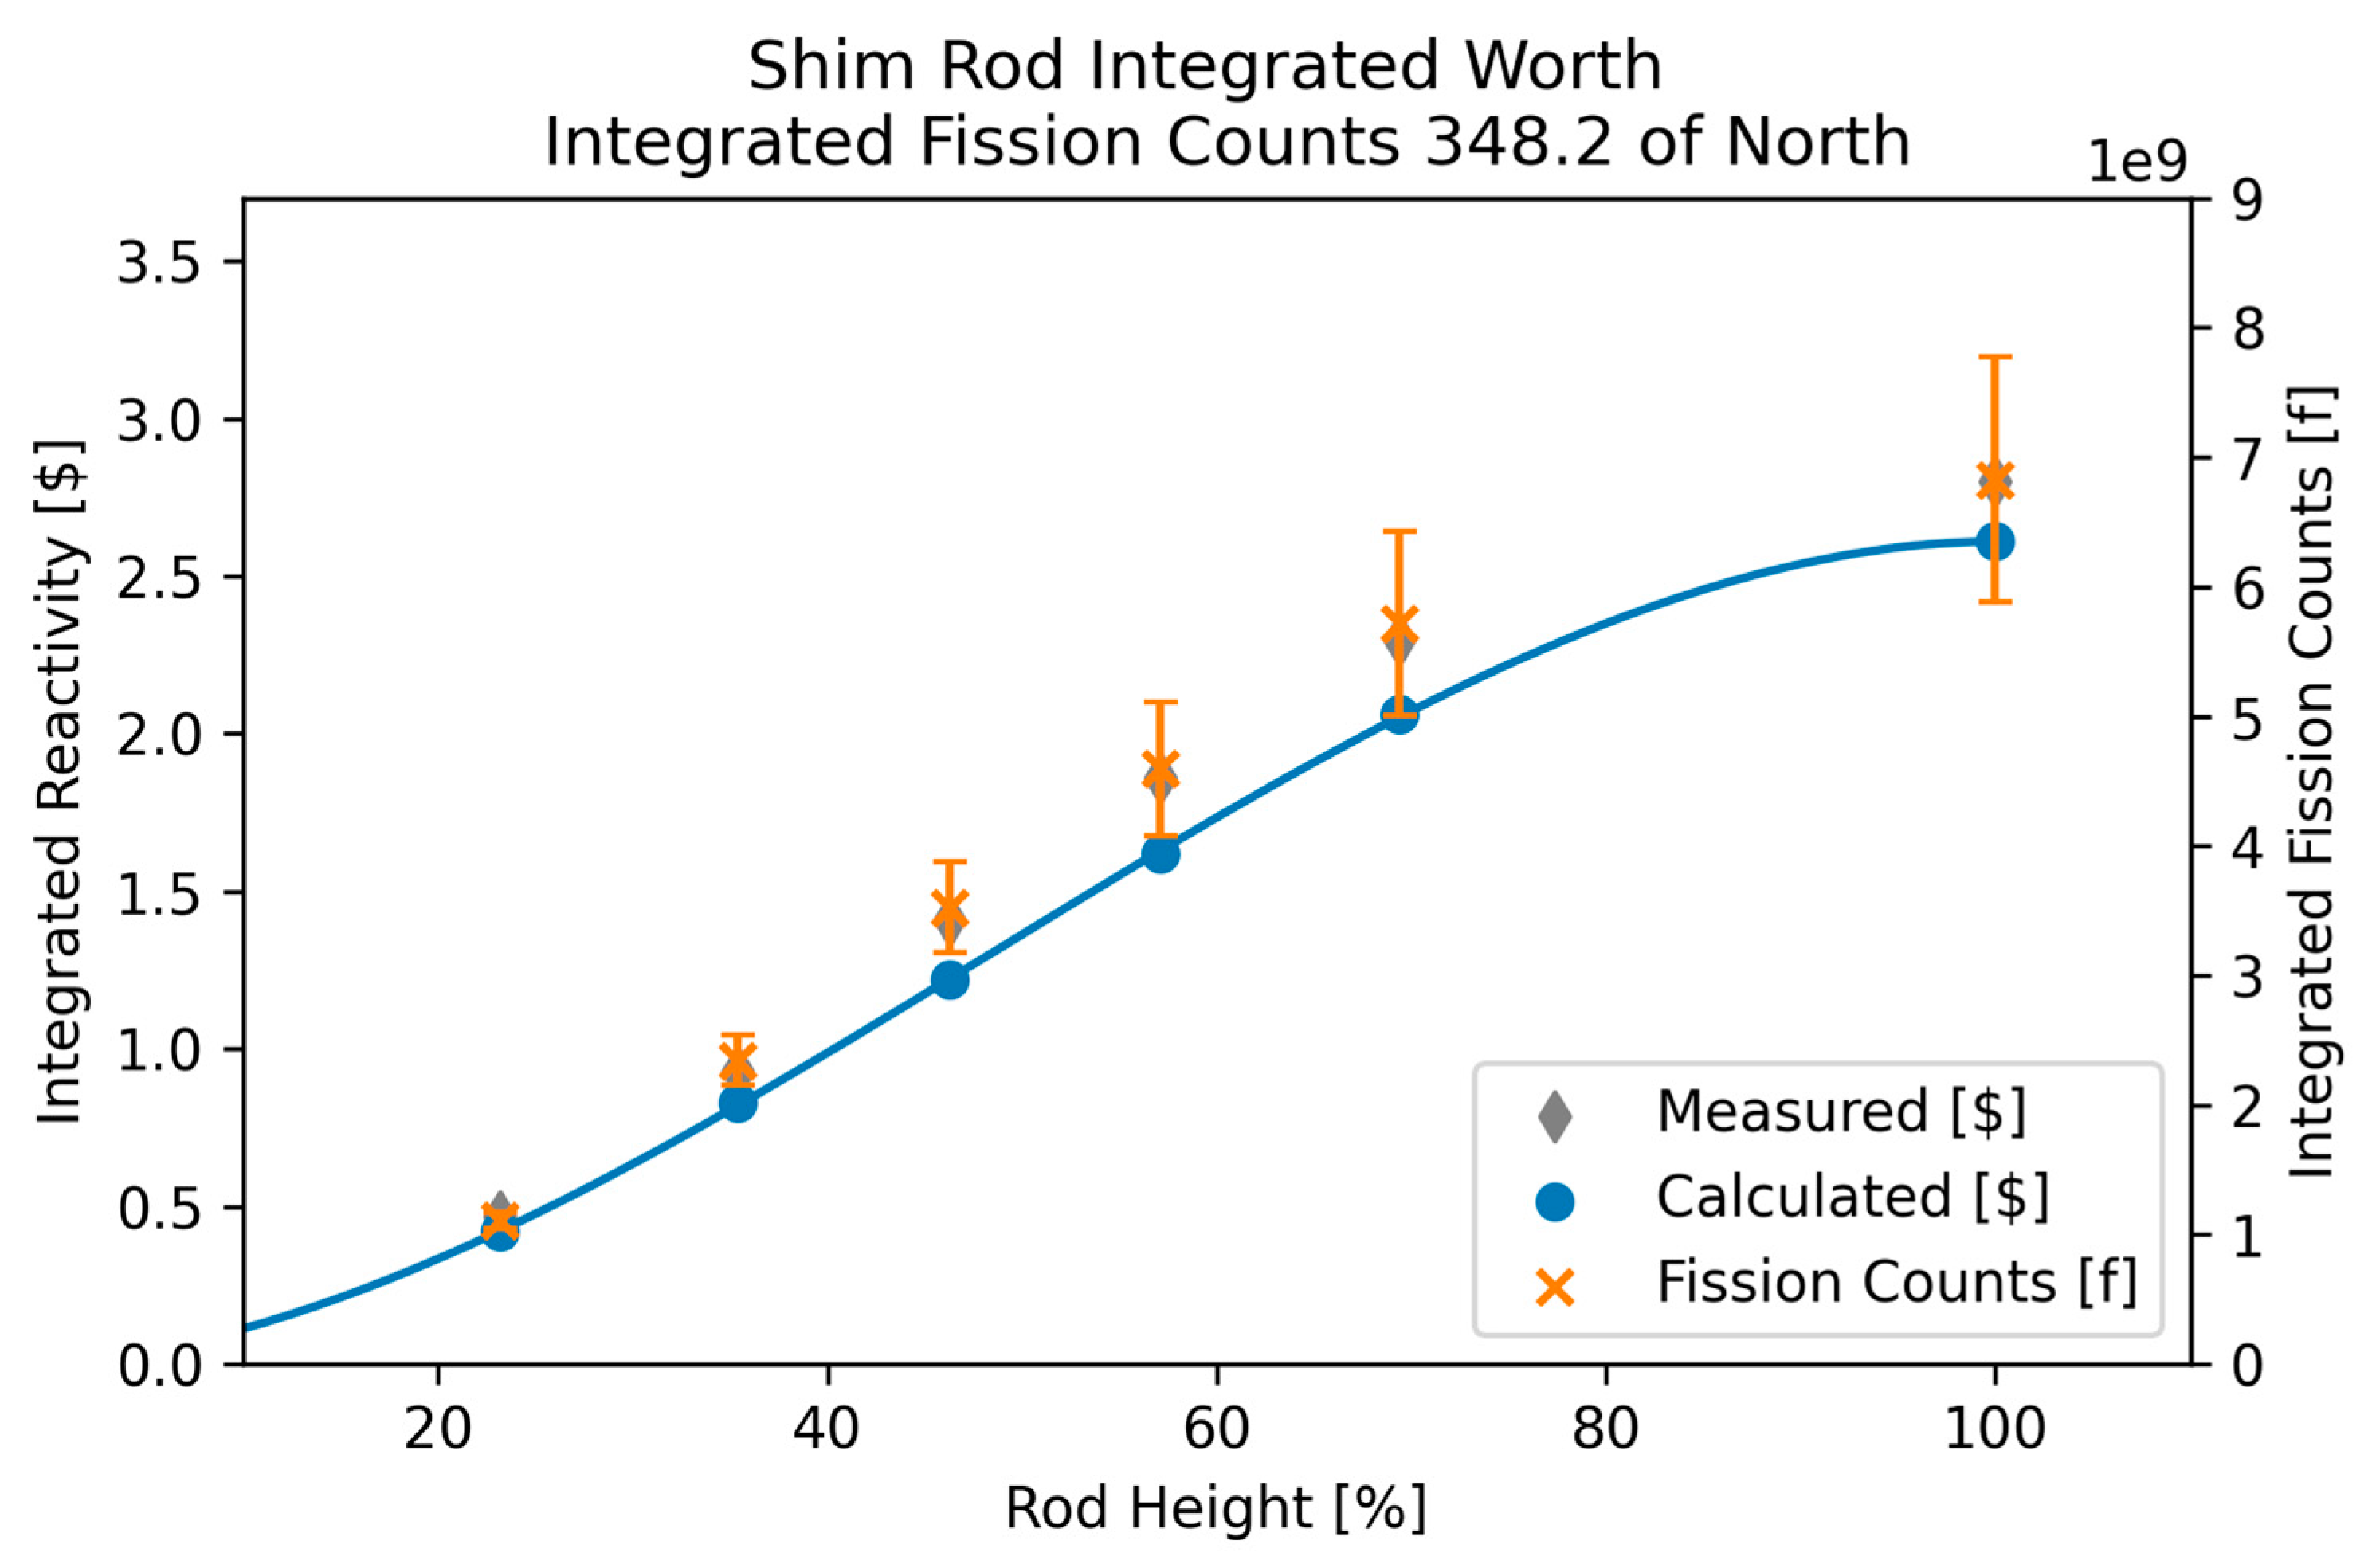
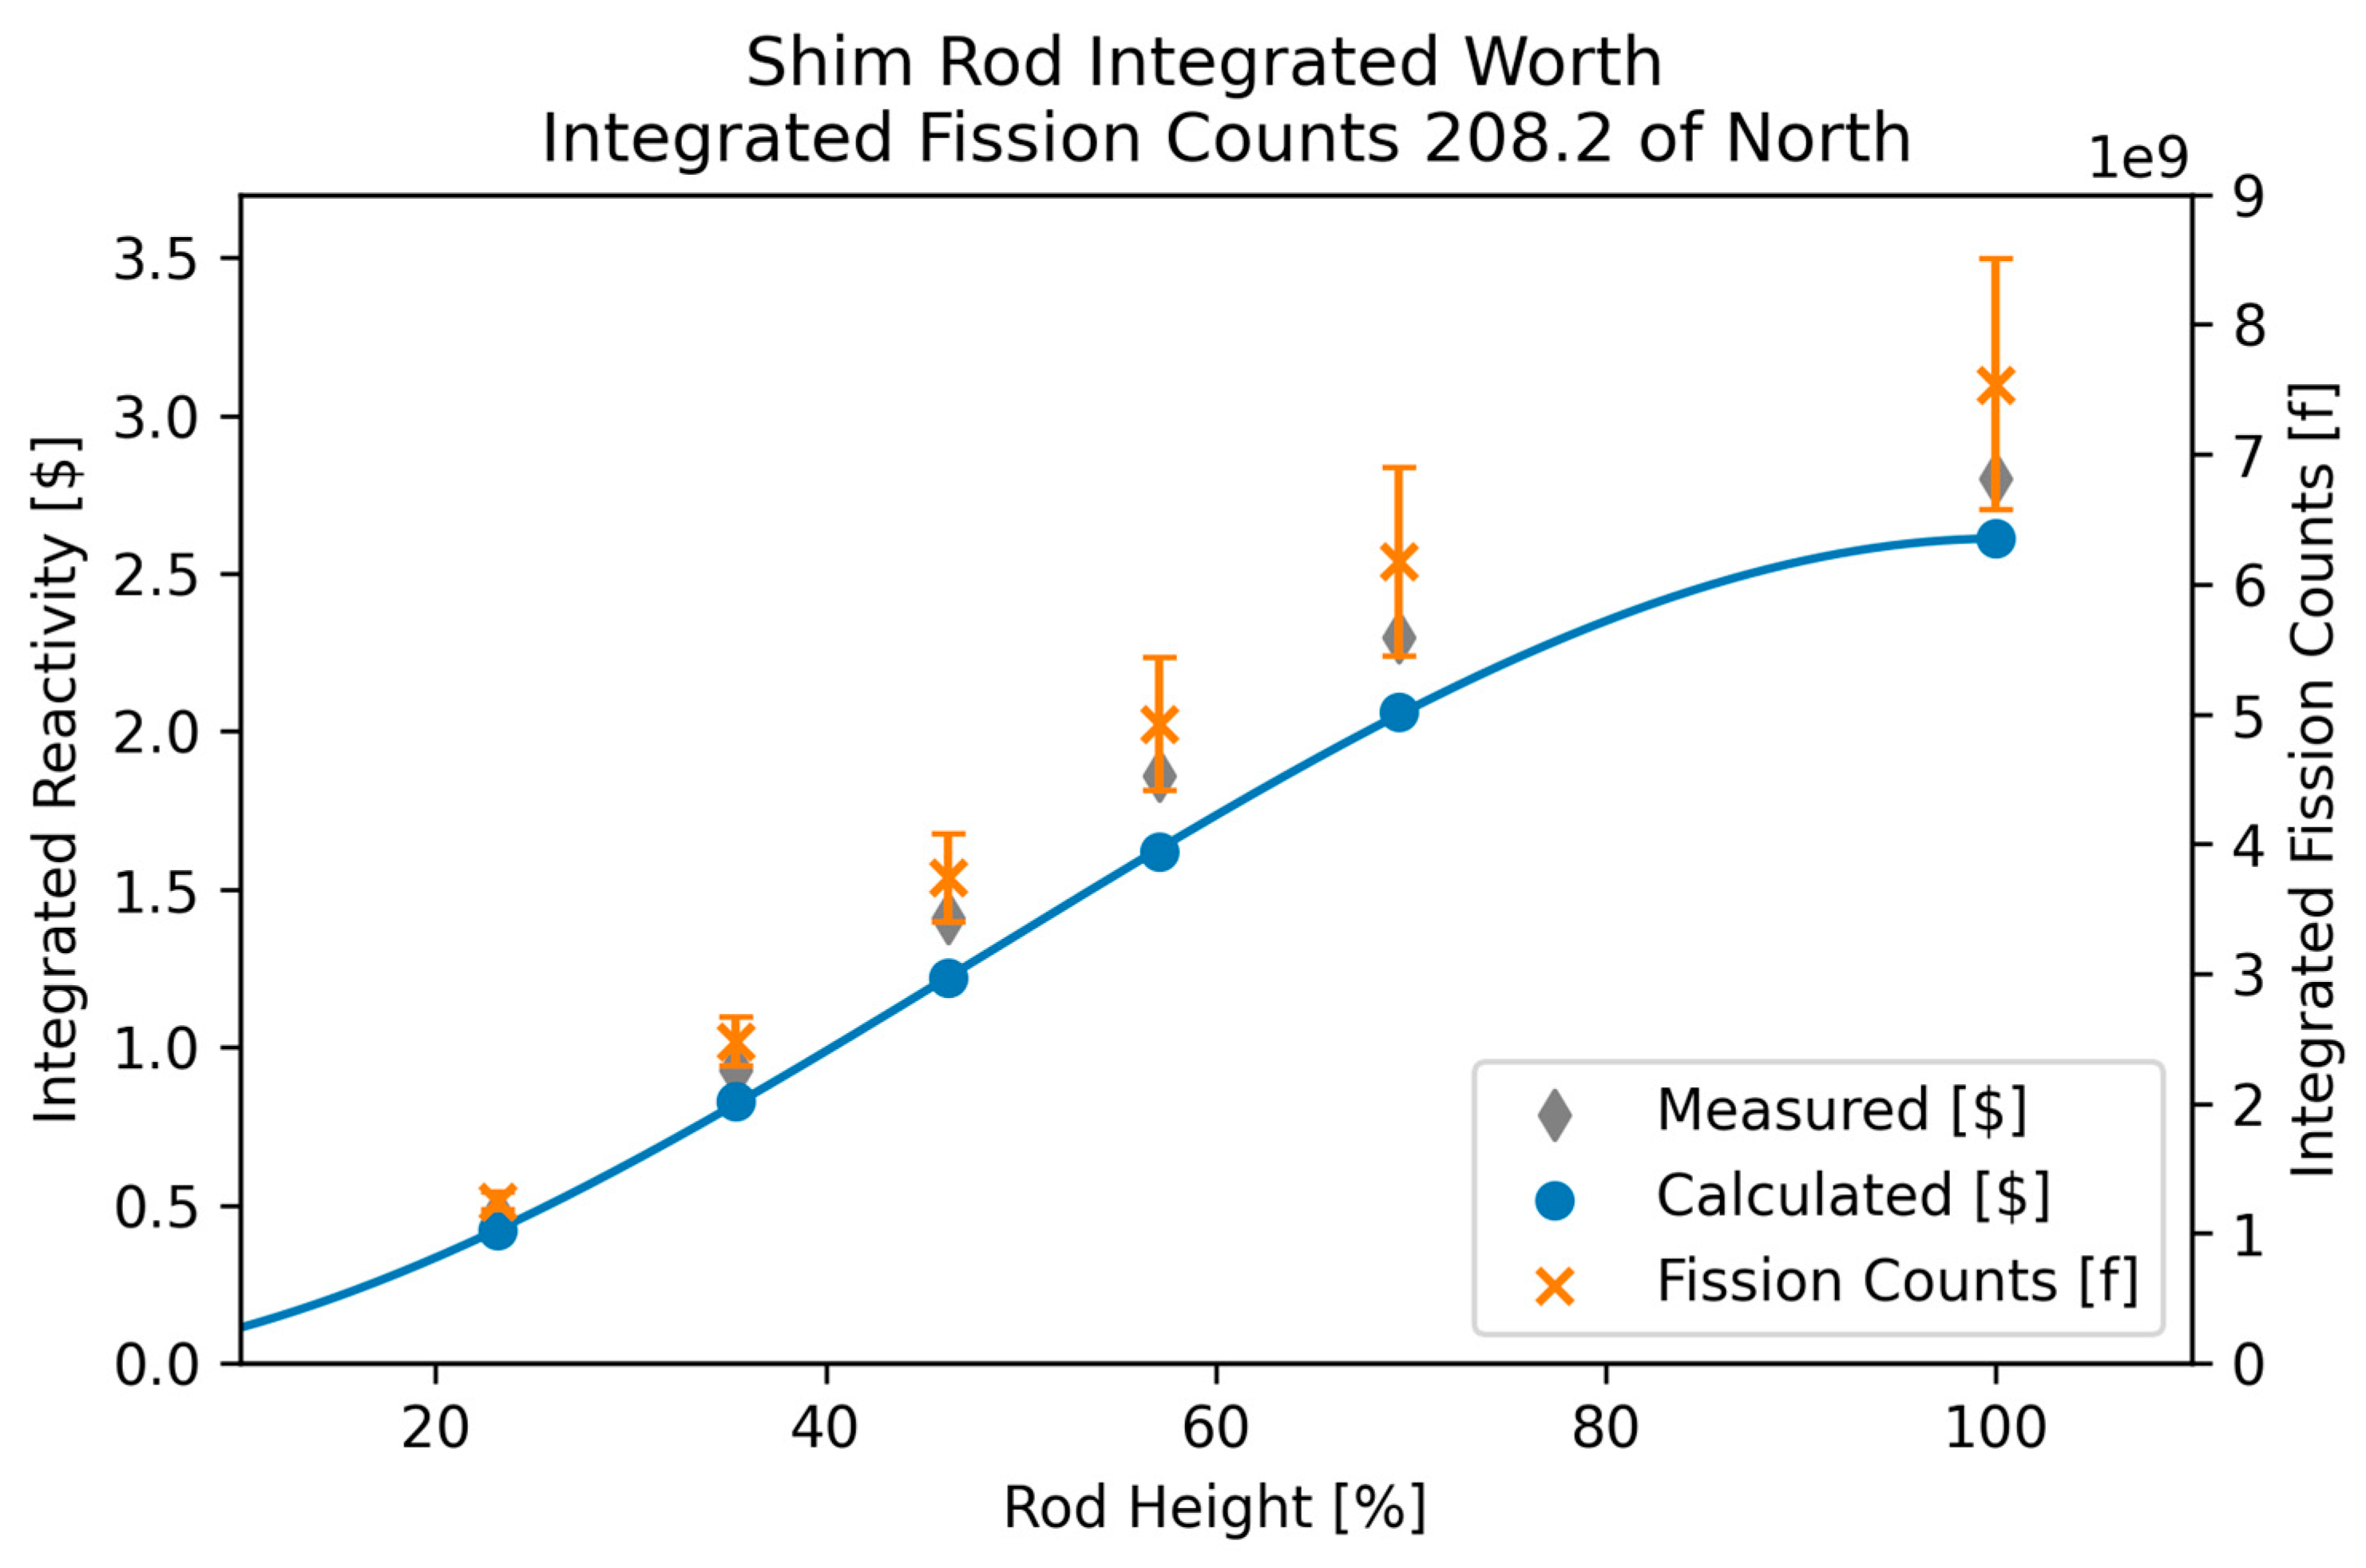
3.3. Comparison of Modeled Detector Responses to Measured and Calculated Control Rod Reactivity Worths

To understand the relationship that detector location and control rod shadowing have on detector response, the integrated fission events as a function of detector location were compared to the measured and calculated integrated control rod reactivity worths. The MCNP® models of the normal and CLICIT cores were used to produce models reflecting each supercritical control rod configuration during the control rod calibrations of October 2008 and an MCNP® kcode problem was run for each configuration using 100,000 neutrons per cycle for 100 cycles (75 active).
The integrated fission rate in each detector is plotted against the measured and MCNP® calculated integral rod worth curves for each rod pull and each detector, where the detector located at 348.2° north is the physical location of the detector. This resulted in 71 separate figures that show the response of each detector for each control rod that was calibrated in both core configurations. The results for the shim rod in the normal core configuration were selected for presentation since the disagreement in the measured and calculated reactivity worth of the shim and regulating rods in the normal core configuration was the discrepancy that motivated the NRC RAI and this work. Of the two, the shim rod was selected for presentation because it was calibrated in fewer pulls resulting in a lower error associated with the integrated detector responses at 13.2% versus 15.3% for the regulating rod. Of all the modeled detectors, the detector located at 208.2° north deviated from the response of the detector located at 348.2° the most. The comparison of the integrated detector response to the integral control rod worth curves is shown below in Figure 4 and Figure 5 for the shim rod in the normal core configuration.
It is observed that each of the eight modeled integrated detector responses deviates from the modeled integrated detector response for the true fission chamber located at 348.2° north for all the control rod pulls for the shim rod in the normal core configuration. This was true for all control rods in both the normal and CLICIT configurations as well. This implies that the flux seen by any of the nine modeled detectors is different for the same control rod movement. The orientation of the control rods relative to each other and their current heights relative to each other cause an asymmetry in the core flux and power distributions such that the response of any one detector to the same event is a function of detector location.
This effect is caused by extreme differences in control rod heights relative to each other. If the detector response is different for different detectors, and control rod configurations, then the response of any one detector will vary per control rod configuration in the calibration of any one control rod. This is due to the asymmetrical flux and power distribution in the core changing between configurations. These asymmetries are especially pronounced in configurations where there is an extreme disparity in heights between the rod being calibrated and the other three.

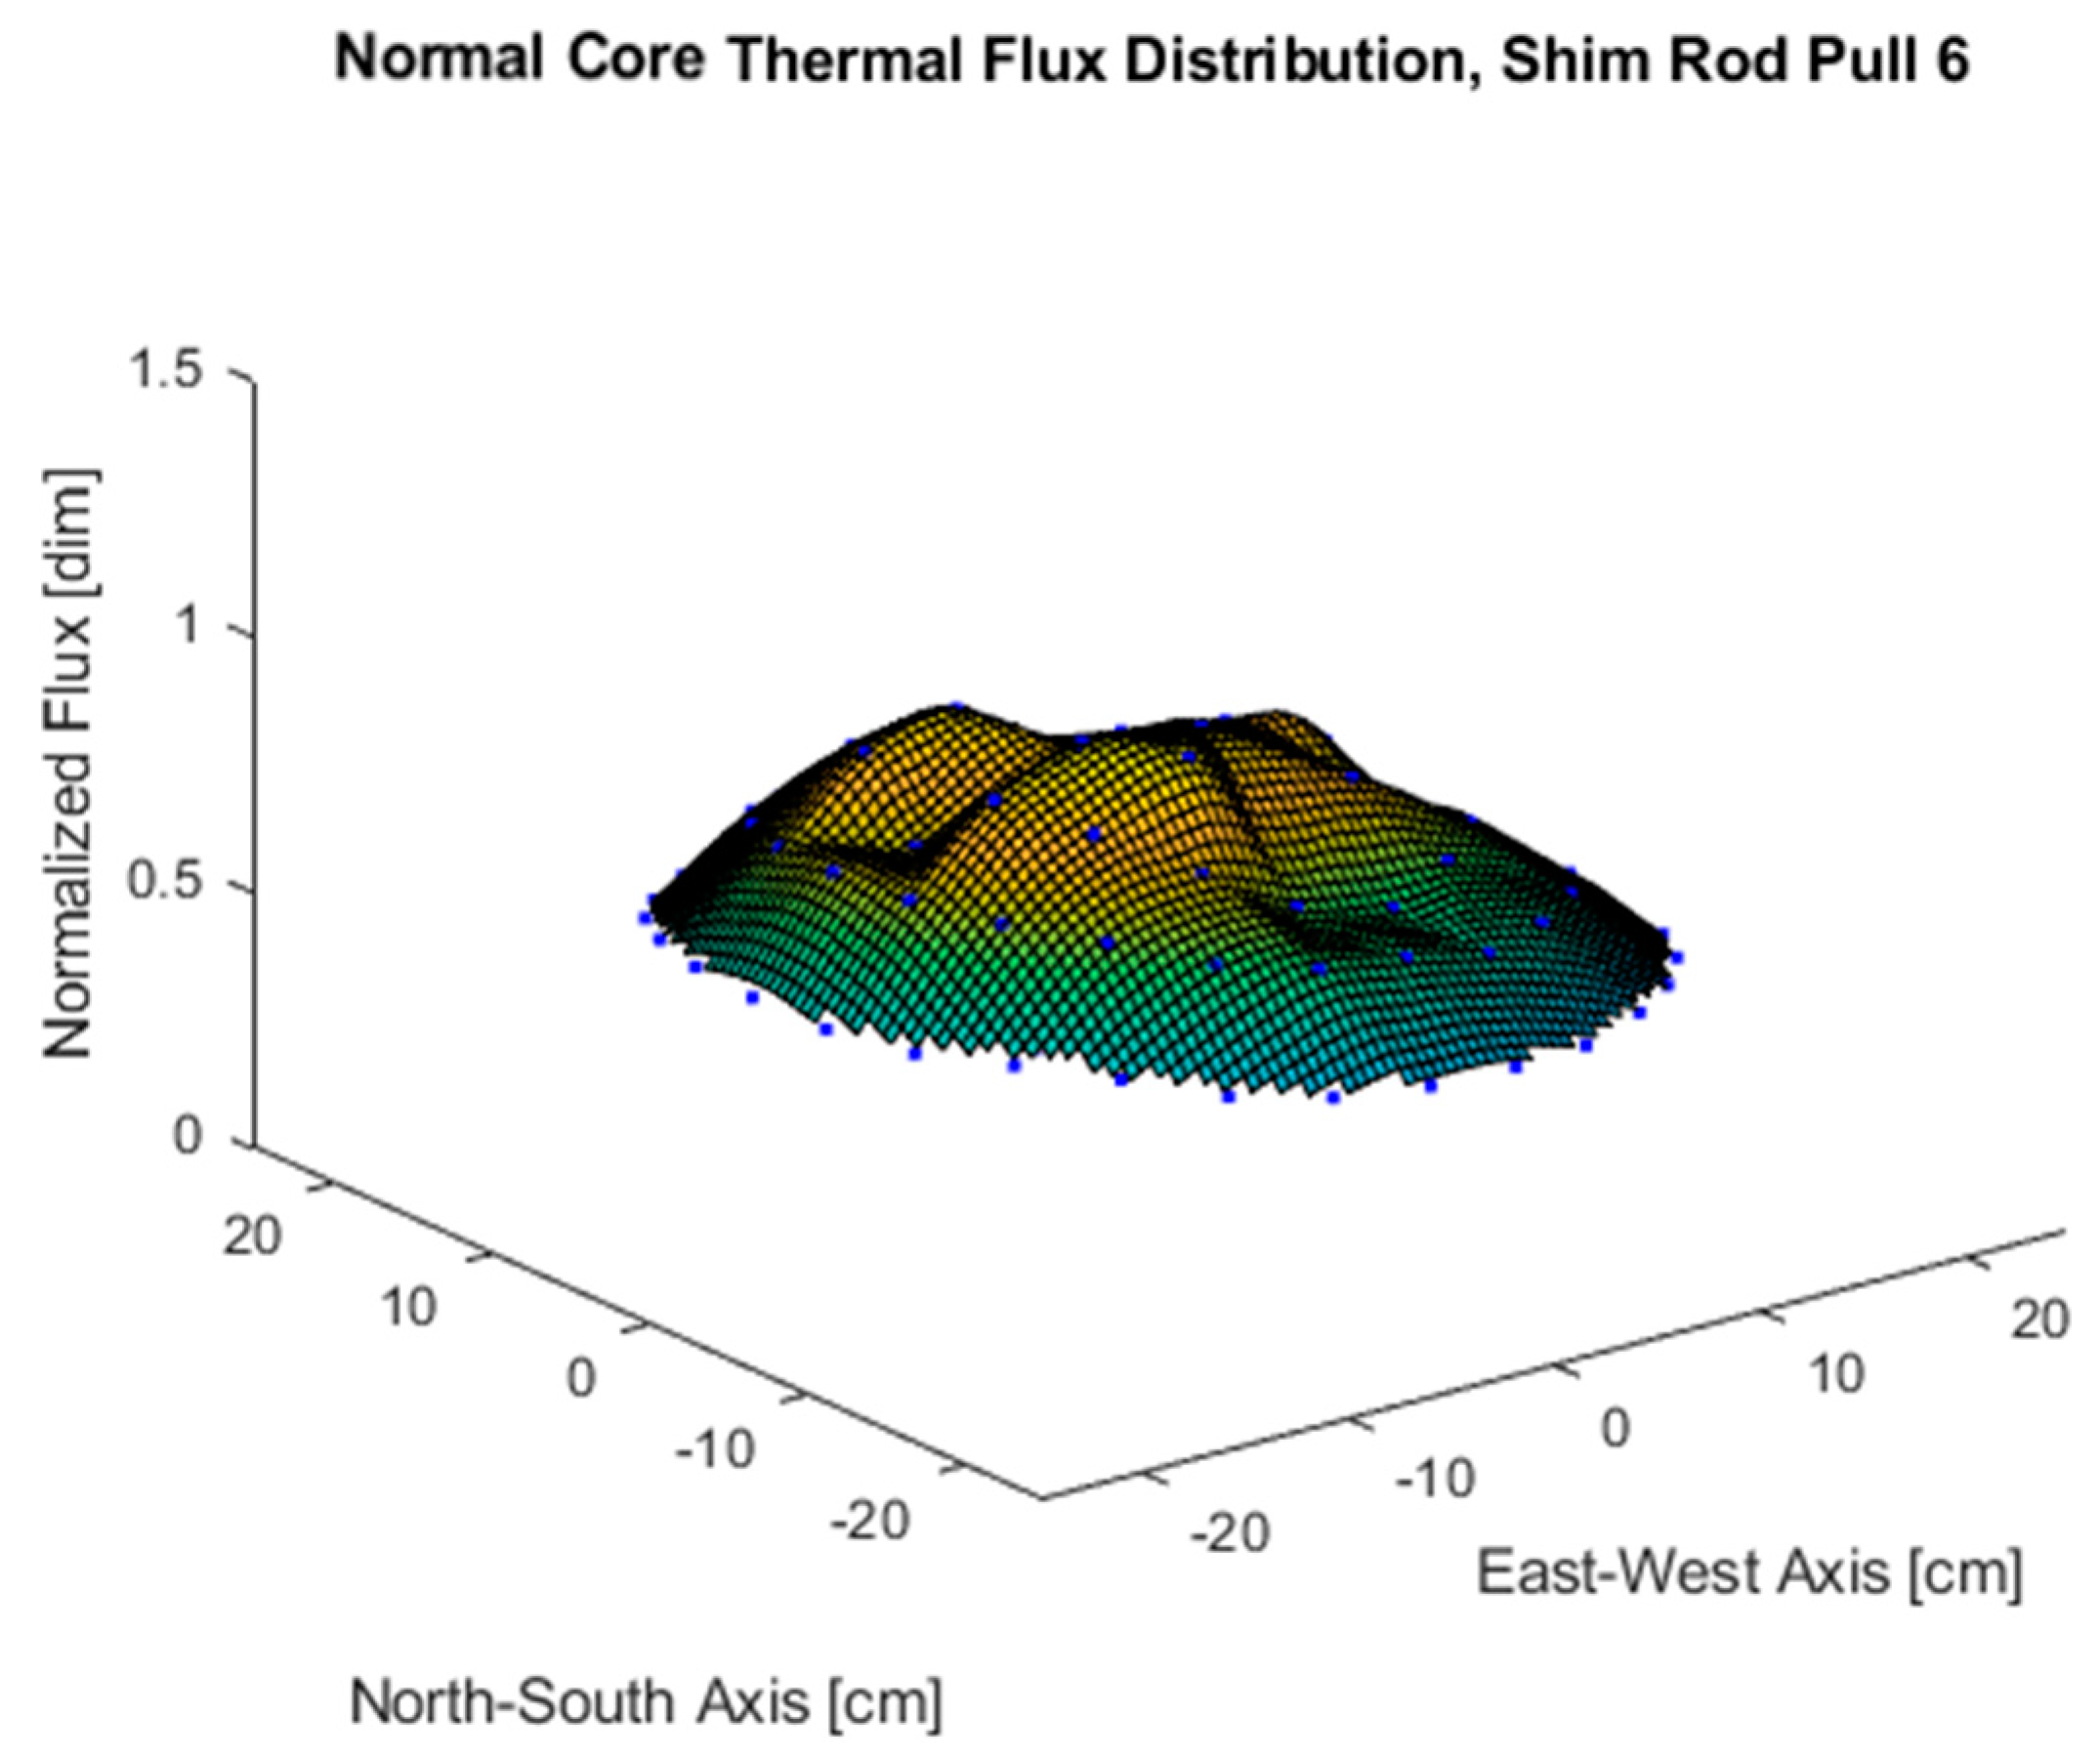
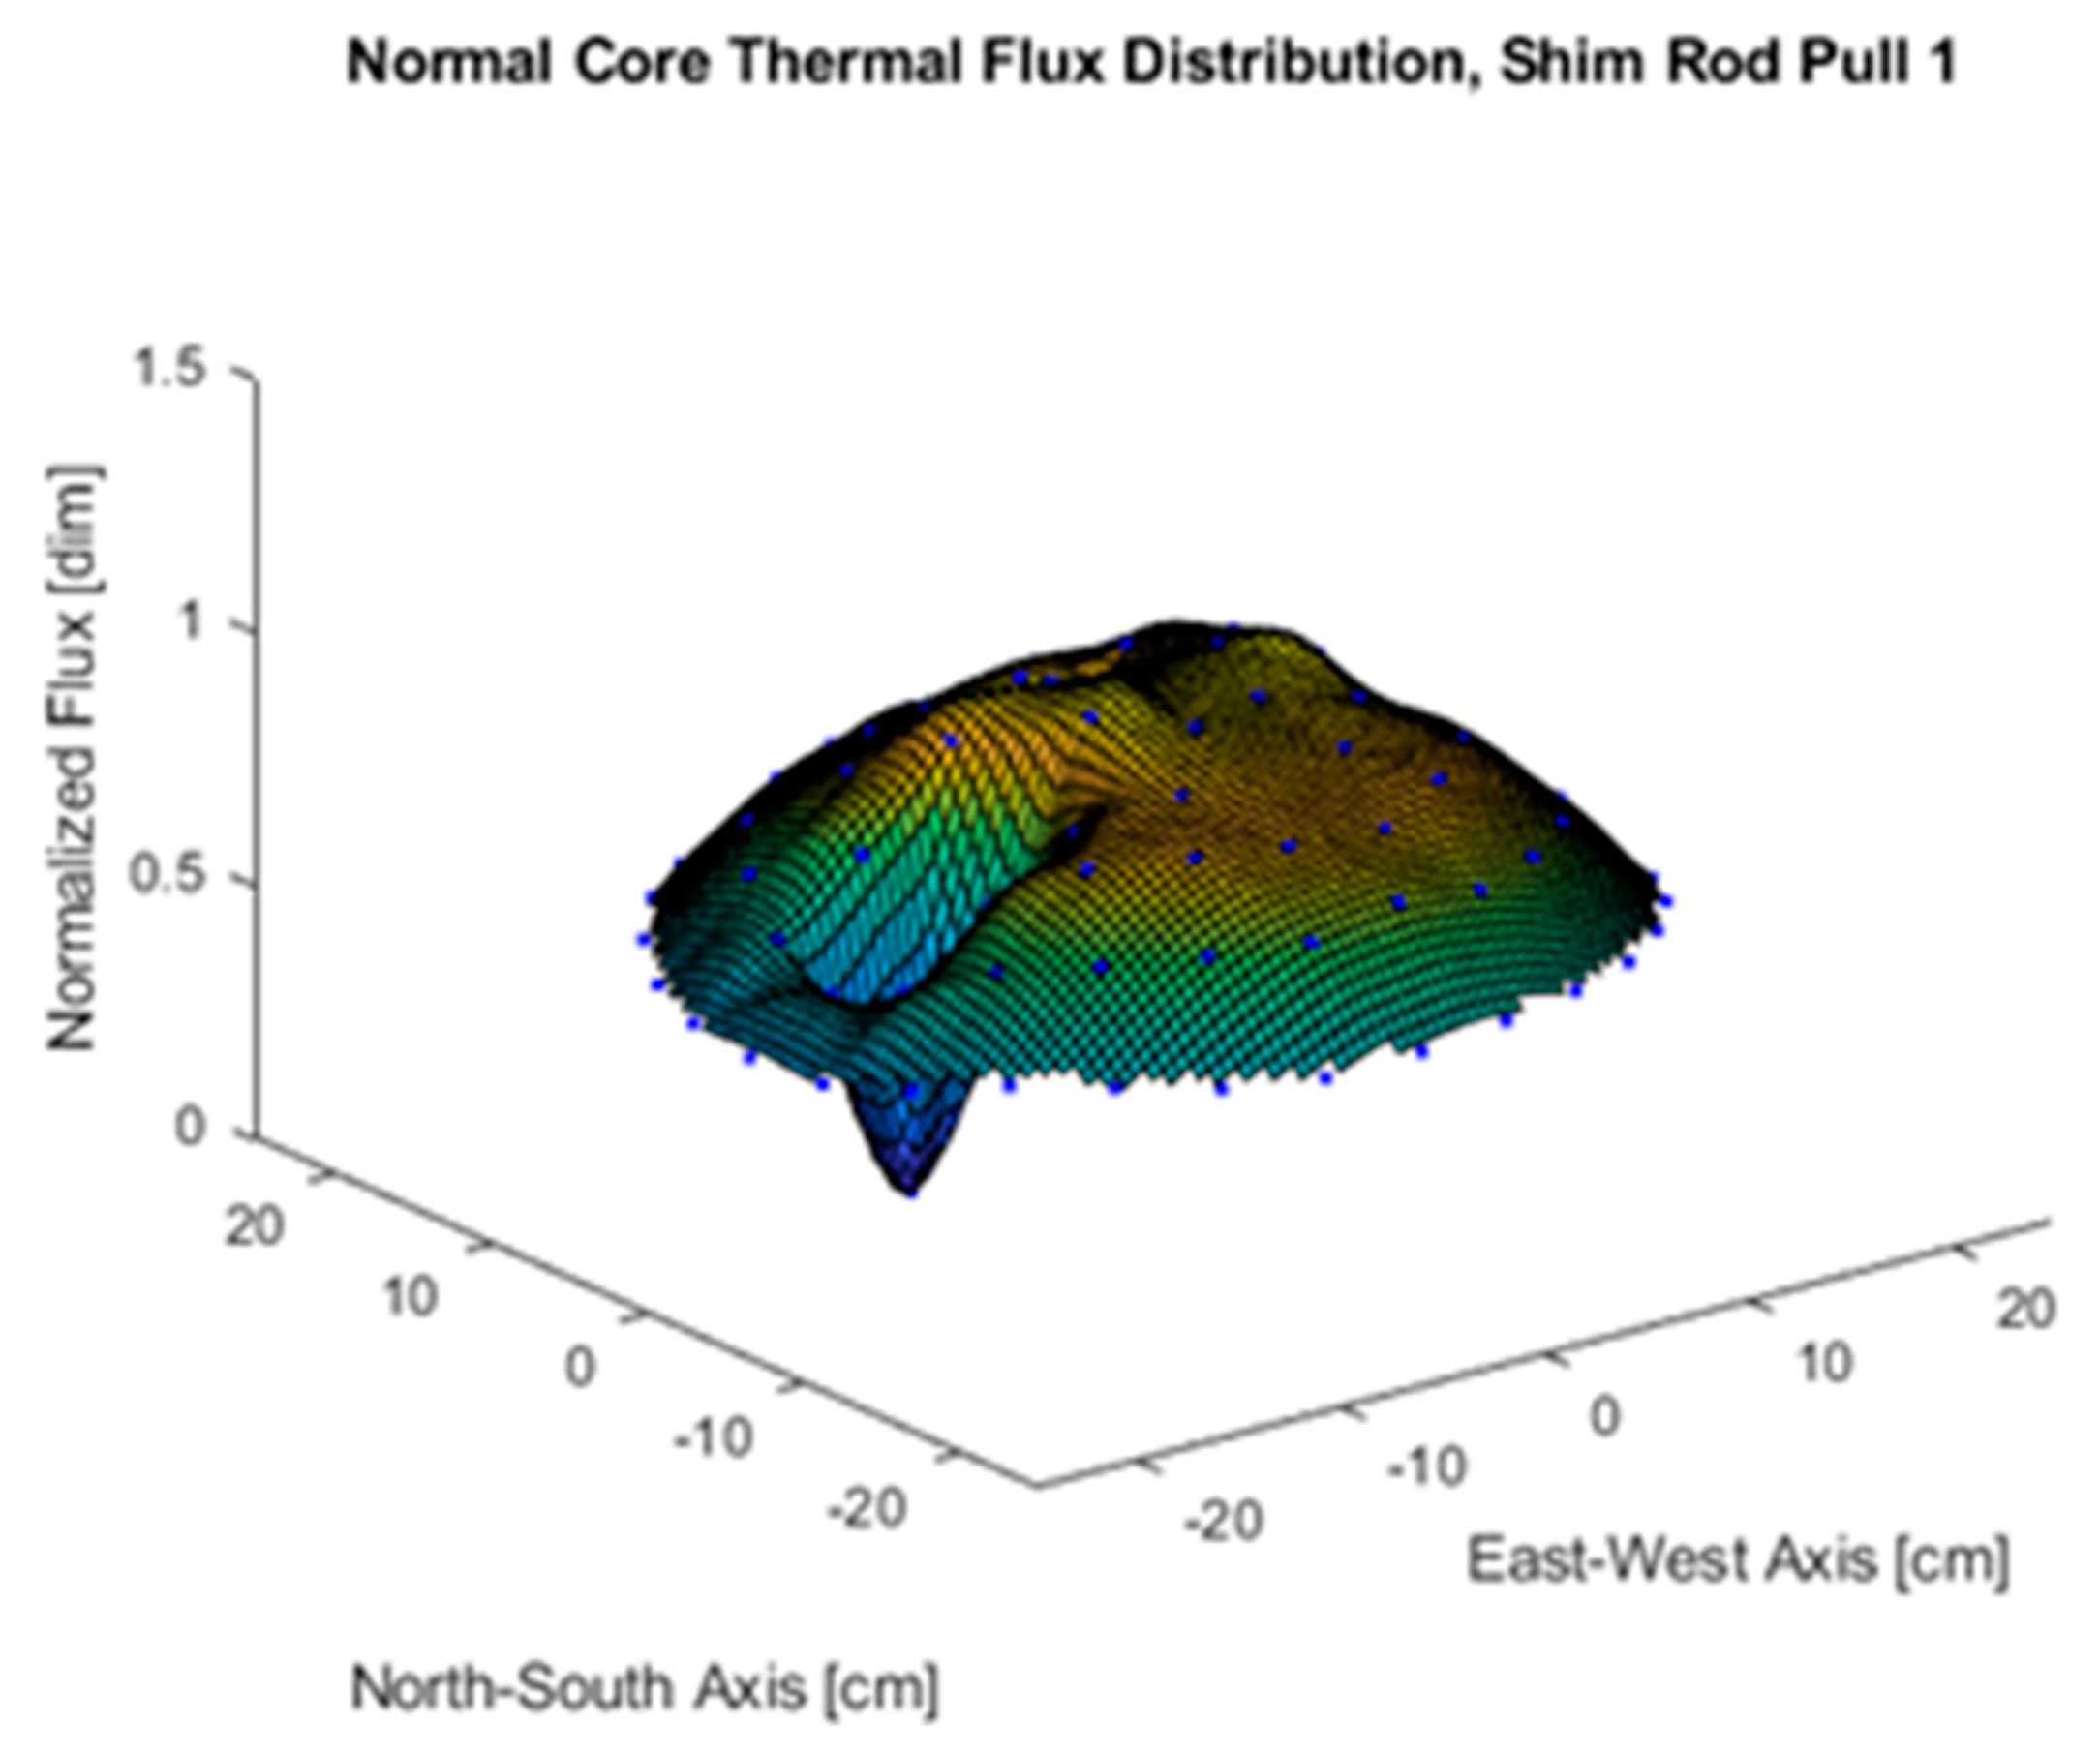
3.4. Thermal Flux Maps

To illustrate these flux distribution shifts and control rod shadowing phenomena, volume-averaged flux tallies were taken in the fuel at the core axial mid-plane. Normalized flux values for these tallies were plotted to show the normalized flux distribution in the core for each control rod configuration. These flux maps for the first shim rod pull and the last shim rod pulls in the LEU beginning-of-life normal core configuration are shown below in Figure 6 and Figure 7.

4. Discussion

The thermal flux maps shown in Figure 6 and Figure 7 reveal that the shape of the thermal neutron flux distribution in the OSTR is highly dependent on the orientations of the control rods to one another. These thermal flux profiles became particularly asymmetric at extreme control rod height disparities such as when one control rod was fully inserted or withdrawn and the other three were banked at low or high positions. The location of peak thermal neutron flux shifted significantly as the control rod configurations changed during the control rod calibration process. Since thermal neutron flux is directly proportional to power this means that the location of peak power was also shifting with each configuration, and the proximity of the peak power location to the detector influences the neutron flux incident on the detector.
The extreme depression or peaking of the thermal neutron flux profile near a reactor power detector due to control rod position illustrates the control rod shadowing and anti-shadowing effect where a depression near the detector shadows the detector and results in an under-response, and a peaking near the detector causes anti-shadowing or an over-response. The disparity between the power rise in the peak power location and the depressed regions of the reactor core has been shown to become more pronounced as supercriticality develops over time [11,12] which means that detector response would change non-linearly in time especially if the peak power location is near the detector. This would lead to a skewing of the Δ t term in the inhour equation and a skewed reactivity calculation. Time-dependent Monte–Carlo methods would likely be capable of quantifying this effect in the calibration of the control rods at OSTR. However, the time-independent method described in this work is capable of qualitatively detecting these effects by showing that the same detector responds differently at different locations around the OSTR core due to shifts in thermal flux distribution for each control rod configuration.
These results also imply that extreme control rod configurations at higher powers, those near the NRC licensed limit of 1.1 MW, could potentially result in a core-wide reactor power that is greater than the limiting safety system setting (LSSS) of 1.06 MW or the license limit if the location of peak power is very distant from the reactor power detector(s). This is because each detector is calibrated at 1 MW with a banked control rod configuration. At OSTR the reactor power detectors are calibrated using a calorimetric method where the reactor pool is isolated from the cooling systems and assumed adiabatic. The OSTR is then operated at what is believed to be 1 MW based on the current detector readings on the control console. After some time, the change in the reactor pool temperature is recorded, and Equation (5) is used to calculate the average power of the OSTR over that period.
Q ˙ = m C p Δ T Δ t
After this calculation is performed each reactor power detector is physically inserted or withdrawn from the core so that the neutron flux incident on it and the corresponding signal reads 100% of 1 MW on the control console instrumentation. The problem with this method is that the flux incident on a power detector is a function of location as the neutron flux and power profile of the OSTR are very specific to a particular control rod configuration as shown by Figure 6 and Figure 7. The reactor power detectors see any neutron flux at powers below 1 MW as a percent of the neutron flux incident on the detector at 1 MW. However, as the flux profile deviates from the profile at 1 MW for different control rod configurations, the power level instrumentation may read a power that is not representative of the actual core-wide power. The OSTR uses three reactor power detectors, two uncompensated ion chambers, and the fission chamber. All three are at different positions around the reflector periphery. This means that should such an asymmetric power distribution occur, the three power detectors would disagree with each other, and the detector reading the highest power would likely be over-responding and reading a higher than actual core-wide power level if the location of power peaking is near that detector.
This work shows that an ex-core reactor power detector’s response is a function of location if the neutron flux distribution is not symmetric. This may be the source of disagreement between control rod reactivities measured with an ex-core power detector and MCNP® calculated reactivity worths as MCNP® simply outputs a system-wide neutron multiplication factor. The MCNP® model may be more accurate in situations where the reactivity bias on the model is extremely low and the detector is highly shadowed for a particular rod or core configuration that experiences large shifts in peak power location. However, this does not mean that modeling is a valid replacement for control rod calibration experiments or a solution to problems encountered at reactors with low core excess. Measuring the reactivity worth of a control rod experimentally is the only method by which reasonable assurance can be given to the regulator that limits on core excess and shutdown margin are met. This work has shown that the two approaches (modeling and measurement) may disagree even for a model with near-zero bias.

4.1. Total Control Rod Reactivity Worth Comparisons

It is often assumed in nuclear engineering that the worth of a control rod is only a function of its material properties, temperature, geometry, and the properties of the reactor core within which it is used. Within the category of the properties of the reactor core is the two-dimensional core configuration, i.e., how many fuel rods, experimental facilities and control rods are within the core and where they are located. Less considered is the variation in the three-dimensional core configuration where each unique combination of control rod heights is a unique core configuration for the same two-dimensional core layout. This work showed that a reactor power detector’s response is a function of location and detectors are different locations respond differently to the same event due to control rod shadowing effects.
This raises the possibility of calculating a different reactivity worth depending on the rods’ heights concerning each other. This can be shown by comparing the k e f f of the OSTR core with one rod fully ejected and the other three fully inserted into the k e f f of the core with all control rods fully inserted. It was found that the total worth of the rods summed separately using this method disagreed significantly despite the MCNP® calculated control rod worths being in good agreement with the measured control rod worths using the control rod configurations in the calibration process.
Table 2 and Table 3 below show that fully withdrawing one rod in a non-banked (control rods at extreme height differences relative to one another) configuration resulted in a calculated total core worth of $14.12 ± 0.13 for the normal core and $13.49 ± 0.13 for the CLICIT core. Whereas fully ejecting one rod from a banked configuration resulted in a calculated $11.56 ± 0.06 for the normal core and $10.71 ± 0.20 for the CLICIT core. Another configuration was modeled where the k e f f of the OSTR core with three of the rods 55% withdrawn and one fully ejected was compared to the k e f f of the core with three rods 55% and the other fully inserted. The results are shown below in Table 4 and Table 5. This process produced different results than the other two with total core reactivity worth $10.68 ± 0.16 for the normal core and $10.51 ± 0.16 for the CLICIT core.

4.2. Subcritical Experimental Validation

These results motivated a need for experimental comparison to determine if this phenomenon was due to modeling error or real core geometrical effects influencing the reactivity worth of a control rod. A subcritical experiment was devised and carried out at OSTR where the total integrated reactivity worth of each control rod was measured by fully withdrawing one rod while the other three remained fully inserted to replicate the non-banked model process for the CLICIT core in Table 4. The reactivity worth of a control rod can be measured by comparing the subcritical count rate on the fission chamber detector using:
C R 1 1 k 1 = C R 2 1 k 2
where the unknown k 1 can be calculated if the shutdown margin is known using:
S D M = 1 k 1 1
Substituting Equation (6) into (7) yields:
t h e k 2 = C R 1 1 1 S D M + 1 C R 2 1
where count rates were measured with all rods inserted C R 1 and with one rod fully ejected C R 2 . Count rates were randomly sampled over a one-minute period and averaged. The measured core excess and shutdown margin were $3.97 and $6.62, respectively. From Equation (7), k 1 was calculated to be 0.9527 for the “all rods inserted” configuration. The results of the experiment are presented below in Table 6.
The experiment was not carried out for the normal core configuration as it is no longer used operationally at OSTR. The experimental results for the measurement of control rod reactivity using the one-rod-out method for the CLICIT core agree with the calculated results with a measured total core worth of $14.03 ± 1.15 and a calculated core worth of $13.49 ± 0.13. These results suggest that the differences observed in the MCNP® calculations of the control rod worths using the rod-pull method and the one-rod-out are not a model error but a real phenomenon where the reactivity worth of a control rod is partially a function of control rod heights relative to one another. This would suggest that, in addition to control rod shadowing and flux distribution shift effects having the potential to cause model and measurement discrepancies, the measured worth of a control rod in OSTR depends on the control rod heights during the control rod calibration process.

5. Conclusions

Differences in measured and calculated control rod reactivity worths during the first post-LEU conversion control rod calibrations of October 2008 were believed to be due to the shadowing of the fission chamber power detector. The OSTR MCNP® model was validated against the critical control rod configurations during the control rod calibrations of 2008 and the model reactivity bias was calculated to be −$0.02 ± 0.04 for the normal core configuration and $0.07 ± 0.04 for the CLICIT core configuration.
Nine identical fission chambers were added to the OSTR model with one of the detectors placed at the actual detector location 348.2° north at the reflector periphery. K-code problems were run in MCNP® 6.2 to compare detector responses to that of the detector located at 348.2°. It was found that detector response was a function of location and different detectors respond differently to the same control rod manipulation in the rod-pull method for control rod calibration. This may result in a skewing of the time term in the inhour equation due to localized variances in neutron flux and power near the detector and be the source of the differences in the measured and calculated control rod reactivity worths observed in October 2008. Other work suggests that power may not rise at the same rate everywhere in the core during transients and a time-dependent Monte Carlo method would likely be capable of quantifying the effect [11,12]. Such a method would enable the study of changes in flux and power asymmetries during supercriticality to quantify the detector response during the power rise in the rod-pull method and the effect this has on the time term in the inhour equation.
It was also found through both the model and a subcritical experiment that the reactivity worth of a control rod is a function of geometry or the heights of the control rods relative to each other and a control rod manipulation is not an equal reactivity insertion for all configurations. This effect can be significant with a measured total core reactivity worth of $14.03 and calculated core worth of $13.49 ± 0.13 for the CLICIT core using the one-rod-out method compared to a measured total core reactivity worth of $10.75 and calculated core worth of $10.71 ± 0.20 using the rod-pull method. This implies that the measured reactivity worths of the control rods at OSTR are highly variable and dependent on the configuration of the rods during the control rod calibration process. This variability is not an error, but rather the actual worth of the rod at a specific configuration.

Author Contributions

Conceptualization, S.R. and T.S.; methodology, T.S. and S.R.; validation, T.S.; formal analysis, T.S. and S.R.; investigation, T.S.; resources, R.S.; data curation, T.S.; writing—original draft preparation, T.S.; writing—review and editing, S.R. and R.S.; visualization, T.S.; supervision, S.R. All authors have read and agreed to the published version of the manuscript.

Funding

This research received no external funding.

Data Availability Statement

The data presented in this study are available on request from the corresponding author. The data are not publicly available due to privacy restrictions.

Acknowledgments

This work would not have been possible without the creation of the OSTR MCNP® model by Kanokrat Tiyapun, substantial additions and improvements by Allyson Kitto, and the many years of additions, improvements, and stewardship of the model by OSTR Reactor Administrator Robert Schickler. Additionally, the pace of this work was greatly accelerated by OSTR operations staff who generously provided information and access to the reactor in the course of this work. A special thanks to the OSTR Development Engineer Steve Smith whose many years of experience were invaluable, and for providing technical drawings and specifications.

Conflicts of Interest

The authors declare no conflict of interest.

References

  1. Reese, S.R.; Keller, S.T. Safety Analysis Report for the Conversion of the Oregon State TRIGA® Reactor from HEU to LEU Fuel; Oregon State University: Corvallis, OR, USA, 2008. [Google Scholar]
  2. OSTR Logbook #150. 14 October 2008. Available online: https://www.nrc.gov/docs/ML0911/ML091110188.pdf (accessed on 1 October 2023).
  3. Schickler, R. OSTROP 9: Control Rod Calibration Procedures; Oregon State University: Corvallis, OR, USA, 2019. [Google Scholar]
  4. Keller, S.T. Oregon State University TRIGA Reactor Post Conversion Reactor Startup Report; Oregon State University: Corvallis, OR, USA, 2009; p. 80. [Google Scholar]
  5. Snoj, L.; Barbot, L. Analysis of the TRIGA Mark II Research Reactor Ex-Core Detector Response. In Proceedings of the International Conference Nuclear Energy for New Europe, Portorož, Slovenia, 14–17 September 2015. [Google Scholar]
  6. General Atomics. Technical Foundations of TRIGA. UNT Digital Library. Available online: https://digital.library.unt.edu/ark:/67531/metadc304052/ (accessed on 2 November 2021).
  7. Duderstadt, J.J.; Hamilton, L.J. Nuclear Reactor Analysis; Wiley: New York, NY, USA, 1976. [Google Scholar]
  8. Model SA-C3-2510-114 Fission Chamber Sales Specifications; GE Reuter-Stokes: Twinsburg, OH, USA, 1982.
  9. Tiyapun, K. Epithermal Neutron Beam Design at the Oregon State University TRIGA Mark II Reactor (OSTR) Based on Monte Carlo Methods. March 1997. Available online: https://ir.library.oregonstate.edu/concern/graduate_thesis_or_dissertations/1g05fg170?locale=de (accessed on 15 September 2021).
  10. Kitto, A.K. Determination of a Calculation Bias in the MCNP Model of the OSTR. December 2012. Available online: https://ir.library.oregonstate.edu/concern/graduate_thesis_or_dissertations/rr172174p?locale=en (accessed on 30 August 2021).
  11. Kim, H.; Kim, Y. Pin-by-Pin Coupled Transient Monte Carlo Analysis Using the iMC Code. Front. Energy Res. 2022, 10, 853222. [Google Scholar] [CrossRef]
  12. Mazaher, M.G.; Salehi, A.A.; Vosoughi, N. A time dependent Monte Carlo approach for nuclear reactor analysis in a 3-D arbitrary geometry. Prog. Nucl. Energy 2019, 115, 80–90. [Google Scholar] [CrossRef]
Figure 1. 2008 LEU normal core configuration.
Jne 05 00002 g001
Figure 2. 2008 LEU CLICIT core configuration.
Jne 05 00002 g002
Figure 3. Modeled fission chamber placement.
Jne 05 00002 g003
Figure 4. Integrated shim rod worth and fission rate in the 348.2° detector.
Jne 05 00002 g004
Figure 5. Integrated shim rod worth and fission rate in the 208.2° detector.
Jne 05 00002 g005
Figure 6. Normal core axial mid-plane thermal flux map for shim rod initial pull configuration.
Jne 05 00002 g006
Figure 7. Normal core axial mid-plane thermal flux map for shim rod final pull configuration.
Jne 05 00002 g007
Table 1. Measured and calculated control rod calibration results.
Control RodCLICIT Core Measured
Worth
[$]
CLICIT Core
Calculated
Worth
[$]
Normal Core Measured
Worth
[$]
Normal Core
Calculated
Worth
[$]
Transient2.572.39 ± 0.102.862.81 ± 0.03
Safety2.312.14 ± 0.092.662.57 ± 0.03
Shim2.712.82 ± 0.102.762.61 ± 0.03
Regulating3.163.36 ± 0.113.713.57 ± 0.04
Total10.7510.71 ± 0.2011.9911.56 ± 0.06
Table 2. Non-banked normal core calculated control rod reactivity worth results using the one-rod-out method.
Configuration k e f f σ e f f Reactivity   [ ρ ]Reactivity [$]Std. Error [±$]
All rods in 0.965230.00027---
All rods out1.051690.000290.089611.96±0.06
Transient rod out0.990130.000320.02583.46±0.07
Safety rod out0.988510.000350.02413.23±0.07
Shim rod out0.989490.000300.02513.37±0.06
Reg rod out0.994490.000320.03034.06±0.07
Sum of rods--0.105414.12±0.13
Table 3. Banked normal core calculated control rod reactivity worth results using the one-rod-out method.
Configuration k e f f σ e f f Reactivity   [ ρ ]Reactivity [$]Std. Error [±$]
Trans rod in 1.006480.00039---
Trans rod out1.027410.000340.02082.71±0.09
Safety rod in1.008640.00030---
Safety rod out1.026720.000320.01792.32±0.07
Shim rod in1.008110.00032---
Shim rod out1.026450.000290.01822.36±0.07
Reg rod in1.003200.00035---
Reg rod out1.028450.000330.02523.29±0.08
Sum of rods --0.082110.68±0.15
Table 4. Non-banked CLICIT core calculated control rod reactivity worth results using the one-rod-out method.
Configuration k e f f σ e f f Reactivity   [ ρ ]Reactivity [$]Std. Error [±$]
All rods in 0.953220.00031---
All rods out1.036640.000320.087511.60±0.07
Trans rod out0.976910.000310.02493.25±0.07
Safety rod out0.975230.000330.02313.01±0.07
Shim rod in0.978680.000350.02673.50±0.07
Shim rod out0.980360.000280.02853.73±0.06
Sum of rods--0.103113.49±0.13
Table 5. Banked CLICIT core calculated control rod reactivity worth results using the one-rod-out method.
Configuration k e f f σ e f f Reactivity   [ ρ ]Reactivity [$]Std. Error [±$]
Trans rod in 0.993350.00034---
Trans rod out1.013400.000370.02022.63±0.09
Safety rod in0.995070.00033---
Safety rod out1.012250.000300.01732.24±0.07
Shim rod in0.992400.00030---
Shim rod out1.013320.000310.02112.75±0.07
Reg rod in0.991640.00035---
Reg rod out1.013700.000310.02222.90±0.08
Sum of rods --0.080810.51±0.16
Table 6. Non-banked CLICIT core one-rod-out method experimental validation.
Configuration Avg .   C R 2 [CPS] k 2 Reactivity   [ ρ ] Reactivity [$]Std. Error [±$]
All rods in 14.3----
Transient rod out29.40.97700.02433.250.46
Safety rod out28.00.97590.02323.100.43
Shim rod out34.20.98030.02763.680.65
Reg rod out39.10.98280.03014.010.71
Sum of rods--0.105314.031.15
Disclaimer/Publisher’s Note: The statements, opinions and data contained in all publications are solely those of the individual author(s) and contributor(s) and not of MDPI and/or the editor(s). MDPI and/or the editor(s) disclaim responsibility for any injury to people or property resulting from any ideas, methods, instructions or products referred to in the content.

