Article

Potential Use of IFMIF-DONES Target Back-Plate for Material Specimens

1
Institute for Neutron Physics and Reactor Technology (INR), Karlsruhe Institute of Technology (KIT), 76344 Eggenstein-Leopoldshafen, Germany
2
ENEA CR Brasimone, 40032 Camugnano, Italy
3
ENEA CR Bologna, Via Martiri di Monte Sole 4, 40129 Bologna, Italy
4
Research Centre for Energy, Environment and Technology (CIEMAT), 28040 Madrid, Spain
*
Author to whom correspondence should be addressed.
J. Nucl. Eng. 2022, 3(4), 385-397; https://doi.org/10.3390/jne3040025
Submission received: 28 October 2022 / Revised: 11 November 2022 / Accepted: 14 November 2022 / Published: 25 November 2022

Abstract

:
In the IFMIF-DONES facility of the future, the back-plate behind the Li target will receive strong irradiation from high-energy neutrons. The potential use of the back-plate for material specimens is attractive with respect to providing complementary irradiation data for Eurofer. In this work, DPA (displacement per atom) and gas production rates as well as DPA gradients and temperature distributions have been studied for the center segment of the back-plate, using both a nominal beam and a reduced beam footprint. It is shown that specimens can be produced with high DPA in similar conditions to the DEMO first-wall. Based on the size of the SSTT (small specimen test technology) specimens, the limited number of samples obtainable from the adopted arrangement scheme is driven by a major constraint: the thickness of the back-plate. A parametric study of the back-plate’s thickness provides an alternative arrangement scheme; thus, the DPA and gradient of the specimens are remarkably improved.

1. Introduction

The IFMIF-DONES (International Fusion Materials Irradiation Facility—Demo-Oriented NEutron Source) [1] is planned as an accelerator-based neutron irradiation facility aiming to provide irradiation data for the construction and safe operation of a DEMO fusion power plant and data for material modelling. It employs a deuterium–lithium (d+Li) neutron source driven by a deuteron accelerator (40 MeV and 125 mA) that strikes the liquid Li target and produces neutrons through stripping reactions. The target’s back-plate (BP), made of Eurofer-97 steel [2], is located immediately behind the Li flow. It is subjected to strong neutron irradiation of up to 1 × 10¹⁵ n cm−2 s−1 in flux and 30 dpa/fpy (displacement per atom per full-power year, Norgett, NRT model [3]) in its damage dose rate. Although the IFMIF-DONES has a High-Flux Test Module (HFTM) [4] to house material specimens, the available test volume with high DPA is limited. Therefore, the idea of cutting the BP into small specimens is an attractive proposal that has not yet been investigated.
In this paper, explorations of this proposal will be presented with high-fidelity Monte Carlo (MC) particle transport simulations for the BP. The geometry of the BP and the details of the simulations are presented in Section 2. The DPA rate, DPA gradients, and gas production values obtained from the simulation are evaluated and presented in Section 3. The specimen-cutting schemes and the usable volumes of the BP are discussed in Section 4 based on typical specimen dimensions of the small-specimen test technology (SSTT).

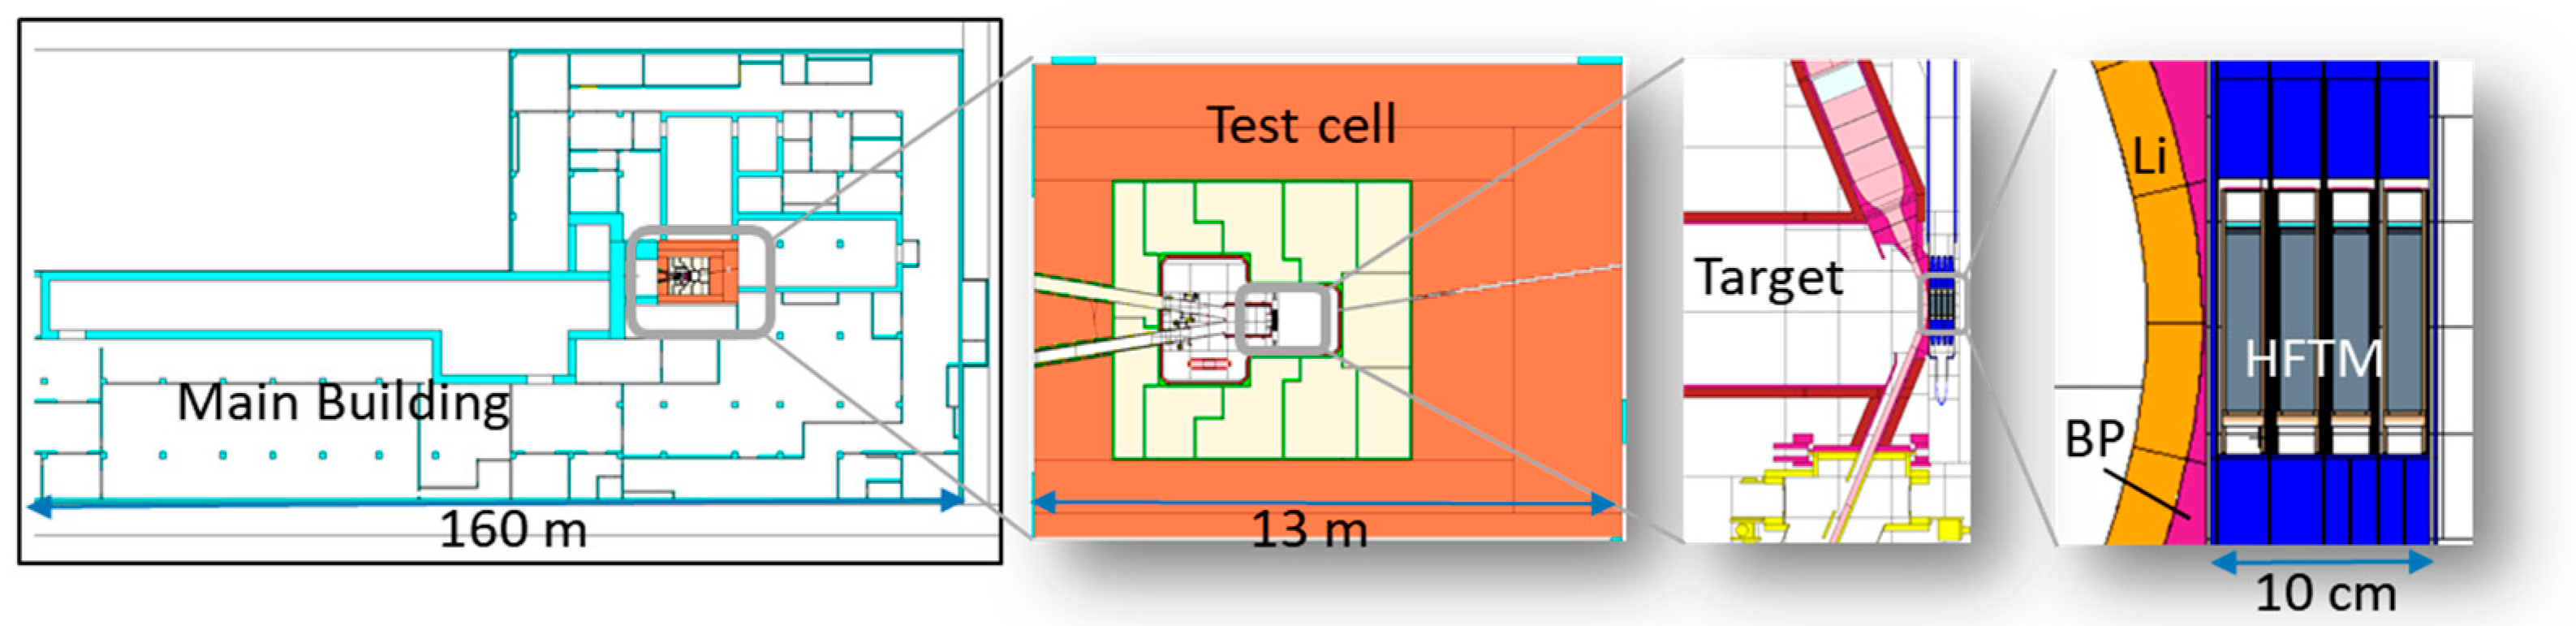
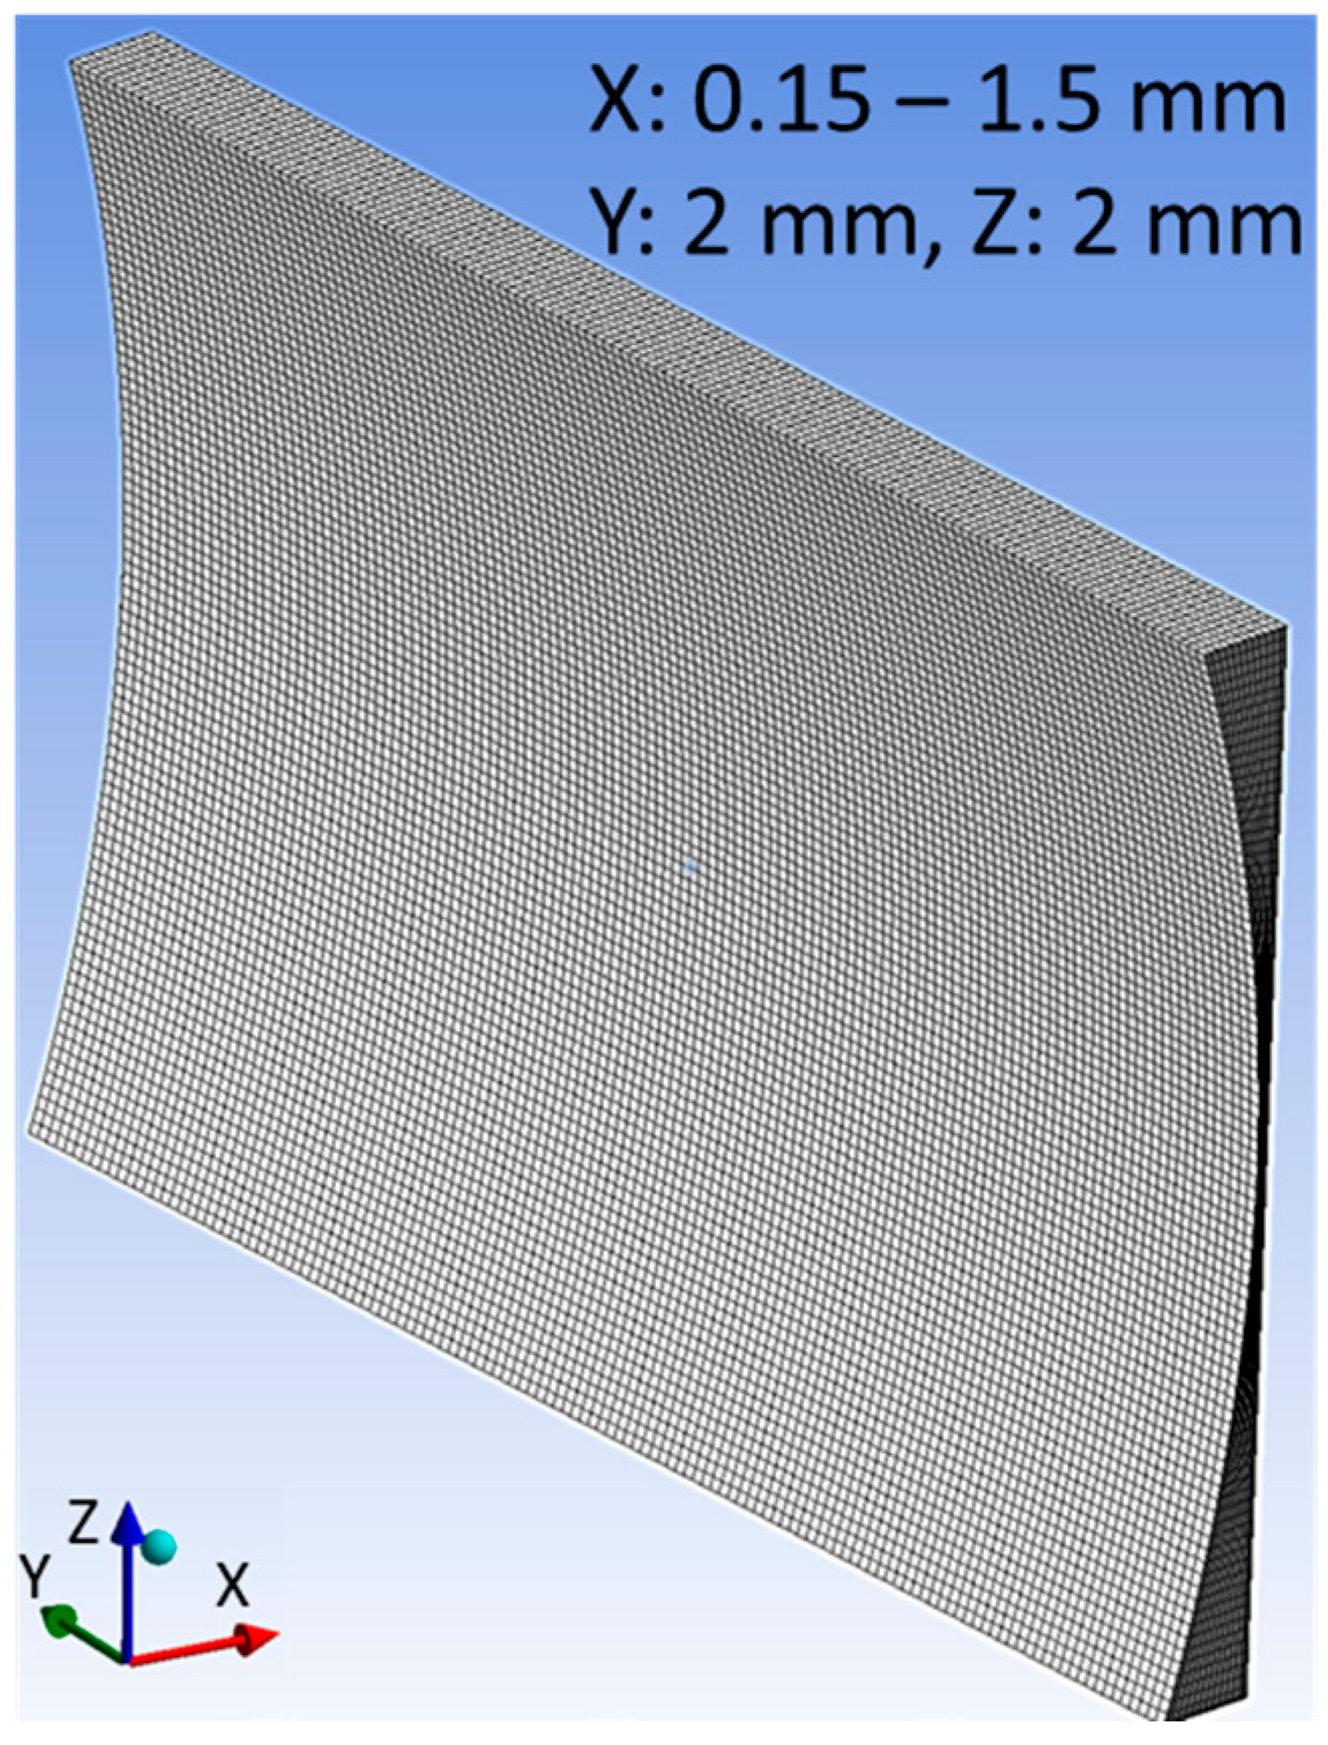
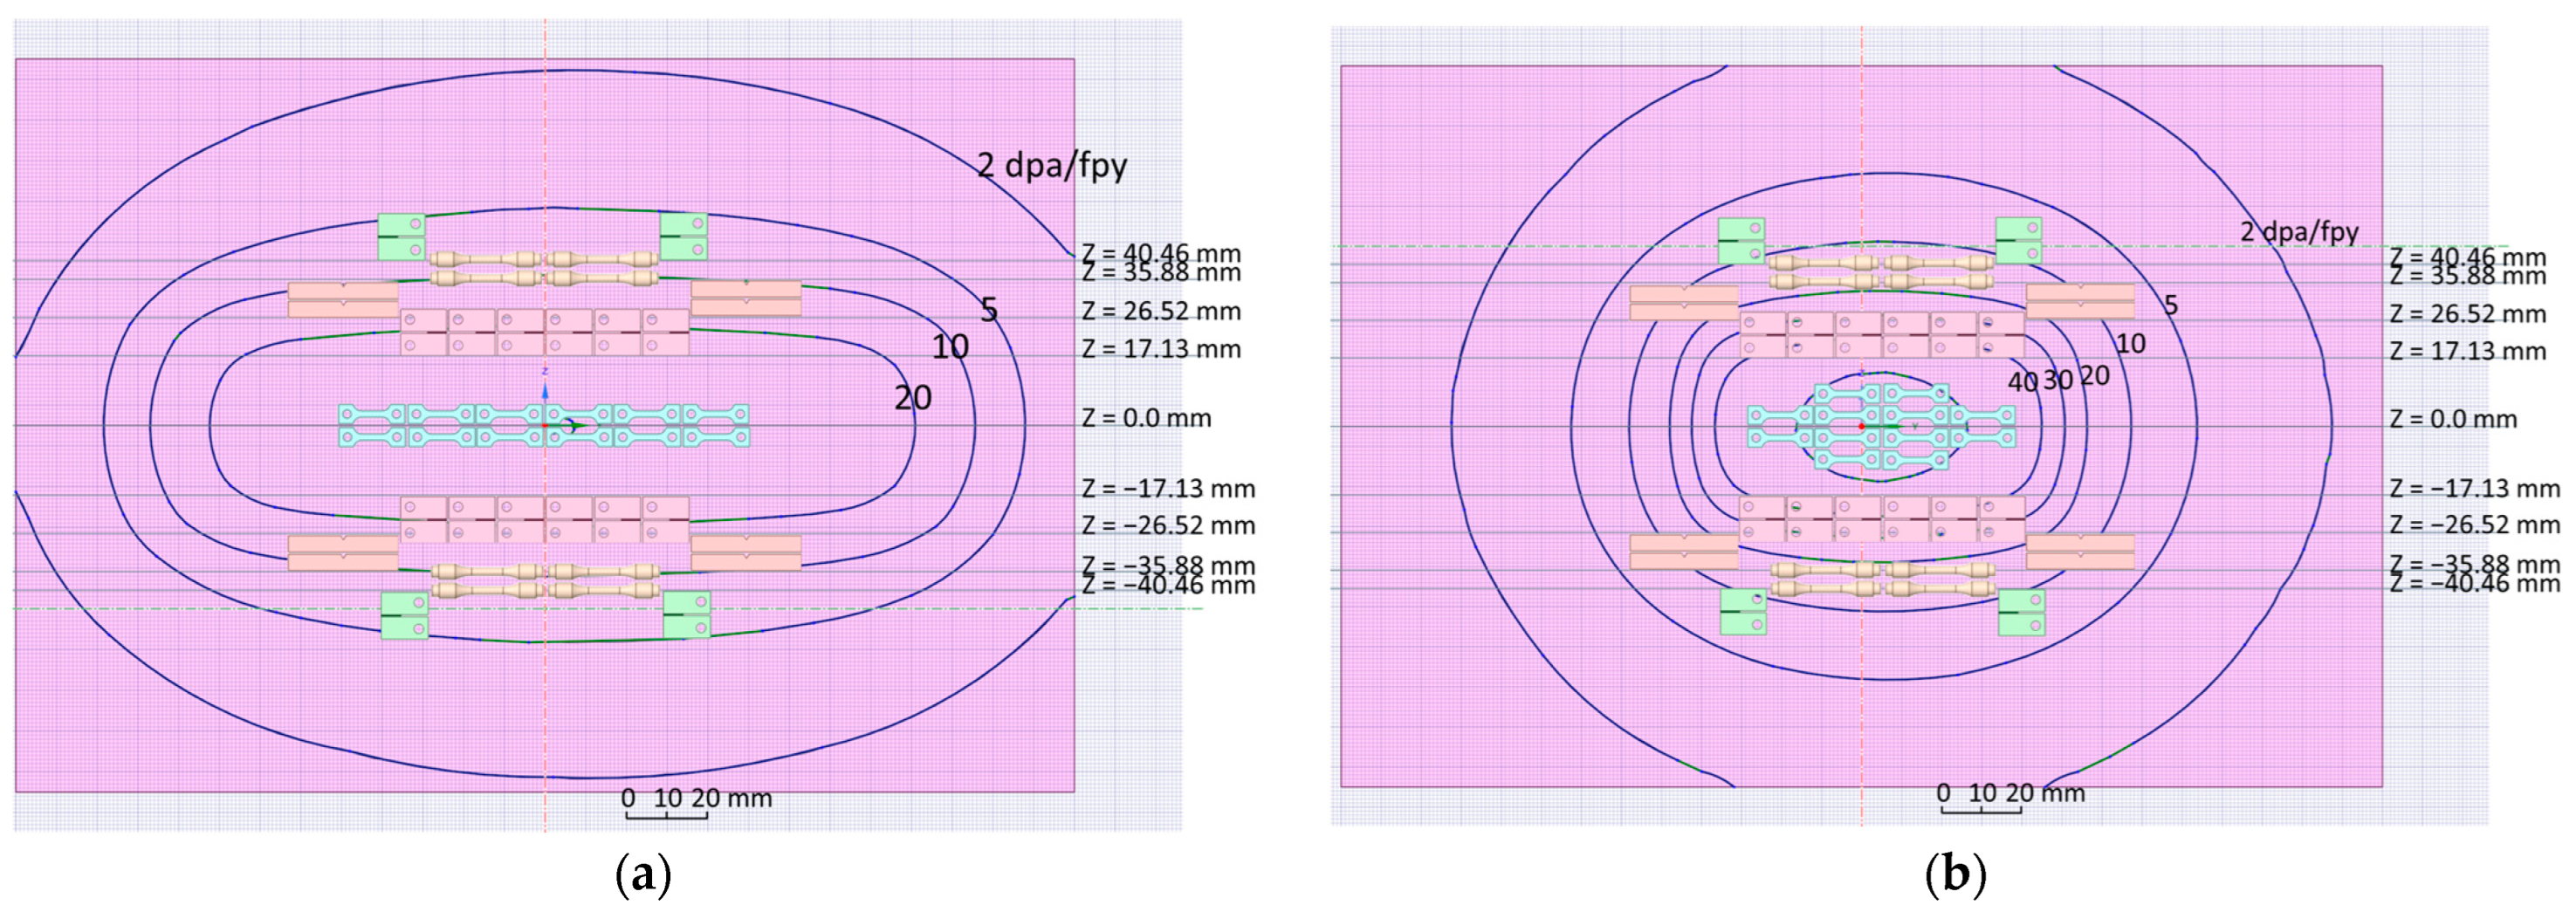
2. Simulation Models, Tools, and Data

The target assembly (TA) [5] shown in Figure 1 is located inside a massively shielded room called a Test Cell (TC), with the HFTM right behind it. The back-plate (BP) is an essential component of the TA, which creates a free surface for the high-speed (15 m/s) Li jet via the centrifugal force produced in the concavely curved channel formed by the BP itself. The Li flow is designed to cool the high thermal flux from the deuteron beam with an inlet temperature of 300 °C and a temperature increase of less than 50 °C. The thickness of the Li film will be stably maintained at ~25 mm to fully stop the deuteron beam, thereby stopping the beam from directly impinging the BP. The BP is welded to the main body of the TA and exposed to the strongest neutron and gamma fluxes from the neutron source.
The whole BP component has a material volume of 8800 cm3 overall, while the thickness (in the X direction shown in Figure 1) of 0.18 cm for the beam footprint area is small to reduce neutron absorption. This work focuses on a high-DPA segment of the BP shown in Figure 1 (slightly larger than the nominal beam footprint area of 20 cm × 5 cm), which covers an area of the full width of the flow channel and a height of ±9 cm at the BP’s center. Although the volume of this segment (318 cm3) is not large, it is considered meaningful since the total irradiation volume of the HFTM is only ~860 cm3 for the 16 central capsules [6].
A neutronic model of the particle transport code MCNP [7] has been used, which consists of a detailed geometry of the TA, HFTM, and the surrounding TC shielding (see Figure 2). It was generated by the engineering CAD model employing the CAD-to-MC geometry conversion tool McCad [8]. The McDeLicious code [9], which is an extension of MCNP version 6.2 with the ability to simulate the deuterium–lithium neutron source based on evaluated d + 6,7Li cross sectional data [10], was employed for the calculations. The neutron cross section library FENDL-3.1d [11] has been used for the neutron transport calculations. To calculate the displacement damage of the Eurofer steel, dedicated displacement cross sectional data based on the NRT model were used [12], which are recommended as the reference data for the design analysis of the European DEMO project and the IFMIF-DONES project [13,14].
Superimposed mesh tallies were established, covering the high-DPA segment of the BP. They have fine resolutions of 0.05 cm × 0.2 cm × 0.1 cm in the X, Y, and Z directions, as shown in Figure 1, particularly in the X direction, which is meant to capture the curvature of the BP. The neutron fluxes were multiplied with the Eurofer displacement cross section internally in the MCNP code, producing a DPA map that assumes Eurofer covers the whole mesh. This approach avoids the unphysical value produced at the curvature boundary, where the mesh cells are mixed with Eurofer and Li. An additional interpolation approach was employed to map the DPA from the mesh tally to the BP geometry, which will be discussed in the next section. Besides DPA, the helium and hydrogen productions were calculated with the same mesh as DPA. Two deuteron beam footprints—the nominal 20 cm × 5 cm footprint (“20 × 5”) and reduced 10 cm × 5 cm (“10 × 5”)—were used for this simulation, as shown in Figure 3, which are so-called “IFMIF/EVEDA” beam footprints [9]. The “10 × 5” footprint is the “20 × 5” footprint scaled by half on the horizontal beam width.

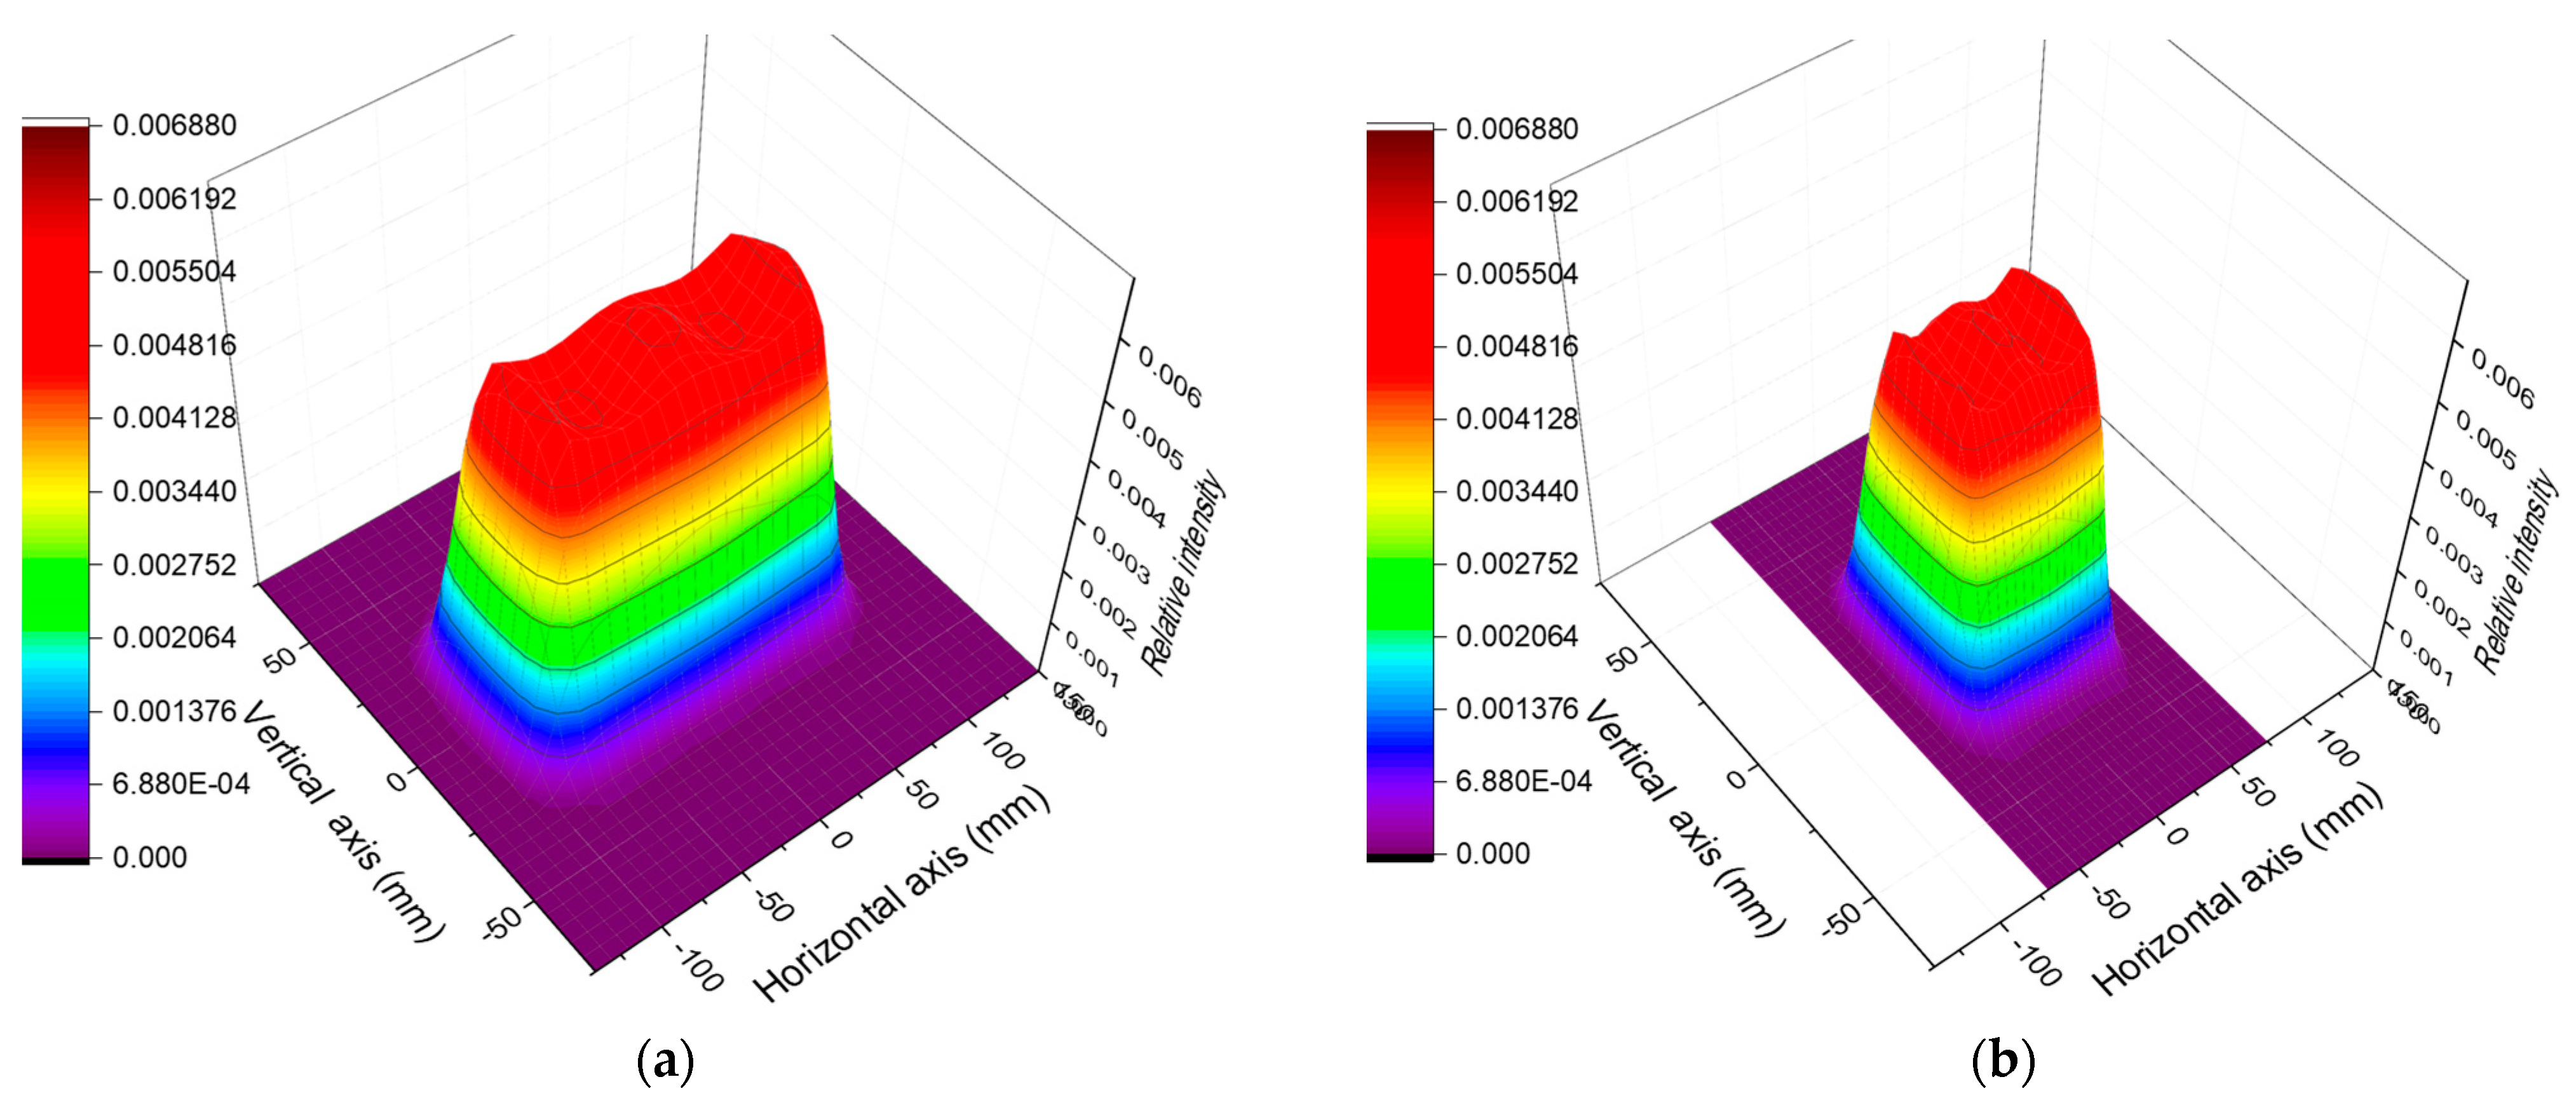
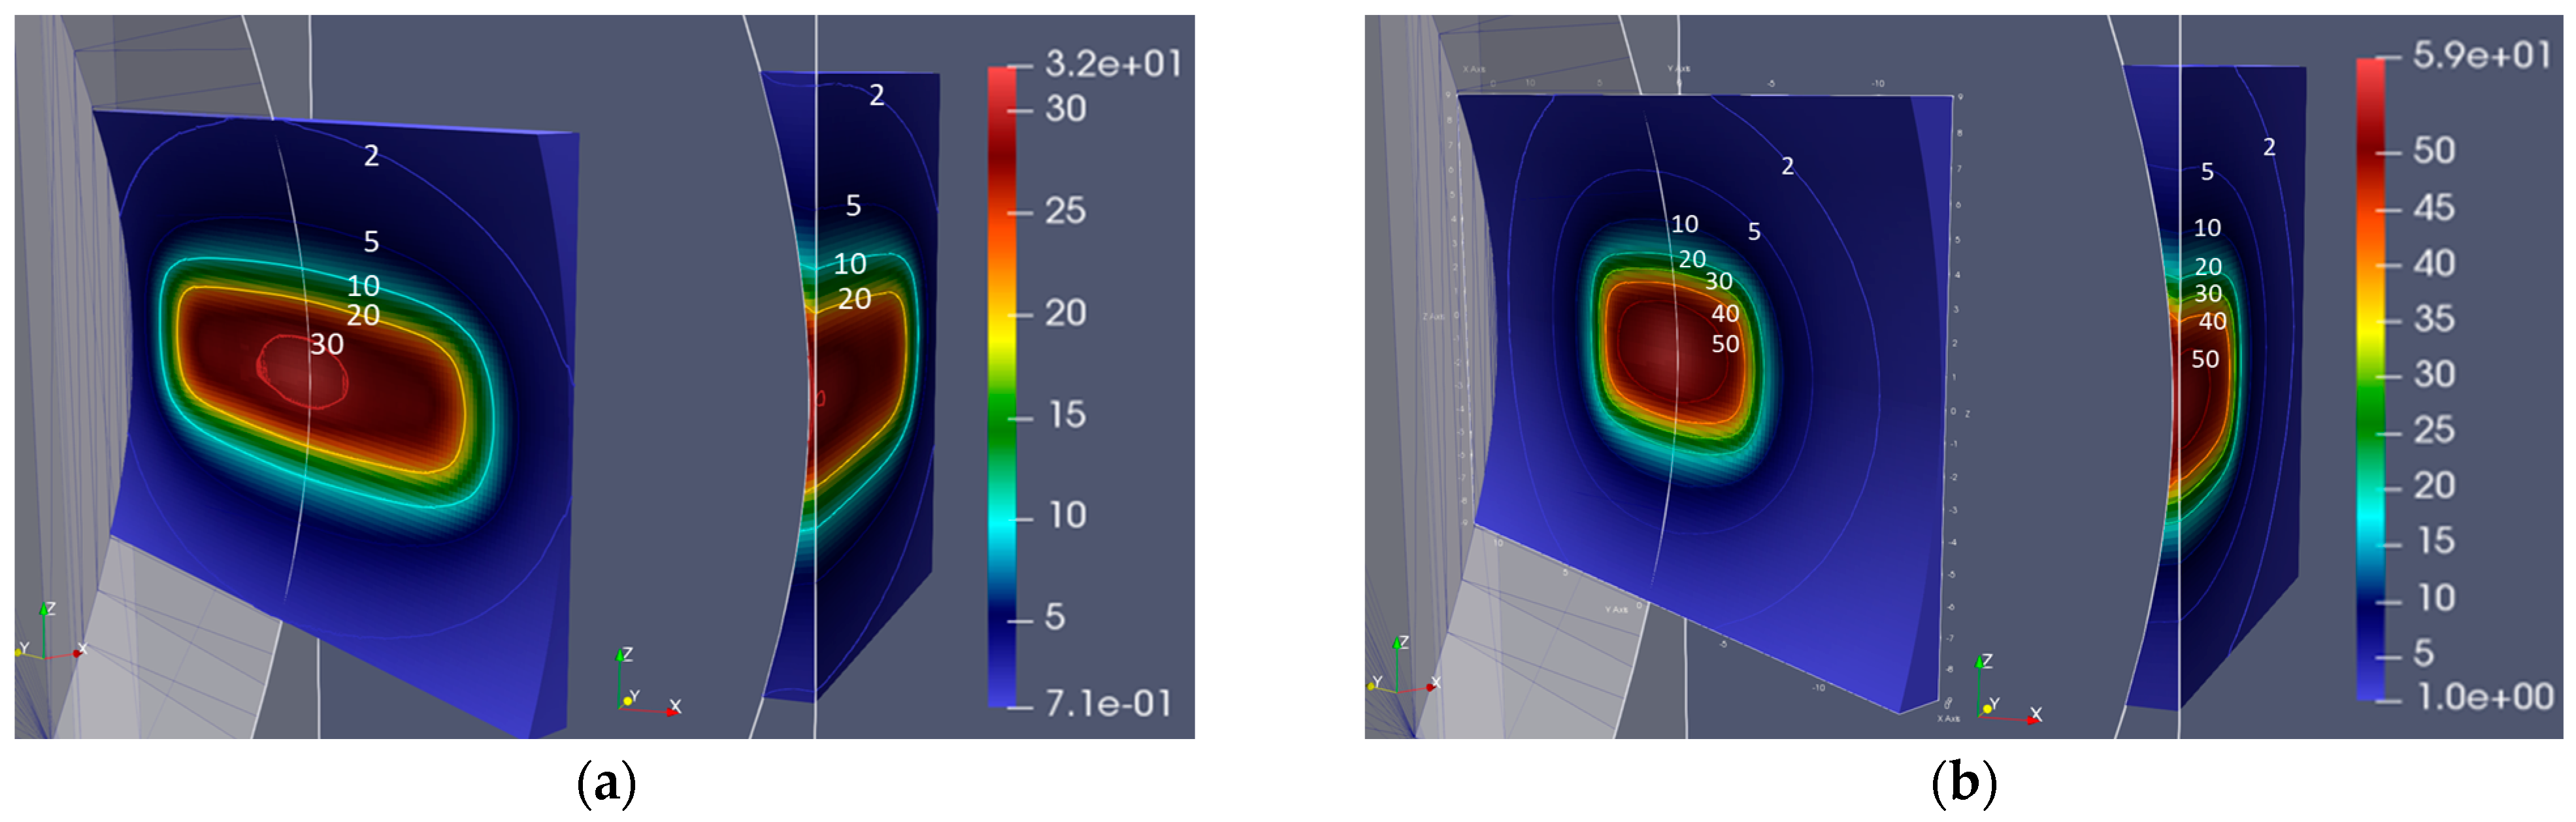
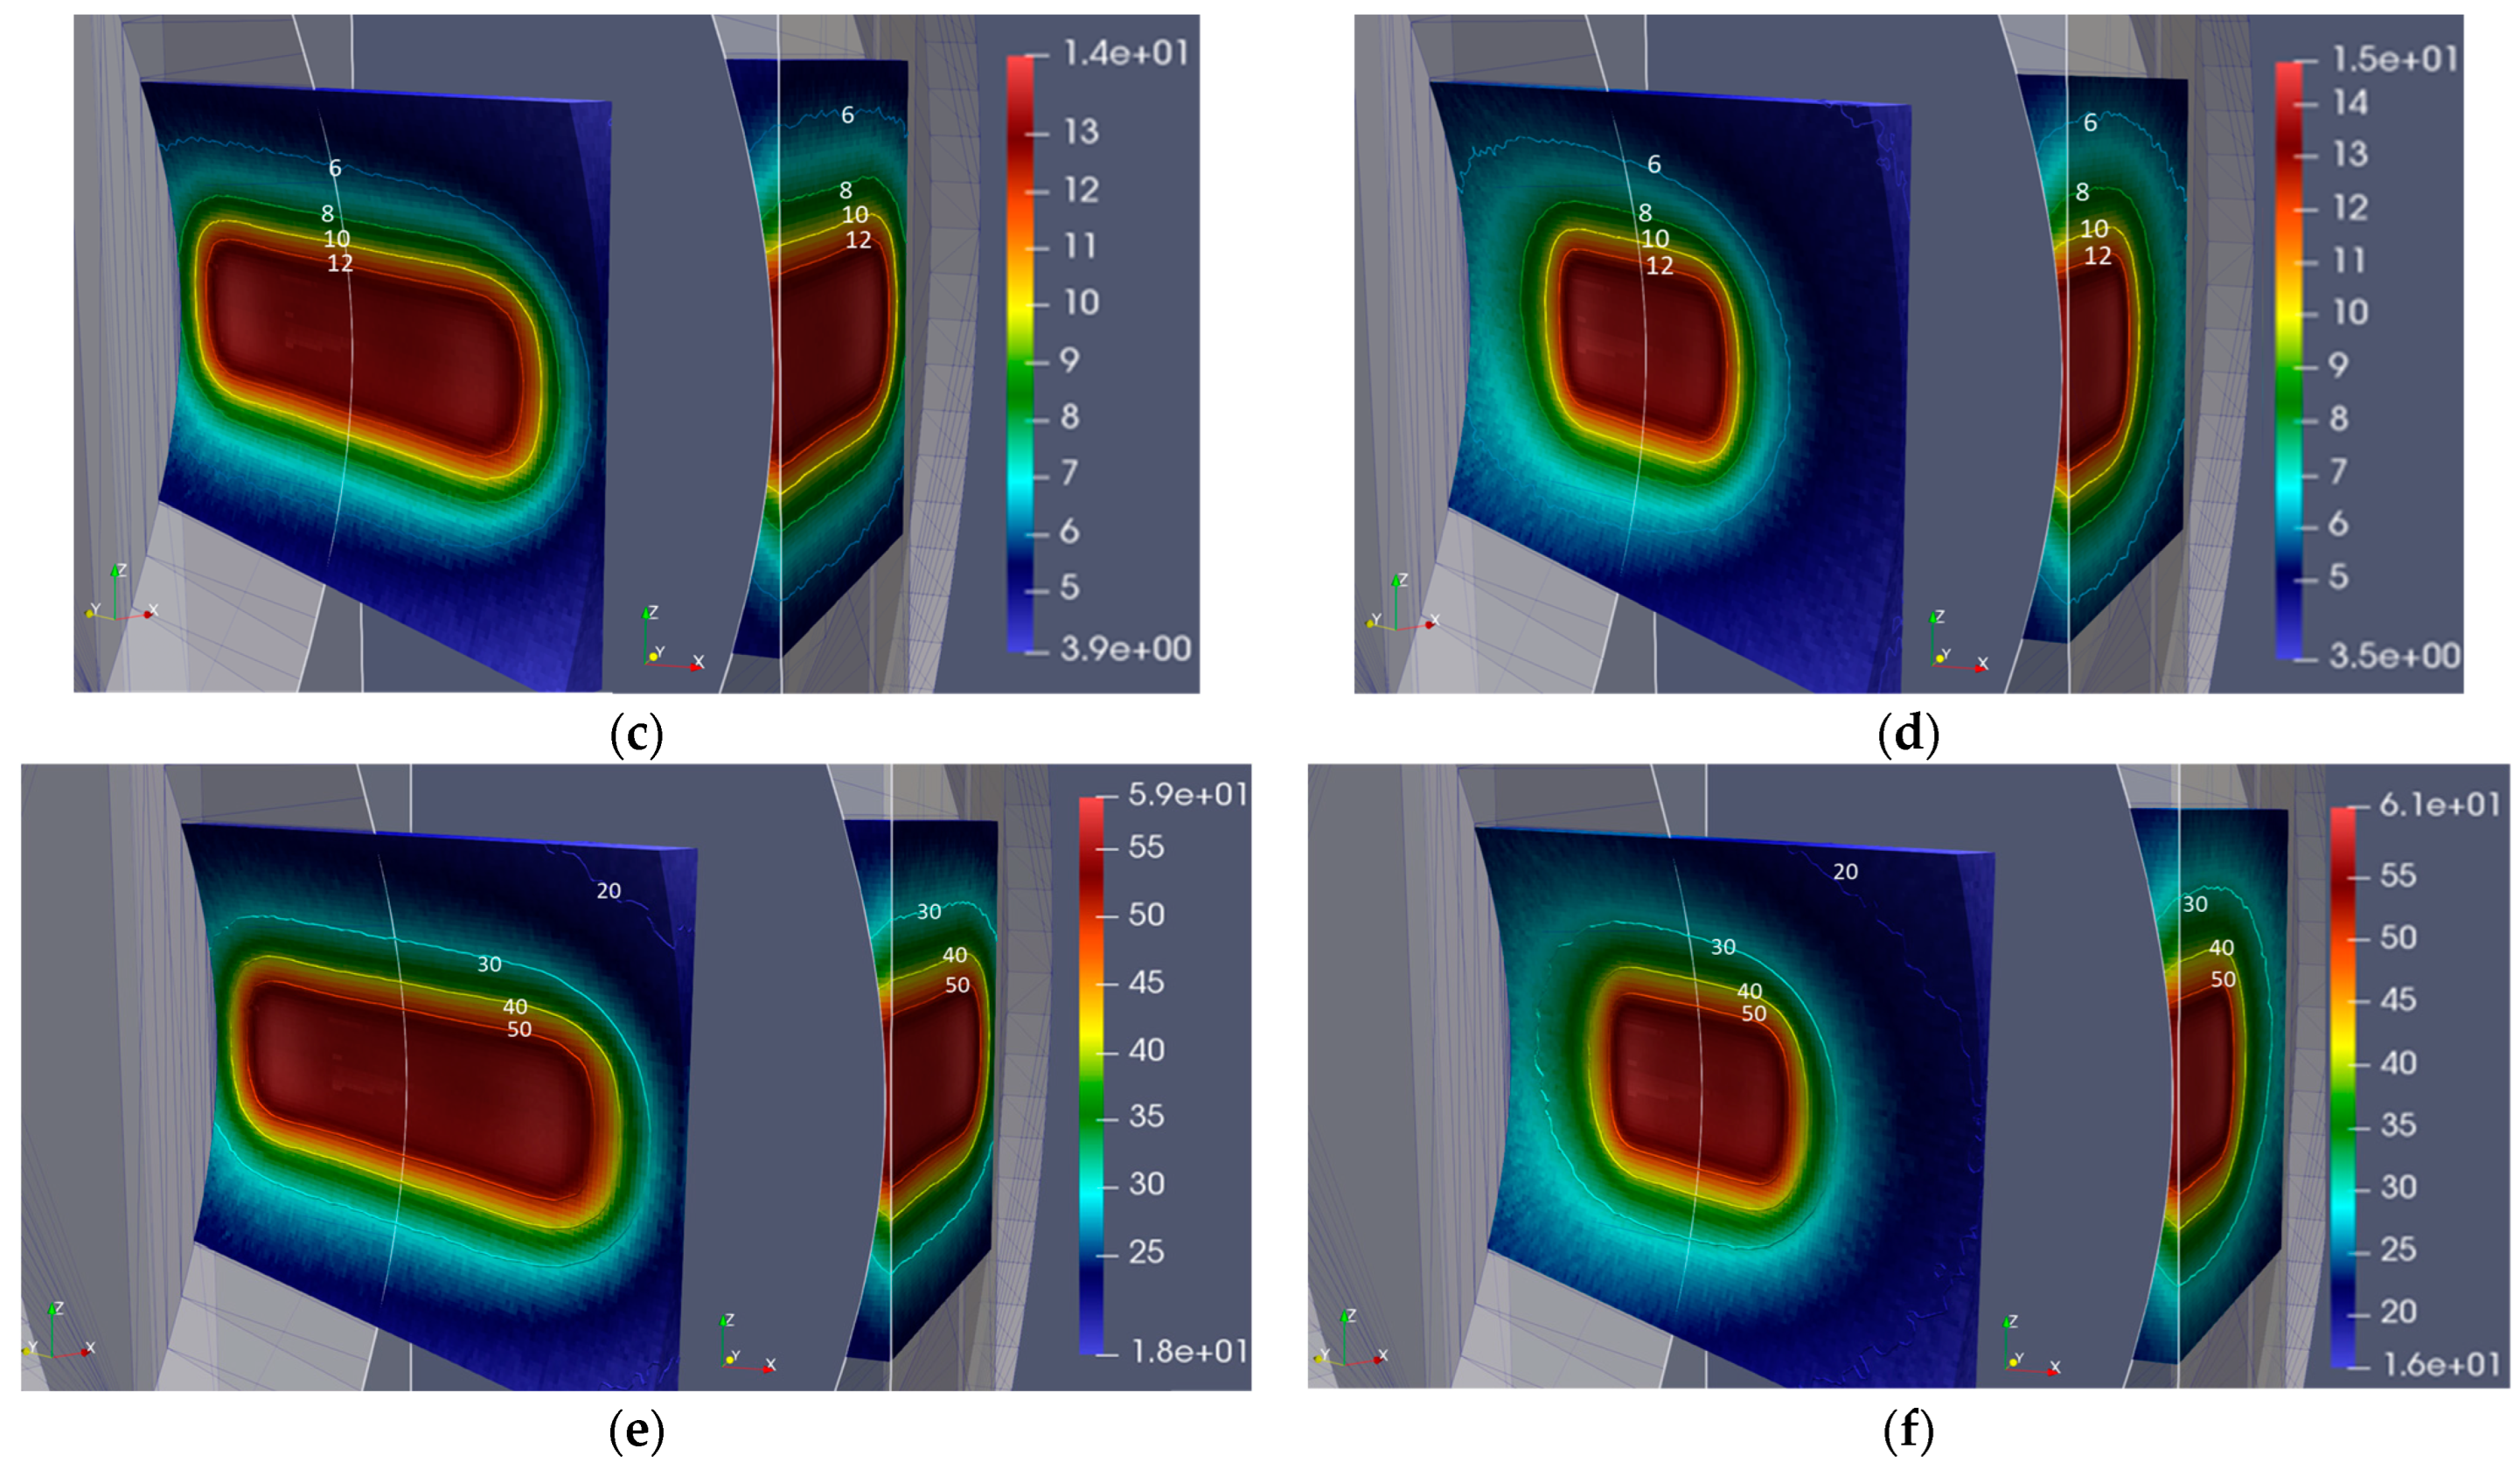
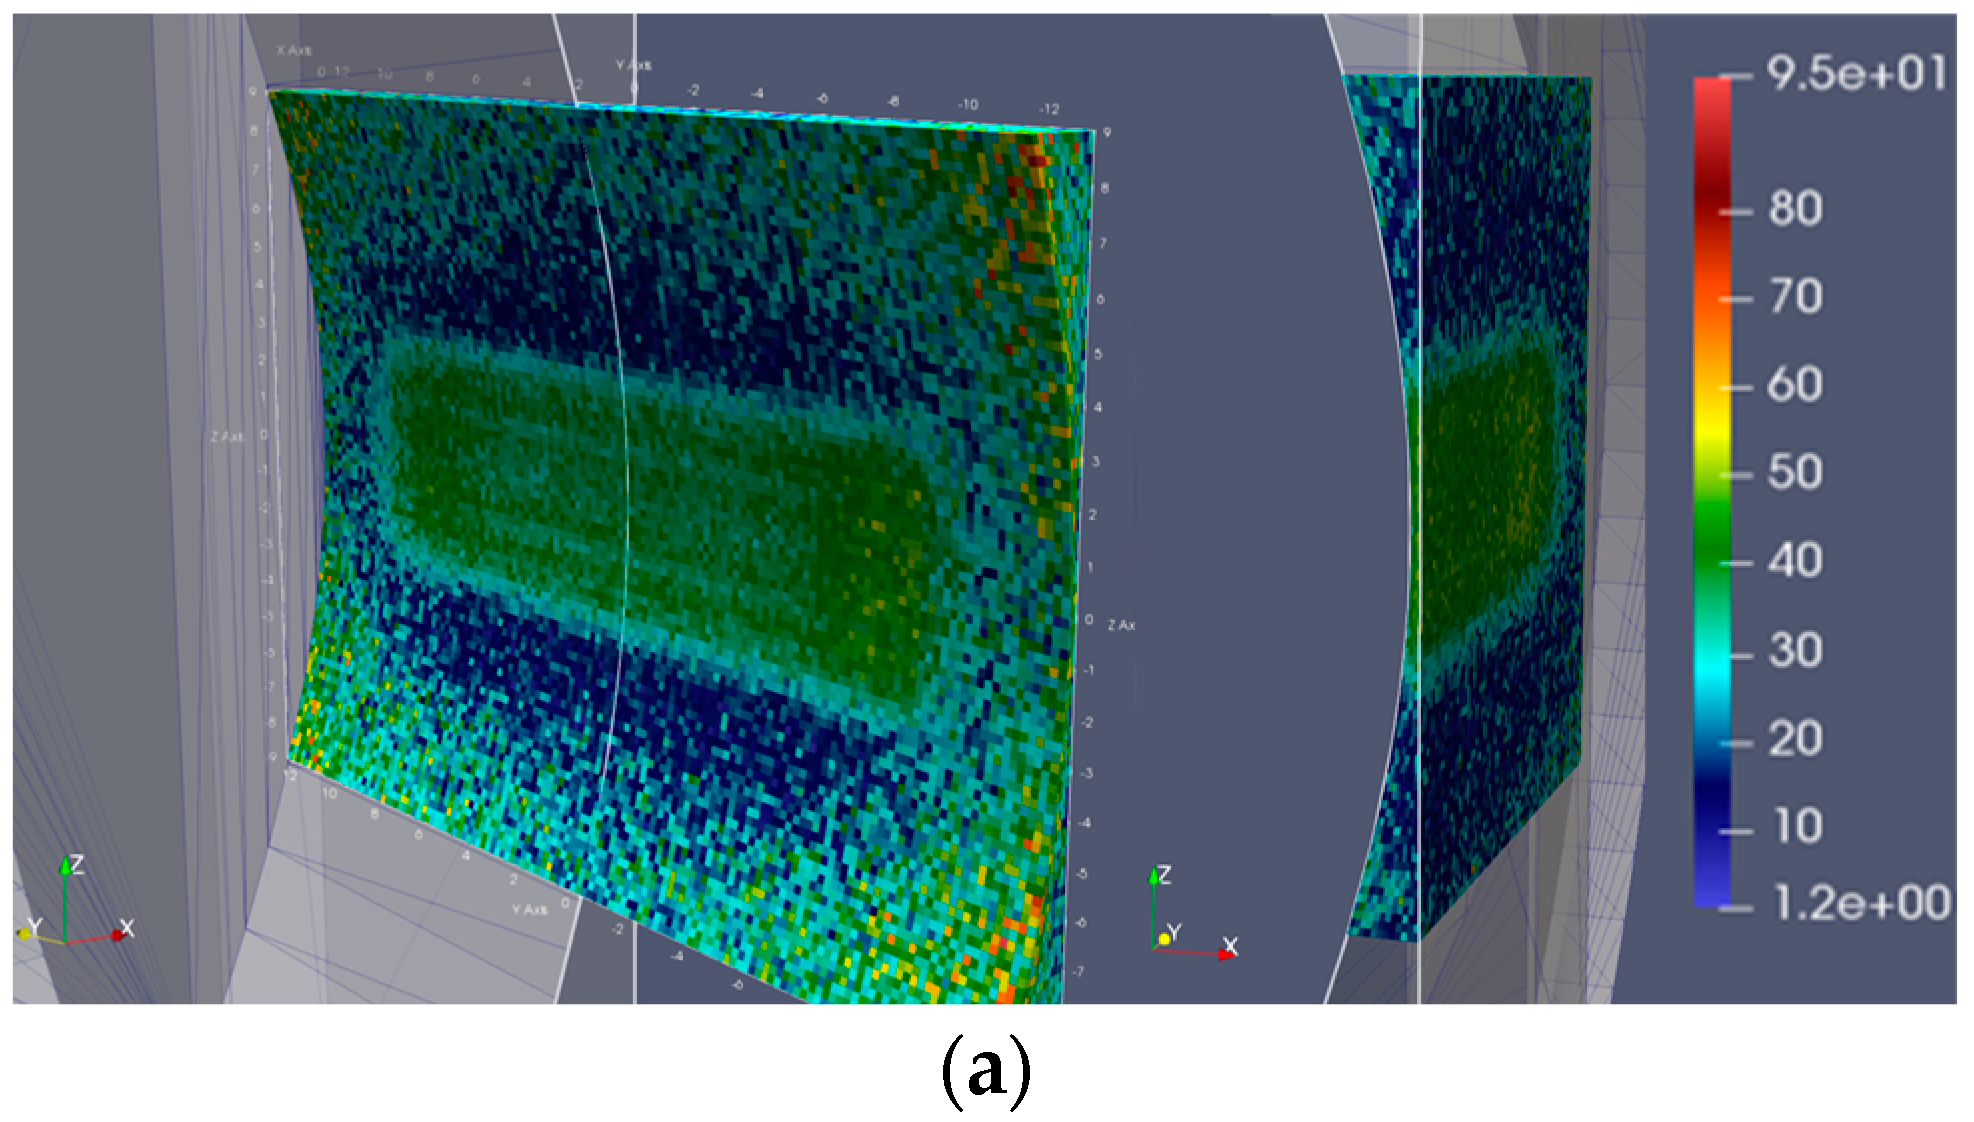
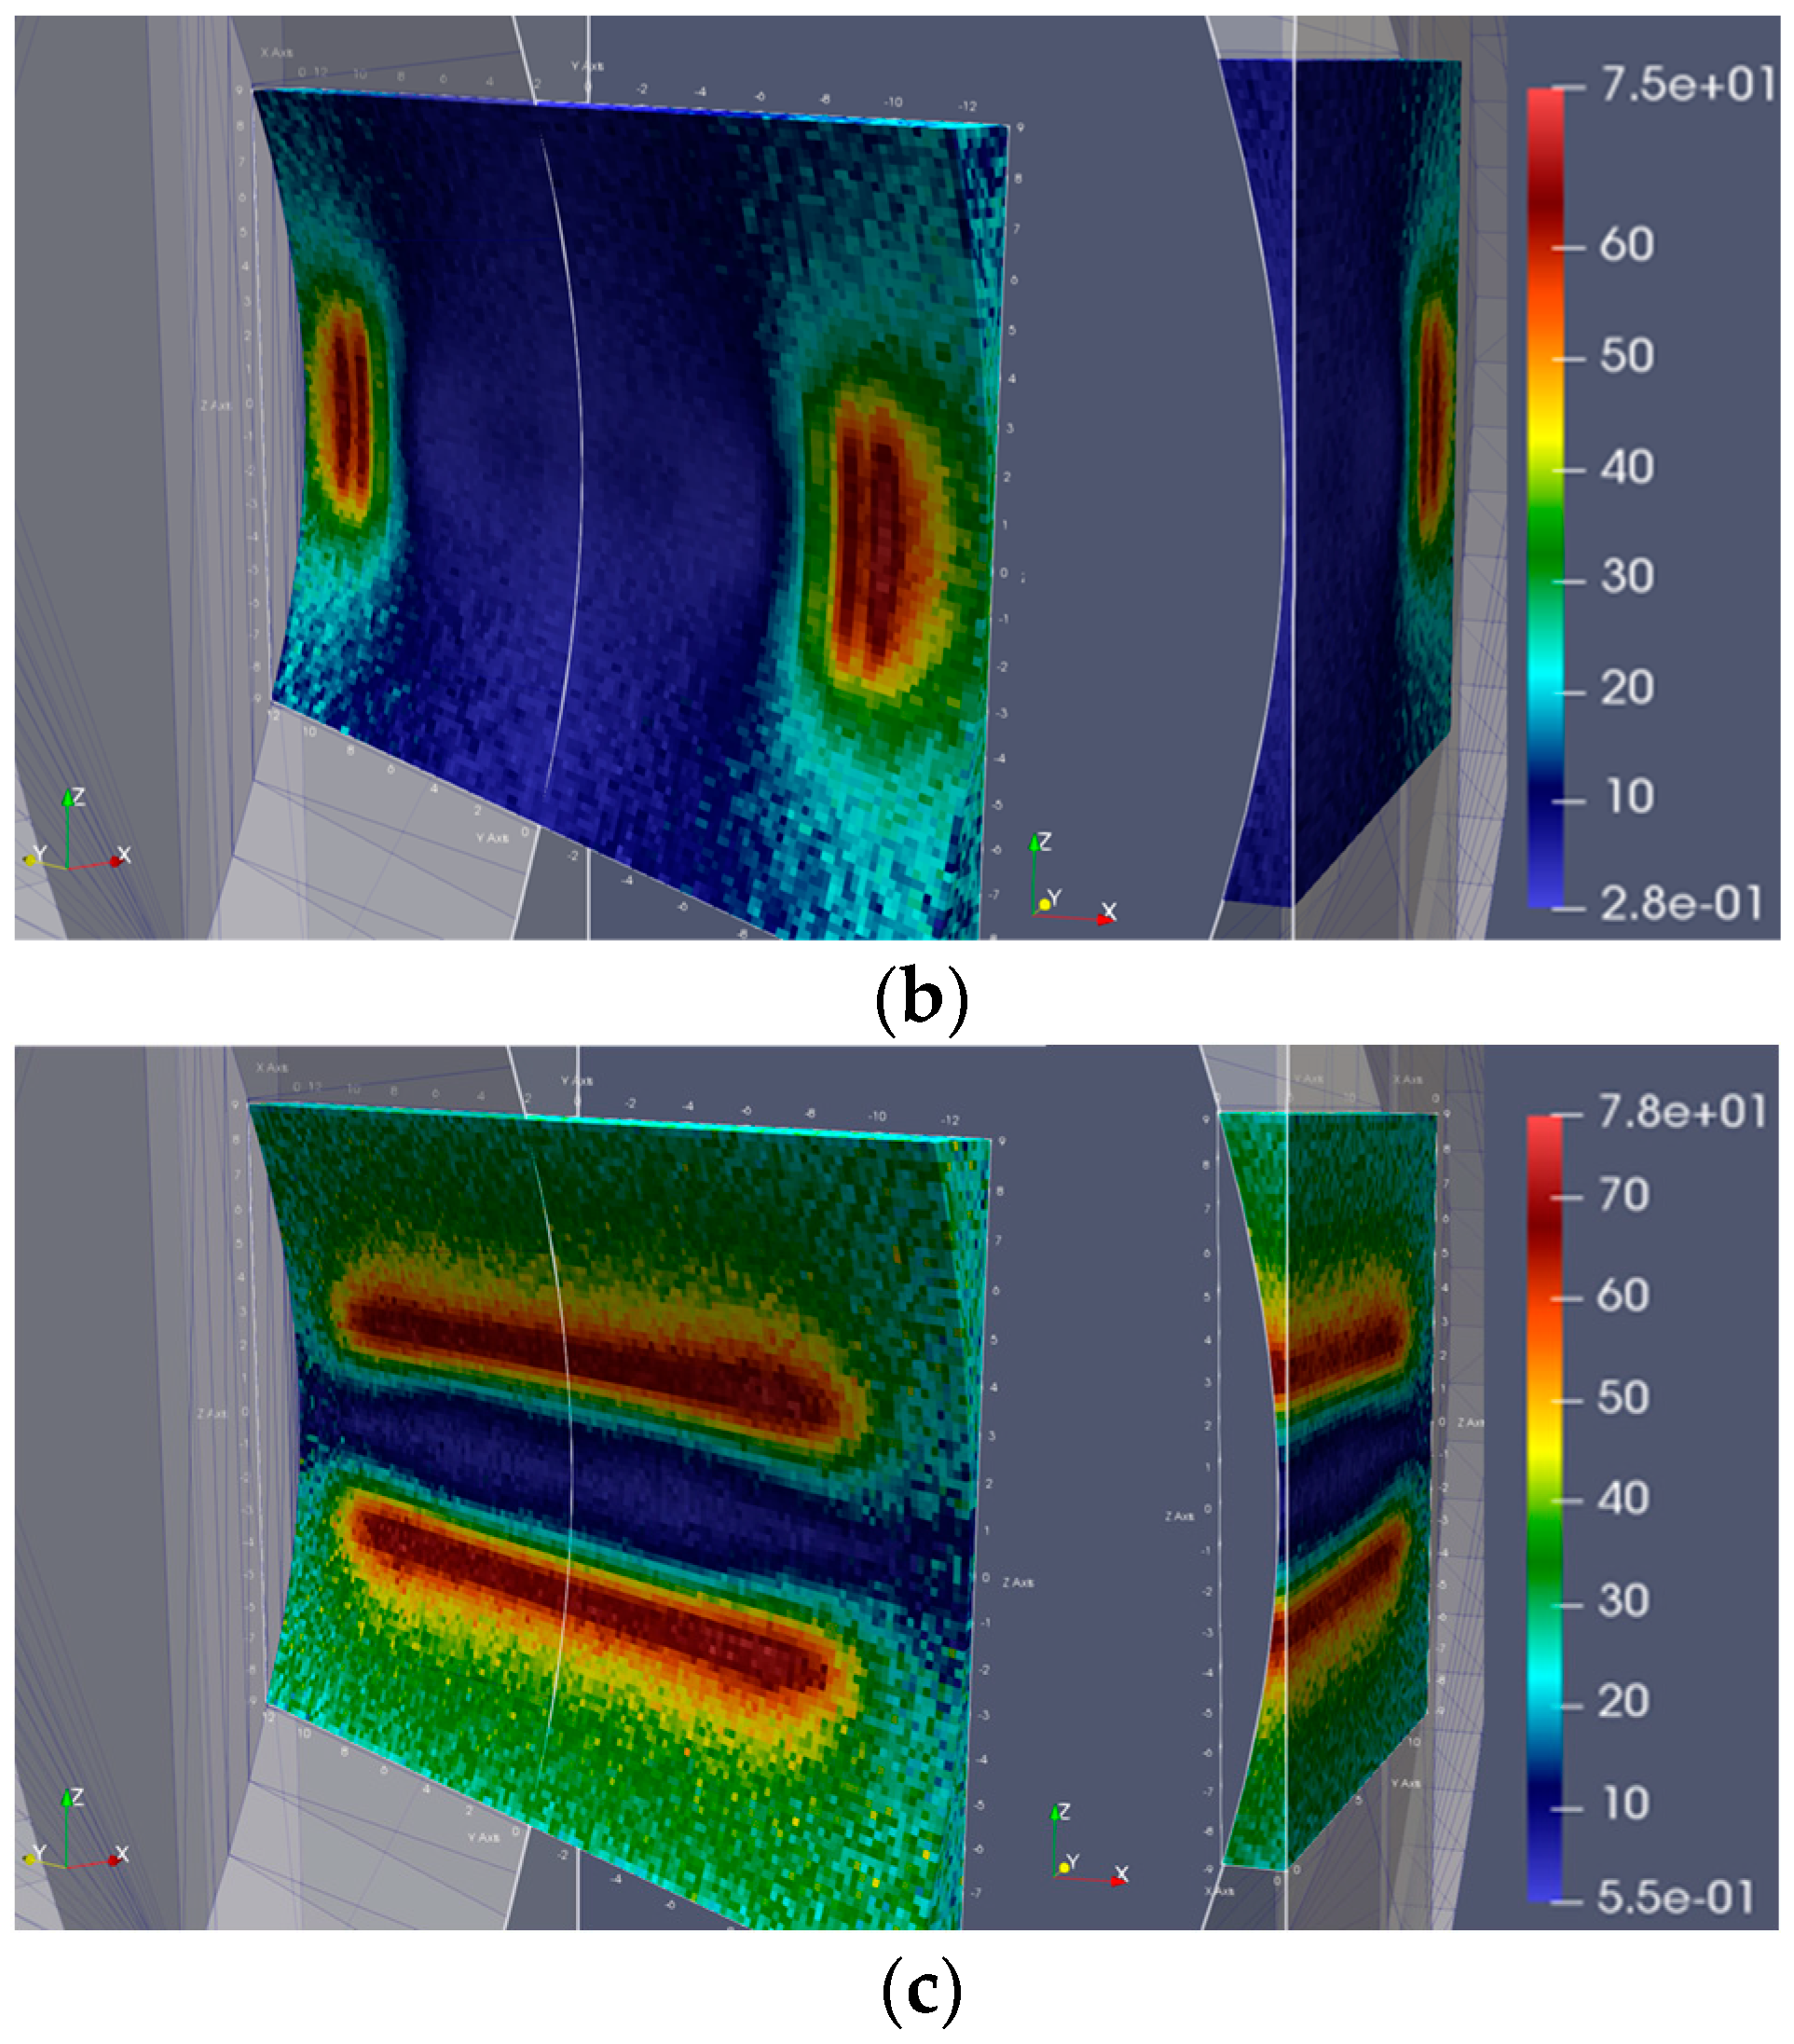
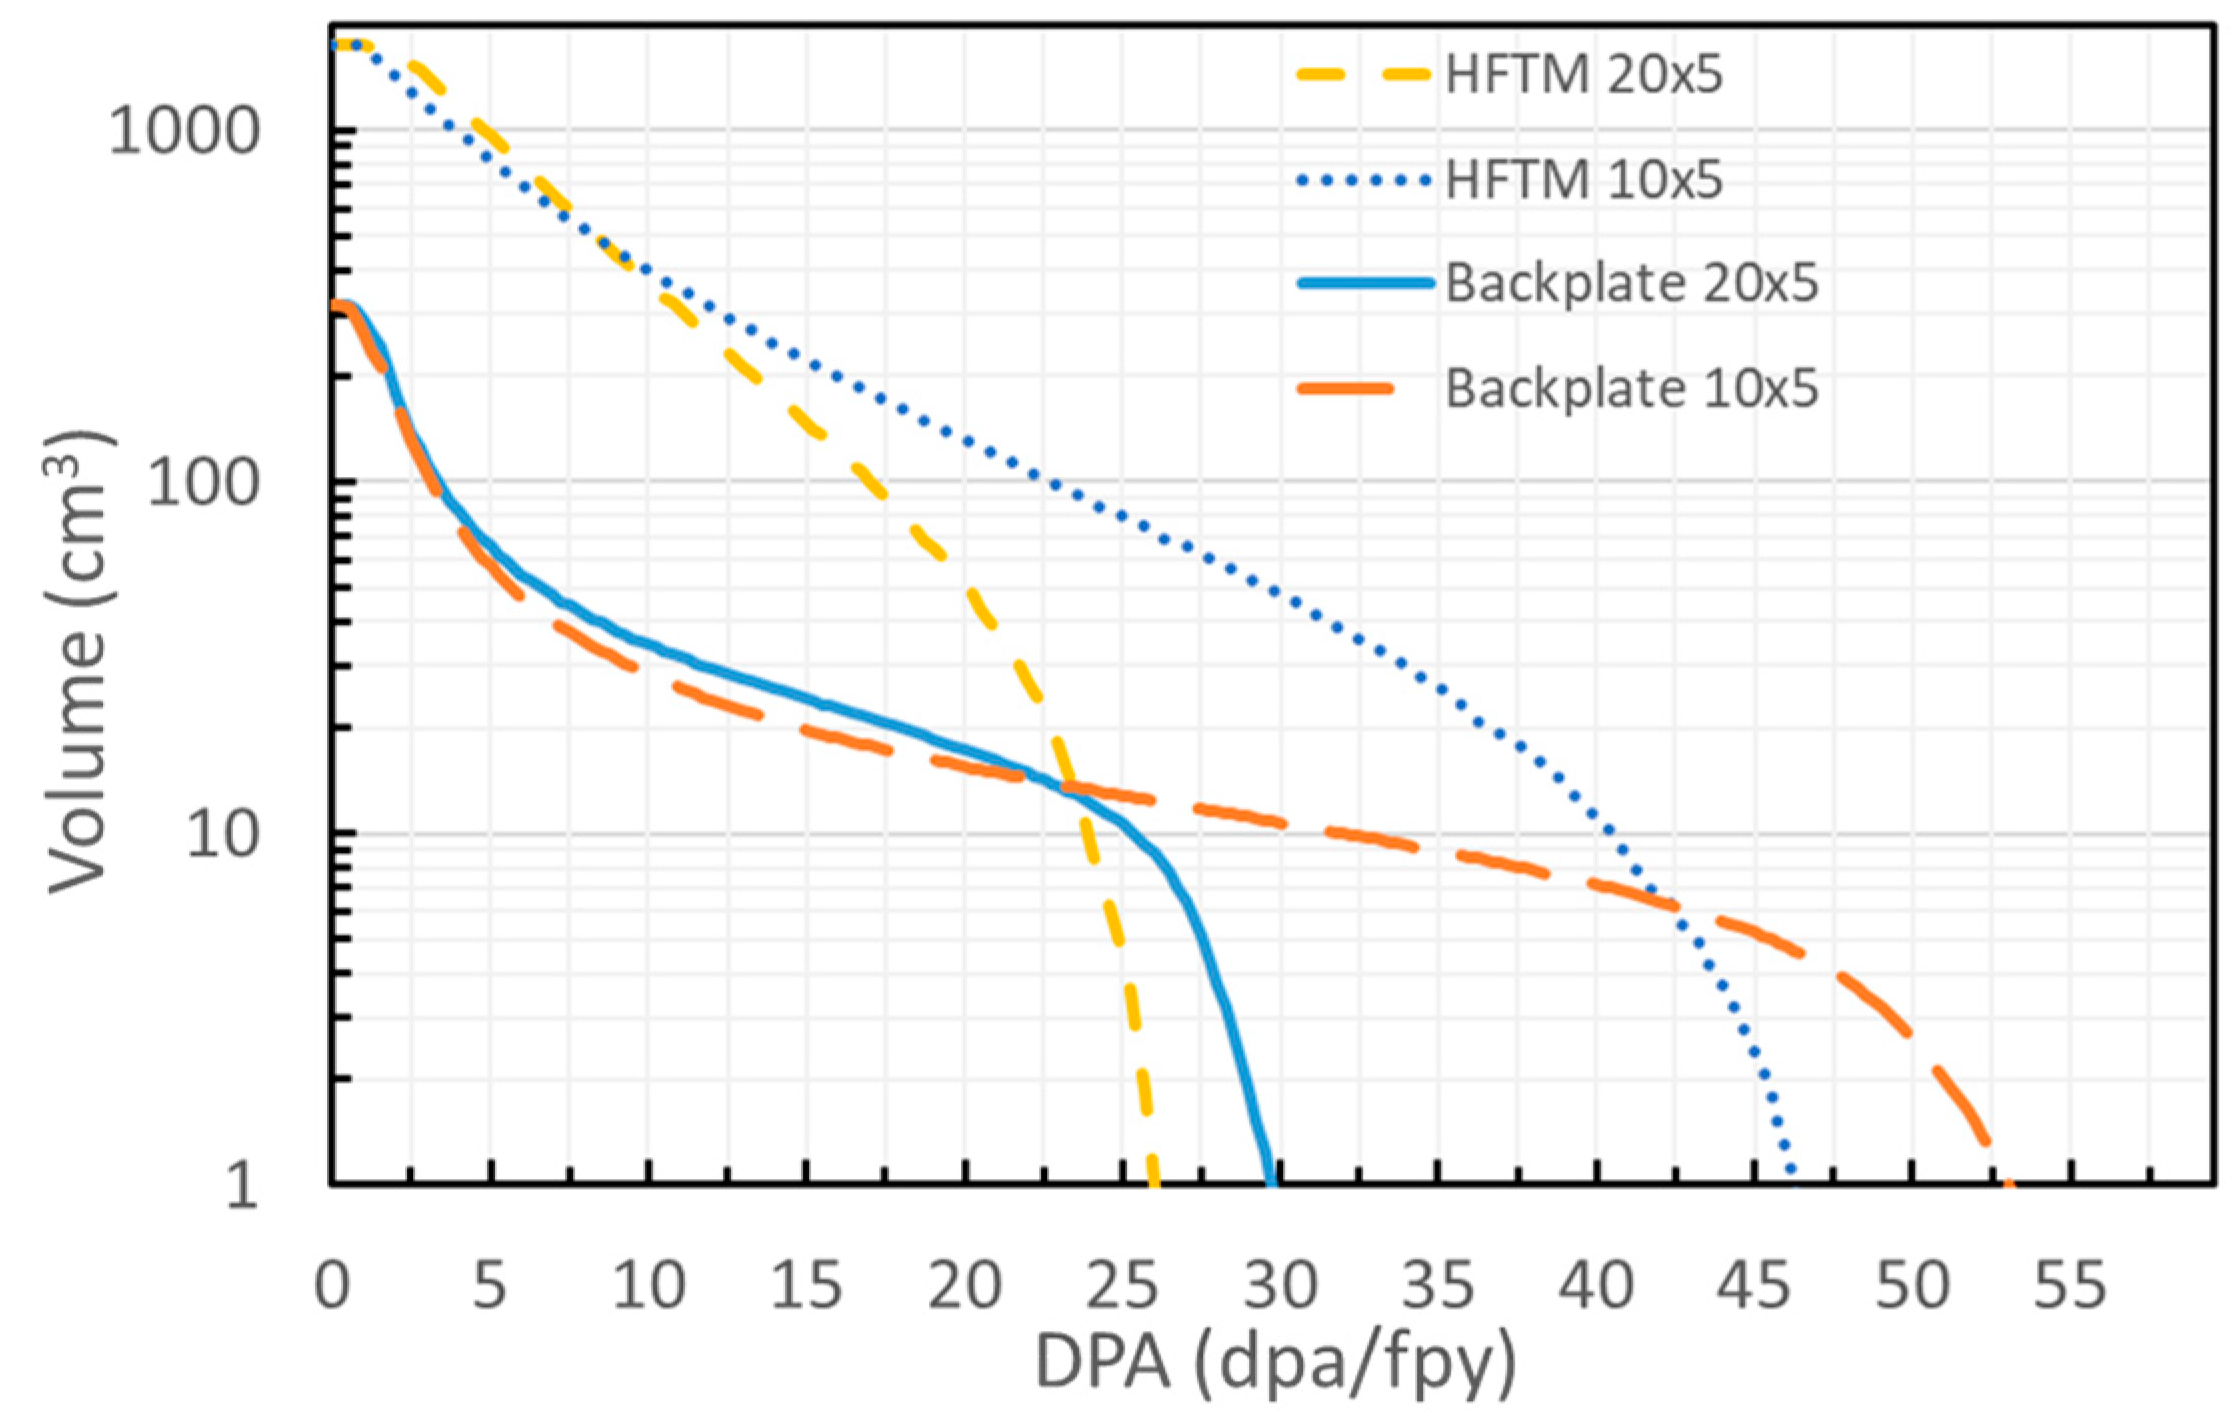
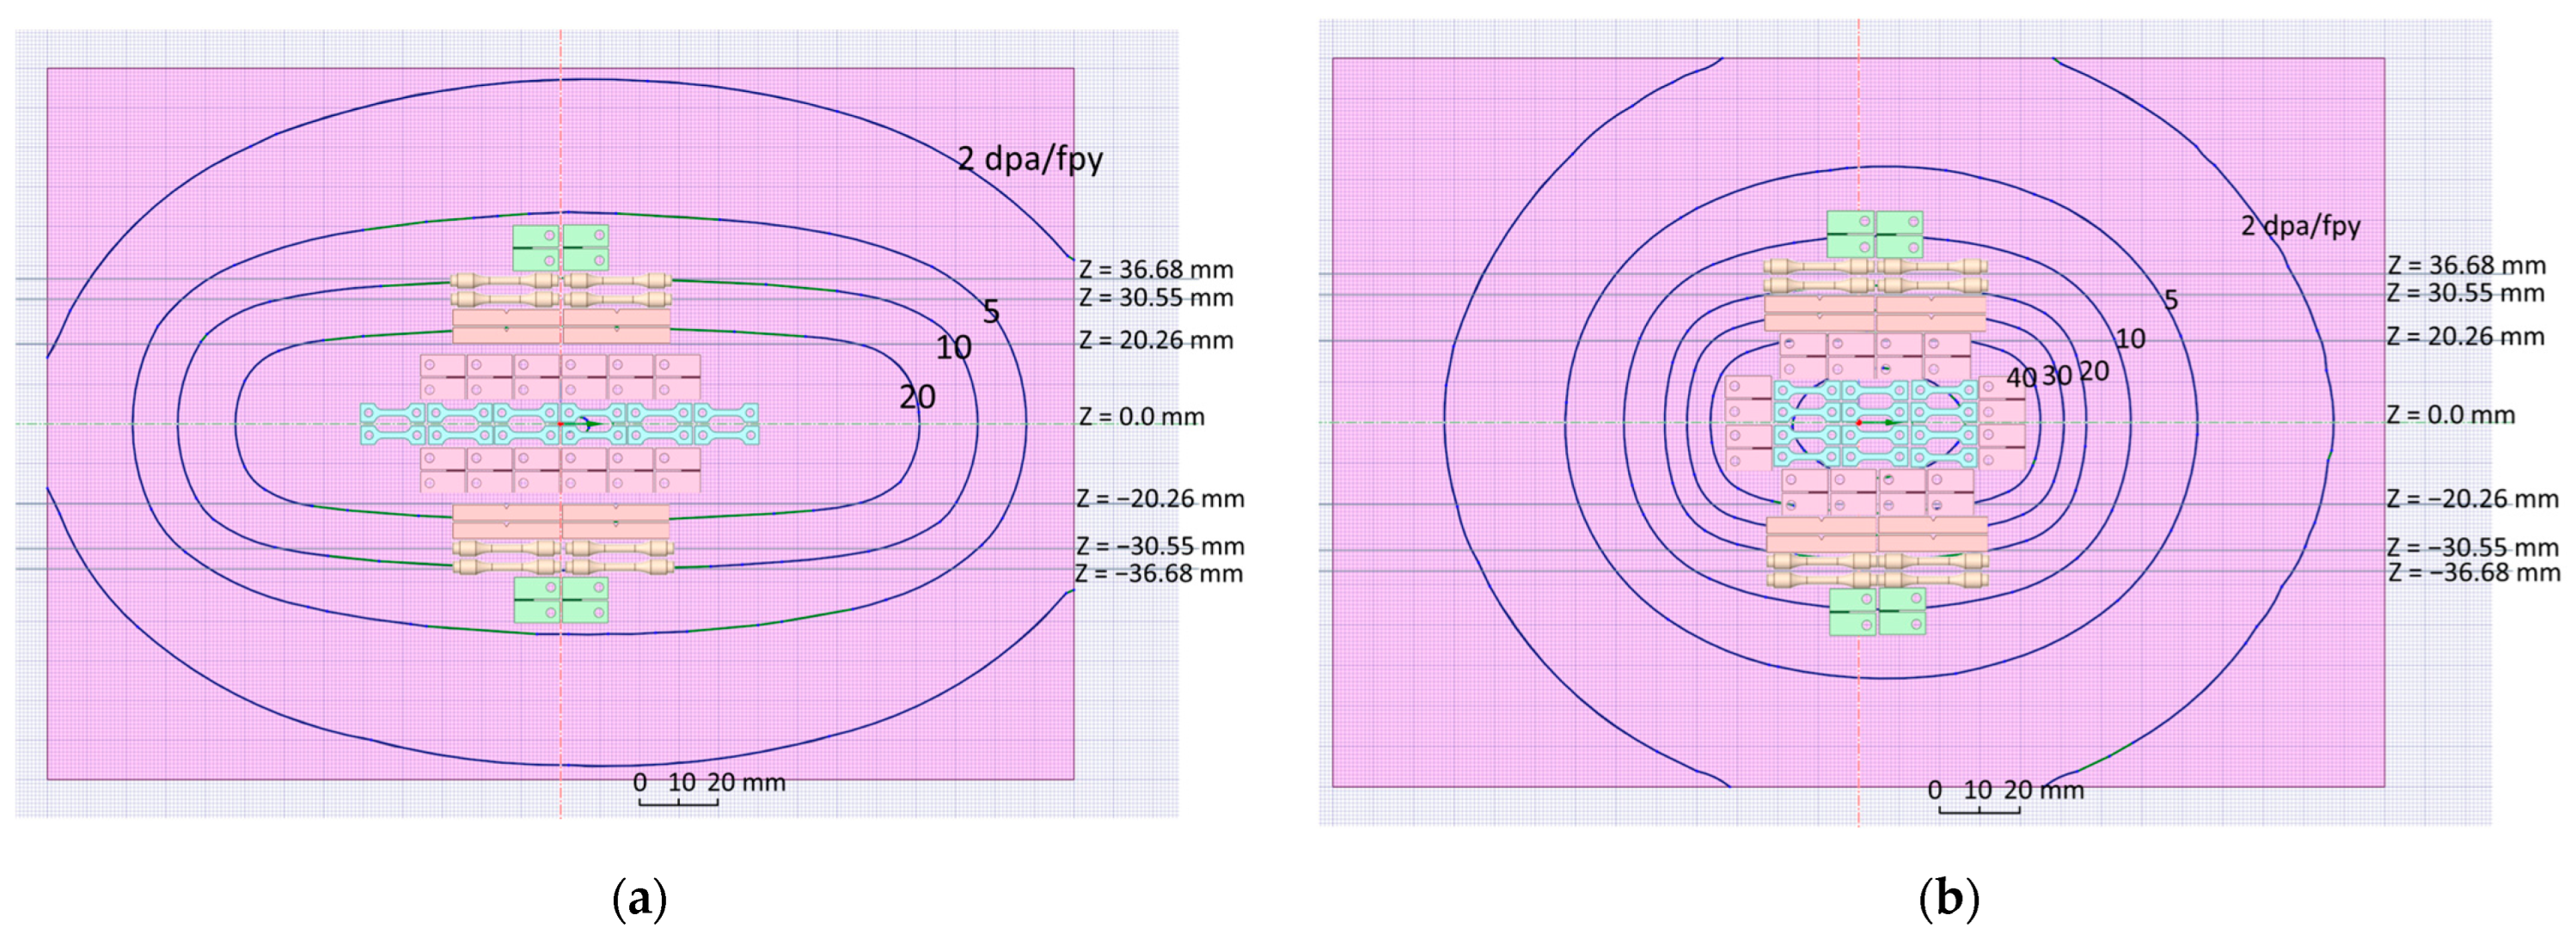
3. Simulation Results and Discussion

The MC simulations were executed on the supercomputer MARCONI hosted at the CINECA computational center in Italy. A total number of 2 × 10⁹ particle histories were sufficient for lowering the relative errors of the whole mesh to <2%. The neutron spectra under the two footprints are provided in Figure 4. The isometric view of Figure 5 at the central region provides damage rates higher than 30 dpa/fpy, and the cut-view shows values as high as 40 dpa/fpy with a maximum value for Li. Since the DPA values in Li are not meaningful, the data on the BP had to be extracted using a data-mapping approach.
This approach requires an unstructured mesh of the high-DPA segment so that the DPA data can be mapped from the rectilinear mesh to the unstructured mesh. The unstructured mesh was generated using the ANSYS Workbench® software version 2022/R2 (Figure 6). It is a hexahedral mesh with one hundred forty-two thousand first-order hexahedral elements. The data interpolations were performed using the McMeshTran code [15], in which the value on the target mesh (ANSYS mesh) was interpolated from the source mesh (MCNP mesh) based on the overlapped volume.
The DPA, helium productions, and hydrogen productions are quantities of interest for material irradiation. The DPA plot in Figure 7a has good consistency with Figure 5 after the interpolation was carried out, showing that 30 dpa/fpy can be reached at the BP’s center. With the “10 × 5” footprint, it reaches very promising values of 50–60 dpa/fpy. It should be noted that as the HFTM irradiation volume above 20 dpa/fpy is very limited [4], the additional volumes provided by the BP are particularly valuable.
Helium production is also a crucial aspect of the irradiation field since different amounts of helium result in a large impact on the DBTT (Ductile–Brittle Transition Temperature) [16] with a similar level of DPA. Therefore, the ratio of the helium production rate to the damage rate (the He–DPA ratio) was calculated and is shown in Figure 7c,d. Knowing that the He–DPA ratio of 11–12 He-appm/dpa are typical values at the DEMO first-wall [4], the values of 10–14 He-appm/dpa observed on the BP footprint area are very similar. Figure 7e,f present hydrogen production in a similar way as helium production. Compared with the DEMO first-wall conditions of 45–55 H-appm/dpa, the H–DPA ratio of 50–60 H-appm/dpa on the BP is comparable as well. Such irradiation conditions provided by the IFMIF-DONES facility are unique in the sense of their high damage dose and similar gas production, which allows for the qualification of structural materials for the first-wall of the DEMO reactor and of future fusion machines beyond it.
Besides the absolute DPA value, the DPA gradient over the specimen gauge volume must be as small as possible to reduce the uncertainties on the irradiation data. The gradients are computed on each mesh element along the three directions (X, Y, and Z), providing the larger gradient of this mesh element to its two neighboring elements (in the case of the boundary mesh element, it has only one neighboring element). The gradients in Figure 8 show that for the central high-DPA region, the lower gradients along the Y (<15%/cm) and Z directions (<20%/cm) are the outcomes of a quasi-rectangular beam footprint, while the gradient along the X direction (35–50%/cm) can hardly be improved because the high-energy neutrons are attenuated along the beam direction. The gradient distributions suggest that the specimens should be arranged (cut) such that the shortest dimension is oriented in the X direction and the longest along the Y direction.
The temperature is a key parameter to characterize the irradiation conditions of the specimens. Obtaining the temperature distribution in BP requires conjugate heat transfer simulations of the Li target, which account for the 5 MW deuteron beam and the neutron and gamma heating deposited in the flowing Li and the TA structures. To this end, nuclear heating was simulated using MCNP6 code with the “20 × 5” footprint; then, thermal hydraulics and mechanics simulations were performed using Start-CCM+® version 2021.2 Build 16.04.007. The entire process is a complex multi-physics simulation, which will not be presented here in detail. Due to the good heat transfer between the BP structures and the high-speed Li flow, the temperature in the BP channel shown in Figure 9 is in the range of 300–310 °C, which is very close to the Li inlet temperature of 300 °C. This temperature is highly relevant for the working temperature range of 295–32 8°C for the water-cooled blanket designs (such as WCLL), and the inlet temperature of 300 °C for the helium-cooled blanket designs (for example, HCPB) [17]. The small temperature gradient of within 10 °C provides additional merits for the use of BP for producing materials samples.

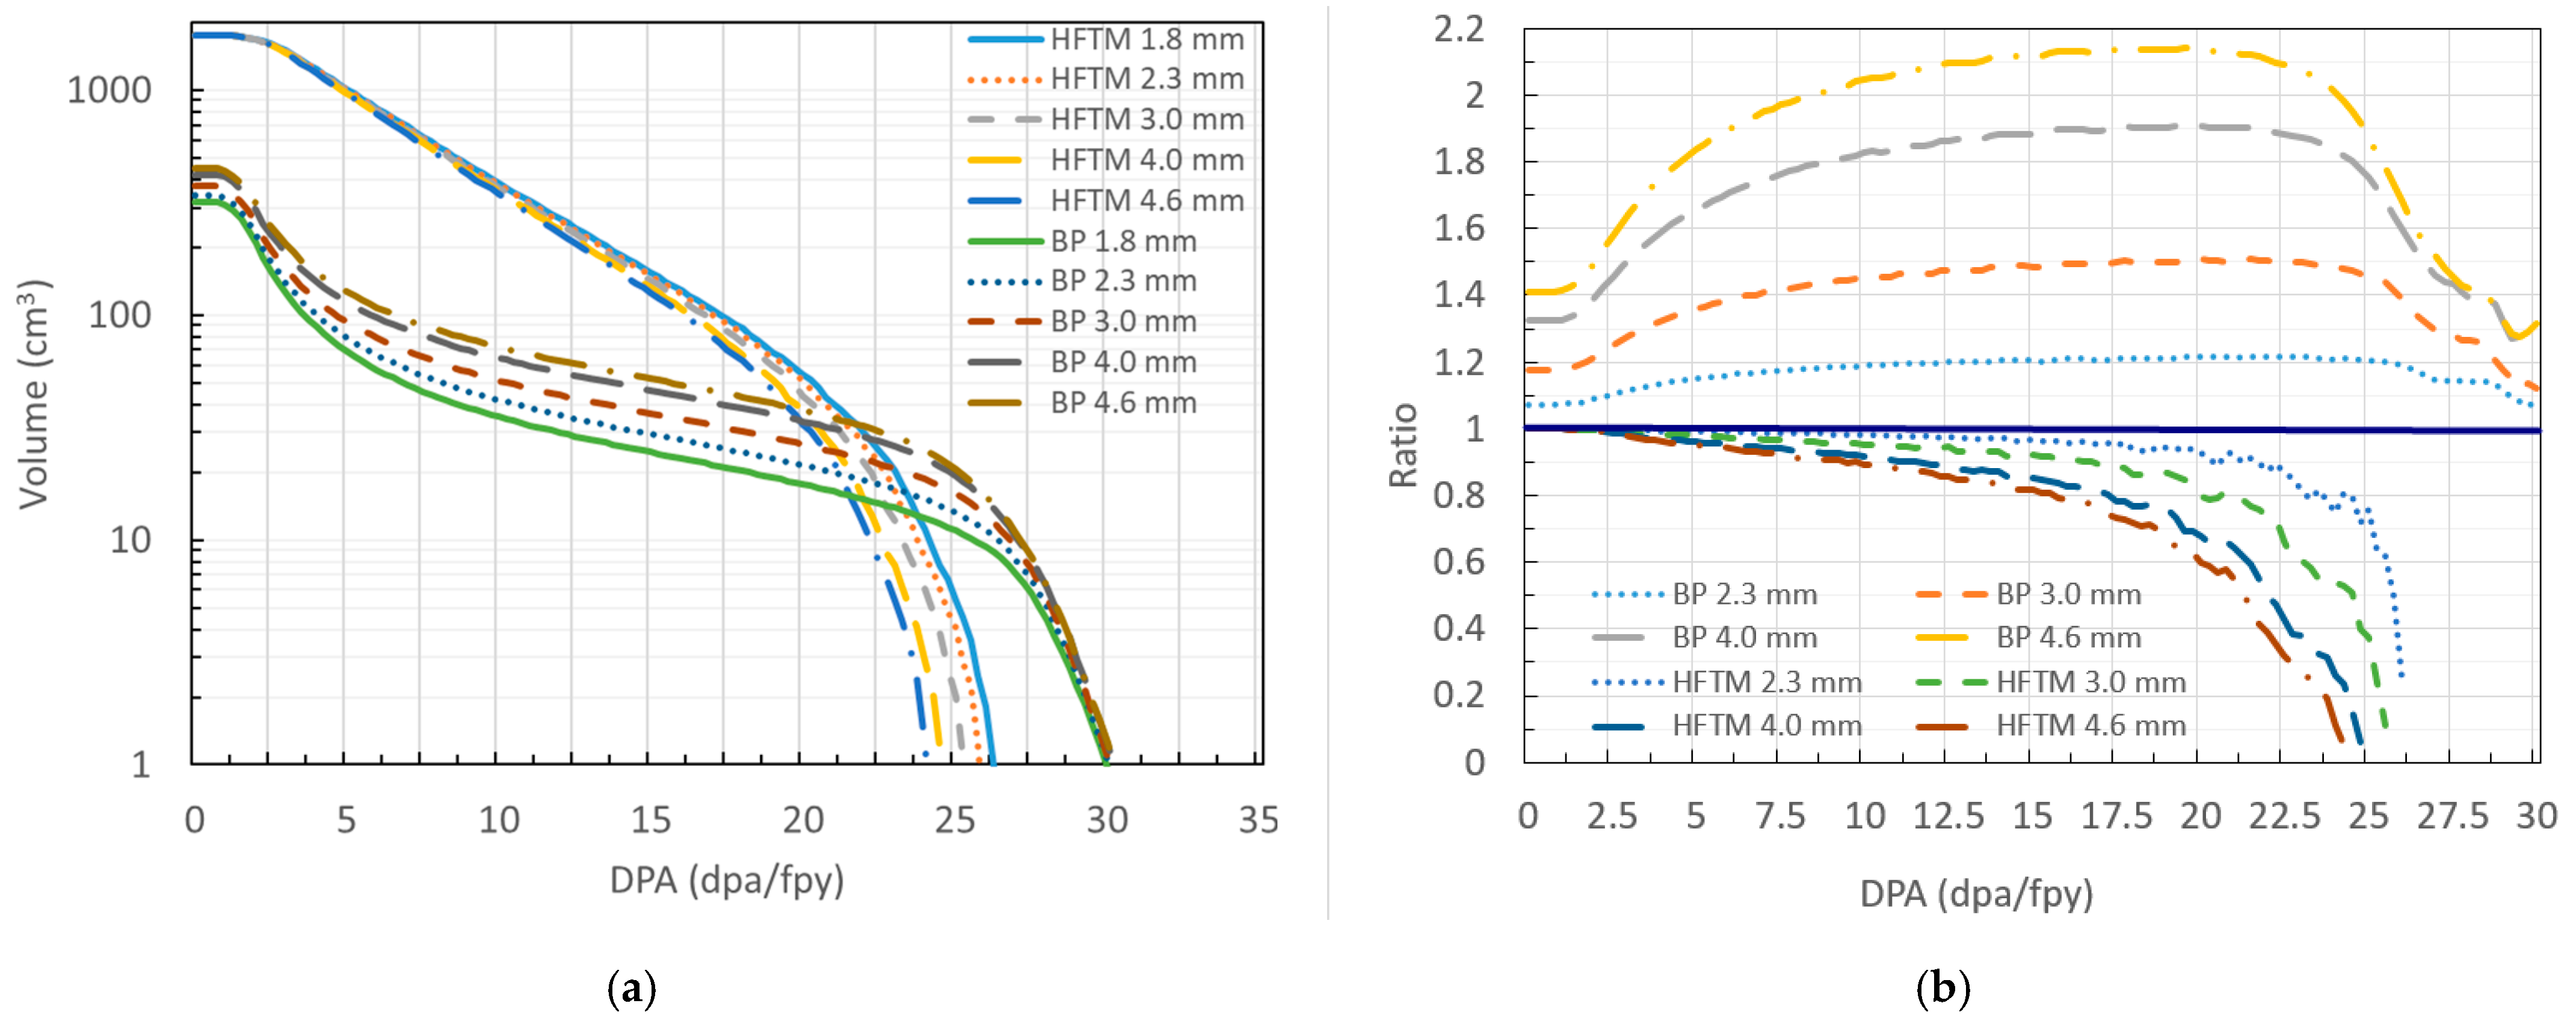
4. Preliminary Analysis of Sample Productions

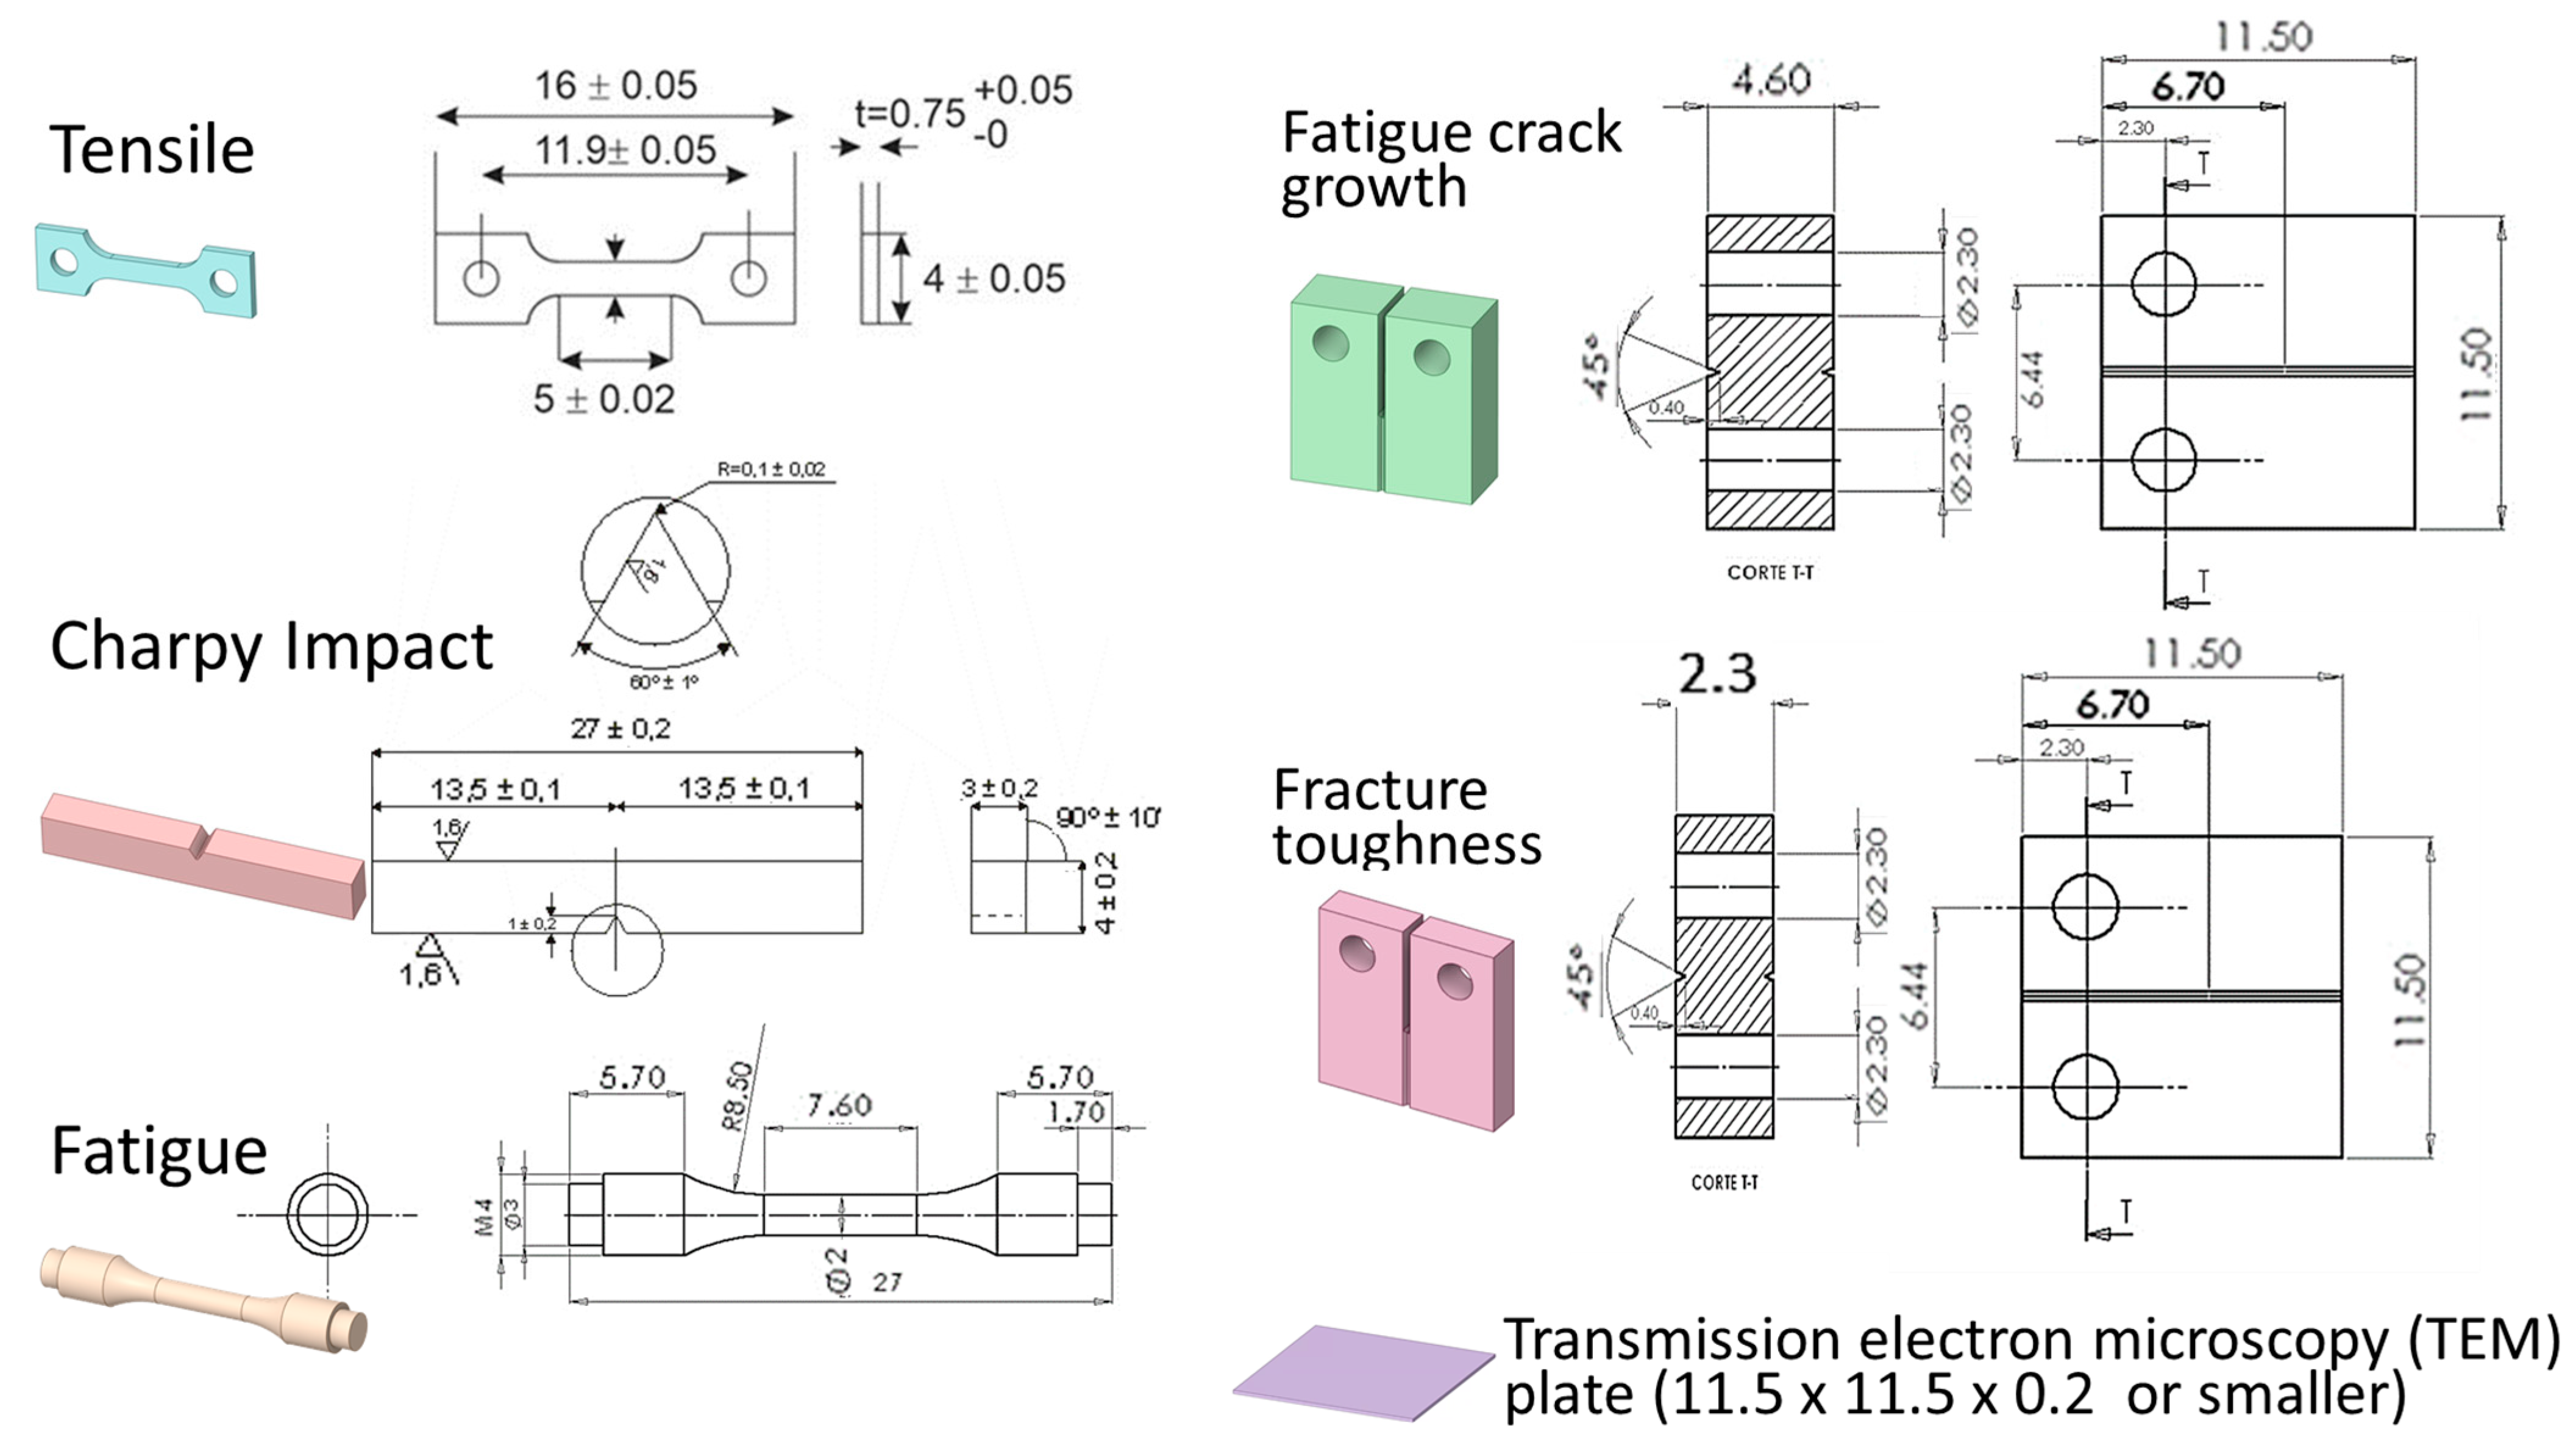
4.1. Specimen Arrangements and Available Volume

To produce material samples from the BP, it is planned to cut the BP into small blocks and then machine them to the standard size of the SSTT specimens. Since the high-DPA volume over the BP is small, a well-elaborated cutting scheme can help produce as many useful samples as possible. The dimensions of the SSTT specimens (Figure 10) have been taken from [18]. The thickness of the specimen is an important factor, since the small thickness of the BP prevents some types of specimens from being produced from the center volume. Additionally, the enclosure’s dimensions and volumes are useful for estimating the number of allowable samples and the average DPA over them. The enclosures are defined based on a specimen bounding-box with a small margin of 0.2 mm on each side, which could be useful for future high-precision cutting. Depending on the technologies used in the future PIE (Post-Irradiation Examination) facilities, high-precision cutting, e.g., laser cutting [19], produces a cut width of 0.4 mm, while an Electrical Discharge Machine (EDM) can produce a smaller cut width depending on the wire it uses [20]. However, it is conservative to expect a cut width of 1.0–2.0 mm.
The summary of the specimen thicknesses and enclosure volumes is given in Table 1. The minimum samples defined in the table are typical numbers required for producing confident test data and are in accordance with the recommendations of the current ASTM and European/ISO test standards. A specimen set is defined as the minimum required number of all types of specimens. Ideally, the volume needed for one specimen set is ~14.5 cm3. Figure 11 provides comparisons of the BP and HFTM with respect to the integral volume over the DPA values, showing that the complementary irradiation volume obtained from the BP is about 7–9% of the HFTM irradiation volume for the DPA > 10 dpa/fpy, and 10–30% volume for >20 dpa/fpy. Note that Figure 11 shows the continuous volume over the central region, while the actual volume provided by the irradiation capsules is smaller. On the other hand, this means that the volume provided by the BP is a valuable complement.
According to Figure 11, the BP volume with DPA > 20 dpa/fpy is sufficient for producing one set of the specimen (~15 cm3), and another set of samples can be produced with 10–20 dpa/fpy. However, these are postulations since the volume of the BP cannot be perfectly tailored. To study the possible specimen arrangements, the allowed vertical positions (in the Z direction) for cutting different types of specimens are calculated from the radius (293.7 mm) and minimum thickness (1.8 mm) indicated in Figure 1. One example of an arrangement scheme is provided in Figure 12. The rules used here are as follows: first, a high-DPA volume should be utilized as much as possible; second, the longest dimension should align with the Y axis; and third, a symmetric arrangement should be maintained to obtain similar DPA values for these specimens. It must be noted that the DPA contours are not perfectly symmetrical because of the beam incident angle of 9°, which has a more obvious impact on the “10 × 5” case. Figure 12 clearly shows that the thickness constrains the use of a high-DPA volume at the center. Although these spaces can accommodate more tensile specimens plus additional TEM (Transmission electron microscopy) plates, other specimens for Fracture Toughness and Charpy Impact tests are placed in low-DPA and high-gradient locations. The reachable DPA values estimated visually from Figure 12 for this set of specimens are given in Table 2. More specimen sets can be produced from the free space, although lower DPA and less favorable gradient conditions are expected. The thickness constraint is an issue that could be mitigated by possible improvements, for example, by increasing the BP’s thickness.

4.2. Study of Specimen Arragements with Increased BP Thickness

A parametric study on the thickness of the BP was performed to assess the impacts on the irradiation performance of the HFTM. The minimum BP thickness was increased from 1.8 mm to 2.3 mm, 3.0 mm, 4.0 mm, and 4.6 mm, which are the typical thicknesses of the specimens. The HFTM position was shifted accordingly, maintaining the same gap between the BP. The DPA mesh tallies for the BP have been extended accordingly, with the resolution of the beam direction (X direction) remaining at 0.5 mm. DPA mesh tallies for the HFTM were also computed to evaluate the changes in the irradiation volume and DPA. In this parametric study, only the “20 × 5” footprint is presented, which is sufficient for providing an indication.
Figure 13 suggests that the increase in the BP’s thickness is a trade-off, as it provides a greater irradiation volume for the BP but reduces the volume for the HFTM. Although the BP’s high-DPA volume percentage increases linearly with the increase in the thickness, the absolute volume gained from the BP and the volume lost in the HFTM are very similar. Taking the DPA > 20 dpa/fpy as an example, the BP gains an additional 20% volume (~3 cm3) while the HFTM loses ~7% (~3.5 cm3). In fact, the absolute volume gained or lost is within ± 5 cm3 over the DPA range > 5 dpa/fpy. On the other hand, it also means that the volume gain from BP can compensate the volume losses in the HFTM. Nevertheless, by increasing the BP’s thickness to 2.3 mm, the high-DPA volume of the BP can be utilized more effectively. An illustration of the specimen arrangement for the 2.3 mm BP is shown in Figure 14, which clearly shows that the volume at the center is more efficiently utilized. The DPA values reachable for different types of specimens are given in Table 3. Compared with Table 2, the obtainable DPA values have increased remarkably. In addition, by visually comparing the specimens’ locations and the gradient conditions in Figure 8, the gradient condition for the specimens is improved. The specimens are arranged more densely than shown in Figure 12 with the relaxation of thickness constraint. Nevertheless, the selection of the BP’s thickness is finally governed by its thermal-mechanical design to enable its long lifetime.

5. Conclusions and Discussions

The back-plate of the IFMIF-DONES target assembly is subject to strong neutron irradiation. The use of the BP for material specimens has been studied in this work aiming to provide complementary material irradiation data on Eurofer. The damage dose rate (DPA) and gas production were computed based on a detailed neutronic model, and a high-fidelity data-mapping approach was used to extract values for the BP. The results show that the DPA in the BP reaches 20–30 dpa/fpy with the nominal “20 × 5” beam footprint, and the value reaches a very high damage rate of 50–60 dpa/fpy for the reduced “10 × 5” beam footprint. The helium and hydrogen production values of 10–14 He-appm/dpa and 50–60 H-appm/dpa are similar to the irradiation condition of DEMO’s first-wall. One additional merit is that the temperature of the BP is adequately controlled within the range of 300–310 °C, which is a relevant value for both the WCLL and HCPB blanket concepts.
The available volume of the BP for producing SSTT samples has been analyzed. Although a volume with >10 dpa/fpy can ideally accommodate 1–2 sets of specimens, the high-DPA volume is not utilized fully due to the thickness limitation. To mitigate this issue, a parametric study on the BP thickness has been performed, which indicated that the high-DPA volume gained from the BP is similar to that lost in the HFTM. However, by increasing the BP’s minimum thickness to, e.g., 2.3 mm, the specimens were more densely arranged and thus receive higher DPA compared to the 1.8 mm-thick BP. To conclude, the material irradiation data provided by the BP is an important complement to the achievable data from the HFTM.
It is noted that a great deal of effort is needed to realize this idea. One potential issue is that the BP is highly activated, which requires dedicated hot cells and tools for cutting and machining the samples. Another remaining problem is that the BP’s actual DPA should be obtained from the neutron fluence measurements, using, e.g., activation foils attached to the outer surface of the BP, which is very challenging to implement. It should be noted that the material and temperature ranges can hardly be changed deliberately as in HFTM, but this is a result of the lifetime and the safe operation criteria of the lithium system. While the Li-flow provides a very stable thermal condition for the BP that allows for the safe inference of the BP’s temperature distribution, it may be feasible to implement at least a few direct temperature measurements in or near the sample extraction area. It must also be considered that the samples recovered from the BP have experienced certain thermal-mechanical stresses during irradiation. Nevertheless, the present study indicates that the BP can deliver a relevant number of specimens irradiated in conditions (high DPA, 300 °C) attractive for answering DEMO design material-related questions.

Author Contributions

Conceptualization, Y.Q.; Data curation, Y.Q., S.G. and A.S.; Resources, D.B.; Writing—original draft, Y.Q.; Writing—review and editing, F.A., D.B., M.F., S.G. and R.H. All authors have read and agreed to the published version of the manuscript.

Funding

This work has been carried out within the framework of the EUROfusion Consortium, funded by the European Union via the Euratom Research and Training Programme (Grant Agreement No 101052200—EUROfusion). However, the views and opinions expressed are those of the author(s) only and do not necessarily reflect those of the European Union or the European Commission. Neither the European Union nor the European Commission can be held responsible for them. The APC was funded by the KIT-Publication Fund of the Karlsruhe Institute of Technology.

Institutional Review Board Statement

Not applicable.

Informed Consent Statement

Not applicable.

Data Availability Statement

Data presented in this article is available on request from the corresponding author.

Conflicts of Interest

The authors declare no conflict of interest.

References

  1. Ibarra, A.; Arbeiter, F.; Bernardi, D.; Krolas, W.; Cappelli, M.; Fischer, U.; Heidinger, R.; Martin-Fuertes, F.; Micciché, G.; Muñoz, A.; et al. The European approach to the fusion-like neutron source: The IFMIF-DONES project. Nucl. Fusion 2019, 59, 065002. [Google Scholar] [CrossRef] [Green Version]
  2. Rieth, M.; Schirra, M.; Falkenstein, A.; Graf, P.; Heger, S.; Kempe, H.; Lindau, R.; Zimmermann, H. EUROFER 97 Tensile, Charpy, Creep and Structural Tests; Forschungszentrum Karlsruhe GmbH Technik und Umwelt: Berlin, Germany, 2003. [Google Scholar]
  3. Norgett, M.; Robinson, M.; Torrens, I. A proposed method of calculating displacement dose rates. Nucl. Eng. Des. 1975, 33, 50–54. [Google Scholar] [CrossRef]
  4. Qiu, Y.; Arbeiter, F.; Fischer, U.; Schwab, F. IFMIF-DONES HFTM neutronics modeling and nuclear response analyses. Nucl. Mater. Energy 2018, 15, 185–189. [Google Scholar] [CrossRef]
  5. Arena, P.; Bernardi, D.; Di Maio, P.A.; Frisoni, M.; Gordeev, S.; Miccichè, G.; Nitti, F.S.; Ibarra, A. The design of the DONES lithium target system. Fusion Eng. Des. 2019, 146, 1135–1139. [Google Scholar] [CrossRef]
  6. Arbeiter, F.; Diegele, E.; Fischer, U.; Garcia, A.; Ibarra, A.; Molla, J.; Mota, F.; Möslang, A.; Qiu, Y.; Serrano, M.; et al. Planned material irradiation capabilities of IFMIF-DONES. Nucl. Mater. Energy 2018, 16, 245–248. [Google Scholar] [CrossRef]
  7. Goorley, J.T.; James, M.R.; Booth, T.E.; Bull, J.S.; Cox, L.J.; Durkee, J.W.J.; Elson, J.S.; Fensin, M.L.; Forster, R.A.I.; Hendricks, J.S.; et al. Initial MCNP6 Release Overview—MCNP6 Version 1.0; Los Alamos National Lab. (LANL): Los Alamos, NM, USA, 2013. [CrossRef]
  8. Lu, L.; Qiu, Y.; Fischer, U. Improved solid decomposition algorithms for the CAD-to-MC conversion tool McCad. Fusion Eng. Des. 2017, 124, 1269–1272. [Google Scholar] [CrossRef] [Green Version]
  9. Simakov, S.P.; Fischer, U.; Kondo, K.; Pereslavtsev, P. Status of the McDeLicious Approach for the D-Li Neutron Source Term Modeling in IFMIF Neutronics Calculations. Fusion Sci. Technol. 2012, 62, 233–239. [Google Scholar] [CrossRef]
  10. Pereslavtsev, P.; Fischer, U.; Simakov, S.; Avrigeanu, M. Evaluation of d +6,7Li data for deuteron incident energies up to 50 MeV. Nucl. Instrum. Methods Phys. Res. Sect. B Beam Interact. Mater. At. 2008, 266, 3501–3512. [Google Scholar] [CrossRef]
  11. Forrest, R.A. FENDL-3 Summary Documentation; Report INDC(NDS)-0628; International Atomic Energy Agency (IAEA): Vienna, Austria, 2012. [Google Scholar]
  12. Konobeyev, A.Y.; Fischer, U.; Pereslavtsev, P.E. Evaluation of advanced displacement cross-sections for the major EUROFER constituents based on an atomistic modelling approach. Kerntechnik 2015, 80, 7–12. [Google Scholar] [CrossRef]
  13. Fischer, U.; Bachmann, C.; Catalan, J.P.; Eade, T.; Flammini, D.; Gilbert, M.; Jaboulay, J.C.; Konobeev, A.; Leichtle, D.; Lu, L.; et al. Methodological approach for DEMO neutronics in the European PPPT programme: Tools, data and analyses. Fusion Eng. Des. 2017, 123, 26–31. [Google Scholar] [CrossRef]
  14. Fischer, U.; Bienkowska, B.; Drozdowicz, K.; Frisoni, M.; Mota, F.; Ogando, F.; Qiu, Y.; Stankunas, G.; Tracz, G. Neutronics of the IFMIF-DONES irradiation facility. Fusion Eng. Des. 2019, 146, 1276–1281. [Google Scholar] [CrossRef] [Green Version]
  15. Qiu, Y.; Lu, P.; Fischer, U.; Pereslavtsev, P.; Kecskes, S. A generic data translation scheme for the coupling of high-fidelity fusion neutronics and CFD calculations. Fusion Eng. Des. 2014, 89, 1330–1335. [Google Scholar] [CrossRef]
  16. Knaster, J.; Moeslang, A.; Muroga, T. Materials research for fusion. Nat. Phys. 2016, 12, 424–434. [Google Scholar] [CrossRef]
  17. Federici, G.; Boccaccini, L.; Cismondi, F.; Gasparotto, M.; Poitevin, Y.; Ricapito, I. An overview of the EU breeding blanket design strategy as an integral part of the DEMO design effort. Fusion Eng. Des. 2019, 141, 30–42. [Google Scholar] [CrossRef]
  18. Serrano, M.; Hernández, R.; Plaza, D. Muñoz, Assessment of SSTT Technology 2020, EUROfusion IDM EFDA_D_2NJ8LL v1.0. 2020. Available online: https://idm.euro-fusion.org/default.aspx?uid=2MLMCM (accessed on 1 October 2022).
  19. Choubey, A.; Agrawal, D.K.; Vishwakarma, S.C.; Upadhyaya, B.N.; Ali, S.; Jain, R.K.; Sah, S.K.; Arya, R.; Oak, S.M.; Joseph, J.; et al. Laser cutting of fast breeder test reactor fuel subassembly in hot cell. In Proceedings of the National Laser Symposium, Vadodara, India, 3–5 October 2007. [Google Scholar]
  20. Tosun, N.; Cogun, C.; Tosun, G. A study on kerf and material removal rate in wire electrical discharge machining based on Taguchi method. J. Mater. Process. Technol. 2004, 152, 316–322. [Google Scholar] [CrossRef]
Figure 1. Geometries of the test cell, target assembly, and the back-plate.
Jne 03 00025 g001
Figure 2. Neutronic geometries of the IFMIF-DONES building and the test cell in horizontal cut-view, and target assembly, HFTM, and BP in vertical cut-view.
Jne 03 00025 g002
Figure 3. Deuteron beam footprints with normalized intensity. (a) “20 × 5” footprint; (b) “10 × 5” footprint.
Jne 03 00025 g003
Figure 4. Neutron spectra on the BP with two beam footprints.
Jne 03 00025 g004
Figure 5. Plots of the DPA [dpa/fpy] mesh tally of footprint “20 × 5” over the high-DPA segment of the BP. Isometric view from inner BP is on the left, and the cut view through the BP’s center is on the right.
Jne 03 00025 g005
Figure 6. Hexahedral mesh of the high-DPA BP segment. Mesh resolutions are X: 0.15–1.5 mm, Y: 2 mm, and Z: 2 mm, which provide similar resolutions as the mesh tallies to maintain the data’s fidelity.
Jne 03 00025 g006
Figure 7. DPA (dpa/fpy), the ratio of helium production to DPA (He-appm/dpa), and the ratio of hydrogen production to DPA (H-appm/dpa) for the footprints “20 × 5” and “10 × 5”. (a) DPA, “20 × 5”; (b) DPA, “10 × 5”; (c) He–DPA ratio, “20 × 5”; (d) He–DPA ratio, “10 × 5”; (e) H–DPA ratio, “20 × 5”; (f) H–DPA ratio, “10 × 5”.
Jne 03 00025 g007aJne 03 00025 g007b
Figure 8. DPA gradient (%/cm) along X, Y, and Z directions. (a) X, (b) Y, and (c) Z.
Jne 03 00025 g008aJne 03 00025 g008b
Figure 9. Temperature (°C) distribution of the TA and the BP. (a) isometric view; (b) cut-view through the TA’s center.
Jne 03 00025 g009
Figure 10. Dimensions (mm) of the SSTT specimens.
Jne 03 00025 g010
Figure 11. Integral volume (cm3) over the DPA value.
Jne 03 00025 g011
Figure 12. The specimen arrangements for BP with two footprints. The pink area represents the actual size of the BP high-DPA region, the dark-blue lines are the DPA contours, and the specimens are shown in the same dimension scale as the BP. The Z coordinate value given on the right size indicates the vertical positions that allow for different types of specimens based on their thicknesses. (a) “20 × 5”; (b) “10 × 5”.
Jne 03 00025 g012
Figure 13. The impact of BP thickness increase on the irradiation volume of BP and HFTM under the “20 × 5” footprint. (a) Presents the integral volume over the DPA value and (b) provides the ratio of others to the reference case of 1.8 mm-thick BP.
Jne 03 00025 g013
Figure 14. The specimen arrangements for BP with two footprints using the 2.3 mm-thick BP option. The descriptions of colors and lines are similar to Figure 12. (a) “20 × 5”; (b) “10 × 5”.
Jne 03 00025 g014
Table 1. The geometry features of the specimens.
SpecimensEnclosure 1 (mm3)Minimum
Samples
Minimum Volume
(mm3)
Thickness
(mm)
Tensile73.98–12886.50.75
Fatigue crack growth342.2124106.72.3
Charpy impact365.66–82924.53
Fracture toughness657.142628.34.6
Fatigue479.76–83838.04
1 Outer bounding-box of the specimen with 0.2 mm margin.
Table 2. Reachable DPA (dpa/fpy) for the specimens based on the arrangement shown in Figure 12.
Specimens“20 × 5” (dpa/fpy)“10 × 5” (dpa/fpy)
Tensile25–3045–55
Fatigue crack growth19–2130–40
Charpy impact10–158–12
Fracture toughness8–1015–20
Fatigue6–87–10
Table 3. Obtainable DPA values (dpa/fpy) for the specimens based on the arrangement shown in Figure 14.
Specimens“20 × 5” (dpa/fpy)“10 × 5” (dpa/fpy)
Tensile25–3048–55
Fatigue crack growth22–2540–50
Charpy impact18–2225–40
Fracture toughness10–1515–22
Fatigue7–98–13
Publisher’s Note: MDPI stays neutral with regard to jurisdictional claims in published maps and institutional affiliations.

