Article

Exploring Growth Phase Effect on Polysaccharide Composition and Metal Binding Properties in Parachlorella hussii

1
Laboratory for the Protection of Ecosystems in Arid and Semi-Arid Zones, Faculté des Sciences de la Nature et de la Vie, Kasdi Merbah University, Ouargla 30000, Algeria
2
Department of Agriculture, Food Environment & Forestry (DAGRI), University of Florence, 50144 Florence, Italy
3
Scientific and Technical Research Centre in Physicochemical Analysis, Tipaza 42000, Algeria
*
Author to whom correspondence should be addressed.
Polysaccharides 2025, 6(3), 58; https://doi.org/10.3390/polysaccharides6030058
Submission received: 27 March 2025 / Revised: 19 June 2025 / Accepted: 27 June 2025 / Published: 2 July 2025

Abstract

Microalgae-based bioremediation is increasingly recognized as a sustainable, efficient, and straightforward technology. Despite this growing interest, the potential of Parachlorella hussii for metal biosorption remains underexplored. This study is the first report evaluating the metal biosorption activity in Parachlorella hussii ACOI 1508 (N9), highlighting the impact of the culture age on the monosaccharide composition and its correlation to the metal binding capacity. The capsular strain (N9) was isolated from the hypersaline ecosystem—Lake Chott Aïn El-Beida—in southeastern Algeria. Cultivated in Bold’s Basal medium, the strain produced 0.807 ± 0.059 g L−1 of RPSs and 1.975 ± 0.120 g L−1 of CPSs. Biochemical analysis of the extracts revealed a high total sugar content (% w/w) that ranged from 62.98 ± 4.87% to 95.60 ± 87% and a low protein content (% w/w) that ranged from 0.49 ± 0.08% to 1.35 ± 0.69%, with RPS-D7 and RPS-D14 having high molecular weight (≥2 MDa). HPLC-based monosaccharide characterization demonstrated compositional differences between the exponential and stationary phases, with rhamnose dominating (~55%) in RPS-D14 and with the presence of uronic acids comprising 7–11.3%. Metal removal efficiency was evaluated using the whole biomass in two growth phases. Copper uptake exhibited the highest capacity, reaching 18.55 ± 0.61 mg Cu g−1 DW at D14, followed by zinc removal with 6.52 ± 0.61 mg Zn g−1 DW. Interestingly, removal efficiencies increased to about twofold during the stationary phase, reaching 51.15 ± 1.14% for Cu, 51.08 ± 3.35% for Zn, and 36.55 ± 3.09% for Ni. The positive results obtained for copper/zinc removal highlight the biosorption potential of P. hussii, and notably, we found that the metal removal capacity significantly improved with culture age—a parameter that has been poorly investigated in prior studies. Furthermore, we observed a growth phase-dependent modulation in monosaccharide composition, which correlated with enhanced functional properties of the excreted biomolecules involved in biosorption. This metabolic adjustment suggests an adaptive response that may contribute to the species’ effectiveness in heavy metal uptake, underscoring its novelty and biotechnological relevance.

1. Introduction

The increasing prevalence of heavy metal contamination in water bodies poses a significant environmental challenge. Conventional methods for removing heavy metals, such as ion exchange, chemical precipitation, and filtration, are often expensive, energy-intensive, inefficient at low concentrations, and produce secondary pollutants. These limitations have spurred interest in biological approaches as cost-effective and environmentally friendly alternatives [1,2,3,4,5,6,7,8]. In the past few years, biosorption has proven to be an efficient, low-cost option and an innovative technology for heavy metal removal [9,10,11,12,13,14]. The ability of microalgae to produce capsular polysaccharides (CPSs) makes them suitable for biosorption processes in the purification of aquatic environments [7]. CPSs have shown great potential for metal removal due to their structural characteristics, which include abundant charged functional groups such as carboxyl (-COOH), hydroxyl (-OH), amine (-NH), and sulfate (-SO4) groups. These functional groups facilitate the binding and sorption of metal ions, making CPSs a promising solution for heavy metal remediation [7,15,16].
Several environmental and physiological key factors influence the monosaccharide composition in microalgae; variations in temperature, light intensity, salinity, and nutrient availability can significantly modify the biosynthetic pathways of polysaccharides (PSs), leading to differences in their monosaccharide content. The culture age (or growth phase) plays a role in defining the PSs composition; it can direct the incorporation of specific sugars like glucose, rhamnose, or galactose into the PS structure [17,18,19]. On the other hand, the efficiency of capsular microalgae in heavy metal removal depends on several factors, particularly the composition of their PSs, which determines their functional properties.
The critical contribution of this research lies in the fact that Parachlorella hussii microalga strain has never been explored for its metal removal potential. No prior studies have examined this strain in the context of bioremediation, making this study essential for advancing the field. The present research is the first to explore its potential, with a specific focus on the polysaccharide-rich capsule that characterizes this strain. The capsule, due to its complex polysaccharide matrix with multiple charged functional groups, can serve as a highly efficient, eco-friendly biosorbent for heavy metals—a feature that is particularly valuable in the field of environmental remediation. On the other hand, this study addresses the limited understanding of how the culture age influences the biochemical composition and functional potential of capsular and released polysaccharides (RPS) in Parachlorella hussii. While microalgal polysaccharides are known to play critical roles in metal biosorption, the dynamic changes in their composition throughout different growth phases remain poorly characterized. In particular, the potential for growth-phase-dependent shifts—such as variations in monosaccharide content—to affect biosorptive performance has not been thoroughly investigated. Exploring this relationship is crucial for both fundamental insights into algal physiology and for advancing the application of microalgae in biotechnological processes, such as heavy metal remediation. By linking physiological age to functional properties, this research aims to elucidate mechanisms that could be leveraged to optimize microalgal biosorption systems.
The study is the initial investigation on how the culture age—specifically the growth phase—impacts the monosaccharide composition of polysaccharides and the strain’s metal removal efficiency. While Mallick (2003) investigated various parameters influencing metal biosorption, including pH, temperature, cell state, and culture age, the composition of the molecules involved remained unexamined [14]. A noteworthy point is that despite the extensive research on microalgal polysaccharides, the monosaccharide profile of P. hussii polysaccharides remains unreported in scientific literature, highlighting a significant knowledge gap.
To address this, the present study focused on the isolation and the monosaccharide determination of PSs extracted from a native strain of Parachlorella hussii (designated as strain N9)—which was isolated from a hypersaline lake in southeast Algeria—and the evaluation of the metal binding capacity of the N9 capsular biomass during two different growth phases. The primary objectives were to study the growth aspects and the phylogeny of the strain, determine the monosaccharide composition of its PSs—contributing to an expanded understanding of the compositional diversity of microalgal PSs—and assess the heavy metal removal capabilities of Parachlorella hussii. Additionally, the current study compared the impact of the strain’s growth phase on the monosaccharide composition of the PS, and then, the whole biomass was evaluated for its metal biosorption capacity regarding three heavy metals (Copper Cu2+, Nickel Ni2+, and Zinc Zn2+) during the exponential phase and the stationary phase. This paper is the first work elucidating the correlation between growth phase, PS composition, and heavy metal removal efficiency in Parachlorella hussii ACOI 1508 (N9) strain, emphasizing the need to study unexplored microalgal strains for novel PS molecules with promising environmental applications.

2. Materials and Methods

2.1. Sampling Site, Strain Isolation, and Identification

A water sample was collected from Chott Ain El-Beida Lake, Algeria (31°57′45.3″ N, 5°22′30.7″ E). This lake is of great importance in the Ouargla region, and it is recognized as an internationally protected wetland under the RAMSAR Convention (1971). It is characterized by its salinity that exceeds 50 g L−1 [20]. Sampling was carried out on 29 January 2019 using a plankton net. A water sample was collected in clean glass bottles and transported directly to the laboratory for microalgae isolation. The strain was isolated using Bold’s Basal Medium (BBM); Petri dishes were incubated at 25 ± 2 °C under a 16 h:8 h light-dark photoperiod cycle, 100 µmol photons m−2 s−1 of illumination, for two weeks. After incubation, individual colonies were repeatedly subcultured on BBM agar plates until axenic cultures were obrained. A dual staining with alcian blue (0.1%) and India ink was employed to visualize the PS capsule surrounding the cells. Observations were conducted under a light microscope at ×100 magnification [21].
The isolated microalgal strain was identified by both 18S rDNA and ITS region sequencing. Total DNA was extracted following the CTAB buffer protocol [22,23] combined with mechanical disruption with glass beads. PCR amplification of the 18S rRNA gene was carried out using primers 18SF and 18SR [24], and the amplification of the ITS region was carried out using primers ITS1 and ITS4 [25]. The amplified 18S rDNAs and ITS region (amplicons) were sequenced using the Sanger method by the external sequencing service. Then, the 18S rDNA and ITS sequences were assembled using BioEdit (version 7.2.5). The 18S rDNA and ITS sequences of both N9-related strains and toxic microalgae strains were retrieved from the GenBank database (NCBI) and used for phylogenetic analysis. The sequences were aligned in MEGA 11 software [26], and a phylogenetic tree was constructed using the Maximum Composite Likelihood method with 1000 bootstraps. The 18S rRNA and the ITS sequences of the N9 strain are available at the GenBank database with the accession numbers PQ110317 and PV799918, respectively. Toxic strains belonging to different microalgal classes, Bacillariophyceae, Dictyochophyceae, Dinophyceae, and Haptophyceae, were reported with green Chlorophyceae to check the biosecurity threats of the isolated strain N9 [27].

2.2. Batch Culture and Growth Measurement of the Microalgal Strain

The strain was cultivated in liquid BBM medium, pH equals 6.6 ± 0.2 at 25 ± 2 °C for two weeks under continuous illumination at 200 µmol photons m−2 s−1, aerated with sterile air supplemented with 0.3% CO2. Cell growth was monitored over a 15 days period using multiple methods: (1) Direct cell counting (DCC) with a Thoma hemocytometer, where the cell number (N) was determined within one large square (Equation (1)); (2) dry weight (DW) measurement using 0.22 µm micro-membranes (Equation (2)) [28]; and (3) optical density (OD) at λ = 681 nm, measured using a Cary 50 Scan UV/Vis Spectrophotometer. These two methods were used together to give a good estimation of growth features for the isolated strain. Specific growth rate and biomass productivity were calculated using Equations (3) and (4), respectively [28,29]. All experiments (microalgal culture and growth measurements) were performed in triplicate (n = 3) as biological samples.
T h o m a   h a e m o c y t o m e t r e   ( c e l l s / m L ) = N × 16 × 10 4
D r y   w e i g h t   ( g   L 1 ) = ( W   F i l t r e   w i t h   d r i e d   b i o m a s s W   F i l t r e   w i t h o u t   b i o m a s s ) S a m p l e   v o l u m e × 1000
S p e c i f i c   g r o w t h   r a t e   μ m a x   day 1 = ( l n X T / l n X 0 ) t T t 0
B i o m a s s   p r o d u c t i v i t y   ( g   L 1 d 1 ) = X T X 0 t T t 0
where:
  • N: Average number of cells counted in one large square.
  • W: Weight of the filter
  • X: Dry weight of biomass (g L−1) at time tT and t0 (days)
  • XT and X0: Dry biomass concentrations at time ‘T’ and time ‘0’ (days).

2.3. Polysaccharide Extraction and Quantification

PS production was tracked over 15 days using the phenol-sulfuric acid method (details on this colorimetric method were explained next in 2.4.1) [30]. Sampled volumes—every day—were centrifuged at 4000× g for 10 min to separate the supernatant from the biomass. The free-cell supernatant was used to quantify released polysaccharides (RPSs), while the pellet was analyzed to determine the total carbohydrate content in the biomass (BCHO).
PS extraction was performed following the methods described by [31,32] with minor modifications. Briefly, 100 mL of culture was centrifuged at 10,000× g for 15 min. The pellet was retained for CPS extraction, while the free-cell supernatant was subjected to precipitation with cold ethanol (1:4, w/v) at −20 °C overnight and then centrifuged at 4000× g for 10 min. The resulting RPSs were lyophilized and stored at 4 °C. Regarding the CPSs, the biomass pellet was subjected to hot-acid extraction. Briefly, each 1 mL of the biomass was mixed with 5 mL of 0.2 M sulfuric acid and stirred at 95 °C for 60 min. The mixture was centrifuged at 4000× g for 30 min, and the supernatant was collected. The pellet was subjected to a second extraction under the same conditions. The supernatants from both extractions were pooled together and precipitated with cold ethanol (1:4, w/v) at −20 °C overnight. The resulting CPSs were lyophilized and stored at 4 °C [31,32]. The hot-acid extraction step was extended to 60 min (compared to 30 min in the reference method [31,32] to enhance capsular polysaccharide solubilization. Furthermore, centrifugation was extended to 30 min (compared to 5 min) to ensure complete separation of the biomass from the supernatant, as the high water-retention capacity of these polysaccharides resulted in insufficient pellet formation during the shorter interval. The PS yield was calculated as follows:
P o l y s a c c h a r i d e   y i e l d   % = w e i g h t   o f   t h e   o b t a i n e d   p o l y s a c c h a r i d e w e i g h t   o f   t h e   i n i t i a l   b i o m a s s   u s e d   f o r   e x t r a c t i o n × 100
All experiments (colorimetric assays and polysaccharide yield andquantification) were performed in triplicate (n = 3) as biological samples.

2.4. Polysaccharide Characterisation

2.4.1. Biochemical Analysis

The phenol-sulfuric acid technique was used to determine the total sugar content. Briefly, 200 µL of the sample was supplied by 200 µL of 5% (w/v) phenol solution and 1000 µL of 96% sulfuric acid. The mixture was incubated for 10 min at room temperature, vortexed for a few seconds, and reincubated for 30 min in a water bath. After, the absorbance was read at λ = 483 nm. Total sugar was calculated from the glucose calibration curve [30].
The protein content was determined using the Lowry assay with slight modifications. Briefly, 500 µL of the polysaccharide sample was supplied with 500 µL of NaOH (1 N) and incubated for 5 min at 100 °C, then immediately cooled down in ice. Next, 2500 µL of the solution C (which is composed of 50 mL of solution A and 2 mL of solution B—Solution A consisted of 5% (w/v) of Na2CO3; while solution B was composed of 0.5% (w/v) of CuSO4 × 5H2O in 1% (w/v) of K, Na tartrate) was added and reincubated for 10 min. Afterwards, 500 µL of Folin-Ciocalteu 1N (solution D) was added to test tubes and incubated for 30 min in the dark. Absorbance was read at 750 nm, and the protein concentration was calculated from the BSA calibration curve [33,34]. All colorimetric assays were performed in triplicate (n = 3) as biological samples.

2.4.2. Monosaccharide Composition Determination

The monosaccharide composition of the RPSs and CPSs was determined using a Dionex ICS-2500 ion exchange chromatography (Dionex, Sunnyvale, CA, USA) equipped with an ED50 pulsed amperometric detector featuring a gold working electrode. Separation was achieved using a Dionex CarboPac PA1 column (250 mm length × 4.6 mm internal diameter; Thermo Scientific, Sunnyvale, CA, USA). Firstly, 10 mg of each PS sample was hydrolyzed with 2 mL of 2 N trifluoroacetic acid (TFA) in screw-cap vials at 120 °C for 2 h. The hydrolysate was cooled down in an ice bath, then centrifuged at 10,000× g for 10 min. The residual TFA in the supernatant was evaporated using a rotary evaporator, and the resulting pellet was re-dissolved in 2 mL of MilliQ-grade water for high-performance liquid chromatography (HPLC) analysis. The chromatographic separation was performed as described by [35]. The chromatographic separation was performed using a ternary eluent system: (A) HPLC-grade water, (B) 0.185 M sodium hydroxide, and (C) 0.488 M sodium acetate. The elution protocol consisted of three sequential steps: (1) From injection to 20 min, the eluent composition was 90% A and 10% B; (2) from 20 to 30 min, the eluent was adjusted to 50% B and 50% C; and (3) from 30 to 60 min, the eluent reverted to the initial composition of 90% A and 10% B. The flow rate was maintained at 1 mL min−1 throughout the analysis. Thirteen monosaccharide standards were used: arabinose (Ara), fructose (Fru), fucose (Fuc), galactose (Gal), galactosamine (GalN), galacturonic acid (GalA), glucose (Glc), glucosamine (GlcN), glucuronic acid (GlcA), mannose (Man), rhamnose (Rha), ribose (Rib), and xylose (Xyl). The samples were injected in technical duplicates (n = 2).

2.4.3. Molecular Weight Determination

Size exclusion chromatography (SEC) was employed to determine the molecular weights (Mw) of the PSs. The analyses were conducted according to [36,37] on a Varian ProStar HPLC system (Varian, Palo Alto, CA, USA) featuring a refractive index (RI) detector (model 355) and two Polysep-GFC-P columns (6000 and 4000, Phenomenex, Torrance, CA, USA) connected in series. The system was calibrated using dextran standards of varying Mw (50 kDa, 150 kDa, 410 kDa, 1.1 MDa, and 2 MDa), each dissolved in 1 mL of MilliQ-grade water. Approximately 5 mg of PS samples were dissolved in 1 mL of ultrapure water. The mobile phase consisted of HPLC-grade water, with a flow rate of 0.4 mL/min, with a total run time of 70 min. Given that the 2 MDa dextran standard elutes at 22.45 min, an earlier elution time indicates the presence of molecules with larger hydrodynamic volumes, potentially corresponding to molecular weights exceeding 2 MDa. Analysis was conducted using technical samples in duplicate (n = 2).

2.4.4. Attenuated Total Reflection Spectroscopy

Attenuated total reflection (ATR) was used to determine functional groups on the polysaccharide surface. Briefly, 2–4 mg of lyophilized extracts were analyzed by ATR instrument (Specac, A21374701037 LP, Shimadzu, Kyoto Japan). The transmittance spectra were collected between 4000 and 400 cm−1 at a spectral resolution of 2 cm−1.

2.5. Metal Removal Activity

2.5.1. Metal Cell Contact

Metal removal activity was evaluated for the biomass harvested at day 7 (exponential phase) and day 14 (stationary phase) of growth. A pretreatment step was carried out before proceeding to metal contact in order to prepare the algal inoculum for metal interaction. Both pretreatment and metal removal experiments were performed as previously described [8]. The metal removal capacity was evaluated regarding three heavy metals (Copper Cu2+, Nickel Ni2+, and Zinc Zn2+).
Before metal-cell contact analysis, the cultures underwent pretreatment steps. Initially, the cultures were dialyzed against deionized water using a dialysis membrane (Mw cut-off 12–14 kDa, S/V 1.9 cm−1, Medicell Membranes Ltd., London, UK) at a ratio of 33 mL culture to 1000 mL deionized water for 24 h. Next, the cultures were subjected to acid treatment with 0.1 M hydrochloric acid (HCl) for 30 min. Then, a second dialysis was performed overnight. A blank control, consisting of the BBM medium, was also subjected to the same pretreatment protocol. This control was essential for comparative analysis when quantifying metal removal efficiency. At this step, the cultures were prepared to undergo the metal contact experiments.
In the metal contact step, the experimental setup involved 100 mL glass cylinders under continuous stirring. For both control and culture samples, metal contact was established by immersing separately 5 mL of liquid BBM medium as a control and microalga cultures (Day 7 and Day 14)―contained within a dialysis tube―in 50 mL of a 10 mg L−1 metal solution (1:10 v/w). The two solutions were separated by a dialysis membrane (Mw cut-off 3.5 kDa, S/V 3.7 cm−1, Medicell Membranes Ltd., London, UK). The contact duration was maintained at ≥12 h, with the pH stabilized between 4.5 and 5.5 at a constant temperature of 25 ± 2 °C. The same experimental protocol was performed for copper, nickel, and zinc solutions (CuCl2, NiCl2, and ZnCl2).

2.5.2. Quantification of the Removed Metal

Metal removal capacity (qe) and metal removal efficiency (R%) were assessed according to the method described in [8]. The % removal and the uptake capacity (mg/g) values were indeed derived from the same set of experiments, but they describe complementary aspects of the biosorption process. The % removal reflects the efficiency of metal removal from the solution, calculated based on the concentration difference before and after treatment. The uptake capacity (mg/g) quantifies the amount of metal adsorbed per unit mass of biosorbent, offering a measure of biosorption capacity. qe (6) and R% (7) were calculated as below:
M e t a l   r e m o v a l     c a p a c i t y     q e     m g   g 1 = ( C 0 C t ) m × V
R e m o v a l   e f f i c i e n c y   ( R % ) = ( C 0 C t ) C 0 × 100
where
  • C0: initial concentration of the metal solution (mg L−1),
  • Ct: concentration of the metal solution after‘t’ time (mg L−1),
  • V: volume of the solution in the oscillated flasks (L).
  • m: the mass of the biosorbent (g L−1).
Quantification of Copper, Zinc, and Nickel Removal: Removals were quantified using the Copper HR Reagent kit (HI93702-01), the Zinc Reagents kit (HI93731-01), and the Nickel LR Reagent kit (HI93740C-0), respectively, following the manufacturer’s protocol (Hanna Instruments Srl, Padova, Italy).
All treatments were conducted using biological samples in triplicate (n = 3).

2.6. Statistical Analysis

The significance of the HPLC data were evaluated using Student’s t-test, and metal removal activity was treated using two-way analysis of variance (ANOVA) for the growth phase effect and the metal type effect at 5% significance, followed by Tukey’s honest significance difference (HSD) post-hoc test. Statistical analysis was performed using GraphPad Prism version 6.00 (GraphPad Software, San Diego, CA, USA) and OriginPro version 196 (OriginLab Corporation, Northampton, MA, USA).

3. Results

3.1. Sampling Site

Chott Aïn El Beïda Lake, located in Ouargla, Algeria (31°57′45.3″ N, 5°22′30.7″ E), is a wetland of great importance. Spanning an area of 6853 hectares, this saline lake is surrounded by palm groves and features an extensive network of canals designed to manage excess water from both vegetation and nearby urban areas [38]. The lake from which Parachlorella hussii N9 was isolated holds significant ecological and scientific importance. It is not only a nationally valued ecosystem in Algeria but also recognized internationally as a protected wetland under the Ramsar Convention (1971) (Site Number: 1414). This designation highlights the lake’s ecological role, particularly as a critical breeding and resting habitat for a wide range of migratory bird species.
In addition to its ecological significance, the lake is characterized by unique physicochemical conditions—notably high salinity and conductivity—which create a naturally selective environment that promotes the survival of extremophilic and stress-tolerant microorganisms. Such conditions make it an ideal site for bioprospecting native microalgal strains with specialized adaptations. Figure 1 provides a detailed illustration of the lake’s geographical location.

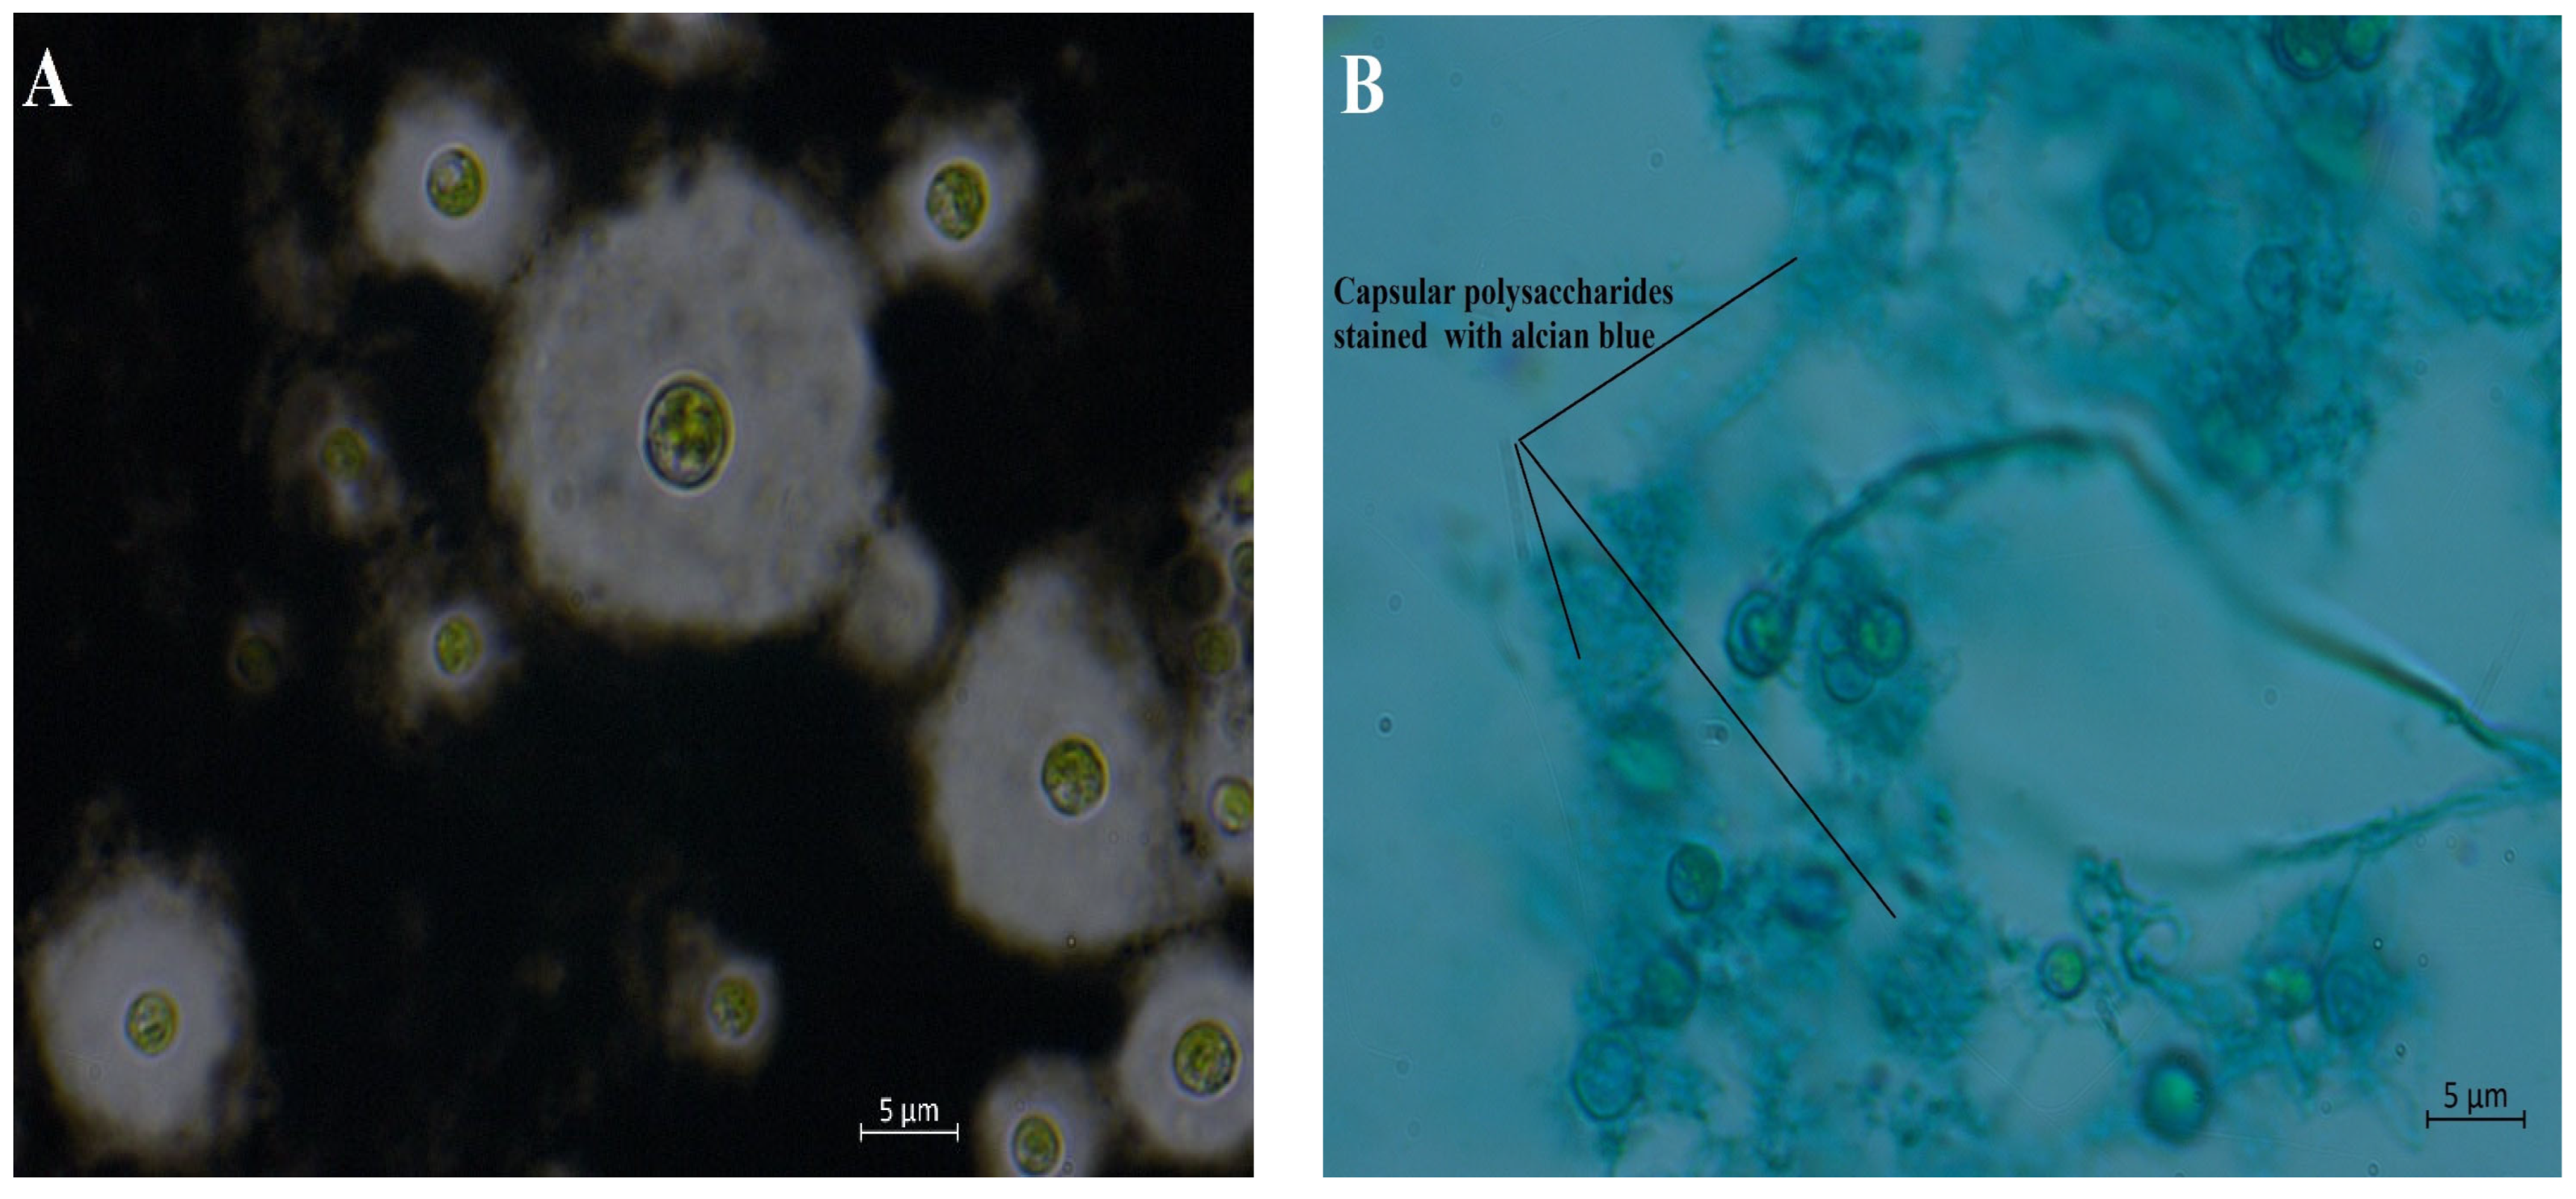
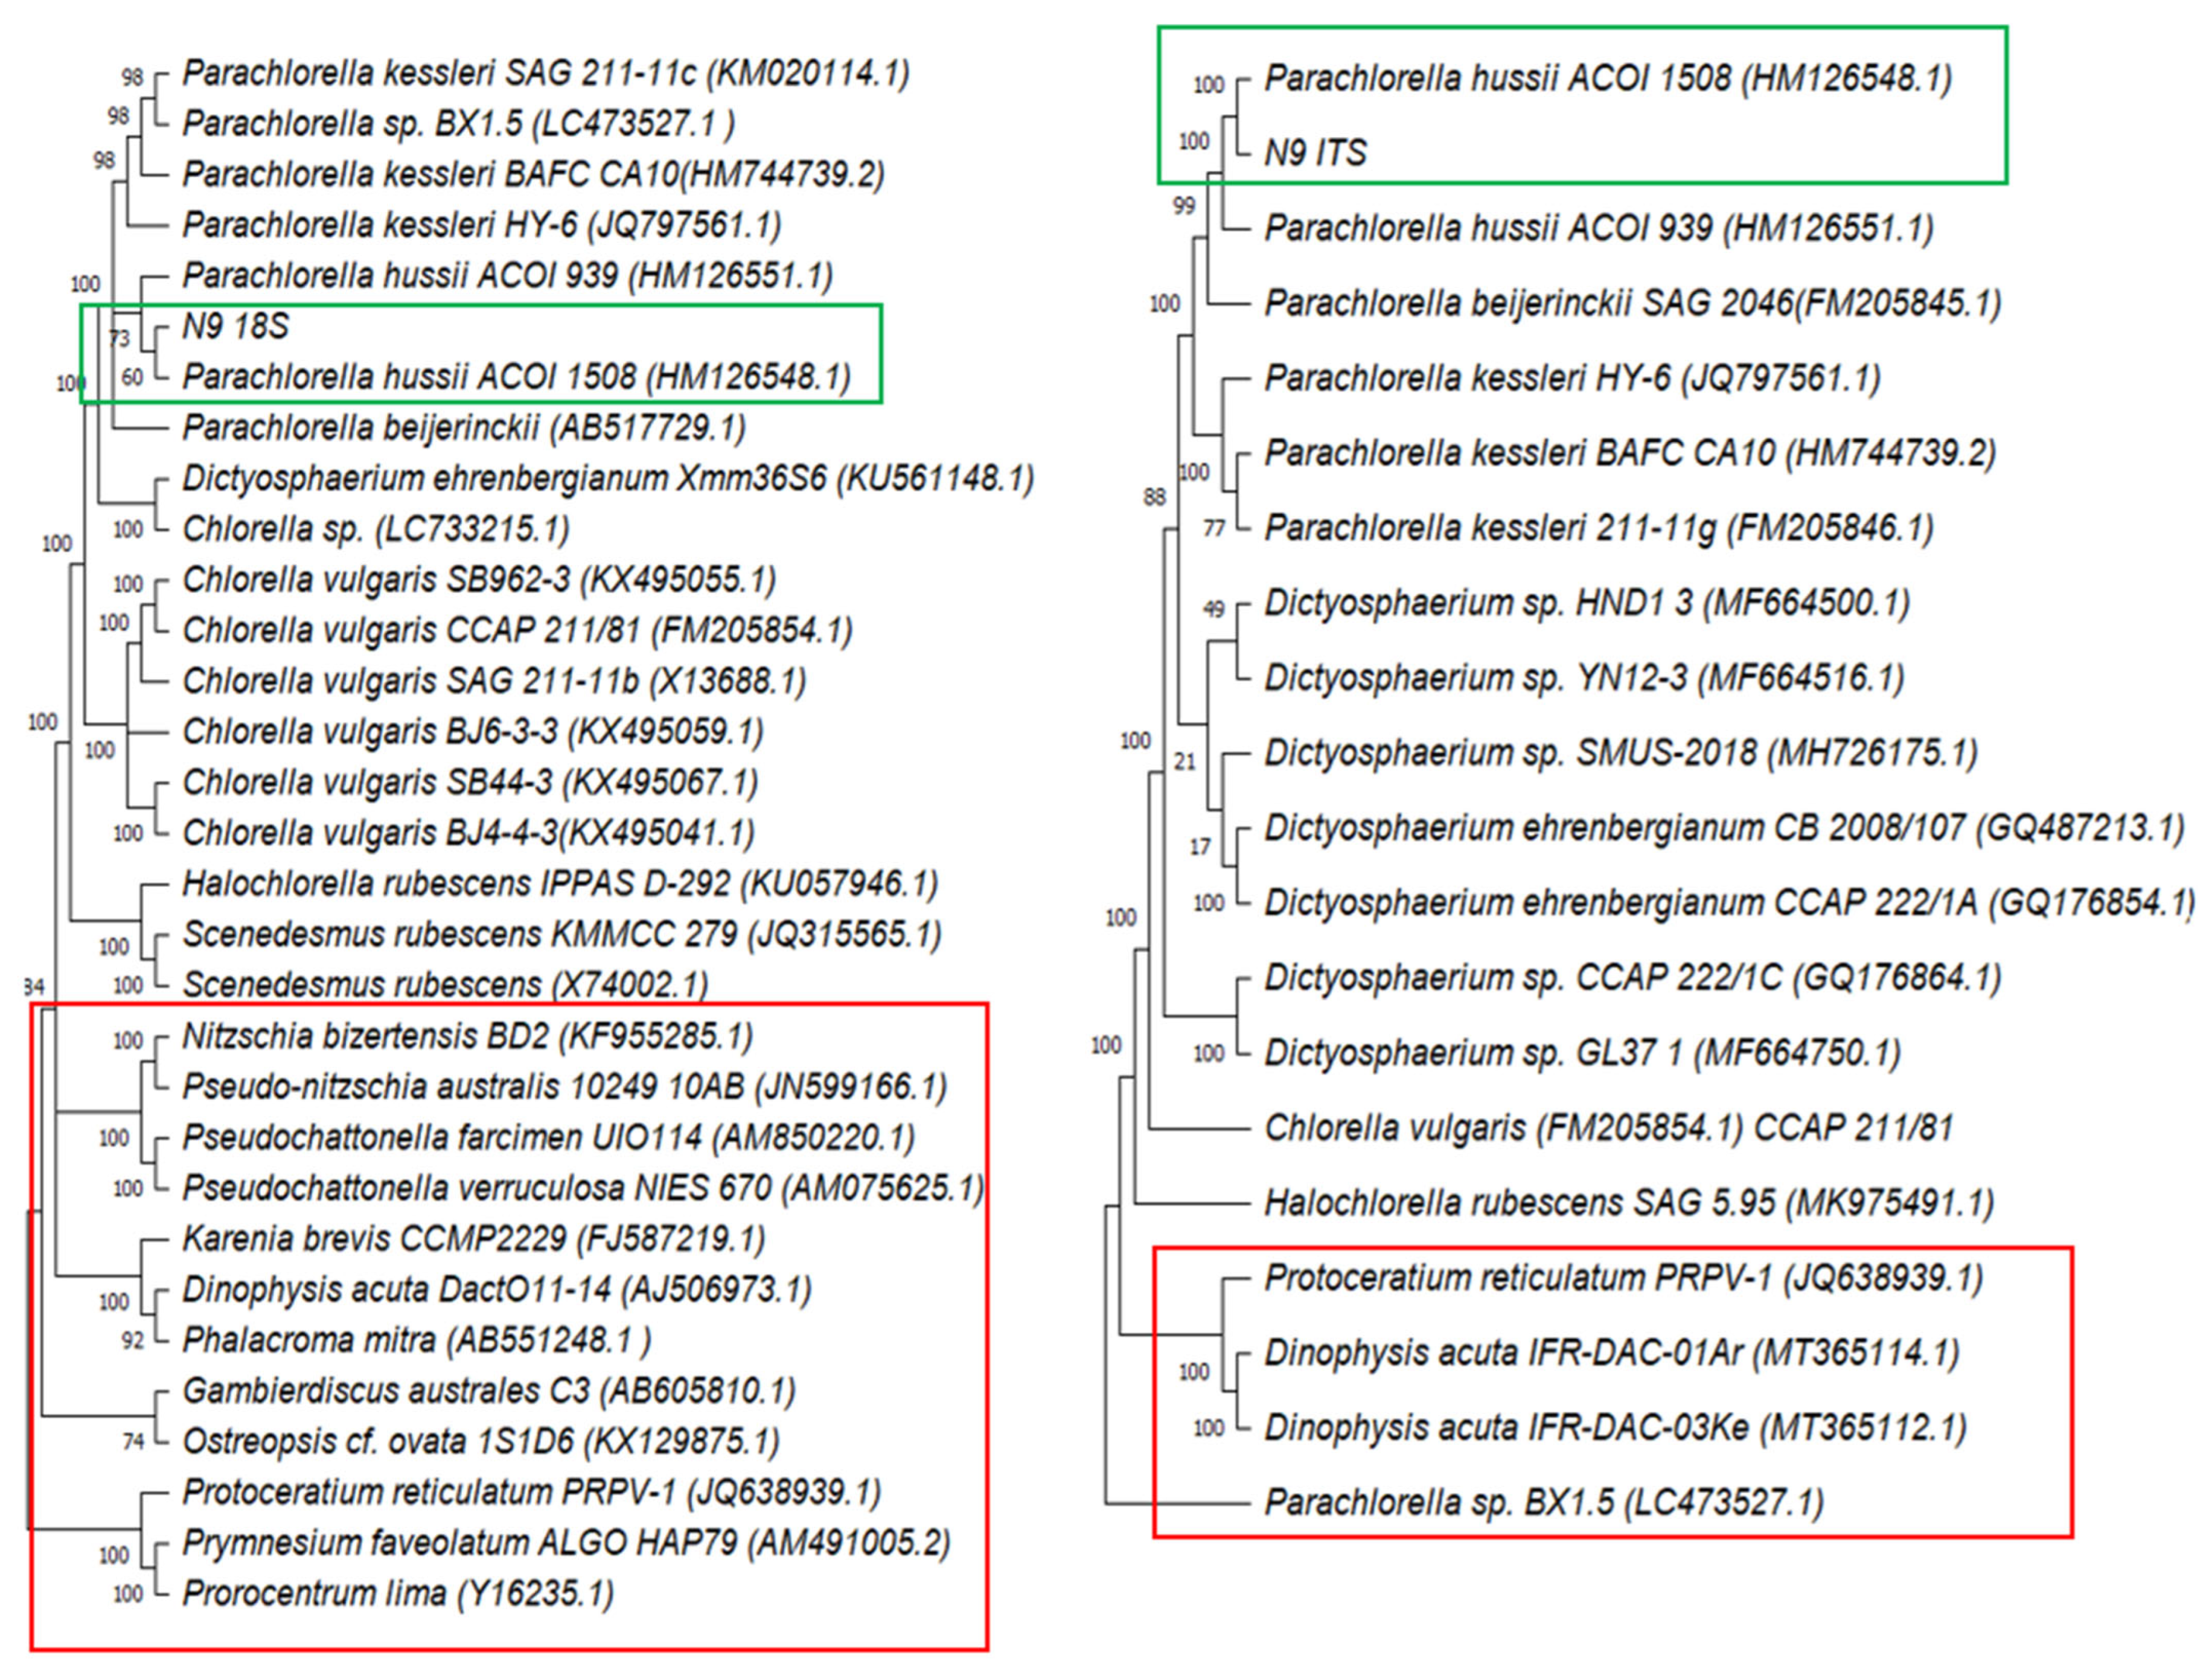
3.2. Microalga Isolation, Molecular Identification, and PSs Staining

Following the isolation process, small spherical green colonies were grown on Petri dishes containing agarized BBM. Axenic culture was obtained after serial sub-culturing on the same medium. Observation under an optical microscope revealed that the cells, ranging in diameter from 2 to 10 µm, have morphological features that indicate that they belong to green microalgae. To visualize the cell and the capsule, an inverse staining (negative staining) was used; India ink staining of the fresh cells revealed cloudy, bright, and circular structures—occasionally irregular in shape—surrounding the cells against a black background (Figure 2A). Additionally, the PS capsules were stained with Alcian blue (0.1%), a cationic dye that interacts selectively with the negatively charged groups (e.g., acidic and sulfate groups) present in the PS matrix. This staining mainly highlighted the CPSs as a filamentous network and a grid-like structure enveloping the cells (Figure 2B).
BLAST-N analysis of the full-length 18S rRNA (1667 bp) and ITS (1282 bp) sequences revealed that the N9 isolate belongs to Parachlorella hussii ACOI 1508 (HM126548.1), with sequence similarities of 99.64% and 99.9%, respectively. To evaluate the taxonomic placement of the isolate, 30 and 19 reference sequences were retrieved from the NCBI database for the 18S rRNA and ITS regions, respectively. These reference strains primarily represented green microalgae to verify taxonomic affiliation, while additional sequences from potentially toxigenic microalgal taxa (e.g., Dinophyceae, Dictyochophyceae) were included for comparative biosecurity assessment. Ambiguous nucleotide positions were removed using pairwise deletion in BioEdit, resulting in aligned sequence lengths of 1443 bp (18S rRNA) and 991 bp (ITS). Phylogenetic analyses were conducted in MEGA11 using the UPGMA algorithm with 1000 bootstrap replicates and evolutionary distances computed via the Maximum Composite Likelihood method (expressed as substitutions per site). Both phylogenetic trees consistently placed isolate N9 within the Parachlorella hussii ACOI 1508 clade (Figure 3), confirming its affiliation with the Trebouxiophyceae class (Chlorophyta). For biosecurity evaluation, sequences from known toxigenic microalgae were included to ensure no close relationship to harmful taxa. As expected, Chlorophyceae—typically non-toxic—served as a comparative group; and toxigenic strains were highlighted as reference taxa [26,27]. The 18S rRNA and ITS sequences of isolate N9 were deposited in GenBank under accession numbers PQ110317 and PV799918, respectively.

3.3. Microalga Cultivation and Growth Rate

Parachlorella hussii (N9) growth was evaluated by several methods over two weeks of batch culture. The growth reached its maximum at day 7 in terms of cell number, and this level was maintained high until the end of the experiment. The dry weight reached its maximum at the end of the stationary phase, while the maximum specific growth rate (µmax d−1) was 0.572 ± 0.098. The biomass productivity increased between the first and the second week of culture (Table 1).

3.4. Polysaccharide Production and Yield

The biomass sugar content BCHO and RPSs were quantified during the entire cultivation period (Figure 4); the BCHO production reached 1.696 ± 0.069 g L−1 at Day 7 and attained its maximum of 2.598 ± 0.092 g L−1 at Day 14. The RPSs were lower; their production increased slowly until day 7 to give 0.242 ± 0.003 g L−1, and then the production rose considerably to reach 1.33 ± 0.037 g L−1 during the stationary phase.
The polysaccharide yield after extraction reached 18.06% (dry weight of the biomass) for the released polysaccharides (RPSs) with 0.807 ± 0.059 g L−1 and 45.58% for the CPSs with 1.975 ± 0.120 g L−1. Thus, the total PSs production was 2.782 g L−1.

3.5. Biochemical Analysis of Extracts and PSs Molecular Weight Determination

Biochemical analysis of the extracts revealed a high total sugar content: CPS-D7 with 62.98 ± 4.87%, CPS-D14 with 87.89 ± 3.60%, RPS-D7 with 95.60 ± 3.87%, and RPS-D14 with 76.32 ± 2.55%. Low protein content was observed: CPS-D7 with 1.31 ± 0.16%, CPS-D14 with 1.35 ± 0.69%, RPS-D7 with 0.74 ± 0.23%, and RPS-D14 with 0.49 ± 0.08%.
The RPS-D7 and RPS-D14 exhibited apparent Mw greater than or equal to ≥2 MDa. The CPS-D7 had different sizes; the distribution was as follows: 28.46 ± 0.024% (2 MDa), 13.98 ± 0.054% (1 MDa), 7.92 ± 0.020% (150 kDa), and 49.65 ± 0.058% (<50 kDa). Finally, CPS-D14 also revealed different polymer sizes, with 51.23 ± % (2 MDa), 12.32 ± 0.036% (1 MDa), 7.63 ± 0.006% (150 kDa), and 28.83 ± 0.046% (<50 kDa).
We used five dextran standards for SEC calibration, with the highest molecular weight being 2 MDa, which eluted at ~22.45 min. The RPS molecules (RPS-D7 and RPS-D14) eluted earlier, at ~21.52 min, suggesting they may be slightly larger in size. We reported the molecular weight as ‘≥2 MDa’ due to the lack of higher-mass standards. Given the influence of molecular conformation on elution behavior, the observed difference may reflect structural variations rather than a true difference in molecular weight.

3.6. Monosaccharide Composition

The monosaccharide composition (mol %) of both CPSs and RPSs was analyzed during exponential phase (RPS-D7 and CPS-D7) and stationary phase (RPS-D14 and CPS-D14); the HPLC results revealed a heteropolysaccharide composed of nine units with an abundance of rhamnose, followed by xylose, glucose, and galactose; the results indicate some significant differences in the composition between the two phases (Figure 5A). It was observed that the monosaccharidic profiles of CPSs and RPS were very similar, with some differences in the amounts of the monosugars. In the case of RPSs, high rhamnose content was ~55% in RPS-D14, which was significantly different from RPS-D7 with 45.1% (Figure 3). Additionally, galactose was significantly different; 14.1% in RPS-D7 but decreased to half, 6.6%, during the stationary phase. Uronic acids made up ~11% in both RPS-D7 and RPS-D14, with other monosaccharides presented in traces (<5%). Regarding CPS composition, the same remark was noticed regarding rhamnose, with a significant difference: 35.6% in CPS-D7 compared to 41.5% in CPS-D14. Additionally, significant differences were observed regarding glucose, xylose, and glucuronic acid (Figure 5B).

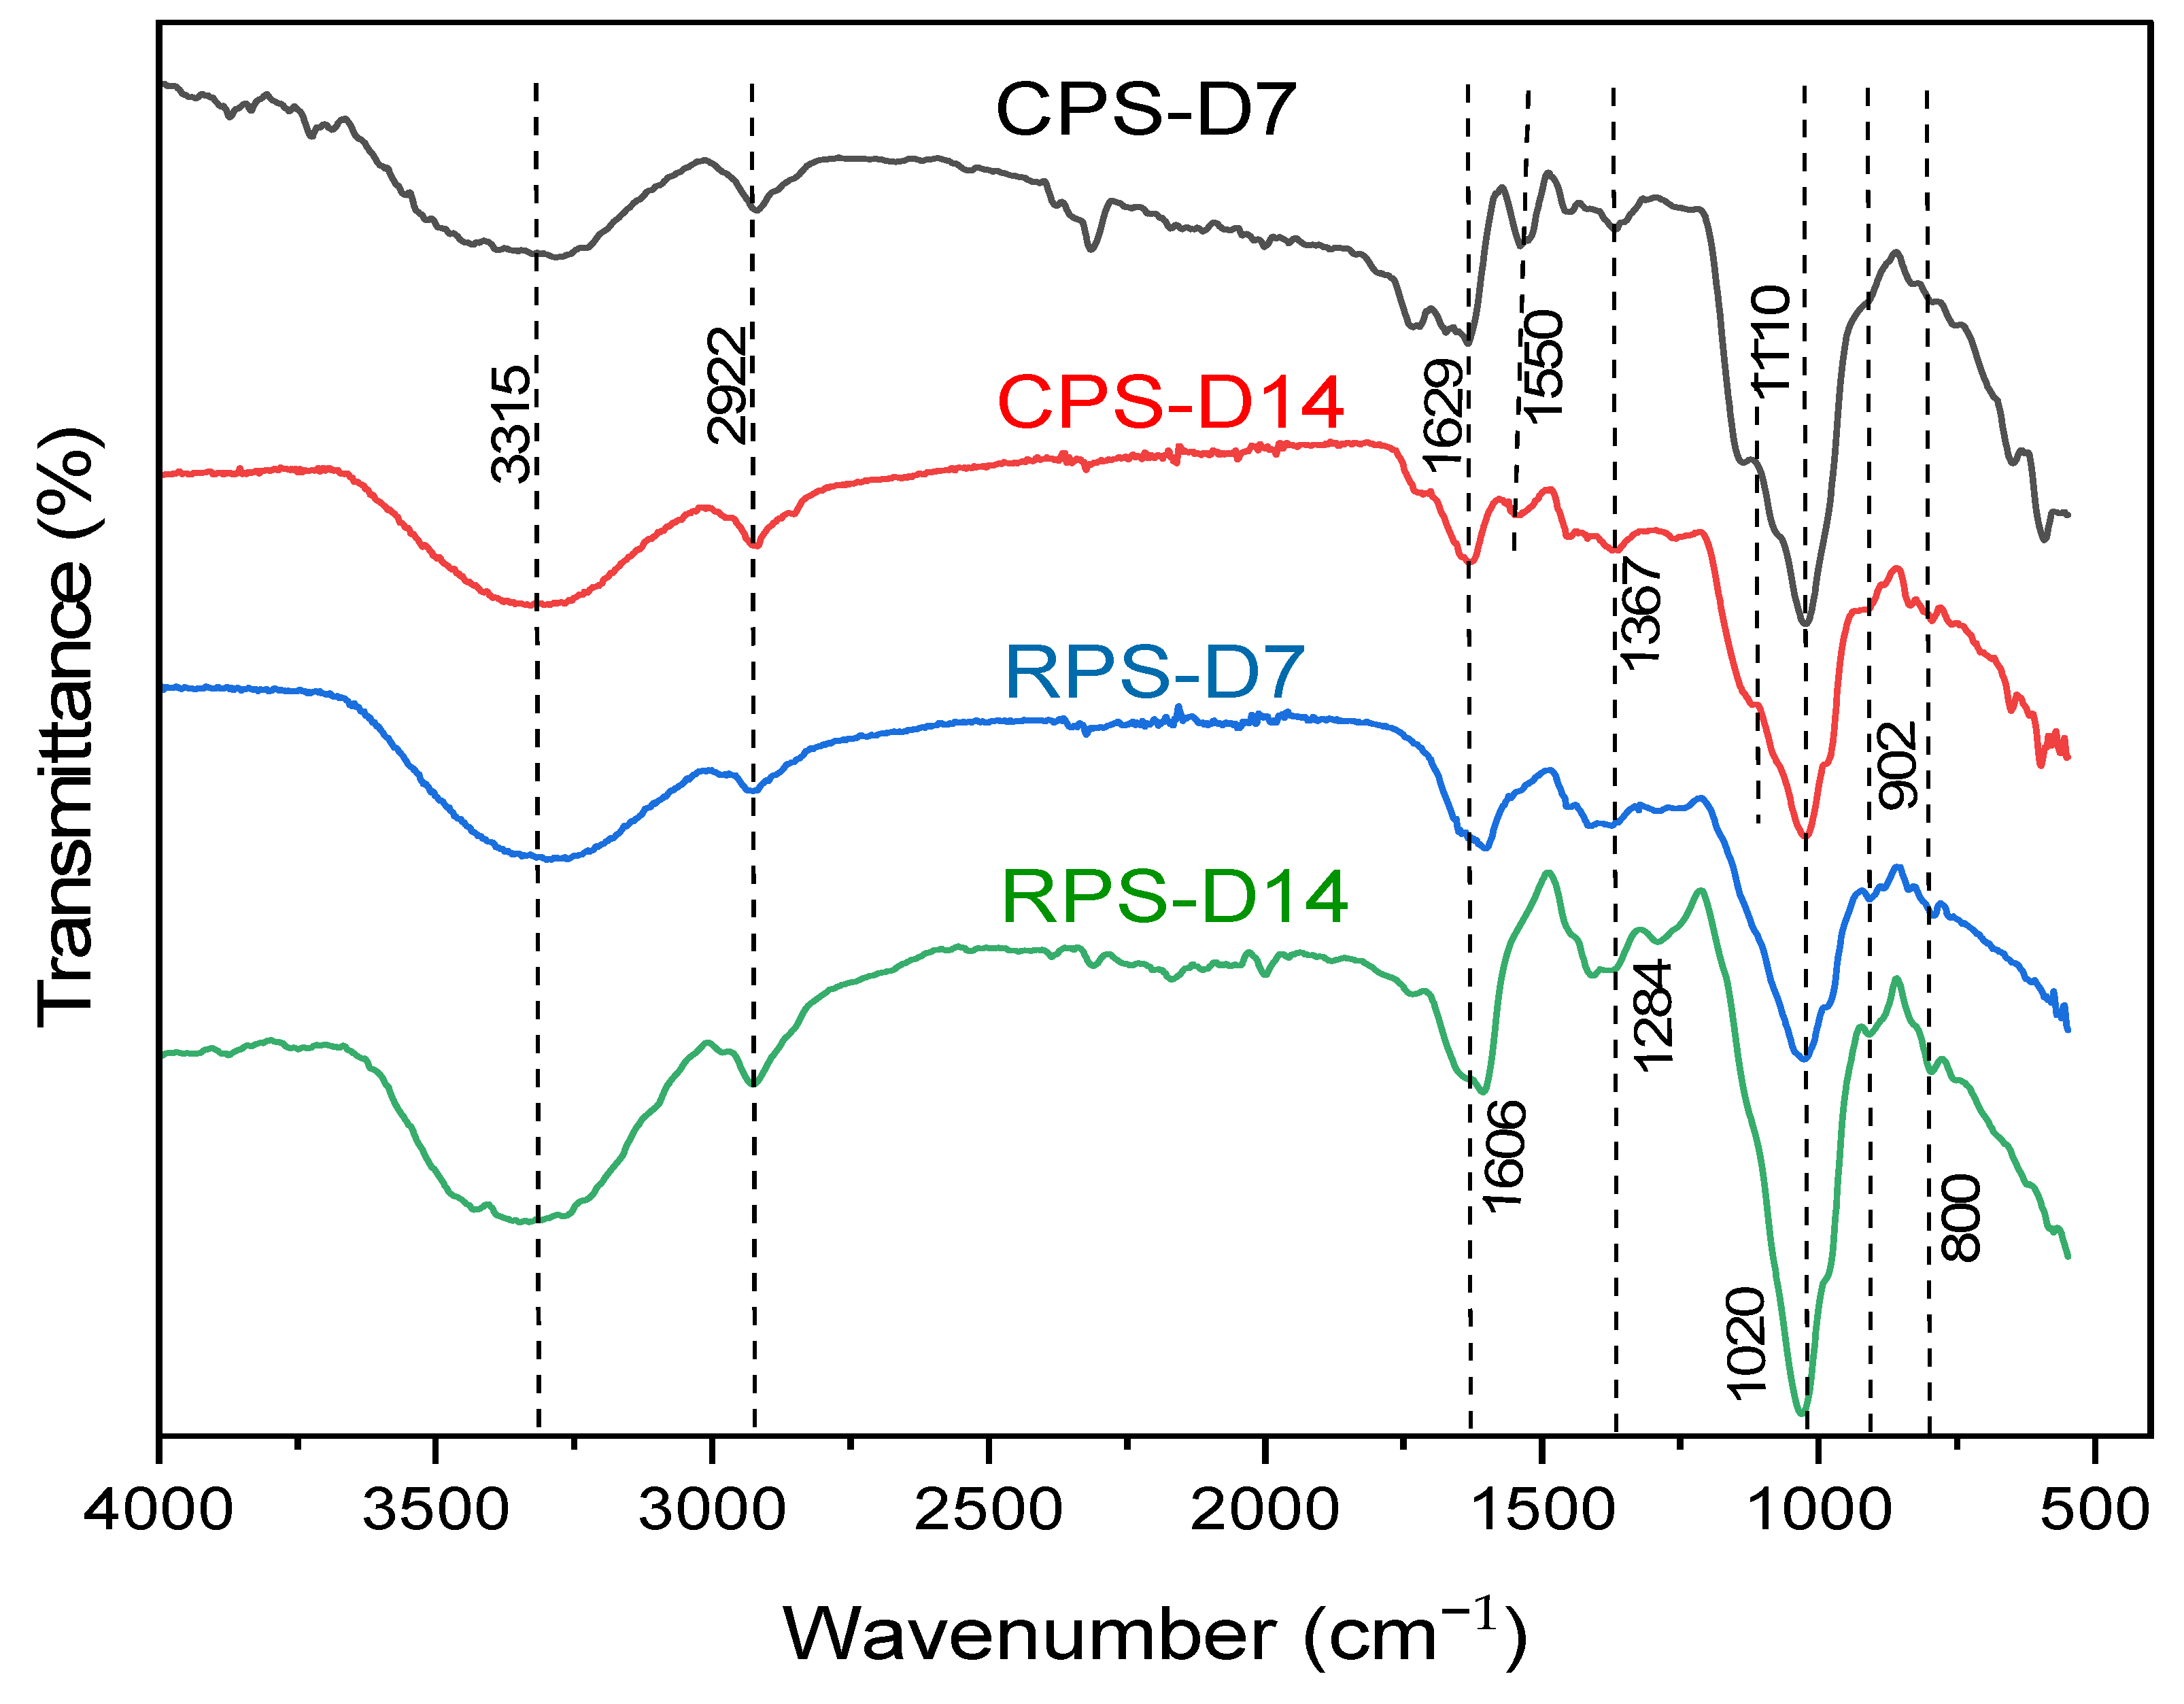
3.7. ATR Analysis of Polysaccharides

The functional groups of the lyophilized extracts CPS-D7, CPS-D14, RPS-D7, and RPS-D14 were determined employing ATR analysis; typical spectra of carbohydrates were obtained. Several peaks ranging from 3315 to 902 cm were obtained, demonstrating different functional groups (Figure 6).

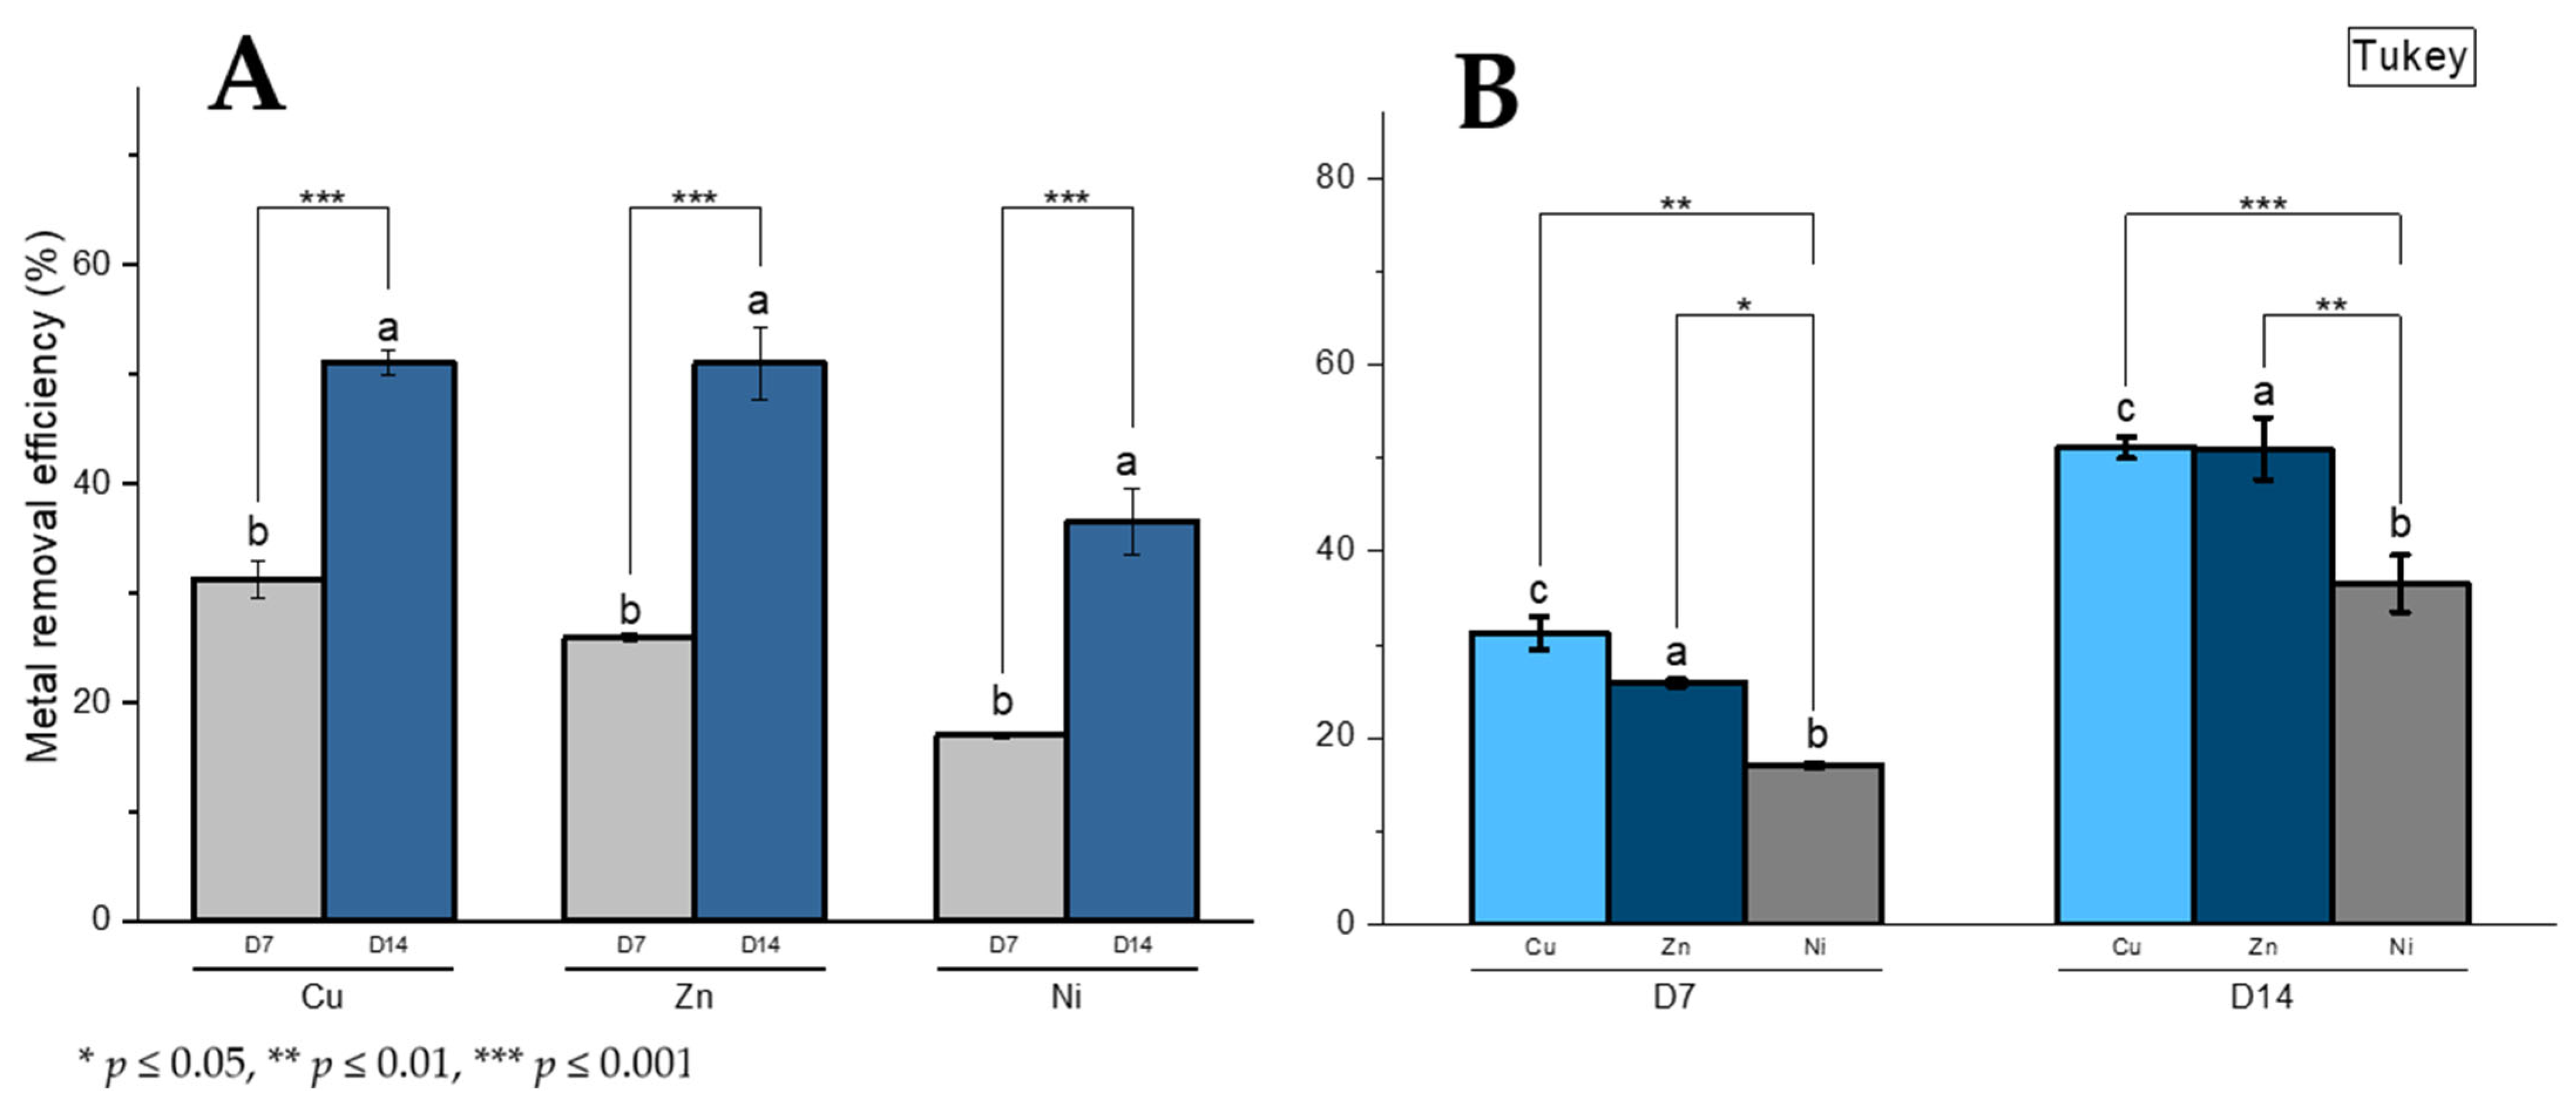
3.8. Metal Removal Capacity and Metal Removal Efficiency Determination

The metal removal capacity (qe) of the biomass during two growth phases (qe-D7 and qe-D14) was assessed, adopting three metals (Cu, Zn, and Ni) each at 10 mg/L concentration.
The metal affinity of P. hussii biomass followed the order Cu < Zn < Ni at both growth phases, with Cu and Zn metal removal capacity being roughly two-fold higher than Ni removal activity. A two-way ANOVA revealed significant main effects of Metal binding capacity (F = 67.94, p < 0.0001) and Growth phase (F = 184.41, p < 0.0001) on metal removal efficiency. Tukey HSD post hoc tests confirmed pairwise differences: D14 (14.00 ± 5.30) exhibited higher metal removal than D7 (9.33 ± 4.92; p < 0.0001), while Cu (16.91 ± 2.49) outperformed Zn (14.18 ± 2.73) and Ni (6.01 ± 2.11; all p < 0.001).
Within both D7 and D14 growth phases, metal type significantly influenced removal efficiency (p < 0.0001), Figure 7B. Cu removal capacity consistently outperformed Zn and Ni in both phases (D7: Cu = 14.45 ± 0.80 > Zn = 11.85 ± 0.41 > Ni = 4.33 ± 0.20; D14: Cu = 18.55 ± 1.33 > Zn = 16.52 ± 0.62 > Ni = 7.78 ± 0.99). While D14 universally enhanced removal capacity compared to D7 across all metals (p < 0.0001), the relative efficacy of metals (Cu > Zn > Ni) remained consistent between phases. These results confirm that Cu is the optimal metal for removal, regardless of growth phase, and D14 maximizes the metal removal across all metal types.
These results correspond to statistically significant higher metal removal efficiencies adopting D14-biomass compared to D7-biomass, exhibiting about a two-fold increase in removal efficiency values for the three metals tested (Figure 8A). In particular, Cu and Zn removal efficiencies exceeded 50%. Considering the metal type parameter in this removal process, the metal removal efficiency R% was significantly different between the three tested metals in each growth phase (Figure 8B).
A two-way ANOVA analysis revealed significant main effects of metal type (p < 0.0001) and growth phase (p < 0.0001) on metal removal efficiency (%). Zn exhibited the highest efficiency (38.50 ± 14.63), surpassing Ni (26.78 ± 11.41) and Cu (10.98 ± 19.07; Tukey HSD: Zn > Ni > Cu, p < 0.0001). The D14 growth phase significantly outperformed D7 (46.96 ± 7.38 vs. 24.74 ± 6.48, p < 0.0001). Zn in D14 achieved peak efficiency (51.05%), while Cu underperformed across phases. These findings prioritize Zn and D14 for optimal bioremediation, with consistent metal efficacy rankings independent of growth phase.

4. Discussion

This study highlights the interplay between growth phase, PS monosaccharidic composition, metal type, and heavy metal removal activity, underscoring the potential of unexplored microalgal strains as sources of novel PS molecules for environmental remediation. P. hussii ACOI 1508 has never been studied for its metal removal properties. To date, no published research has documented its ability to remove heavy metals, making our study the first to explore this aspect.
Overall, the growth dynamics of microalgae are influenced by a variety of factors, including strain type, cultivation conditions, and cultivation mode (e.g., photoautotrophic or mixotrophic) [7,19]. The current study reported a high growth rate under photoautotrophic conditions for the P. hussii (N9) strain, reaching 4.33 ± 0.005 g L−1 of biomass with µmax equal to 0.572 ± 0.098. Specific growth rates for Chlorella sp. have been documented in the range of 0.58–0.66 d−1 [39], which is consistent with the growth performance of the P. hussii (N9) strain. Besides, under mixotrophic cultivation, P. kessleri achieved a biomass concentration of 5.10 g L−1, with a specific growth rate of 0.8 d−1 [39]. While our data were obtained under standard conditions of cultivation (4.33 ± 0.005), optimized conditions can lead to higher yields. For example, Dictyosphaerium chlorelloides has been reported to reach biomass concentrations of up to 14 g L−1 within 17 days of cultivation in optimal conditions [17]. Additionally, Espírito Santo et al. (2023) have reported that Scenedesmus rubescens biomass increased by 3.2-fold, rising from 4.1 g L−1 to 13 g L−1 once culture conditions are improved [29].
The total PSs (CPSs and RPSs) production of P. hussii (N9) was 2.782 g L−1; these findings were similar to those obtained by Barboríková et al. (2019), who reported that Chlorella vulgaris obtained by semi-batch cultivation produced 3 g L−1 of PSs [40]. From the literature, the PSs production by cyanobacteria and microalgae is species-dependent, with production levels fluctuating from 0.5 g L−1 up to 20 g L−1 [41,42,43]. Under nitrate starvation, the RPS production reached 2.5 g L−1 for Porphyridium marinum during the stationary phase [44], which is lower than the total PSs produced in our study achieved without optimization. Similar findings were reported by Ciempiel et al. (2022) on the PS yield (16.6%) from P. kessleri, which was higher than PS from C. vulgaris compared in the same study [7]. Halaj et al. (2018) have reported lower PS yields ranging from 0.016 to 1.064 g L−1 in a report carried out on 17 different microalgal species [45].
Despite the ecological and biotechnological significance of microalgal PSs, the variations in monosaccharide composition across growth phases remain poorly understood. Microalgal PSs exhibit substantial diversity in monomers and their proportions, varying greatly not only across species but also between strains of the same species [46]. In general, the diversity in terms of the number (from two to ten) and types of monosaccharides they contain often features different arrangements of acidic and neutral sugars. Most of these polymers possess an anionic character due to uronic acids and other charged groups such as pyruvyl or sulfate [18,47,48].
Overall, the variation in monosaccharide composition among different microalgal species is largely attributed to the extensive taxonomic diversity within microalgae and strain-specific regulation [49,50]. In addition to phylogenetic differences, shifts in the monosaccharide profile of microalgal-derived polysaccharides can result from the interplay of multiple factors, including culture age, culture medium composition, nutrient availability or depletion, as well as the extraction method, solvent concentration, purification procedures, etc. These variables have been extensively discussed in previous studies and are known to influence the final polysaccharide’s composition. It is also important to highlight that even within the same strain, substantial variability in polysaccharide composition has been reported in the literature due to differences in cultivation, extraction, and analytical methodologies [48,49,50,51]. As well, in the case of P. hussii, strain-specific characteristics (i.e., phylogeny) are suggested to be the primary determinant of monosaccharide composition. However, operational factors further modulate the polysaccharide profile. Notably, extending the cultivation period for this strain revealed significant and continuous changes in monosaccharide content over time, which was found to improve functional properties of the strain (more metal removal potential).
Sushytskyi et al. (2020) have studied the PS composition from P. kessleri HY1; among the four fractions analyzed, two were to some extent very close to our finding regarding rhamnose content by 52.5% and 37.2% in PS-1 and HWE-2, respectively, compared to ~55% in RPS-D14 and ~36% in CPS-D7. However, they reported high galactose content compared to our PSs—between 6.1 and 14.1%—with 20.1% and 27.7% in PS-1 and HWE-2; respectively [52]. Again, similar results were reported by Sasaki et al. 2021 on extracellular PSs derived from Parachlorella sp. BX1.5, particularly the high rhamnose content with 48.5% and galactose content with 16.7% [53]. Uronic acids are commonly detected in the majority of PSs, indicating their predominantly anionic character. However, their content varies significantly across species, ranging from 0% in certain microalgae, such as S. obliquus, to 18% in K. faccidum, and can reach 35%, as reported in some studies [18,54].
Microalgal PSs consist of linear or branched long-chain molecules, with molecular weights ranging from 0.5 to 2 × 10⁶ Daltons [46]. Our results described PSs with Mw in the documented range from 50 kDa to up to 2 MDa. The differences in the Mw between RPSs and CPSs could be explained by the extraction method used; in the RPS extracts, the PSs were obtained by a direct cold alcoholic precipitation of the concentrated supernatant-free cells. However, the CPSs were obtained after a hot-acid extraction. Halaj et al. 2022 reported an extracellular PS of Mw 1,069,000 g mol−1 extracted from Dictyosphaerium chlorelloides [55]. Sasaki et al. (2021) reported a PS of high Mw (1.75 up to 2.11 × 10⁶ Da) isolated from P. kessleri BX1.5 EPS, which classifies it as the second-largest natural PS known. Its ultra-high Mw is the highest among natural glucans, surpassed only by sacran (>1.6 × 10⁷ Da), a PS derived from the cyanobacterium Aphanothece sacrum [54].
Typical spectra of carbohydrates were obtained, resulting from the analysis of the polysaccharide extracts by ATR spectroscopy; the large band at 3315 cm−1 noticed in all PSs was attributed to the stretching vibration of O-H in the constituent sugar residues, while the band at 2922 cm−1 reflected C-H stretching vibrations [56,57,58]. The bands at 1629 cm−1 and 1606 cm−1 in the four extracts and in the RPSs (RPS-D7 and RPS-D14), respectively, were characteristic of the asymmetric stretching vibration of the carboxylic groups, which are often found in PSs containing uronic acids [59,60]. Additionally, the weak band at 1550 cm−1 is usually associated with C=O stretching vibrations (carbonyl groups) or amide II bands (N-H bending and C-N stretching) in PSs. Moreover, the peak around 1284 cm−1 is typically associated with C-O stretching vibrations and C-O-H bending vibrations, while those at 1110 and 1020 cm−1 are often attributed to the stretching of the C-O-C bonds in the glycosidic linkages [57,58,60,61]. Finally, the weak peaks at 902 and 800 cm−1 are characteristic of the α-configuration of glycosidic linkages, particularly in α-linked glucose units [56,57].
The significant increase in metal removal capacity observed during the stationary phase for the three tested metals may be primarily attributed to variations in monosaccharide composition during this growth phase. These compositional changes likely influenced the structural conformations of both CPSs and RPSs, thereby enhancing their accessibility and affinity for metal binding. Studies indicated that the initial concentration of metal ions significantly influences their uptake by microalgae. This effect varies depending on the type of metal and the species of microalgae involved. Each microalgal species exhibits a distinct threshold for the initial concentration of specific metal ions. When the metal ion concentration exceeds this threshold, the microalgae’s metal removal performance is disrupted, leading to a notable decline in removal efficiency [62]. Urrutia et al. 2019, where they described a copper removal efficiency of 55% by C. vulgaris; however, the metal concentration used was lower than in the present study (0.5 mg L−1) [63]. Additionally, Mehta et al. (2001) demonstrated that C. vulgaris exhibits metal ion uptake efficiencies of 70% for nickel and 80% for copper at a solution concentration of 5.2 mg L−1. However, when the concentration increases to 10 mg L−1, the uptake efficiencies decrease significantly to 37% for nickel and 42% for copper. Again, maximum removal was noticed with less metal concentration at 2.5 mg L−1; the nickel and copper removal was 93 and 96%, respectively [62,64,65]. Furthermore, the lead removal performance by P. kessleri PSs decreased as the metal concentration increased, dropping from 47% at 10 mg L−1 to 25.5% at 150 mg L−1. In contrast, C. vulgaris PSs achieved its highest lead removal efficiency (49.3%) at 100 mg L−1 Pb2+, while the lowest removal was recorded at 50 mg L−1 Pb2+ [7]. This may indicate that higher removal efficiencies are obtained with lower metal concentrations. Additionally, it was reported that with an increase in adsorbent dose from 0.25 g d−3 to 2 g dm−3, the adsorption capacity for Cu2+, Pb2+, and Cd2+ decreased from 129.7, 133.8, and 95.2 mg g−1 to 24.4, 24.9, and 23.9 mg g−1, respectively. The highest adsorption capacity was achieved at the lowest adsorbent dosage. These results are consistent with the findings of other researchers who suggested that higher adsorbent doses can reduce equilibrium adsorption capacities, likely due to the increased solid density limiting the availability of adsorption sites [10]. As well, in our case, the dry weight was 1.73 ± 0.230 g L−1 and 2.3 ± 0.264 g L−1 during the log phase and stationary phase, which is considered high, which may interfere with the removal activity.
In this study, the culture age positively influenced by two-fold the efficiency of the metal removal of Cu2+, Zn2+, and Ni2+ in the stationary phase. This could be explained by more surface adsorption and more available binding sites on the CPS during the stationary phase, as it was reported that the surface adsorption contributes to about 70% of the total Cu/Ni ion sorption [14,66]. A review of Monteiro and Castro (2012) highlighted the metal sorption capabilities of various organisms, including microalgae, bacteria, fungi, and multicellular organisms, in comparison with physicochemical sorbents (resins). The study emphasized that microalgae may outperform other biological and physicochemical sorbents in terms of metal removal efficiency. The sorption capacities were reported to range from 25.4 to 389 mg g−1 under pH conditions of pH 2–7, with the ability to tolerate metal concentrations ranging from 20 to 20,000 mg L−1 [67].
Overall, the biosorption of metal ions is influenced by two key factors: the intrinsic properties of the metal ions (such as ionic radius and electronegativity) and the features of the biosorbent (including surface area and the presence of functional groups). Additionally, the metal adsorption capacity of functional groups in PSs is affected by external conditions, such as solution pH and the presence of competing ions. However, simply quantifying the number of charged groups on a polymer is insufficient to predict its metal-binding efficiency. This is because the accessibility of these groups to metal ions is heavily influenced by the polymer’s conformational structure, which may render some charged sites inaccessible. Consequently, effective ion uptake is determined not only by the density of charges but also by their spatial distribution across the polymer matrix [42,48].
Metal speciation in solution is a critical factor in biosorption processes, as metals in aqueous solutions can exist in various ionic forms depending on pH. For example, Cu(II) primarily exists as Cu2+ at pH ≤ 5, while at pH 4–5, species such as Cu(OH)+ emerge, and Cu(OH)2 dominates at pH > 6. Adsorption efficiency may decline beyond a specific pH due to metal ion hydrolysis and the increased presence of hydroxyl ions or anionic species in the solution [68,69]. Similarly, nickel predominantly occurs as Ni2+ at pH 2–3, but at pH 4.5–6, partial hydrolysis leads to the formation of Ni(OH)+ and Ni(OH)2, with removal likely achieved through both precipitation and sorption. The maximum biosorption capacity for Ni2+ was 10.35 mg/g, with an efficiency of 41.63%, both observed at pH 5. Optimal biosorption capacities for Cu2+ and Ni2+ were consistently achieved at pH 5 [68,69].

5. Conclusions

The present study investigated the capsular microalga Parachlorella hussii strain N9, focusing on the compositional and functional dynamics of its polysaccharides across different growth phases. For the first time, the monosaccharide profile of P. hussii was analyzed in detail, revealing growth phase-dependent biochemical modulation, particularly a marked enrichment in rhamnose during the stationary phase. This rhamnose-dominant shift is of particular interest, as it coincides with a significant enhancement in heavy metal removal efficiency observed in the same phase.
Our findings suggest a connection between monosaccharide composition and biosorptive performance, providing compelling evidence that the biochemical composition of the polysaccharide plays a critical role in mediating metal ion interactions. The increased metal-binding capacity in the stationary phase suggests that rhamnose, along with other functionalized sugars, may contribute to the formation of high-affinity binding sites, thereby enhancing the microalga’s remediation potential. Moreover, the high molecular weight of the released polysaccharides supports their potential as stable and effective biosorbents, with physicochemical properties suitable for industrial-scale applications. By offering a molecular-level understanding of the mechanisms underpinning heavy metal removal, this study introduces P. hussii N9 as a novel, resilient, and environmentally relevant microalgal candidate for bioremediation and for future biotechnological applications to combat environmental contamination by toxic metals.

Author Contributions

Conceptualization, methodology, formal analysis, investigation, writing—original draft preparation, K.G.; Conceptualization, investigation, data curation, visualization, data curation, M.C., G.D. and H.B.; supervision, review and editing, validation, A.A. and Z.B. All authors have read and agreed to the published version of the manuscript.

Funding

This research received no external funding.

Institutional Review Board Statement

Not applicable.

Data Availability Statement

The datasets generated and/or analyzed during the current study are available from the corresponding author upon reasonable request.

Acknowledgments

The Authors would like to thank Francesca Decorosi, Genexpress laboratory-DAGRI, University of Florence, Italy, for her contribution to the phylogenetic study made in the paper.

Conflicts of Interest

The authors declare no conflicts of interest.

Abbreviations

The following abbreviations are used in this manuscript:
RPSsReleased polysaccharides
CPSsCapsular polysaccharides
PSsPolysaccharides
HPLChigh-performance liquid chromatography
ATRAttenuated total reflection
BBMBold’s Basal medium
DWDry weight
DCCDirect cell count
qeMetal removal capacity
R%Metal removal efficiency percentage
TFATrifluoroacetic Acid
BCHOBiomass sugar content
MwMolecular weight
SECSize exclusion chromatography

References

  1. De Philippis, R.; Paperi, R.; Sili, C. Heavy metal sorption by released polysaccharides and whole cultures of two exopolysaccharide-producing cyanobacteria. Biodegradation 2007, 18, 181–187. [Google Scholar] [CrossRef] [PubMed]
  2. Febrianto, J.; Kosasih, A.N.; Sunarso, J.; Ju, Y.-H.; Indraswati, N.; Ismadji, S. Equilibrium and kinetic studies in adsorption of heavy metals using biosorbent: A summary of recent studies. J. Hazard. Mater. 2009, 162, 616–645. [Google Scholar] [CrossRef] [PubMed]
  3. Barquilha, C.; Cossich, E.; Tavares, C.; Silva, E. Biosorption of nickel(II) and copper(II) ions in batch and fixed-bed columns by free and immobilized marine algae Sargassum sp. J. Clean. Prod. 2017, 150, 58–64. [Google Scholar] [CrossRef]
  4. Fawzy, M.A.; Hifney, A.F.; Adam, M.S.; Al-Badaani, A.A. Biosorption of cobalt and its effect on growth and metabolites of Synechocystis pevalekii and Scenedesmus bernardii: Isothermal analysis. Environ. Technol. Innov. 2020, 19, 100953. [Google Scholar] [CrossRef]
  5. Bauenova, M.O.; Sadvakasova, A.K.; Mustapayeva, Z.O.; Kokociński, M.; Zayadan, B.K.; Wojciechowicz, M.K.; Balouch, H.; Akmukhanova, N.R.; Alwasel, S.; Allakhverdiev, S.I. Potential of microalgae Parachlorella kessleri Bh-2 as bioremediation agent of heavy metals cadmium and chromium. Algal Res. 2021, 59, 102463. [Google Scholar] [CrossRef]
  6. Shrestha, R.; Ban, S.; Devkota, S.; Sharma, S.; Joshi, R.; Tiwari, A.P.; Kim, H.Y.; Joshi, M.K. Technological trends in heavy metals removal from industrial wastewater: A review. J. Environ. Chem. Eng. 2021, 9, 105688. [Google Scholar] [CrossRef]
  7. Ciempiel, W.; Czemierska, M.; Szymańska-Chargot, M.; Zdunek, A.; Wiącek, D.; Jarosz-Wilkołazka, A.; Krzemińska, I. Soluble Extracellular Polymeric Substances Produced by Parachlorella kessleri and Chlorella vulgaris: Biochemical Characterization and Assessment of Their Cadmium and Lead Sorption Abilities. Molecules 2022, 27, 7153. [Google Scholar] [CrossRef]
  8. Ciani, M.; Decorosi, F.; Ratti, C.; De Philippis, R.; Adessi, A. Semi-continuous cultivation of EPS-producing marine cyanobacteria: A green biotechnology to remove dissolved metals obtaining metal-organic materials. N. Biotechnol. 2024, 82, 33–42. [Google Scholar] [CrossRef]
  9. Xie, Y.; Li, H.; Wang, X.; Ng, I.-S.; Lu, Y.; Jing, K. Kinetic simulating of Cr(VI) removal by the waste Chlorella vulgaris biomass. J. Taiwan. Inst. Chem. Eng. 2014, 45, 1773–1782. [Google Scholar] [CrossRef]
  10. Goher, M.E.; El-Monem, A.M.A.; Abdel-Satar, A.M.; Ali, M.H.; Hussian, A.-E.M.; Napiórkowska-Krzebietke, A. Biosorption of some toxic metals from aqueous solution using non-living algal cells of Chlorella vulgaris. J. Elementol. 2016, 21, 703–714. [Google Scholar] [CrossRef]
  11. Abu Al-Rub, F.; El-Naas, M.; Ashour, I.; Al-Marzouqi, M. Biosorption of copper on Chlorella vulgaris from single, binary and ternary metal aqueous solutions. Process. Biochem. 2006, 41, 457–464. [Google Scholar] [CrossRef]
  12. Ahmad, A.; Bhat, A.; Buang, A. Biosorption of transition metals by freely suspended and Ca-alginate immobilised with Chlorella vulgaris: Kinetic and equilibrium modeling. J. Clean. Prod. 2018, 171, 1361–1375. [Google Scholar] [CrossRef]
  13. Akhtar, N.; Iqbal, J.; Iqbal, M. Removal and recovery of nickel(II) from aqueous solution by loofa sponge-immobilized biomass of Chlorella sorokiniana: Characterization studies. J. Hazard. Mater. 2004, 108, 85–94. [Google Scholar] [CrossRef]
  14. Mallick, N. Biotechnological potential of Chlorella vulgaris for accumulation of Cu and Ni from single and binary metal solutions. World J. Microbiol. Biotechnol. 2003, 19, 695–701. [Google Scholar] [CrossRef]
  15. Avinash, B.J.; Mishra. Microbial Exopolysaccharides. Prokaryotes Appl. Bacteriol. Biotechnol. 2013, 9783642313, 1–393. [Google Scholar] [CrossRef]
  16. Babiak, W.; Krzemińska, I. Extracellular polymeric substances (EPS) as microalgal bioproducts: A review of factors affecting EPS synthesis and application in flocculation processes. Energies 2021, 14, 4007. [Google Scholar] [CrossRef]
  17. Kronusová, O.; Kaštánek, P.; Koyun, G.; Kaštánek, F.; Brányik, T. Factors Influencing the Production of Extracellular Polysaccharides by the Green Algae Dictyosphaerium chlorelloides and Their Isolation, Purification, and Composition. Microorganisms 2022, 10, 1473. [Google Scholar] [CrossRef]
  18. Delattre, C.; Pierre, G.; Laroche, C.; Michaud, P. Production, extraction and characterization of microalgal and cyanobacterial exopolysaccharides. Biotechnol. Adv. 2016, 34, 1159–1179. [Google Scholar] [CrossRef]
  19. Guehaz, K.; Boual, Z.; Abdou, I.; Telli, A.; Belkhalfa, H. Microalgae’s polysaccharides, are they potent antioxidants? Critical review. Arch. Microbiol. 2024, 206, 14. [Google Scholar] [CrossRef]
  20. Guehaz, K.; Boual, Z.; Telli, A.; Meskher, H.; Belkhalfa, H.; Pierre, G.; Michaud, P.; Adessi, A. A sulfated exopolysaccharide derived from Chlorella sp. exhibiting in vitro anti-α-d-Glucosidase activity. Arch. Microbiol. 2024, 206, 218. [Google Scholar] [CrossRef]
  21. Corzo, J.; Pérez-Galdona, R.; León-Barrios, M.; Gutiérrez-Navarro, A.M. Alcian blue fixation allows silver staining of the isolated polysaccharide component of bacterial lipopolysaccharides in polyacrylamide gels. Electrophoresis 1991, 12, 439–441. [Google Scholar] [CrossRef] [PubMed]
  22. Pini, F.; Frascella, A.; Santopolo, L.; Bazzicalupo, M.; Biondi, E.G.; Scotti, C.; Mengoni, A. Exploring the plant-associated bacterial communities in Medicago sativa L. BMC Microbiol. 2012, 12, 78. [Google Scholar] [CrossRef] [PubMed]
  23. Piampiano, E.; Pini, F.; Biondi, N.; Pastorelli, R.; Giovannetti, L.; Viti, C. Analysis of microbiota in cultures of the green microalga Tetraselmis suecica. Eur. J. Phycol. 2019, 54, 497–508. [Google Scholar] [CrossRef]
  24. Medlin, L.; Elwood, H.J.; Stickel, S.; Sogin, M.L. The characterization of enzymatically amplified eukaryotic l6S-iike rRNA-coding regions. Gene 1988, 71, 491–499. [Google Scholar] [CrossRef]
  25. Bruns, T.D.; Lee, S.B.; Taylor, J.W. Amplification and direct sequencing of fungal ribosomal RNA Genes for phylogenetics. PCR Protoc. Guide Methods Appl. 1990, 18, 315–322. [Google Scholar]
  26. Tamura, K.; Stecher, G.; Kumar, S.; Battistuzzi, F.U. MEGA11: Molecular Evolutionary Genetics Analysis Version 11. Mol. Biol. Evol. 2021, 38, 3022–3027. [Google Scholar] [CrossRef]
  27. Zingone, A.; Escalera, L.; Aligizaki, K.; Fernández-Tejedor, M.; Ismael, A.; Montresor, M.; Mozetič, P.; Taş, S.; Totti, C. Toxic marine microalgae and noxious blooms in the Mediterranean Sea: A contribution to the Global HAB Status Report. Harmful Algae 2021, 102, 101843. [Google Scholar] [CrossRef]
  28. Nigam, H.; Malik, A.; Singh, V. A novel nanoemulsion-based microalgal growth medium for enhanced biomass production. Biotechnol. Biofuels 2021, 14, 111. [Google Scholar] [CrossRef]
  29. Santo, G.E.; Barros, A.; Costa, M.; Pereira, H.; Trovão, M.; Cardoso, H.; Carvalho, B.; Soares, M.; Correia, N.; Silva, J.T.; et al. Scenedesmus rubescens Heterotrophic Production Strategies for Added Value Biomass. Mar. Drugs 2023, 21, 411. [Google Scholar] [CrossRef]
  30. DuBois, M.; Gilles, K.A.; Hamilton, J.K.; Rebers, P.A.; Smith, F. Colorimetric Method for Determination of Sugars and Related Substances. Anal. Chem. 1956, 28, 350–356. [Google Scholar] [CrossRef]
  31. Barranguet, C.; van Beusekom, S.; Veuger, B.; Neu, T.; Manders, E.; Sinke, J.; Admiraal, W. Studying undisturbed autotrophic biofilms: Still a technical challenge. Aquat. Microb. Ecol. 2004, 34, 1–9. [Google Scholar] [CrossRef]
  32. Di Pippo, F.; Ellwood, N.T.W.; Guzzon, A.; Siliato, L.; Micheletti, E.; De Philippis, R.; Albertano, P.B. Effect of light and temperature on biomass, photosynthesis and capsular polysaccharides in cultured phototrophic biofilms. J. Appl. Phycol. 2012, 24, 211–220. [Google Scholar] [CrossRef]
  33. Lowry, O.H.; Randall, R.J. Protein Measurement byt the Folin Reagent. J. Biol. Chem. 1951, 193, 265–275. [Google Scholar] [CrossRef]
  34. Zanolla, V.; Biondi, N.; Niccolai, A.; Abiusi, F.; Adessi, A.; Rodolfi, L.; Tredici, M.R. Protein, phycocyanin, and polysaccharide production by Arthrospira platensis grown with LED light in annular photobioreactors. J. Appl. Phycol. 2022, 34, 1189–1199. [Google Scholar] [CrossRef]
  35. Caichiolo, M.; Zampieri, R.M.; Adessi, A.; Ciani, M.; Caldara, F.; Valle, L.D.; La Rocca, N. Microbial Polysaccharides Extracted from Different Mature Muds of the Euganean Thermal District Show Similar Anti-Inflammatory Activity In Vivo. Int. J. Mol. Sci. 2024, 25, 4999. [Google Scholar] [CrossRef]
  36. Mota, R.; Vidal, R.; Pandeirada, C.; Flores, C.; Adessi, A.; De Philippis, R.; Nunes, C.; Coimbra, M.A.; Tamagnini, P. Cyanoflan: A cyanobacterial sulfated carbohydrate polymer with emulsifying properties. Carbohydr. Polym. 2020, 229, 115525. [Google Scholar] [CrossRef]
  37. Flores, C.; Lima, R.T.; Adessi, A.; Sousa, A.; Pereira, S.B.; Granja, P.L.; De Philippis, R.; Soares, P.; Tamagnini, P. Characterization and antitumor activity of the extracellular carbohydrate polymer from the cyanobacterium Synechocystis ΔsigF mutant. Int. J. Biol. Macromol. 2019, 136, 1219–1227. [Google Scholar] [CrossRef]
  38. Guezoul, O.; Chenchouni, H.; Sekour, M.; Ababsa, L.; Souttou, K.; Doumandji, S. An avifaunal survey of mesic manmade ecosystems “Oases” in algerian hot-hyperarid lands. Saudi J. Biol. Sci. 2013, 20, 37–43. [Google Scholar] [CrossRef]
  39. Piasecka, A.; Krzemińska, I.; Tys, J. Enrichment of Parachlorella kessleri biomass with bioproducts: Oil and protein by utilization of beet molasses. J. Appl. Phycol. 2017, 29, 1735–1743. [Google Scholar] [CrossRef]
  40. Barboríková, J.; Šutovská, M.; Kazimierová, I.; Jošková, M.; Fraňová, S.; Kopecký, J.; Capek, P. Extracellular polysaccharide produced by Chlorella vulgaris—Chemical characterization and anti-asthmatic profile. Int. J. Biol. Macromol. 2019, 135, 1–11. [Google Scholar] [CrossRef]
  41. Markou, G.; Nerantzis, E. Microalgae for high-value compounds and biofuels production: A review with focus on cultivation under stress conditions. Biotechnol. Adv. 2013, 31, 1532–1542. [Google Scholar] [CrossRef] [PubMed]
  42. Naveed, S.; Li, C.; Lu, X.; Chen, S.; Yin, B.; Zhang, C.; Ge, Y. Microalgal extracellular polymeric substances and their interactions with metal(loid)s: A review. Crit. Rev. Environ. Sci. Technol. 2019, 49, 1769–1802. [Google Scholar] [CrossRef]
  43. Tounsi, L.; Hentati, F.; Ben Hlima, H.; Barkallah, M.; Smaoui, S.; Fendri, I.; Michaud, P.; Abdelkafi, S. Microalgae as feedstock for bioactive polysaccharides. Int. J. Biol. Macromol. 2022, 221, 1238–1250. [Google Scholar] [CrossRef]
  44. Soanen, N.; Da Silva, E.; Gardarin, C.; Michaud, P.; Laroche, C. Improvement of exopolysaccharide production by Porphyridium marinum. Bioresour. Technol. 2016, 213, 231–238. [Google Scholar] [CrossRef]
  45. Halaj, M.; Chválová, B.; Cepák, V.; Lukavský, J.; Capek, P. Searching for microalgal species producing extracellular biopolymers. Chem. Pap. 2018, 72, 2673–2678. [Google Scholar] [CrossRef]
  46. Xiao, R.; Zheng, Y. Overview of microalgal extracellular polymeric substances (EPS) and their applications. Biotechnol. Adv. 2016, 34, 1225–1244. [Google Scholar] [CrossRef]
  47. Raposo, M.F.; De Morais, R.M.S.C.; De Morais, A.M.M.B. Bioactivity and applications of sulphated polysaccharides from marine microalgae. Mar. Drugs 2013, 11, 233–252. [Google Scholar] [CrossRef]
  48. De Philippis, R. Exocellular polysaccharides from cyanobacteria and their possible applications. FEMS Microbiol. Rev. 1998, 22, 151–175. [Google Scholar] [CrossRef]
  49. Laroche, C. Exopolysaccharides from Microalgae and Cyanobacteria: Diversity of Strains, Production Strategies, and Applications. Mar. Drugs 2022, 20, 336. [Google Scholar] [CrossRef]
  50. Madsen, M.A.; Semerdzhiev, S.; Twigg, J.D.; Moss, C.; Bavington, C.D.; Amtmann, A. Environmental modulation of exopolysaccharide production in the cyanobacterium Synechocystis 6803. Appl. Microbiol. Biotechnol. 2023, 107, 6121–6134. [Google Scholar] [CrossRef]
  51. Barkia, I.; Saari, N.; Manning, S.R. Microalgae for high-value products towards human health and nutrition. Mar. Drugs 2019, 17, 304. [Google Scholar] [CrossRef] [PubMed]
  52. Pereira, S.; Zille, A.; Micheletti, E.; Moradas-Ferreira, P.; De Philippis, R.; Tamagnini, P. Complexity of cyanobacterial exopolysaccharides: Composition, structures, inducing factors and putative genes involved in their biosynthesis and assembly. FEMS Microbiol. Rev. 2009, 33, 917–941. [Google Scholar] [CrossRef] [PubMed]
  53. Sushytskyi, L.; Lukáč, P.; Synytsya, A.; Bleha, R.; Rajsiglová, L.; Capek, P.; Pohl, R.; Vannucci, L.; Čopíková, J.; Kaštánek, P. Immunoactive polysaccharides produced by heterotrophic mutant of green microalga Parachlorella kessleri HY1 (Chlorellaceae). Carbohydr. Polym. 2020, 246, 116588. [Google Scholar] [CrossRef] [PubMed]
  54. Sasaki, M.; Takagi, A.; Sasaki, D.; Nakamura, A.; Asayama, M. Characteristics and function of an extracellular polysaccharide from a green alga Parachlorella. Carbohydr. Polym. 2020, 254, 117252. [Google Scholar] [CrossRef]
  55. Halaj, M.; Matulová, M.; Capek, P. Structural features of biologically active extracellular polysaccharide produced by green microalgae Dictyosphaerium chlorelloides. Int. J. Biol. Macromol. 2022, 214, 152–161. [Google Scholar] [CrossRef]
  56. Sun, Y.; Wang, H.; Guo, G.; Pu, Y.; Yan, B. The isolation and antioxidant activity of polysaccharides from the marine microalgae Isochrysis galbana. Carbohydr. Polym. 2014, 113, 22–31. [Google Scholar] [CrossRef]
  57. Malinowska, E.; Klimaszewska, M.; Strączek, T.; Schneider, K.; Kapusta, C.; Podsadni, P.; Łapienis, G.; Dawidowski, M.; Kleps, J.; Górska, S.; et al. Selenized polysaccharides—Biosynthesis and structural analysis. Carbohydr. Polym. 2018, 198, 407–417. [Google Scholar] [CrossRef]
  58. Trabelsi, L.; Chaieb, O.; Mnari, A.; Abid-Essafi, S.; Aleya, L. Partial characterization and antioxidant and antiproliferative activities of the aqueous extracellular polysaccharides from the thermophilic microalgae Graesiella sp. BMC Complement. Altern. Med. 2016, 16, 210. [Google Scholar] [CrossRef]
  59. Li, H.; Su, L.; Chen, S.; Zhao, L.; Wang, H.; Ding, F.; Chen, H.; Shi, R.; Wang, Y.; Huang, Z. Physicochemical Characterization and Functional Analysis of the Polysaccharide from the Edible Microalga Nostoc sphaeroides. Molecules 2018, 23, 508. [Google Scholar] [CrossRef]
  60. Kamble, P.; Cheriyamundath, S.; Lopus, M.; Sirisha, V.L. Chemical characteristics, antioxidant and anticancer potential of sulfated polysaccharides from Chlamydomonas reinhardtii. J. Appl. Phycol. 2018, 30, 1641–1653. [Google Scholar] [CrossRef]
  61. Molaei, H.; Jahanbin, K. Structural features of a new water-soluble polysaccharide from the gum exudates of Amygdalus scoparia Spach (Zedo gum). Carbohydr. Polym. 2018, 182, 98–105. [Google Scholar] [CrossRef]
  62. Manzoor, F.; Karbassi, A.; Golzary, A. Removal of Heavy Metal Contaminants from Wastewater by Using Chlorella vulgaris Beijerinck: A Review. Curr. Environ. Manag. 2019, 6, 174–187. [Google Scholar] [CrossRef]
  63. Urrutia, C.; Yañez-Mansilla, E.; Jeison, D. Bioremoval of heavy metals from metal mine tailings water using microalgae biomass. Algal Res. 2019, 43, 101659. [Google Scholar] [CrossRef]
  64. Mehta, S.K.; Gaur, J.P. Characterization and optimization of Ni and Cu sorption from aqueous solution by Chlorella vulgaris. Ecol. Eng. 2001, 18, 1–13. [Google Scholar] [CrossRef]
  65. Mehta, S.; Gaur, J. Concurrent sorption of Ni2+ and Cu2+ by Chlorella vulgaris from a binary metal solution. Appl. Microbiol. Biotechnol. 2001, 55, 379–382. [Google Scholar] [CrossRef]
  66. Mubashar, M.; Naveed, M.; Mustafa, A.; Ashraf, S.; Baig, K.S.; Alamri, S.; Siddiqui, M.H.; Zabochnicka-Świątek, M.; Szota, M.; Kalaji, H.M. Experimental Investigation of Chlorella vulgaris and Enterobacter sp. MN17 for Decolorization and Removal of Heavy Metals from Textile Wastewater. Water 2020, 12, 3034. [Google Scholar] [CrossRef]
  67. Monteiro, C.M.; Castro, P.M.L.; Malcata, F.X. Metal uptake by microalgae: Underlying mechanisms and practical applications. Biotechnol. Prog. 2012, 28, 299–311. [Google Scholar] [CrossRef]
  68. Petrovič, A.; Simonič, M. Removal of heavy metal ions from drinking water by alginate-immobilised Chlorella sorokiniana. Int. J. Environ. Sci. Technol. 2016, 13, 1761–1780. [Google Scholar] [CrossRef]
  69. Abdel-ghani, N.T.; El-chaghaby, G.A. Biosorption for Metal Ions Removal From Aqueous Solutions: A Review of recent studies. Int. J. Latest Res. Sci. Technol. 2014, 3, 24–42. [Google Scholar]
Figure 1. Sampling site and the geographic illustration of Chott Aïn El-Beida Lake, Algeria.
Polysaccharides 06 00058 g001
Figure 2. (A): microscopic observation after staining with the India ink; (B): microscopic observation after staining with Alcian blue 0.1% (magnification 100×).
Polysaccharides 06 00058 g002
Figure 3. Phylogenetic tree of partial 18S rRNA gene sequences and ITS sequence of N9 strain―belonging to Parachlorella hussii ACOI 1508, in the green box―and related microalgae. The evolutionary history was inferred using the UPGMA method. The percentage of replicate trees in which the associated taxa clustered together in the bootstrap test (1000 replicates) is shown next to the branches. The evolutionary distances were computed using the Maximum Composite Likelihood method and are in the units of the number of base substitutions per site. The corresponding GenBank accession numbers for 18S rRNA and ITS genes of each strain are indicated in brackets. Toxic strains―in the red box―belonging to different microalgal classes were reported with green Chlorophyceae to check the biosecurity threats of the isolated strain N9 [26,27].
Polysaccharides 06 00058 g003
Figure 4. RPS production (g L−1) and BCHO (g L−1) measured during batch cultivation over two weeks of growth.
Polysaccharides 06 00058 g004
Figure 5. Monosaccharidic composition of RPS (A) and CPS (B) produced by Parachlorella hussii at day 7 (RPS-D7 and CPS-D7) and day 14 (RPS-D14 and CPS-D14). Histograms representing means and standard error of duplicate replicates; nd: not detected. The asterisk indicates significant difference (Student’s t-test, p < 0.05). Monosaccharide composition is expressed as molar %. Abbreviations: Fuc, fucose; Rha, rhamnose; GalN, galactosamine; Ara, arabinose; GlcN, glucosamine; Gal, galactose; Glc, glucose; Man, mannose; Xyl, xylose; Fru, fructose; Rib, ribose; GalA, galacturonic acid; GlcA, glucuronic acid.
Polysaccharides 06 00058 g005
Figure 6. ATR analysis of the CPS-D7, CPS-D14, RPS-D7, and RPS-D14 polysaccharides.
Polysaccharides 06 00058 g006
Figure 7. Cu, Zn, and Ni removal capacity of the biomass collected at the exponential (D7) and stationary phase (D14). (A) Growth phase significance; (B) Metal type significance. Histograms representing means and standard error of triplicate analysis. Values marked with asterisk * indicate a significant difference in two-way ANOVA, letters present comparison between tested groups by Tukey HSD post hoc test. * p ≤ 0.05, ** p ≤ 0.01, *** p ≤ 0.001.
Polysaccharides 06 00058 g007
Figure 8. Cu, Zn, and Ni removal efficiencies of the biomass collected at D7 and D14 of growth. (A) Growth phase significance; (B) Metal type significance. Histograms representing means and standard error of duplicate replicates. Values marked with asterisk * indicate a significant difference in two-way ANOVA test letters present comparison between tested groups by Tukey HSD post hoc test. * p ≤ 0.05, ** p ≤ 0.01, *** p ≤ 0.001.
Polysaccharides 06 00058 g008
Table 1. Growth dynamics of Parachlorella hussii (N9) described during two weeks of cultivation in BBM medium.
ParameterStarting Culture ‘Day 0’‘Day 7’‘Day 14’
Optical density1.59 ± 0.0446.99 ± 0.1729.70 ± 0.145
Cell number (cell/mL)(6.45 ± 0.24) × 106(7.15 ± 0.49) × 107(6.51 ± 0.185) × 107
Dry weight (g L−1)0.5 ± 0.0132.30 ± 0.0364.33 ± 0.005
Specific growth rate
(µmax d−1)
-0.572 ± 0.098-
Biomass productivity
(g L−1 d−1)
-0.257 ± 0.0560.309 ± 0.042
Disclaimer/Publisher’s Note: The statements, opinions and data contained in all publications are solely those of the individual author(s) and contributor(s) and not of MDPI and/or the editor(s). MDPI and/or the editor(s) disclaim responsibility for any injury to people or property resulting from any ideas, methods, instructions or products referred to in the content.

