Abstract
The aim of this research was to obtain new, ecological products with emulsifying properties based on potato maltodextrins and fatty acids and to prepare stable emulsions with the obtained esters as emulsifiers. The esterification of potato maltodextrin with different degrees of saccharification using oleic acid (model reaction) and free fatty acids from oil hydrolysis in the presence of lipases from Thermomyces lanuginosus and Aspergillus oryzae as biocatalysts was carried out. The reaction yielded products with degrees of substitution (DS) ranging from 0.017 to 1.35. Physicochemical analysis of the obtained products (FT–IR, NMR, morphological studies, and solubility measurements) was carried out. The occurrence of the reaction was confirmed, and the influences of the degree of saccharification of maltodextrin, the type of lipase used, and the reaction conditions on the degree of substitution obtained and the related product properties were evaluated. Oil-in-water emulsions were prepared on the basis of the obtained esters, which were then visually assessed. The lowest creaming index (0.0%) was obtained for the emulsion prepared from low-saccharified maltodextrin ester with DS = 0.038.
1. Introduction
Maltodextrins are the products of starch hydrolysis, and they are widely used in the food industry [1]. They are a mixture of mono-, di-, oligo-, and polysaccharides, with the composition depending on the type of hydrolysing agent and the methods of the process [2]. They differ in average molecular size and are classified on the basis of their dextrose equivalent (DE). Dextrose equivalent is a measure of the reducing power of the sample compared with D-glucose on a dry-weight basis [3]. Maltodextrins with different DE values have different physicochemical properties, including for example solubility and viscosity [4,5]. Due to their different structural characteristics and physicochemical properties, maltodextrins with different DE values have different effects on the release of volatile components when added to foods, which can lead to different volatile profiles in food systems [6]. The DE of a maltodextrin also affects the stability of emulsions obtained by spray drying [7], which may be related to the differences in interactions between the surfactant and the maltodextrin used as the wall material [8].
However, maltodextrins with the same DE value may also have different properties depending on the hydrolysis procedure, source of starch (maize, wheat, potato, rice), and amylose to amylopectin ratio [5]. Maltodextrins with lower DE values have properties more similar to those of the starch from which they are derived. As the degree of substitution of maltodextrins increases, their crystallinity and swelling capacity decrease and their hygroscopicity and solubility increase [9]. Unmodified maltodextrins are often used as thickening agents, fillers, and carriers in the food industry and as binding agents in pharmaceuticals [2,10].
Emulsions are two-phase systems, meaning they are a mixture of two solutions with different properties. The first phase has a hydrophobic nature, while the second is hydrophilic. Such system is not generally stable, and to enhance its stability requires the presence of compounds that reduce the interfacial tension, internal energy, or compounds that inhibit the connection of the particles of the dispersed phase. Important elements influencing the stability and rheological properties of emulsions are the size, concentration, and distribution of molecules of dispersed phase [11,12,13,14].
The stability of the emulsion is usually measured by such phenomena as sedimentation, creaming, coalescence, flocculation, phase inversion, or Ostwald maturation (molecular diffusion) [14,15,16,17,18,19]. One way to increase the stability of the emulsion is to add so-called emulsifiers and stabilisers, whose role is (among others) to increase the viscosity of the continuous phase or prevent that aggregation of beads of oil [20]. Emulsifiers stabilise emulsions for short-term periods by reducing interfacial tension. The long-term stability of emulsions can be improved by adding stabilisers. Stabilisers are normally biopolymers such as proteins or polysaccharides [21].
Maltodextrins have strong hydrophilic properties and are almost completely soluble in water [2]. They are not particularly surface-active, and so their main stabilising action in oil-in-water emulsions is believed to be through viscosity modification or gelation of the aqueous continuous phase surrounding the oil droplets [22]. Therefore, emulsions containing maltodextrins as stabilisers require an additional emulsifying agent for the production of a stable emulsion [5,23,24,25,26].
Using modification, new functional groups with hydrophobic properties can be introduced into the anhydroglucose units, thus providing a saccharide amphiphilic character [2,27]. Changing the physicochemical properties of the polysaccharide could eliminate the necessity of using an additional surfactant to stabilise the emulsion.
So far, oligosaccharides, mainly xylo-oligosaccharides [28,29,30,31] or maltodextrins, have been esterified with organic acids such as octenylsuccinic, decanoic, lauric, palmitic, stearic, mixtures of lauric and palmitic acid [10,26,27,32,33], and vinyl stearate [34] in the presence of a lipase from Thermomyces lanuginosus [26,27,35] or ionic liquids [10] as catalysts of the reaction [2,34]. Such studies, though undertaken several times, have never been carried out without solvent. Typically, organic solvents such as DMSO [26,27,29,35], ionic liquids [10,34], or ethanol [33] have been used as reaction mediums. A common problem turns out to be the accurate subsequent removal of the residues of undesirable solvents from the product. Therefore, it is important to find a method which allows the production of a product free of contamination.
The use of lipases as catalysts for esterification and hydrolysis requires the development of appropriate and optimal conditions for their operation [36]. Depending on the origin (bacteria, fungi, yeast), enzymes may vary in lipolytic activity [37], selectivity, specificity, sensitivity to the presence of water, and optimum temperature for the activity or pH of the reaction medium [38]. Hence, the reaction catalysed by these enzymes may be different and depends on the type of lipase used. In the case of ester synthesis and hydrolysis, the role of water in the reaction medium is crucial. Low concentrations of water favour esterification. With its high concentration, the lipase has the ability to carry out the hydrolysis, during which it shows regioselectivity with respect to the position of the ester bonds and specificity as regards the construction of the acyl residues. Most lipases catalyse the hydrolysis of ester bonds at positions sn-1 and sn-3, the lower part in the sn-2 position. Furthermore, these enzymes have a much higher specificity for fatty acids. In the case of the saturated fatty acid chains, they have only a limited ability to differentiate their length [38,39,40,41,42].
The products obtained as a result of this type of modification (enzymatic esterification) can exhibit surface-active properties [34] and prevent the growth of unfavourable micro-organisms [43,44], an action that is extremely beneficial for food, pharmaceutical, or cosmetic applications [45].
The main objective of our research was to obtain new, ecological maltodextrin fatty acids esters with emulsifying properties. An important and novel aspect of the study was to carry out the solvent-free esterification of potato maltodextrin with fatty acids derived from the enzymatic hydrolysis of rapeseed oil. It should be emphasised that the resulting product will be able to find applications in many industries, especially in the food industry. Thanks to its properties, it will allow the replacement of a number of compounds used to stabilise emulsions with a single ecological agent that improves the structure of the emulsion and delays its decomposition.
2. Materials and Methods
2.1. Materials
The following materials were used: high- (with DE = 23.3), medium- (with DE = 16.4) and low-saccharified (with DE = 10.9) potato maltodextrins supplied by PEPEES (Lomza, Poland); pure oleic acid p.a purchased from Chempur (Piekary Slaskie, Poland); lipase from Thermomyces lanuginosus and lipase from Aspergillus oryzae purchased from Sigma-Aldrich (Buchs, Switzerland; enzymes in buffer solution form, the activity of both enzymes about 100,000 U/g); ethanol purchased from Linegal Chemicals (Warsaw, Poland); cold pressed ecological rapeseed oil from PRS Rutkowski (Kaldus, Poland), 14% BF3·CH3OH (B1252), certified reference material Supelco 37 Component FAME Mix in dichloromethane (CRM47885), ≥98% n-hexane (1.04371) all purchased from Merck (Darmstadt, Germany).
2.2. Preparation of Esters
Esterifications of high-, medium-, and low-saccharified potato maltodextrins with oleic acid were carried out. Modifications were performed in the presence of the Thermomyces lanuginosus lipase used as a catalyst (Figure 1). The amounts of acid and maltodextrin were selected in defined a molar ratio and relative to the anhydroglucose unit. Partial optimisation of the esterification conditions (including selection of the most suitable amounts of the esterifying agent and catalyst, optimal temperature and time of the reaction, and drying conditions) has been previously proposed in a paper concerned with the esterification of medium-saccharified maltodextrin [2]. The conditions described formed the basis of the model reaction.
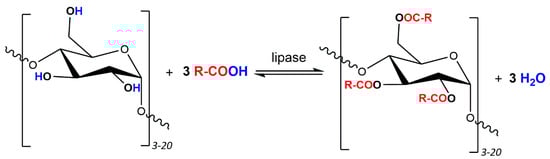
Figure 1.
Theoretical scheme of esterification with potato maltodextrin and oleic acid in the presence of lipase as biocatalyst (where: R- = C17H33-) assuming a maximum degree of substitution equal to 3.
Maltodextrin (2g), oleic acid, and lipase were mixed and incubated in a water bath at 60 °C. The incubation time was 1 h. The formed ester was precipitated by adding ethanol, which was removed by filtration of the sample. Then, the samples were dried in an oven at 55 °C for 24 h.
Low-saccharified maltodextrin, showing the highest susceptibility to esterification, was esterified with fatty acids derived from the hydrolysis of rapeseed oil, according to the procedure described above.
The esterification reaction of low-saccharified maltodextrin was also carried out using lipase from Aspergillus oryzae under conditions analogous to those described above and under modified conditions (the temperature of the reaction was reduced to 40 °C).
2.3. Enzymatic Hydrolysis of Rapeseed Oil
Reaction optimisation was carried out by selecting the appropriate oil/water volume ratio, amount of enzyme added, reaction time, and reaction temperature. An appropriate water/oil ratio and a magnetic stirrer were introduced into a glass bottle with a tight cap. The bottle was placed in an insulated water bath with a lid, equipped with a magnetic stirrer, and once the system reached the set temperature, the specified amount of lipase was added to the bottle. The entire system was incubated in a water bath with continuous stirring. The optimisation conditions are shown in Figure 2.
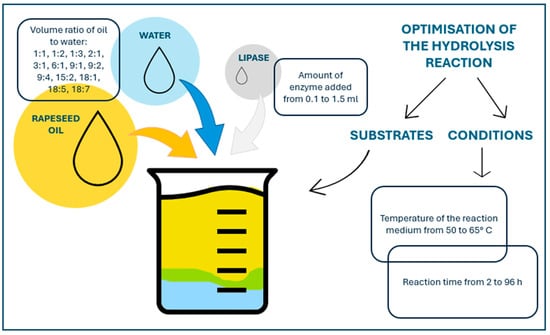
Figure 2.
The optimisation conditions of enzymatic hydrolysis of rapeseed oil in the presence of lipase from Thermomyces lanuginosus.
The reaction, after optimisation, was carried out for 72 h at 50 °C in an oil/water volume ratio of 15:2, using 0.6 mL of lipase from Thermomyces lanuginosus as the reaction biocatalyst. The effect of reaction duration on hydrolysis efficiency was assessed. The test material was collected for analysis every 12 h.
2.4. Determination of Acid Number (Acid Value)
Determination of the acid number (AV) by titration method was carried out in accordance with the standard “PN-ISO660:1998. Vegetable and animal oils and fats—Determination of acid number and acidity” [46]. A 1 g sample was weighed into a 250 mL flask and dissolved in 50 mL of solvent mixture (ethanol:ethyl ether = 1:1). The contents of the flask were titrated with a solution of KOH in ethanol to the endpoint in the presence of phenolphthalein. A blank titration was performed. Each titration was repeated three times.
The acid number was calculated from the formula:
where
- m—mass of fat [g];
- V—volume of potassium hydroxide solution used for titration of the fat sample;
- V0—volume of potassium hydroxide solution used for titration of the blank sample;
- C—concentration of KOH solution (0.1 N).
2.5. Gas Chromatography
Qualitative and quantitative analyses of the enzymatic hydrolysis products of oil were performed using gas chromatography with flame ionisation detection (GC-FID 8890 system chromatograph, Agilent Technologies, Waldbronn, Germany). As an esterification (methylation) reagent, a boron trifluoride–methanol solution was used. The temperatures of the injector, oven (column), and detector were 250 °C, 240 °C, and 250 °C, respectively. For separation, an HP-88 capillary column (length 100 m, internal diameter 0.25 mm, film thickness 0.2 µm) with a highly polar phase consisting of 88% (cyanopropyl)aryl polysiloxane, dedicated to the separation of cis-trans fatty acid methyl esters (FAME), was used. The carrier gas was helium at a flow rate of 1 mL/min. A certified reference material (Supelco 37 Component FAME Mix in dichloromethane) was used as a standard.
2.6. FT–IR Spectroscopy
FT–IR spectroscopy was used to assess the progress of the enzymatic hydrolysis of the oils and to identify and determine the chemical structure of native and modified maltodextrin. The FT–IR spectra were recorded using a Nexus Nicolet spectrometer (Madison, WI, USA).
For liquid samples, i.e., oils and oil hydrolysates, an ATR (Attenuated Total Reflectance) attachment with a high refractive index crystal—zinc selenide (ZnSe)—was used. Each time, the sample was applied in an equal volume, i.e., 0.5 mL, using a semi-automatic pipette. The ATR crystal was carefully cleaned with methanol and dried using an inert gas after each experiment. The spectra were recorded in the wavenumber range from 4000 to 650 cm−1, with a resolution of 4 cm−1 and the number of scans equal to 32. In turn, the solid samples were additionally ground in an agate mortar. Each of them was mixed with analytical grade potassium bromide (KBr) in a ratio of 1:50 (w/w) and then pressed into pellets. In this case, the spectra were recorded in the wavenumber range from 4000 to 400 cm−1, but with the same resolution and total number of scans. The baseline was adjusted to the ZnSe or KBr background, respectively.
2.7. 1H NMR Spectroscopy
The 1H NMR spectra of the samples were recorded using a Bruker Avance III spectrometer (Billerica, MA, USA) at 500 MHz. The samples were dissolved in DMSO-d6 (99.8% D, Armar Chemicals, Döttingen, Switzerland) and the solution was then heated at 343 K in a water bath for 12 h. Next, 0.70 mL of the solution was placed in a 5 mm NMR tube. All of the NMR measurements were carried out at 295 K with a 5 mm BBI probehead and a z-gradient coil. Prior to Fourier transformation of the FIDs, the Lorenzian apodisation function (0.3 Hz) was applied and the spectra were zero-filled twice. These measurements were carried out at the Centre of Molecular and Macromolecular Studies (Polish Academy of Sciences, Lodz, Poland).
2.8. Determination of the Degree of Substitution
Elemental analysis was applied to determine the degree of substitution (DS). Measurements were performed with a micro-analyser with simultaneous CHNS determination using a VARIO Micro Cube (Elementar Analysen Systeme GmbH, Hanau/Frankfurt, Germany). The measurements were made at the Centre of Molecular and Macromolecular Studies (Polish Academy of Sciences, Lodz, Poland). The DS was calculated by comparing the theoretical values (the percentages of elements C, H) with the experimental values ranging from 0 to 3, for the actual DS.
2.9. Scanning Electron Microscopy (SEM)
The morphological changes of unmodified maltodextrin and esterified maltodextrin were observed using a Tescan VEGA 3SBU scanning electron microscope (Tescan, Brno, Czech Republic). The accelerating voltage was 3 kV, and the samples were not coated with any conductive material.
2.10. Water Solubility Measurement
The solubility in water of the resulting products was compared, and measurements were determined according to the procedure described by Roczkowska et al. [47].
In a pre-weighed centrifuge test tube, 0.5 g of unmodified/esterified maltodextrin was weighed on an analytical balance and suspended in 30 mL of distilled water. A stirrer was then placed in the tube with the suspension and stirred on a magnetic stirrer for 30 min. After this time, the sample was centrifuged (9000 rpm, 20 min). The supernatant was decanted into a previously dried to dryness and weighed crystalliser and dried at 105 °C for 24 h. The sample was then cooled to room temperature and weighed. The tube with the supernatant sediment was also weighed on an analytical balance. The determination was performed at 25 °C and repeated three times for each sample tested.
Water solubility (WSI) was then calculated from Equation (2):
where
- wC2—mass of crystalliser with precipitate, after drying [g];
- wC1—mass of empty crystalliser [g];
- wS—dry mass of the sample [g].
2.11. Preparation of the Emulsions
The emulsion preparation proceeded as follows. The procedure started with the preparation of aqueous solutions of maltodextrin esters (with DS values from 0.017 to 1.35) at identical concentrations of 25%, then rapeseed oil was added to the resulting solutions at a volume ratio of 1:1 (oil phase: water phase) and each mixture was homogenised for 1 min using an IKA T-25 digital ULTRA TURRAX homogeniser (IKA—Werke GmbH & Co. KG, Mindelheim, Germany) at a rotational speed of 5000 rpm. Subsequently, a series of emulsions was prepared for an ester with DS = 0.024 (ester concentration in the aqueous phase equal to 25%) using different volume ratios of oil to aqueous phase (2:3, 1:1, 7:3, 3:2, 4:1). In the final step, emulsions based on esters with DS ranging from 0.017 to 0.038 and oil/water phase ratios of 1:1 and 3:2 were prepared using different concentrations of ester in the aqueous phase (from 10 to 35%). The resulting emulsions were transferred into containers with screw caps. For each maltodextrin ester-based emulsion made, an emulsion based on the corresponding unmodified maltodextrin was comparatively made. Detailed emulsion preparation conditions are shown in Figure 3.
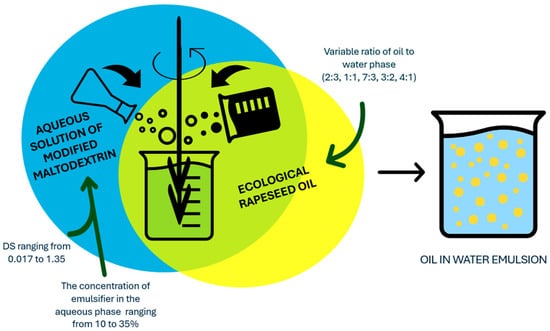
Figure 3.
Conditions for the preparation of emulsions based on potato maltodextrin esters with DS from 0.017 to 1.35.
For comparison purposes, emulsions based on unmodified maltodextrins were also prepared with the same parameters.
2.12. Visual Determination of Emulsion Stability—Determination of Creaming Index
The study consisted of visual assessments of the emulsions seven days after preparation, and then the determination of the creaming index (CI) using Equation (3), as follows:
where
- HL—height of lower part (serum),
- HE—height of emulsion.
Emulsions based on the unmodified maltodextrin were prepared in the same conditions for comparison.
2.13. Data Analysis
All experiments were prepared in triplicate. The data obtained were subjected to variance analyses (ANOVA) followed by a Duncan multiple range test to determine the significant difference between samples at p < 0.05 level using Statistica v.13.0 software.
3. Results
3.1. Evaluation of the Progress of Enzymatic Hydrolysis of Rapeseed Oil—ATR FT–IR Spectra Analysis
The recorded ATR FT–IR spectra of oils and their products after hydrolysis confirmed that full lipase-catalysed hydrolysis was possible to achieve after 72 h of reaction (Figure 4). In the spectra of pure rapeseed oil, a strong band was visible at 1743 cm−1. This can be attributed to stretching vibrations of the carbonyl group (C=O) and is characteristic of acylglycerols. Depending on the reaction time (Figure 4), more or less intense co-occurring bands were recorded, also attributed to C=O stretching vibrations, but with the absorption maximum at 1710 cm−1. These bands can be assigned to other compounds also containing a carbonyl group, i.e., saturated or unsaturated fatty acids. The main product of the hydrolysis of oils are fatty acids, and the final by-product is glycerol. Therefore, the presence on the FT–IR spectra of only one strong band of stretching vibrations of acid carbonyl groups and also a broad band of the stretching vibrations of glycerol hydroxyl groups (at 3200 cm−1) confirmed that hydrolysis was complete after 72 h. Other strong bands recorded on the spectra, occurring at the range of 3006–2853 cm−1 (stretching vibrations of aliphatic C-H), are characteristic of both fatty acids and their esters [48].
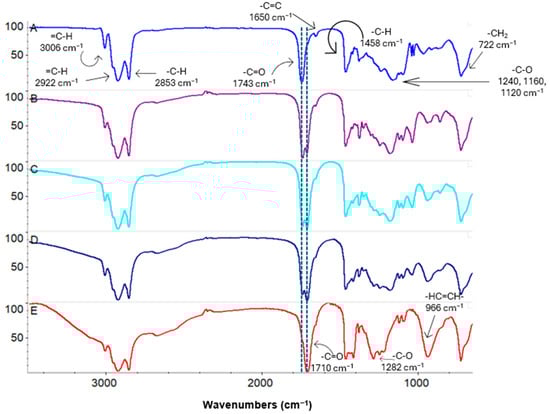
Figure 4.
ATR FT–IR spectra of rapeseed oil (A); reaction mixtures: after 12 h (B), after 24 h (C), after 48 h (D); final mixture (E).
3.2. Relationship Between Acid Value and Time of Reaction
AV is a measure of the free fatty acid content, i.e., it determines the degree of hydrolysis of oil. It determines the number of free fatty acids. AV is expressed as the number of milligrams of KOH required to neutralise the fatty acids contained in 1 g of the fat to be analysed.
The acid value increased with the increase in reaction time (Figure 5). The acid number value increased during the first day of the experiment. A slowdown in hydrolysis was observed after 60 h.
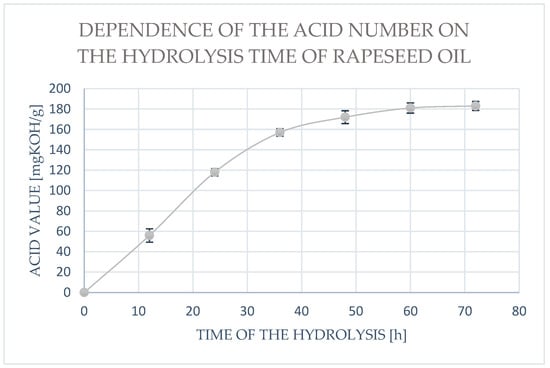
Figure 5.
The dependence of the acid number on the duration of enzymatic hydrolysis of rapeseed oil. Data presented in the diagram are mean values (mean ± SD, n = 3).
3.3. Determination of the Quantitative and Qualitative Composition of the Mixture Formed by Enzymatic Hydrolysis of Rapeseed Oil by the GC-FID Method
While the analysis of ATR FT–IR spectra enabled the preliminary assessment and identification of hydrolysis products, the analysis of GC-FID enabled the determination of the qualitative and quantitative composition of these products (Table 1).

Table 1.
Qualitative and quantitative composition of fatty acids in rapeseed oil hydrolysate.
The obtained results allowed for an extremely precise determination of the composition of the obtained vegetable oil hydrolysate. It was a mixture that consisted mostly of free fatty acids: saturated (7.7% w/w) and unsaturated, both monounsaturated (64.9% w/w), and polyunsaturated (27.5% w/w). These results confirmed the significant quantitative predominance of unsaturated fatty acids over saturated ones (Figure 6). In addition, the rapeseed oil hydrolysate consisted mainly of oleic (18:1; 61.9%w/w), linoleic (18:2; 18.5% w/w), linolenic (18:3; 8.7% w/w), palmitic (16:0; 4.6% w/w), and stearic acid (18:0; 1.8% w/w).
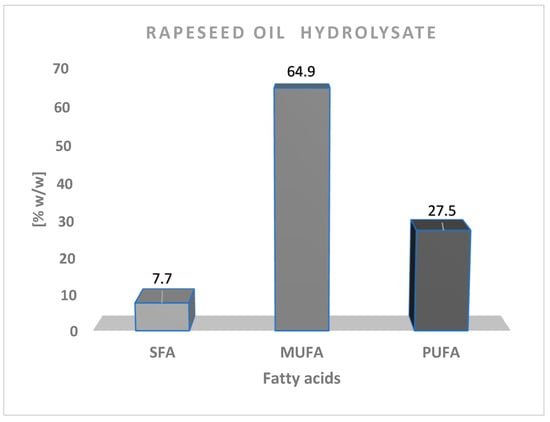
Figure 6.
Percentage of saturated fatty acids (SFA), monounsaturated fatty acids (MUFA) and polyunsaturated fatty acids (PUFA) in mixture after hydrolysis of rapeseed oil.
3.4. Evaluation of the Influence of Esterification Conditions, Degree of Saccharification of Maltodextrins, and Type of Lipase Used on the Degrees of Substitution of Modification Products
The degrees of substitution of products obtained from the esterification of potato maltodextrins with different degrees of saccharification were compared. The results are summarised in Figure 7. The highest degree of substitution under model conditions in the presence of Thermomyces lanuginosus lipase was found in the esterification product of low-saccharified maltodextrin (Figure 7A).
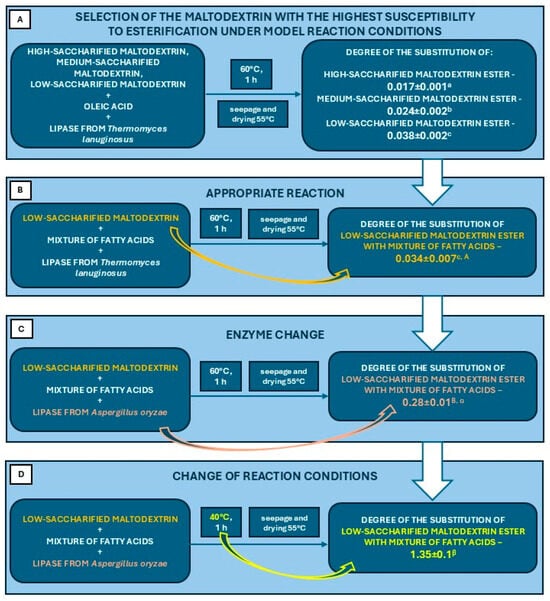
Figure 7.
Scheme illustrating the course of all esterification steps including the results of the degree of substitution: (A)—for a model reaction using low-saccharified maltodextrin, medium-saccharified maltodextrin, high-saccharified maltodextrin, pure oleic acid and lipase from Thermomyces lanuginosus; (B)—for a reaction in which pure oleic acid was replaced by a mixture of fatty acids obtained from the hydrolysis of rapeseed oil; (C)—for a reaction in which the lipase from Thermomyces lanuginosus was replaced by a lipase from Aspergillus oryzae; (D)—for a reaction in which the reaction conditions were changed (lower temperature). Data presented in the diagram are mean values (mean ± SD, n = 3). Mean values marked with different letters are significantly different at p ≤ 0.05.
Based on the model reaction, in the next stage of the study, oleic acid was replaced by a mixture of fatty acids derived from the hydrolysis of rapeseed oil. The results obtained were at an analogous level (Figure 7B). A significant difference was observed in the reaction in which lipase from Thermomyces lanuginosus was replaced by lipase from Aspergillus oryzae (Figure 7C). It showed a significantly higher catalytic efficiency in this type of reaction using model conditions. In addition, changing the reaction conditions (lowering the temperature to 40 °C) resulted in a significant increase in the DS of the final product (Figure 7D).
3.5. FT–IR Measurements—Confirmation of Esterification
FT–IR spectra of unmodified low-saccharified maltodextrin and its esterification products are shown in Figure 8. In the case of unmodified maltodextrin (Figure 8A), we observe a set of characteristic bands in the range 992–1148 cm−1. This can be attributed to C-O bond stretching vibrations [49]. This overlaps with the C-OH stretching vibrations of the side groups [50]. In addition, the characteristic peaks of the maltodextrin backbone are visible in the 1250–900 cm−1 region [51,52]. In particular, an intensive band is apparent at 1020 cm−1, ascribed to the C-O-C ring vibration of the glucose units of the maltodextrin [53].
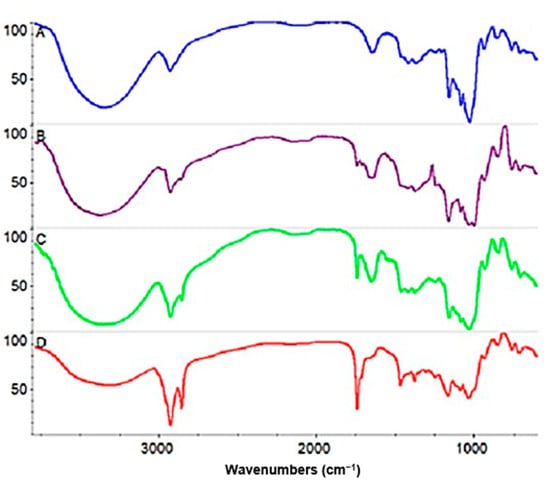
Figure 8.
FT–IR spectra of unmodified low-saccharified maltodextrin (A), esterification product with DS = 0.038 obtained in the presence of lipase from Thermomyces lanusinosus (B), esterification product with DS = 0.28 obtained in the presence of lipase from Aspergillus oryzae (C) under model conditions, esterification product with DS = 1.35 obtained in the presence of lipase from Aspergillus oryzae under modified conditions (D).
Another important band of the polysaccharide is the band observed in the range 3000–3500 cm−1, corresponding to the stretching vibrations of the hydroxyl group [49,50,54]. The intensity and width of the described band is also related to the presence of hydrogen bonds between the hydroxyl groups [55].
The reduction in the intensity of this band in the case of spectra describing esterification products (Figure 8B–D) can be attributed to a reduction in the concentration of hydroxyl groups during their conversion to ester groups [49,55].
For esters, the wave number for the C=O bond typically ranges from 1716 to 1751 cm−1 [56]. In Figure 8B–D, we observe the appearance of a C=O stretching band of the carbonyl group at 1740 cm−1, characteristic of fatty acid esters [57,58,59], confirming that the reaction has occurred. That the differences in the intensities of these bands depends on the degree of product substitution is clearly indicated.
Furthermore, the C=O stretching band of the carbonyl group at 1710–1714 cm−1, characteristic of free oleic acid [60,61], the substrate of the reaction, is not observed in the spectra mentioned above. Thus, the existence of two high-intensity bands after esterification in the vicinity of 2921 and 2851 cm−1 is attributed to the C-H stretching of the CH2 groups of the alkyl chain of oleic acid ester-bound to the anhydroglucose units of maltodextrin, symmetrically (2921 cm−1) and asymmetrically (2851 cm−1), respectively [61,62,63].
3.6. 1H NMR Measurements—Determination of the Structure of Esterification Products
The recording of 1H NMR spectra allowed for the chemical identification of the products of maltodextrin esterification. The proton spectra of the substrates (low-saccharide maltodextrin, oleic acid) and product (maltodextrin ester) were compared (Figure 9).
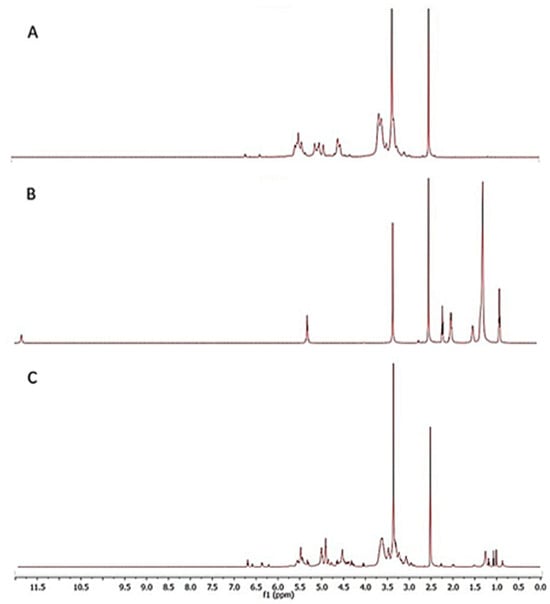
Figure 9.
1H NMR spectra of (A) native maltodextrin, (B) oleic acid and (C) esterified maltodextrin.
In all of the spectra, a strong chemical signal can be observed at 2.48 ppm from the solvent, i.e., deuterated dimethyl sulfoxide (DMSO-d6). In the spectra of unmodified maltodextrin, the most characteristic chemical shifts were those originating from the protons of the glucopyranose ring, occurring in the range of 5.3–3.3 ppm (Figure 9A). These included chemical signals at 3.32 ppm (H-C2), at 3.62 ppm (H-C3), and at 3.56 ppm (H-C5) or 5.08 ppm (H-C1). In turn, in a slightly narrower range, 5.5–4.5 ppm, the presence of a shift of protons of the primary (OH-C6) and secondary (OH-C2, OH-C3) hydroxyl groups of maltodextrin was confirmed, at 4.55 ppm, 5.38 ppm, and 5.45 ppm, respectively [49,64].
Comparing the 1H NMR spectra of native and esterified maltodextrin, attention was drawn to the presence of completely new chemical shifts, characteristic of long-chain acyl derivatives. Among the newly recorded chemical signals in the spectra were: signals of protons of the methyl group, methylene groups, or protons associated with carbon atoms of the double bond. Thus, the triplet at 0.83 ppm was assigned to the terminal methyl group (t, 3H, C18). In turn, the chemical shift at 2.23 ppm corresponded to the protons of the methylene group located closest to the carbonyl group (m, 2H, C2), and at 1.47 ppm to the next one in the chain (m, 2H, C3). Other characteristic chemical signals present in the proton spectrum after maltodextrin esterification included those at about 1.95 ppm and in the ranges of 1.2–1.1 ppm and 5.55–5.25 ppm. They were assigned, respectively, in the order of protons of methylene groups located nearby of the double bond (m, 2H, C8; m, 2H, C11), protons of the remaining methylene groups (m, 20H), and protons associated with carbon atoms co-forming the double bond in the unsaturated ester (m, 2H, C9–C10) [65,66]. Moreover, in the spectra of the maltodextrin ester, no chemical shift was recorded at 11.95 ppm (s, 1H, OH-C1) from the proton of the carboxyl group, which is characteristic of fatty acid. This is another proof that an ester was obtained, and not, for example, a mixture with acids, because during esterification such a proton co-creates a water molecule, which is a by-product of the esterification reaction [48].
3.7. Scanning Electron Microscopy (SEM)
A scanning electron microscope was used to determine the morphology of maltodextrin and any changes, mainly surface changes, that could have occurred after enzymatic esterification. When analysing maltodextrins microscopically, attention should be paid to their source. In this case, these were potato maltodextrins, which were obtained by the controlled enzymatic hydrolysis of potato starch. The granules of this starch are characterised by great diversity, not so much in terms of shape (usually oval or spherical) as in terms of their size (from several to even several hundred micrometres in diameter) [67]. Such significant diversity in size remains after acid or enzymatic dextrinisation of starch.
Potato maltodextrin with a low DE was characterised by the occurrence of macromolecular structures in the form of more or less deformed granules. Their surfaces were discontinuous, uneven, and even porous. Such changes in appearance result not only from the degree of hydrolysis but also from the conditions of spray drying as the final stage of maltodextrin production. The granularity is more or less destroyed by the disintegration of both intra- and intermolecular bonds accompanying dextrinisation. The reduction of glycosidic bonds and reduction or rearrangement of hydrogen bonds lead to the loss of rigidity and increased molecular mobility (in the SEM image of maltodextrin this can be seen as a “collapse” into the interior as a loss of a kind of “scaffolding”). The esterification of low-saccharide maltodextrins deepened this effect [4].
Low-saccharide maltodextrin esters were characterised by irregular surfaces and shapes, and were therefore amorphous. They also had a high tendency to agglomerate into larger structures (Figure 10). Some of the hydroxyl groups co-forming intra- and intermolecular hydrogen bonds responsible for a certain form of molecular ordering of maltodextrin during esterification are replaced by new ester groups, which deepens the changes towards the amorphousness recorded in SEM images [68].
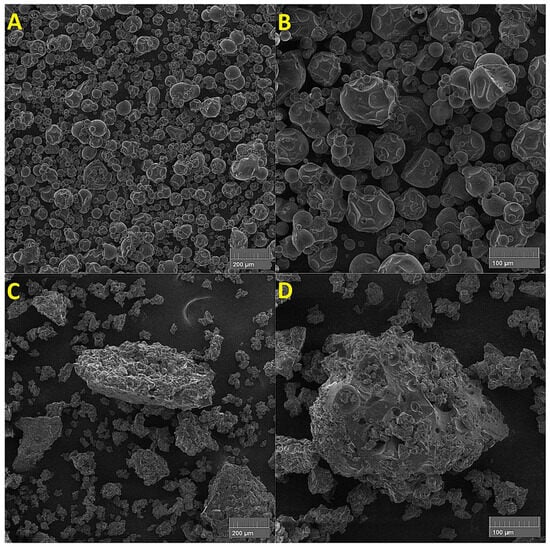
Figure 10.
Scanning electron microscope images of: ((A): mag. 200×; (B): mag. 500×) unmodified low-saccharified maltodextrin; ((C): mag. 200×; (D): mag. 500×) ester of low-saccharified maltodextrin with oleic acid, with DS = 1.35.
3.8. Water Solubility Measurements
The esterified maltodextrins showed altered solubility in water compared to unmodified potato maltodextrins. The results are shown in Figure 11 and Figure 12.
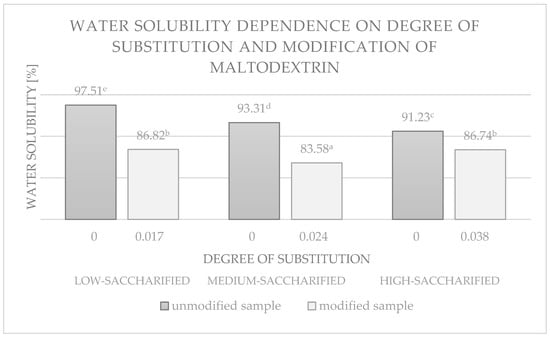
Figure 11.
Water solubility dependence of maltodextrins with different degrees of saccharification and their esterification products. Data marked with different letters are significantly different at p ≤ 0.05.
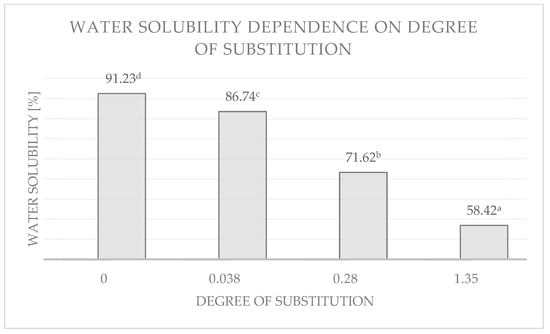
Figure 12.
Dependence of water solubility of low-saccharified maltodextrin and its esterification products with different degrees of substitution. Data marked with different letters are significantly different at p ≤ 0.05.
The solubility of the esterification products was reduced relative to the corresponding unmodified maltodextrins by 4.49–10.93% for esters with low DS values (up to 0.04). The higher the degree of saccharification of maltodextrin, the greater the difference in solubility between the modified sample and its unmodified counterpart (Figure 11).
Similar results were obtained by Udomrati & Gohtani [27] for esters obtained by reacting tapioca maltodextrin with fatty acids (C10, 12, and 16). The solubility of the products they obtained was in the range 84.8% to 87.2% for DS in the range 0.015 to 0.084. In contrast, the solubility of maize maltodextrin (Maltrin 100 and Maltrin 250) esters with vinyl laurate and vinyl palmitate ranged from 93.1% to 100.9% for DS values ranging from 0.016 to 0.026 [33].
Esters with high DS values were found to be hardly soluble in water (Figure 12). The water solubility for the ester with a DS = 1.35 was only 58%. Result also showed that the solubilities of esterified low-saccharified maltodextrins were significantly associated with the DS of the samples. This is consistent with previously reported relationships that increasing hydrophobicity of the esterification products resulted in a reduction in the number of hydrogen bonds between the hydroxyl groups of maltodextrin and water [27,69], and thus affected solubility.
The change in the water solubility of potential emulsifiers due to modification can have important consequences, as it can affect the stability of oil-in-water (O/W) emulsions [70].
3.9. Comparison of Emulsion Stability Based on the Visual Method and Determination of the Creaming Index
Some of the obtained emulsions are shown in Figure 13B,D,F. For comparison, emulsions with unmodified maltodextrins were also prepared and are shown in Figure 13A,C,E. The durability of such prepared emulsions were extremely low—they broke within the first day.
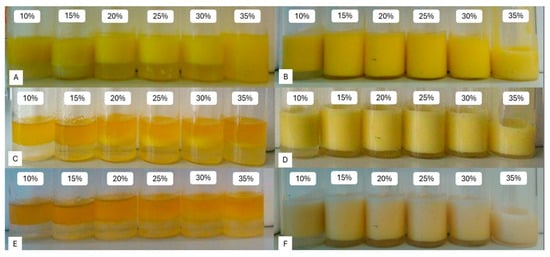
Figure 13.
Visual evaluation of emulsions prepared with unmodified maltodextrin (A,C,E) and esterified maltodextrin with DS = 0.024 (B,D,F) on the day of preparation (A,B), after 1 day (C,D) and after 7 days (E,F).
After a seven-day period, a creaming index (CI) was set for the emulsions. A creaming index is a measure of the stability of the emulsion. The results are shown in the Figure 14, Figure 15 and Figure 16 and graphed depending upon used concentration, type of emulsifier, and the volume ratio of oil phase to water phase.
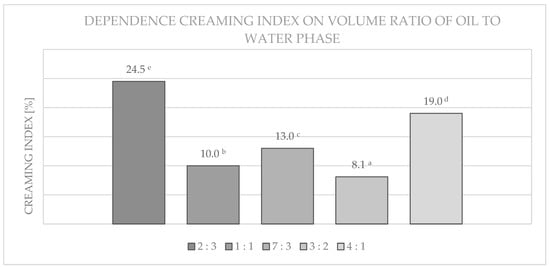
Figure 14.
Dependence of the creaming index of emulsions prepared on the basis of esterified maltodextrin with DS = 0.024 on different volume ratios of oil to water phase. Data marked with different letters are significantly different at p ≤ 0.05.
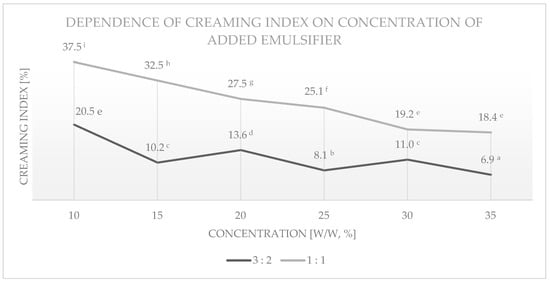
Figure 15.
Dependence of creaming index of emulsions prepared on the basis of esterified medium-saccharified maltodextrin with DS = 0.024 on different concentrations of added emulsifier, for two volume ratios of oil to water phase. Data marked with different letters are significantly different at p ≤ 0.05.
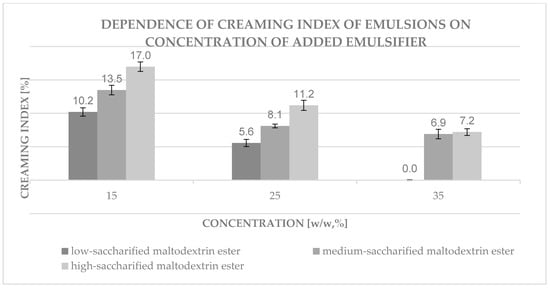
Figure 16.
Dependence of creaming index of emulsions prepared on the basis of three types of esterified maltodextrins obtained under the same conditions on different concentrations of added emulsifier. Data presented in the diagram are mean values (mean ± SD, n = 3).
As can be seen from Figure 14, the most favourable properties (stability) were obtained for samples with a volume ratio of 3:2 and 1:1 of the oil to water phase.
The creaminess indices of emulsions (shown in Figure 15) prepared for a ratio of 1:1 showed a clear dependence on the concentration of the added emulsifier—an increase in the concentration of the ester influenced a decrease in the creaminess index. In this case, the best result was achieved for a sample containing 35% maltodextrin esterified in the aqueous phase. In the case of an oil to water phase volume ratio of 3:2, samples with an emulsifier content of 15, 25, or 35% showed the greatest stability. Emulsions prepared for a volume ratio of 3:2 showed higher stability than emulsions prepared for a ratio of 1:1 for all concentrations tested.
In the case of emulsions obtained on the basis of maltodextrin esters with different degrees of saccharification (shown in Figure 16) obtained under the same conditions but differing in the degree of substitution (low-saccharified maltodextrin ester with DS = 0.038, medium-saccharified maltodextrin ester with DS = 0.024, high-saccharified maltodextrin ester with DS = 0.017), the following relationship was observed—a higher degree of substitution leads to a more stable emulsion. The trend of the decreasing value of the creaming index with increasing emulsifier content was also preserved.
The lowest creaming index (0.0%) was obtained for an emulsion prepared on the basis of low-saccharified maltodextrin ester with DS = 0.038 for an ester concentration in the aqueous phase equal to 35% and a volume ratio of oil to water phase equal to 3:2.
The preparation of stable emulsions based on maltodextrin esters with DS = 0.28 (and higher) proved impossible using the above parameters. The emulsions broke down immediately. The main contributor to the lack of emulsifying properties of esters with high DS values is their hydrophobic properties.
4. Conclusions
In this study, new ecological products with emulsifying properties based on potato maltodextrins and unsaturated fatty acids derived from the enzymatic hydrolysis of rapeseed oil were designed and obtained. Solvent-free esterification of maltodextrins with different degrees of saccharification was carried out in the presence of lipase as a reaction biocatalyst. The resulting esterified products had DS ranging from 0.017 to 1.35, as confirmed by 1H NMR and FT–IR analyses. They were characterised by different properties compared to the corresponding unmodified maltodextrins (reduced solubility, morphological changes). The o/w emulsions prepared on the basis of esters with DS equal to 0.024 and 0.038 were characterised by high stability. Maltodextrin esters with DS = 0.28 and DS = 1.35 showed no emulsifying ability. This shows that even a small degree of modification of maltodextrins (DS values below 0.04), which is important in food or cosmetic applications, can have a decisive effect on the stability of the prepared emulsion and its shelf life. The obtained products can be subjected to further modifications, mainly due to the presence of unsaturated bonds in the acyl groups attached to the anhydroglucose units of the maltodextrin. Furthermore, these compounds, depending on the DS obtained, should be further analysed for broader applications as antimicrobial compounds (low DS values, amphiphilic character) and in the packaging industry (high DS values, hydrophobic character).
Author Contributions
Conceptualisation, M.R.; methodology, M.R. and A.Z.; writing—original draft preparation, M.R., A.Z. and M.P.-C.; writing—review and editing, M.R. and J.K.; visualisation, M.R., A.Z. and M.P.-C.; supervision, J.K.; project administration, M.R. and J.K.; funding acquisition, M.R. All authors have read and agreed to the published version of the manuscript.
Funding
This research was funded by the National Science Centre in Poland, grant number 2017/27/N/ST8/03054.
Institutional Review Board Statement
Not applicable.
Data Availability Statement
The data presented in this study are available on request from the corresponding author.
Conflicts of Interest
The authors declare no conflicts of interest.
Abbreviations
| DE | dextrose equivalent |
| DS | degree of substitution |
| LM | low-saccharified maltodextrin |
| MM | medium-saccharified maltodextrin |
| HM | high-saccharified maltodextrin |
| CI | creaming index |
| WSI | water solubility index |
| AV | acid value/number |
References
- Zarski, A.; Kapusniak, K.; Ptak, S.; Rudlicka, M.; Coseri, S.; Kapusniak, J. Functionalization methods of starch and its derivatives: From old limitations to new possibilities. Polymers 2024, 16, 597. [Google Scholar] [CrossRef]
- Roczkowska, M.; Ptak, S.; Siemion, P.; Kapusniak, J. Biocatalysed esterification of potato maltodextrin in the presence of fungal lipase. In Proceedings of the 11th International Conference on Polysaccharides-Glycoscience, Prague, Czech Republic, 22–24 October 2015; Czech Chemical Society: Prague, Czech Republic, 2015; pp. 155–158, ISSN 2336-6796. [Google Scholar]
- Wang, J.; Wang, L. Structures and properties of commercial maltodextrins from corn, potato, and rice starches. Starch/Stärke 2000, 52, 296–304. [Google Scholar]
- Takeiti, C.Y.; Kieckbusch, T.G.; Collares-Queiroz, F.P. Morphological and Physicochemical Characterization of Commercial Maltodextrins with Different Degrees of Dextrose-Equivalent. Int. J. Food Prop. 2010, 13, 411–425. [Google Scholar] [CrossRef]
- Dokic-Baucal, L.; Dokic, P.; Jakovljevic, J. Influence of different maltodextrins on properties of O/W emulsions. Food Hydrocoll. 2004, 18, 233–239. [Google Scholar] [CrossRef]
- Lee, S.M.; Cho, A.R.; Yoo, S.H.; Kim, Y.S. Effects of maltodextrins with different dextrose-equivalent values. Flavour Fragr J. 2017, 33, 153–159. [Google Scholar]
- Negrão-Murakami, A.N.; Nunes, G.L.; Pinto, S.S.; Murakami, F.S.; Amante, E.R.; Petrus, J.C.C.; Amboni, R.D.M.C. Influence of DE-value of maltodextrin on the physicochemical properties, antioxidant activity, and storage stability of spray dried concentrated mate (Ilex paraguariensis A. St. Hil.). LWT-Food Sci. Technol. 2017, 79, 561–567. [Google Scholar] [CrossRef]
- Matsuura, T.; Ogawa, A.; Tomabechi, M.; Matsushita, R.; Gohtani, S.; Neoh, T.L.; Yoshii, H. Effect of dextrose equivalent of maltodextrin on the stability of emulsified coconut-oil in spray-dried powder. J. Food Eng. 2015, 163, 54–59. [Google Scholar]
- Blanchard, P.H.; Katz, F.R. Starch Hydrolysates. In Food Polysaccharides and Their Applications, 2nd ed.; Stephen, A.M., Ed.; Marcel Dekker: New York, NY, USA, 1995; Volume 99, pp. 119–145. [Google Scholar]
- Biswas, A.; Shogren, R.L.; Willett, J.L. Ionic liquid as a solvent and a catalyst for acylation of maltodextrin. Ind. Crop. Prod. 2009, 30, 172–175. [Google Scholar] [CrossRef]
- Coupland, J.N.; McClements, D.J. Droplet size determination in food emulsions: Comparison of ultrasonic and light scattering methods. J. Food Eng. 2001, 50, 117–120. [Google Scholar]
- Goudappel, G.J.W.; van Duynhoven, M.J.P.; Mooren, M.M.W. Measurement of oil droplet size distributions in food oil/water emulsions by time domain pulsed field gradient NMR. J. Colloid Interface Sci. 2001, 239, 535–542. [Google Scholar]
- Schubert, H.; Ax, K.; Behrend, O. Product engineering of dispersed systems. Trends Food. Sci. Technol. 2003, 14, 9–16. [Google Scholar] [CrossRef]
- Kowalska, M.; Zbikowska, A.; Gorecka, A. Wpływ wybranych zagęstników na rozkład kropel oleju w emulsjach niskotłuszczowych. Żywność. Nauka. Technologia. Jakość. 2011, 4, 84–93. (In Polish) [Google Scholar]
- McClements, D.J. Food Emulsions: Principles, Practise and Techniques, 3rd ed.; CRC Press LLC: Boca Raton, FL, USA, 2015. [Google Scholar]
- Chanami, R.; McClements, D.J. Creaming stability of flocculated monodisperse oil-in-water emulsions. J. Colloid Interface Sci. 2000, 225, 214–218. [Google Scholar] [CrossRef]
- Buffo, R.A.; Reineccius, G.A.; Oehlert, G.W. Factors affecting the emulsifying and rheological properties of gum acacia in beverage emulsion. Food Hydrocoll. 2001, 15, 53–66. [Google Scholar] [CrossRef]
- Roland, I.; Piel, G.; Delattre, L.; Evrard, B. Systematic characterization of oil-in-water emulsions for formulation design. Int. J. Pharm. 2003, 263, 85–94. [Google Scholar] [CrossRef]
- Dluzewska, E.; Leszczyński, K. Stabilność i cechy reologiczne emulsji napojowych z dodatkiem gumy ghatti. Postępy Tech. Przetwórstwa Spożywczego 2006, 1, 21–24. (In Polish) [Google Scholar]
- Chanami, R.; McClements, D.J. Depletion flocculation of beverage emulsions by gum Arabic and modified starch. J. Food Sci. 2001, 66, 457–463. [Google Scholar] [CrossRef]
- Udomrati, S.; Ikeda, S.; Gohtani, S. The effect of tapioca maltodextrins on the stability of oil-in water emulsions. Starch/Stärke 2011, 63, 347–353. [Google Scholar] [CrossRef]
- Dickinson, E. Hydrocolloids at interfaces and the influence on the properties of dispersed systems. Food Hydrocoll. 2003, 17, 25–39. [Google Scholar] [CrossRef]
- Hogan, S.A.; McNamee, B.F.; O’Riordan, E.D.; O’Sullivan, M. Emulsification and microencapsulation properties of sodium caseinate/carbohydrate blends. Int. Dairy J. 2001, 11, 137–144. [Google Scholar] [CrossRef]
- Klinkesorn, U.; Sophanodora, P.; Chinachoti, P.; McClements, D.J. Stability and rheology of corn oil-in-water emulsions containing maltodextrin. Food Res. Int. 2004, 37, 851–859. [Google Scholar] [CrossRef]
- Udomrati, S.; Ikeda, S.; Gohtani, S. Rheological properties and stability of oil-in-water emulsions containing tapioca maltodextrin in the aqueous phase. J. Food Eng. 2013, 116, 170–175. [Google Scholar] [CrossRef]
- Udomrati, S.; Gohtani, S. Tapioca maltodextrin fatty acid ester as a potential stabilizer for Tween 80-stabilized oil-in-water emulsions. Food Hydrocoll. 2015, 44, 23–31. [Google Scholar] [CrossRef]
- Udomrati, S.; Gohtani, S. Enzymatic esterification of tapioca maltodextrin fatty acid ester. Carbohydr. Polym. 2014, 99, 379–384. [Google Scholar] [CrossRef] [PubMed]
- Udomrati, S.; Gohtani, S. Esterified xylo-oligosaccharides for stabilization of Tween 80-stabilized oil-in-water emulsions: Stabilization mechanism, rheological properties, and stability of emulsions. J. Sci. Food Agric. 2014, 94, 3241–3247. [Google Scholar] [CrossRef]
- Udomrati, S.; Khalid, N.; Gohtani, S.; Nakajima, M.; Neves, M.A.; Uemura, K.; Kobayashi, I. Effect of esterified oligosaccharides on the formation and stability of oil-in-water emulsions. Carbohydr. Polym. 2016, 143, 44–50. [Google Scholar] [CrossRef]
- Udomrati, S.; Gohtani, S. Enzymatic modification and characterization of xylo-oligosaccharide esters as potential emulsifiers. Int. Food Res. J. 2015, 22, 818–825. [Google Scholar]
- Gérard, D.; Méline, T.; Muzard, M.; Deleu, M.; Plantier-Royon, R.; Rémond, C. Enzymatically-synthesized xylo-oligosaccharides laurate esters as surfactants of interest. Carbohydr. Res. 2020, 495, 108090. [Google Scholar] [CrossRef]
- Bai, Y.; Shi, Y.C. Structure and preparation of octenyl succinic esters of granular starch, microporous starch and soluble maltodextrin. Carbohydr. Polym. 2011, 83, 520–527. [Google Scholar] [CrossRef]
- Park, N.; Walsh, M.K. Physical and emulsion stabilizing properties of maltodextrin fatty acid polymers produced by lipase-catalyzed reactions in ethanol. Carbohydr. Polym. 2019, 226, 115309. [Google Scholar] [CrossRef]
- Shogren, R.L.; Biswas, A.; Willett, J.L. Preparation and physical properties of maltodextrin stearates of low to high degree of substitution. Starch/Stärke 2010, 62, 333–340. [Google Scholar] [CrossRef]
- Udomrati, S.; Cheetangdee, N.; Gohtani, S.; Surojanametakul, V.; Klongdee, S. Emulsion stabilization mechanism of combination of esterified maltodextrin and Tween 80 in oil-in-water emulsions. Food Sci. Biotechnol. 2019, 29, 387–392. [Google Scholar]
- Chandra, P.; Enespa; Singh, R.; Arora, P.K. Microbial lipases and their industrial applications: A comprehensive review. Microb. Cell Fact. 2020, 19, 169. [Google Scholar]
- Janda, K.; Przybulewska, K. Ocena zdolności szczepów Thermomyces lanuginosus do biodegradacji oleju rzepakowego. Roczniki PZH. 2004, 3, 223–228. (In Polish) [Google Scholar]
- Stergiou, P.Y.; Foukis, A.; Filippou, M.; Koukouritaki, M.; Parapouli, M.; Theodorou, L.G.; Hatziloukas, E.; Afendra, A.; Pandey, A.; Papamichael, E.M. Advances in lipase-catalyzed esterification reactions. Biotechnol. Adv. 2013, 31, 1846–1859. [Google Scholar]
- Jaeger, J.E.; Dijkstra, B.W.; Reetz, M.T. Bacterial biocatalysis: Molecular biology, three dimensional structures and biotechnological applications of lipases. Annu. Rev. Microbiol. 1999, 53, 315–351. [Google Scholar] [PubMed]
- Antczak, T.; Graczyk, J. Lipazy: źródła, struktura i właściwości katalityczne. Biotechnologia 2002, 2, 130–145. (In Polish) [Google Scholar]
- Sharma, R.; Chisti, Y.; Banerjee, U.C. Production, purification, characterization and applications of lipase. Biotechnol. Adv. 2001, 19, 627–662. [Google Scholar]
- Illanes, A.; Fernandez-Lafuente, R.; Guisan, J.M.; Wilson, L. Heterogeneous Enzyme Kinetics. In Enzyme Biocatalysis. Principles and Applications, 3rd ed.; Stephen, A.M., Ed.; Springer: New York, NY, USA, 2008; pp. 155–197. [Google Scholar]
- Pantoa, T.; Shompoosang, S.; Ploypetchara, T.; Gohtani, S.; Udomrati, S. Surface-active properties and anti-microbial activities of esterified maltodextrins. Starch/Stärke 2019, 71, 1800265. [Google Scholar] [CrossRef]
- Park, N.; Walsh, M.K. Microbial inhibitory properties of maltodextrin fatty acid esters against food-related microorganisms. LWT-Food Sci. Technol. 2021, 147, 111664. [Google Scholar] [CrossRef]
- Zago, E.; Joly, N.; Chaveriat, L.; Lequart, V.; Martin, P. Enzymatic synthesis of amphiphilic carbohydrate esters: Influence of physicochemical and biochemical parameters. Biotechnol. Rep. 2021, 30, e00631. [Google Scholar]
- PN-ISO 660:1998; Vegetable and Animal Oils and Fats. Determination of Acid Number and Acidity. PKN: Warsaw, Poland, 1998.
- Roczkowska, M.; Siemion, P.; Kaczmarek, A. Właściwości fizykochemiczne produktów enzymatycznego utleniania skrobi. Chem. Environ. Biotechnol. 2013, 16, 85–96. (In Polish) [Google Scholar]
- Spectral Database for Organic Compounds, SDBS. Available online: https://sdbs.db.aist.go.jp/SearchResult.aspx (accessed on 16 December 2024).
- Kapusniak, J.; Siemion, P. Thermal reactions of starch with long-chain unsaturated fatty acids. Part 2. Linoleic acid. J. Food Eng. 2007, 78, 323–332. [Google Scholar]
- Fan, Y.; Lin, M.; Luo, A.; Chun, Z.; Luo, A. Characterization and antitumor activity of a polysaccharide from Sarcodia ceylonensis. Molecules 2014, 19, 10863–10876. [Google Scholar] [CrossRef] [PubMed]
- Junistia, L.; Sugih, A.K.; Manurung, R.; Picchioni, F.; Janssen, L.; Heeres, H.J. Synthesis of higher fatty acid starch esters using vinyl laurate and stearate as reactants. Starch/Stärke 2008, 60, 667–675. [Google Scholar]
- Mano, J.F.; Koniarova, D.; Reis, R.L. Thermal properties of thermoplastic starch/synthetic polymer blends with potential biomedical applicability. J. Mater. Sci. Mater. Med. 2003, 14, 127–135. [Google Scholar]
- Winkler, H.; Vorwerg, W.; Wetzel, H. Synthesis and properties of fatty acid starch esters. Carbohydr. Polym. 2013, 98, 208–216. [Google Scholar]
- Hong, T.; Yi, Y.J.; Ping, N.S.; Yong, X.M. Applications of infrared spectroscopy in polysaccharide structural analysis: Progress, challenge and perspective. Food Chem. 2021, 12, 100168. [Google Scholar]
- Fang, J.M.; Fowler, P.A.; Tomkinson, J.; Hill, C.A.S. The preparation and characterisation of a series of chemically modified potato starches. Carbohydr. Polym. 2002, 47, 245–252. [Google Scholar]
- van den Broek, L.A.M.; Boeriu, C.G. Enzymatic synthesis of oligo- and polysaccharide fatty acid esters. Carbohydr. Polym. 2013, 93, 65–72. [Google Scholar]
- Fang, J.M.; Fowler, P.A.; Sayers, C.; Williams, P.A. The chemical modification of a range of starches under aqueous reaction conditions. Carbohydr. Polym. 2004, 55, 283–289. [Google Scholar] [CrossRef]
- Shogren, R. Rapid preparation of starch esters by high temperature/pressure reaction. Carbohydr. Polym. 2003, 52, 319–326. [Google Scholar] [CrossRef]
- Singh, N.; Chawla, D.; Singh, J. Influence of acetic anhydride on physicochemical, morphological and thermal properties of corn and potato starch. Food Chem. 2004, 86, 601–608. [Google Scholar]
- Labidi, N.S.; Iddou, A. Adsorption of oleic acid on quarz/water interface. J. Saudi Chem. Soc. 2007, 11, 221–234. [Google Scholar]
- Premaratne, W.A.P.J.; Priyadarshana, W.M.G.I.; Gunawerdena, S.H.P.; De Alwis, A.A.P. Synthesis of nanosilica from paddy husk ash and their surface functionalization. J. Sci. Univ. Kelaniya. 2013, 8, 33–48. [Google Scholar]
- Hong, Y.S.; Cho, J.H.; Kim, N.R.; Lee, C.; Cheong, C.; Hong, K.S.; Lee, C.H. Artifacts in the measurement of water distribution in soybeans using MR imaging. Food Chem. 2009, 112, 267–272. [Google Scholar] [CrossRef]
- Sagis, L.M.C.; Boeriu, C.G.; Frissen, A.E.; Schols, H.A.; Wierenga, P.A. Highly stable foams from block oligomers synthesized by enzymatic reactions. Langmuir 2008, 24, 359–361. [Google Scholar]
- Luo, Z.; Zhou, Z. Homogeneous synthesis and characterization of starch acetates in ionic liquid without catalysts. Starch/Stärke 2012, 64, 37–44. [Google Scholar]
- Zarski, A.; Ptak, S.; Siemion, P.; Kapusniak, J. Esterification of potato starch by a biocatalysed reaction in an ionic liquid. Carbohydr. Polym. 2016, 137, 657–663. [Google Scholar] [CrossRef]
- Namazi, H.; Fathi, F.; Dadkhah, A. Hydrophobically modified starch using long-chain fatty acids for preparation of nanosized starch particles. Sci. Iran. 2011, 18, 439–445. [Google Scholar]
- Molenda, M.; Stasiak, M.; Horabik, J.; Fornal, J.; Blaszczak, W.; Ornowski, A. Microstructure and mechanical parameters of five types of starch. Pol. J. Food Nutr. Sci. 2006, 15, 161–168. [Google Scholar]
- Xie, W.; Wang, Y. Synthesis of high fatty acid starch esters with 1-butyl-3- methylimidazolium chloride as a reaction medium. Starch/Stärke 2011, 63, 190–197. [Google Scholar] [CrossRef]
- Rajan, A.; Sudha, J.; Abraham, T.E. Enzymatic modification of cassava starch by fungal lipase. Ind. Crop. Prod. 2008, 27, 50–59. [Google Scholar] [CrossRef]
- Bendjaballah, M.; Canselier, J.P.; Oumeddour, R. Optimization of Oil-in-Water Emulsion Stability: Experimental Design, Multiple Light Scattering, and Acoustic Attenuation Spectroscopy. J. Dispers. Sci. Technol. 2010, 31, 1260–1272. [Google Scholar] [CrossRef]
Disclaimer/Publisher’s Note: The statements, opinions and data contained in all publications are solely those of the individual author(s) and contributor(s) and not of MDPI and/or the editor(s). MDPI and/or the editor(s) disclaim responsibility for any injury to people or property resulting from any ideas, methods, instructions or products referred to in the content. |
© 2025 by the authors. Licensee MDPI, Basel, Switzerland. This article is an open access article distributed under the terms and conditions of the Creative Commons Attribution (CC BY) license (https://creativecommons.org/licenses/by/4.0/).